 Xolani B. Mbongozi1,2*
 Stuart D. R. Galloway2
 Angus Hunter2,3
 Charles B. Businge1Mirabel Nanjoh4Geoffrey A. B. Buga1
- 1Department of Obstetrics & Gynaecology, Faculty of Health Sciences, Walter Sisulu University, Mthatha, South Africa
- 2Faculty of Health Sciences & Sport, University of Stirling, Stirling, United Kingdom
- 3School of Science and Technology, Clifton Campus, Nottingham Trent University, Nottingham, United Kingdom
- 4Department of Public Health, Faculty of Health Sciences, Walter Sisulu University, Mthatha, South Africa
Objective: The main objective of the study was to evaluate the correlation and comparative use of peripheral blood pressure and central blood pressure (CBP) in identifying hypertension among pregnant women.
Methods: A cross-sectional study was conducted at Nelson Mandela Academic Hospital from December 2022 to April 2024, involving 270 inpatients diagnosed with hypertensive disorders of pregnancy (HDP) and 270 normotensive controls in their second and third trimesters. Blood pressure measurements were obtained using the Microlife WatchBP Office Central, both at enrolment and within 7 days postpartum. A linear regression equation and a receiver operating characteristic curve (ROC) analysis were used to determine the thresholds for normal, mild, and severe CBP.
Results: The ROC revealed that a central systolic blood pressure (cSBP) of 116 mm Hg or higher has a sensitivity of 78.5% and a specificity of 50.3% for diagnosing hypertension during pregnancy. Considering a normal peripheral diastolic pressure of less than 90 mm Hg, the upper limit of central diastolic blood pressure (cDBP) in normotensive controls was calculated to be 78 mm Hg. A significant positive correlation was found between peripheral systolic blood pressure (pSBP) and cSBP among normotensive and hypertensive women (p < 0.05). The median pSBP among patients with eclampsia with mild peripheral hypertension was 138.0 mmHg (IQR: 133.0–148.0) while the cSBP level in the same group was 145.0 mmHg (IQR: 140.0–150.0) mmHg. The overall median cSBP among women with eclampsia (n = 102) was 133.0 mmHg (IQR 120.0–143.0), and the median cDBP was 73.0 mmHg (IQR: 60.0–83.0), and these were significantly higher (p < 0.0001) than the median cSBP of 128.0 mmHg (IQR: 114.0–139) and cDBP of 71.0 mmHg (IQR: 61.0–81.0) among preeclamptic women.
Conclusion: This study established the threshold values for central hypertension as 116/78 mmHg, with severe central hypertension defined as 148/95 mmHg or more. It reinforces the positive correlation between peripheral and CBP in both normotensive and hypertensive populations. CBP may serve as a better parameter for evaluating hypertension, especially in eclampsia. Further research is warranted to confirm these findings and to explore their clinical implications.
Introduction
Elevated brachial blood pressure has traditionally been the main indicator for diagnosing hypertension, but with the increased availability of non-invasive central blood pressure (CBP) measuring devices, there is growing interest in using CBP for managing hypertension in non-pregnant and pregnant individuals.
The role of brachial blood pressure in the prediction of future cardiovascular structural damage, morbidity, and mortality among non-pregnant adult population is well-established in high-income countries (1), as well as in middle-income countries, such as China and Mexico (2, 3). Controlling brachial blood pressure can reduce the risk of cardiovascular death (4). However, peripheral hypertension does not necessarily correlate with maternal and perinatal outcomes, except for the increased risk of intracranial hemorrhage when there is severe peripheral hypertension (5). Numerous studies suggest that CBP is superior to peripheral blood pressure (PBP) in predicting cardiovascular disease among non-pregnant patients (6–9). The superiority of CBP is likely due to central pressures exhibiting lower variability and more accurately reflecting the tension levels on major target organs such as the heart, brain, and kidneys (10). CBP is defined as blood pressure readings taken from the aorta or common carotid arteries, primarily influenced by increased arterial stiffness and wave reflection (11). It represents the pressure against which the heart must pump to ensure blood flow throughout the body. Evidence indicates that preeclampsia (PE) is associated with increased CBP, pulse wave velocity, and arterial stiffness (12–14). It is known that the cerebrovascular complications of PE and eclampsia can occur in the presence of mild elevations of PBP and even in the absence of proteinuria (15, 16). Since the blood flow to the brain is controlled by the central aortic blood pressure, it is possible that under conditions when there is only mild elevation of the brachial blood pressure, the CBP may be much higher, thus accounting for the vasogenic oedema typical of eclampsia, justifying the need to know how the CBP behaves in patients with HDP and eclampsia.
To evaluate this hypothesis, it is essential to clearly define what constitutes mild and severe central hypertension. Current literature presents conflicting findings regarding the definition of central hypertension (17, 18). Notably, Cheng et al. have proposed a threshold CBP of 130/90 mmHg, which generally serves as a benchmark for central hypertension in non-pregnant women (11, 19). However, given the physiological changes that occur during pregnancy, it would be biased to apply findings from the non-pregnant population, especially those involving men (20). During pregnancy, physiological changes generally result in lower CBP readings compared with those in non-pregnant women and men (21). Therefore, it is necessary to establish the CBP threshold for diagnosing central hypertension in the pregnant population.
Objectives
The primary objective of this study was to evaluate the correlation and comparative use of PBP and CBP in identifying hypertension among pregnant women. The secondary objective was to determine the threshold values for central systolic blood pressure (cSBP) and central diastolic blood pressure (cDBP) for diagnosing mild and severe central hypertension in pregnancy.
Materials and methods
This was a cross-sectional study conducted between December 2022 and April 2024. We prospectively studied 270 inpatients diagnosed with hypertensive disorders of pregnancy (HDP) and 270 inpatient normotensive controls who were in their second and third trimesters of pregnancy. This study was conducted at the Nelson Mandela Academic Hospital, South Africa, in keeping with the principles laid down in the Helsinki Declaration (22). Walter Sisulu University and the Nelson Mandela Academic Hospital board approved this study (ethics reference number 035/2022), and informed consent was obtained from each participant before data collection.
The definitions of hypertension and HDP were based on the International Society for the Study of Hypertension in Pregnancy (23). Mild peripheral hypertension was defined as a pSBP of 110–159 mmHg and/or a pDBP of 90–109 mmHg. Severe peripheral hypertension was defined as a pSBP of 160 mmHg or higher and/or a pDBP of 110 mmHg or higher. The inclusion criteria for hypertensive patients were current hypertensive disease in pregnancy with a gestation period of ≥20 weeks. For controls, the inclusion criteria were a healthy normotensive singleton pregnancy in labor, those admitted for a repeat elective caesarean section at term, or women without hypertension presenting with particular conditions such as placenta previa, preterm premature rupture of membranes, or preterm labour. Participants were excluded if they were under 20 weeks pregnant or if they opted out of participation. Additionally, individuals with diabetes mellitus, cardiac disease, chronic renal disease, antiphospholipid syndrome, or other autoimmune diseases were also excluded from the study.
Data on the presence and type of HDP were collected from patient interviews and medical records using a standard data collection sheet. At enrolment and within 7 days after delivery, brachial and central systolic and diastolic blood pressures were measured using the Microlife WatchBP Office Central. Participants who were initially normotensive but later developed elevated blood pressure were reclassified as hypertensive, while those with gestational hypertension who later exhibited features of PE were reclassified as having PE. Before using the Microlife WatchBP Office central, the correct size of cuff was chosen and placed over the left or right upper arm so that the artery mark arrow points toward the lower arm. The cuff was wrapped around the arm, making sure that the lower edge of the cuff was approximately 2 cm above the elbow. The WatchBP Office Central device automatically measured both brachial and CBP, displaying the results on the screen once the measurement process was complete.
It is important to note that while the validity and reliability of the Microlife WatchBP Office Central have been established in the general population, its PBP measurement component lacked validation for pregnancy use (19) To address this deficiency, a pilot study was conducted involving three distinct groups of participants: 15 normotensive pregnant women, 15 women diagnosed with gestational hypertension, and 15 women with PE. Initially, PBP was measured using the pregnancy-validated Microlife WatchBP Home BT, followed by measurements with the Microlife WatchBP Office Central.
The validation process adhered to the guidelines set forth by the Association for the Advancement of Medical Instrumentation, the European Society of Hypertension, and the International Organization for Standardization (24, 25).
The results of the validation exercise demonstrated a strong correlation between the pregnancy-validated Microlife WatchBP Home BT and the Microlife WatchBP Office Central (refer to Tables 1, 2). Subsequently, the Microlife WatchBP Office Central was used to simultaneously measure both brachial blood pressure and CBP in each participant.
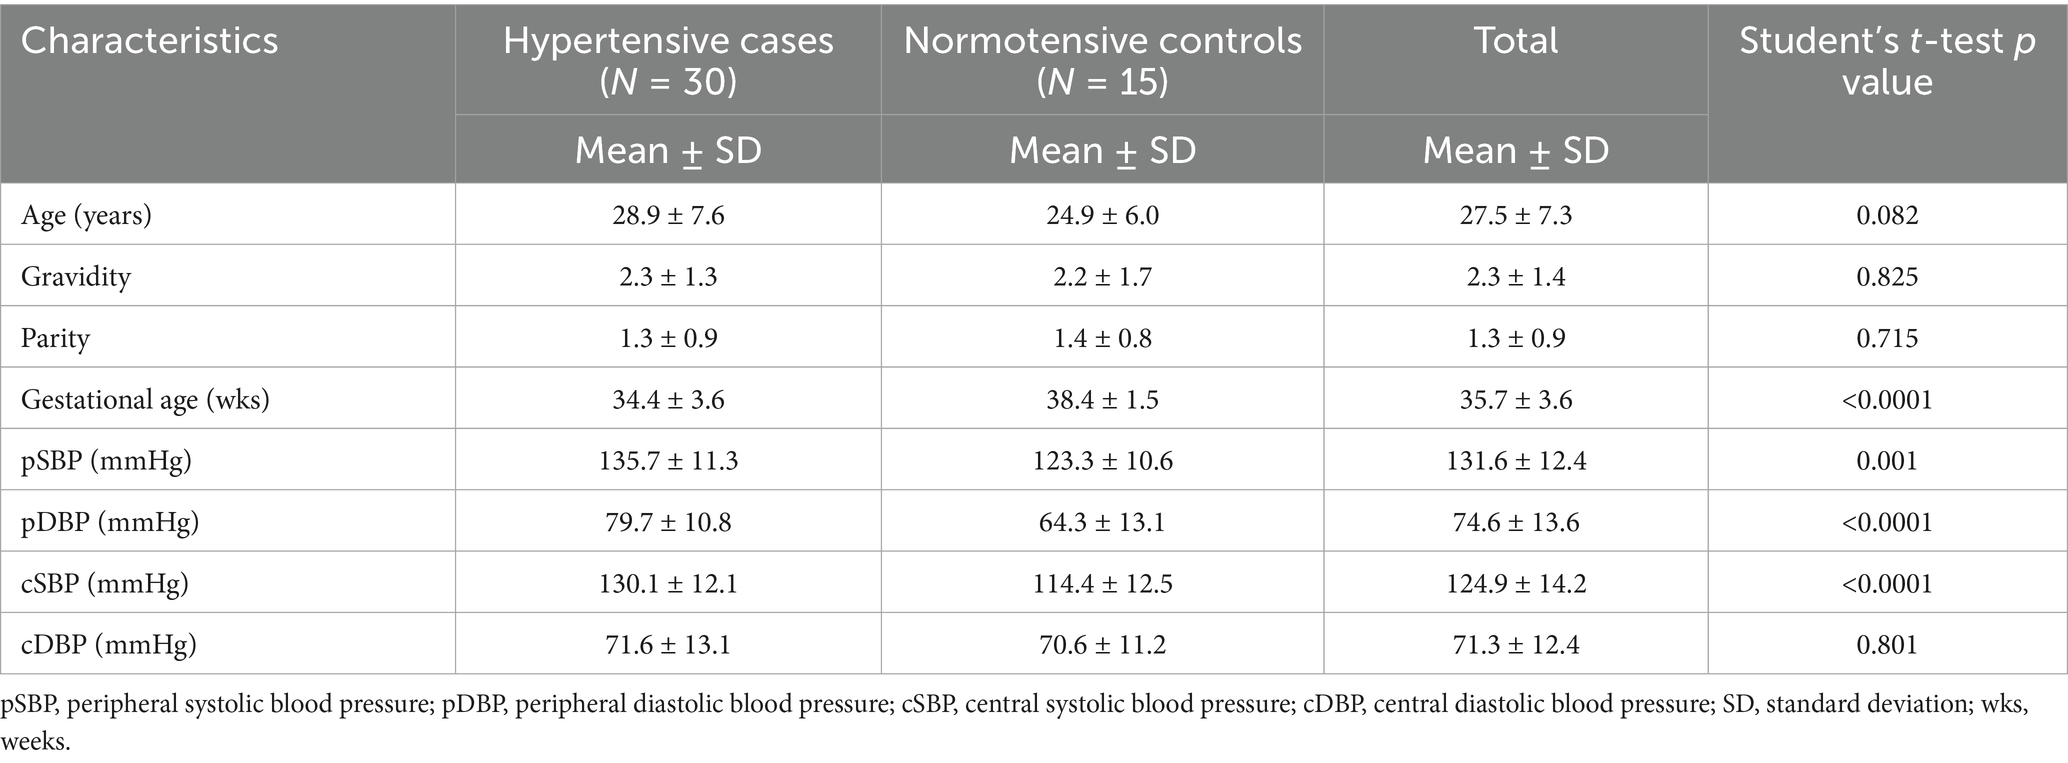
Table 1. Demographic characteristics of hypertensive cases and normotensive controls in the pilot study.
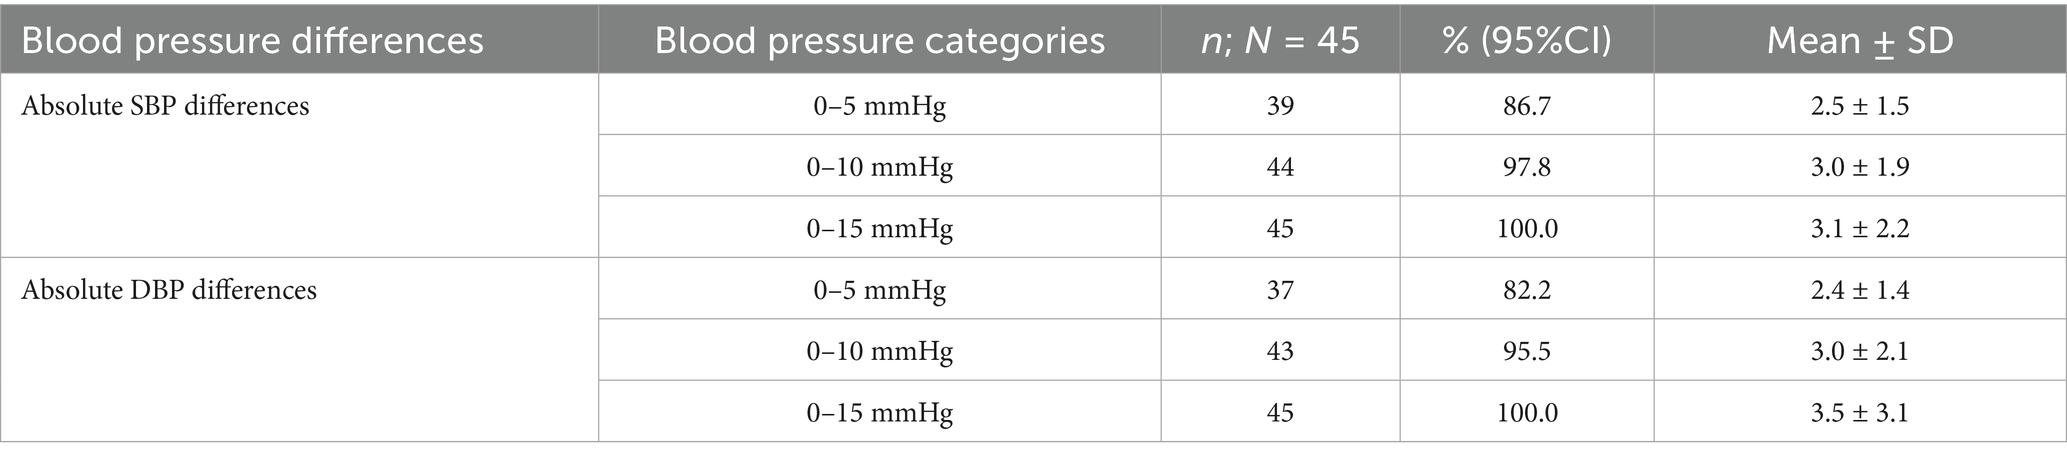
Table 2. The absolute differences in systolic and diastolic pressures, categorized as 0–5, 0–10, and 0–15 mmHg, between the two measuring devices.
Statistical analysis
Data were checked for completeness and consistency before being captured using the IBM SPSS STATISTICS software package version 29 for Windows (IBM Inc., Chicago IL, USA). Two approaches were used to try to establish the upper thresholds for normal and abnormal CBP to determine what constitutes central hypertension. The first approach used a linear regression equation for calculating the cSBP and cDBP from the pSBP and cDBP of normotensive controls, and a p-value of <0.05 was taken as significant. The second approach used the receiver operating curve analysis for calculating the upper threshold of normal cSBP and cDBP, together with sensitivity and specificity. The Youden’s J index, sensitivity, and specificity were calculated for each blood pressure reading. Cut-off points were determined based on the index, sensitivity, specificity, and clinical relevance. The outcome variable was HDP. The lower of these thresholds from these two approaches was then chosen to represent the threshold of normal and abnormal CBP.
For the rest of the study, blood pressure readings were interpreted using medians and percentiles (p25, p75) due to the skewed nature of the data. The Kruskal–Wallis H test and the Mann–Whitney U test were employed to assess the degree of association between the continuous variables. The Wilcoxon signed-rank test was applied to compare dependent variables. A p-value of less than 0.05 was considered statistically significant.
Results
General description and socio-demographic characteristics of the sample population
A total of 550 pregnant women were initially recruited for the study. However, 10 patients were excluded due to comorbidities like diabetes, chronic renal failure, and cardiac disease (Figure 1). Ultimately, 540 pregnant women were enrolled in the study, with 270 diagnosed with HDP and 270 who were normotensive controls. Of the 270 women with HDP, 143 (53%; 95% CI: 47–58.9%) had PE, 102 (37.8%; 95% CI: 32.1–43.7%) had eclampsia, 14 (5.2%; 95% CI: 3.0–8.3%) had chronic hypertension, and 11 (4.1%; 95% CI: 2.2–6.9%) had gestational hypertension. Notably, two of the eleven patients with gestational hypertension initially had normal blood pressure and were classified as controls at the time of recruitment, but subsequently developed hypertension, resulting in their reclassification. Additionally, four of the 143 preeclamptic patients initially presented with gestational hypertension but later exhibited significant proteinuria, resulting in their reclassification as PE. Of the 143 women with PE, 75 (52.4%; 95% CI: 44.3–60.5%) had PE with severe features (this number excludes women with eclampsia who form their own group) and 68 (47.6%; 95% CI: 39.5–55.7%) had PE without severe features.
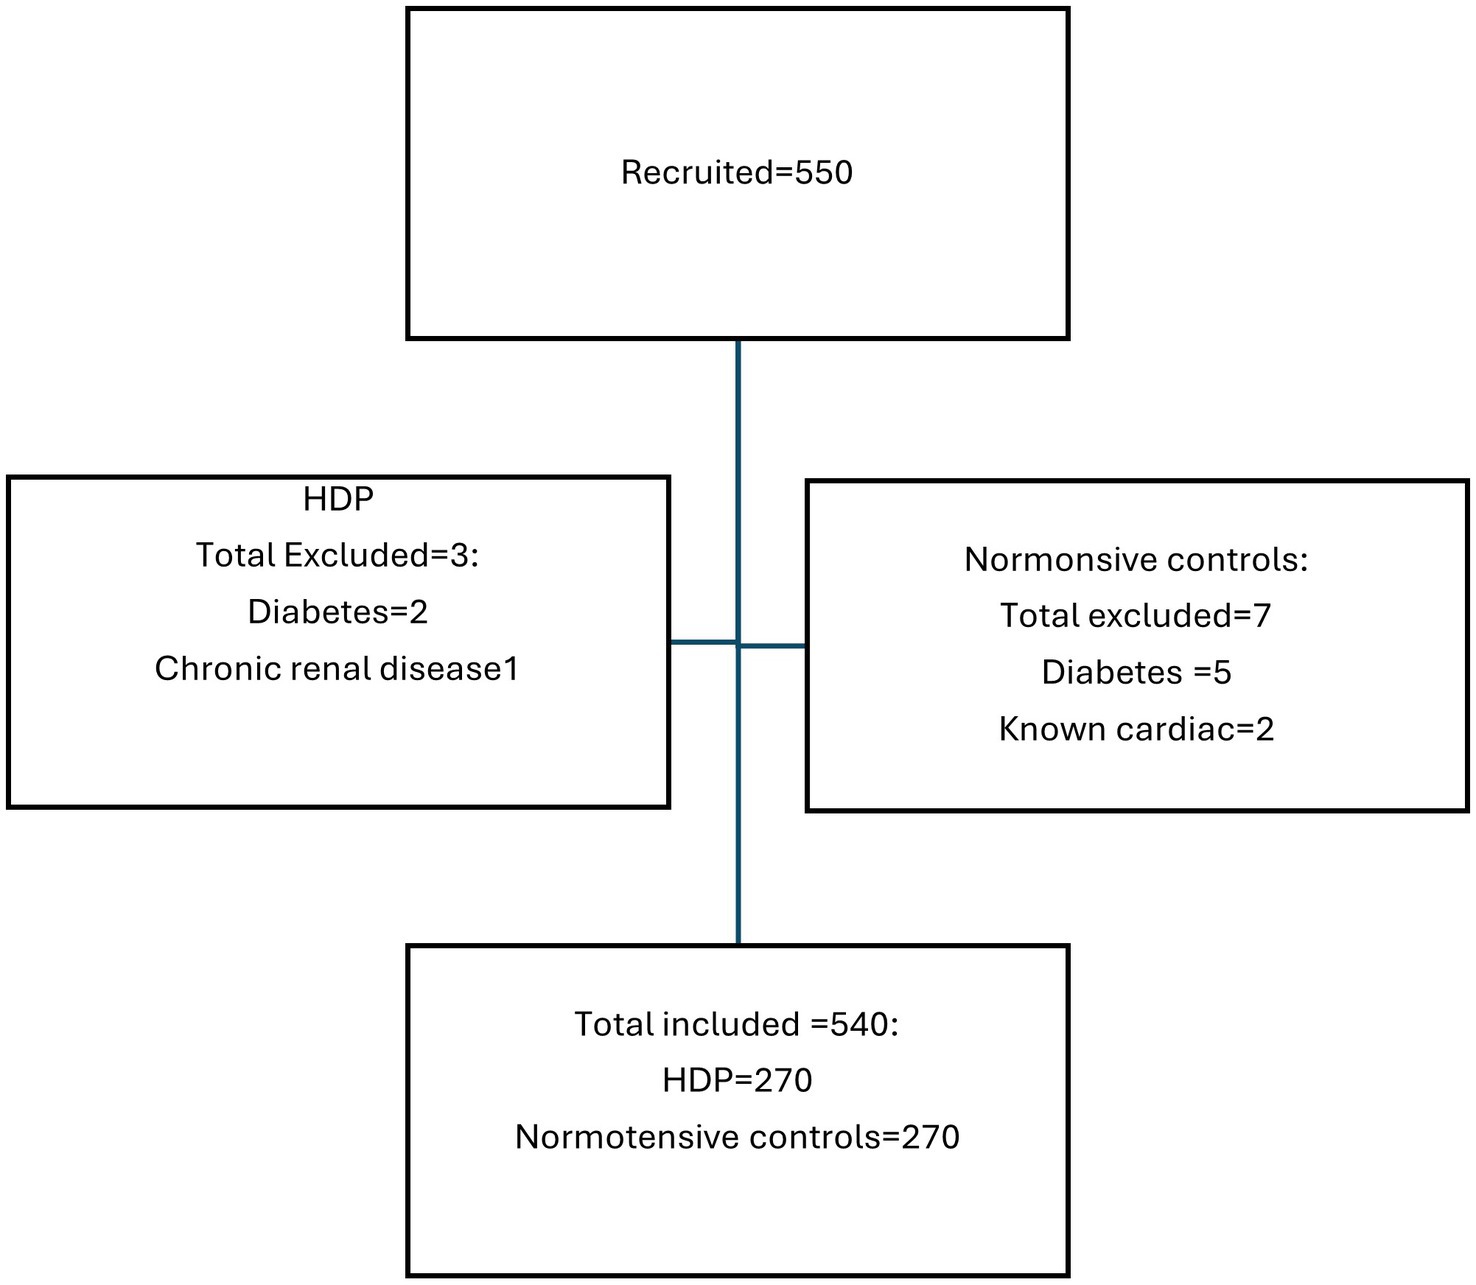
Figure 1. Flowchart of participant inclusion.
The non-hypertensive controls had a median age of 28 (IQR: 24.0–33.0) years, which was significantly older than the hypertensive cases, whose median age was 25 (IQR: 20.0–32.0) years (p < 0.0001) (Table 3). Most participants (63.1%, n = 341) were aged between 20 and 34 years, while a smaller group (17.2%, n = 93) was under 20 years. Almost all participants (99.4%, n = 537) were of African descent, with the remainder being mixed race (0.6%, n = 3). In terms of marital status, over three-quarters (77.2%) were single and slightly more than a quarter (22.6%, n = 122) were married.
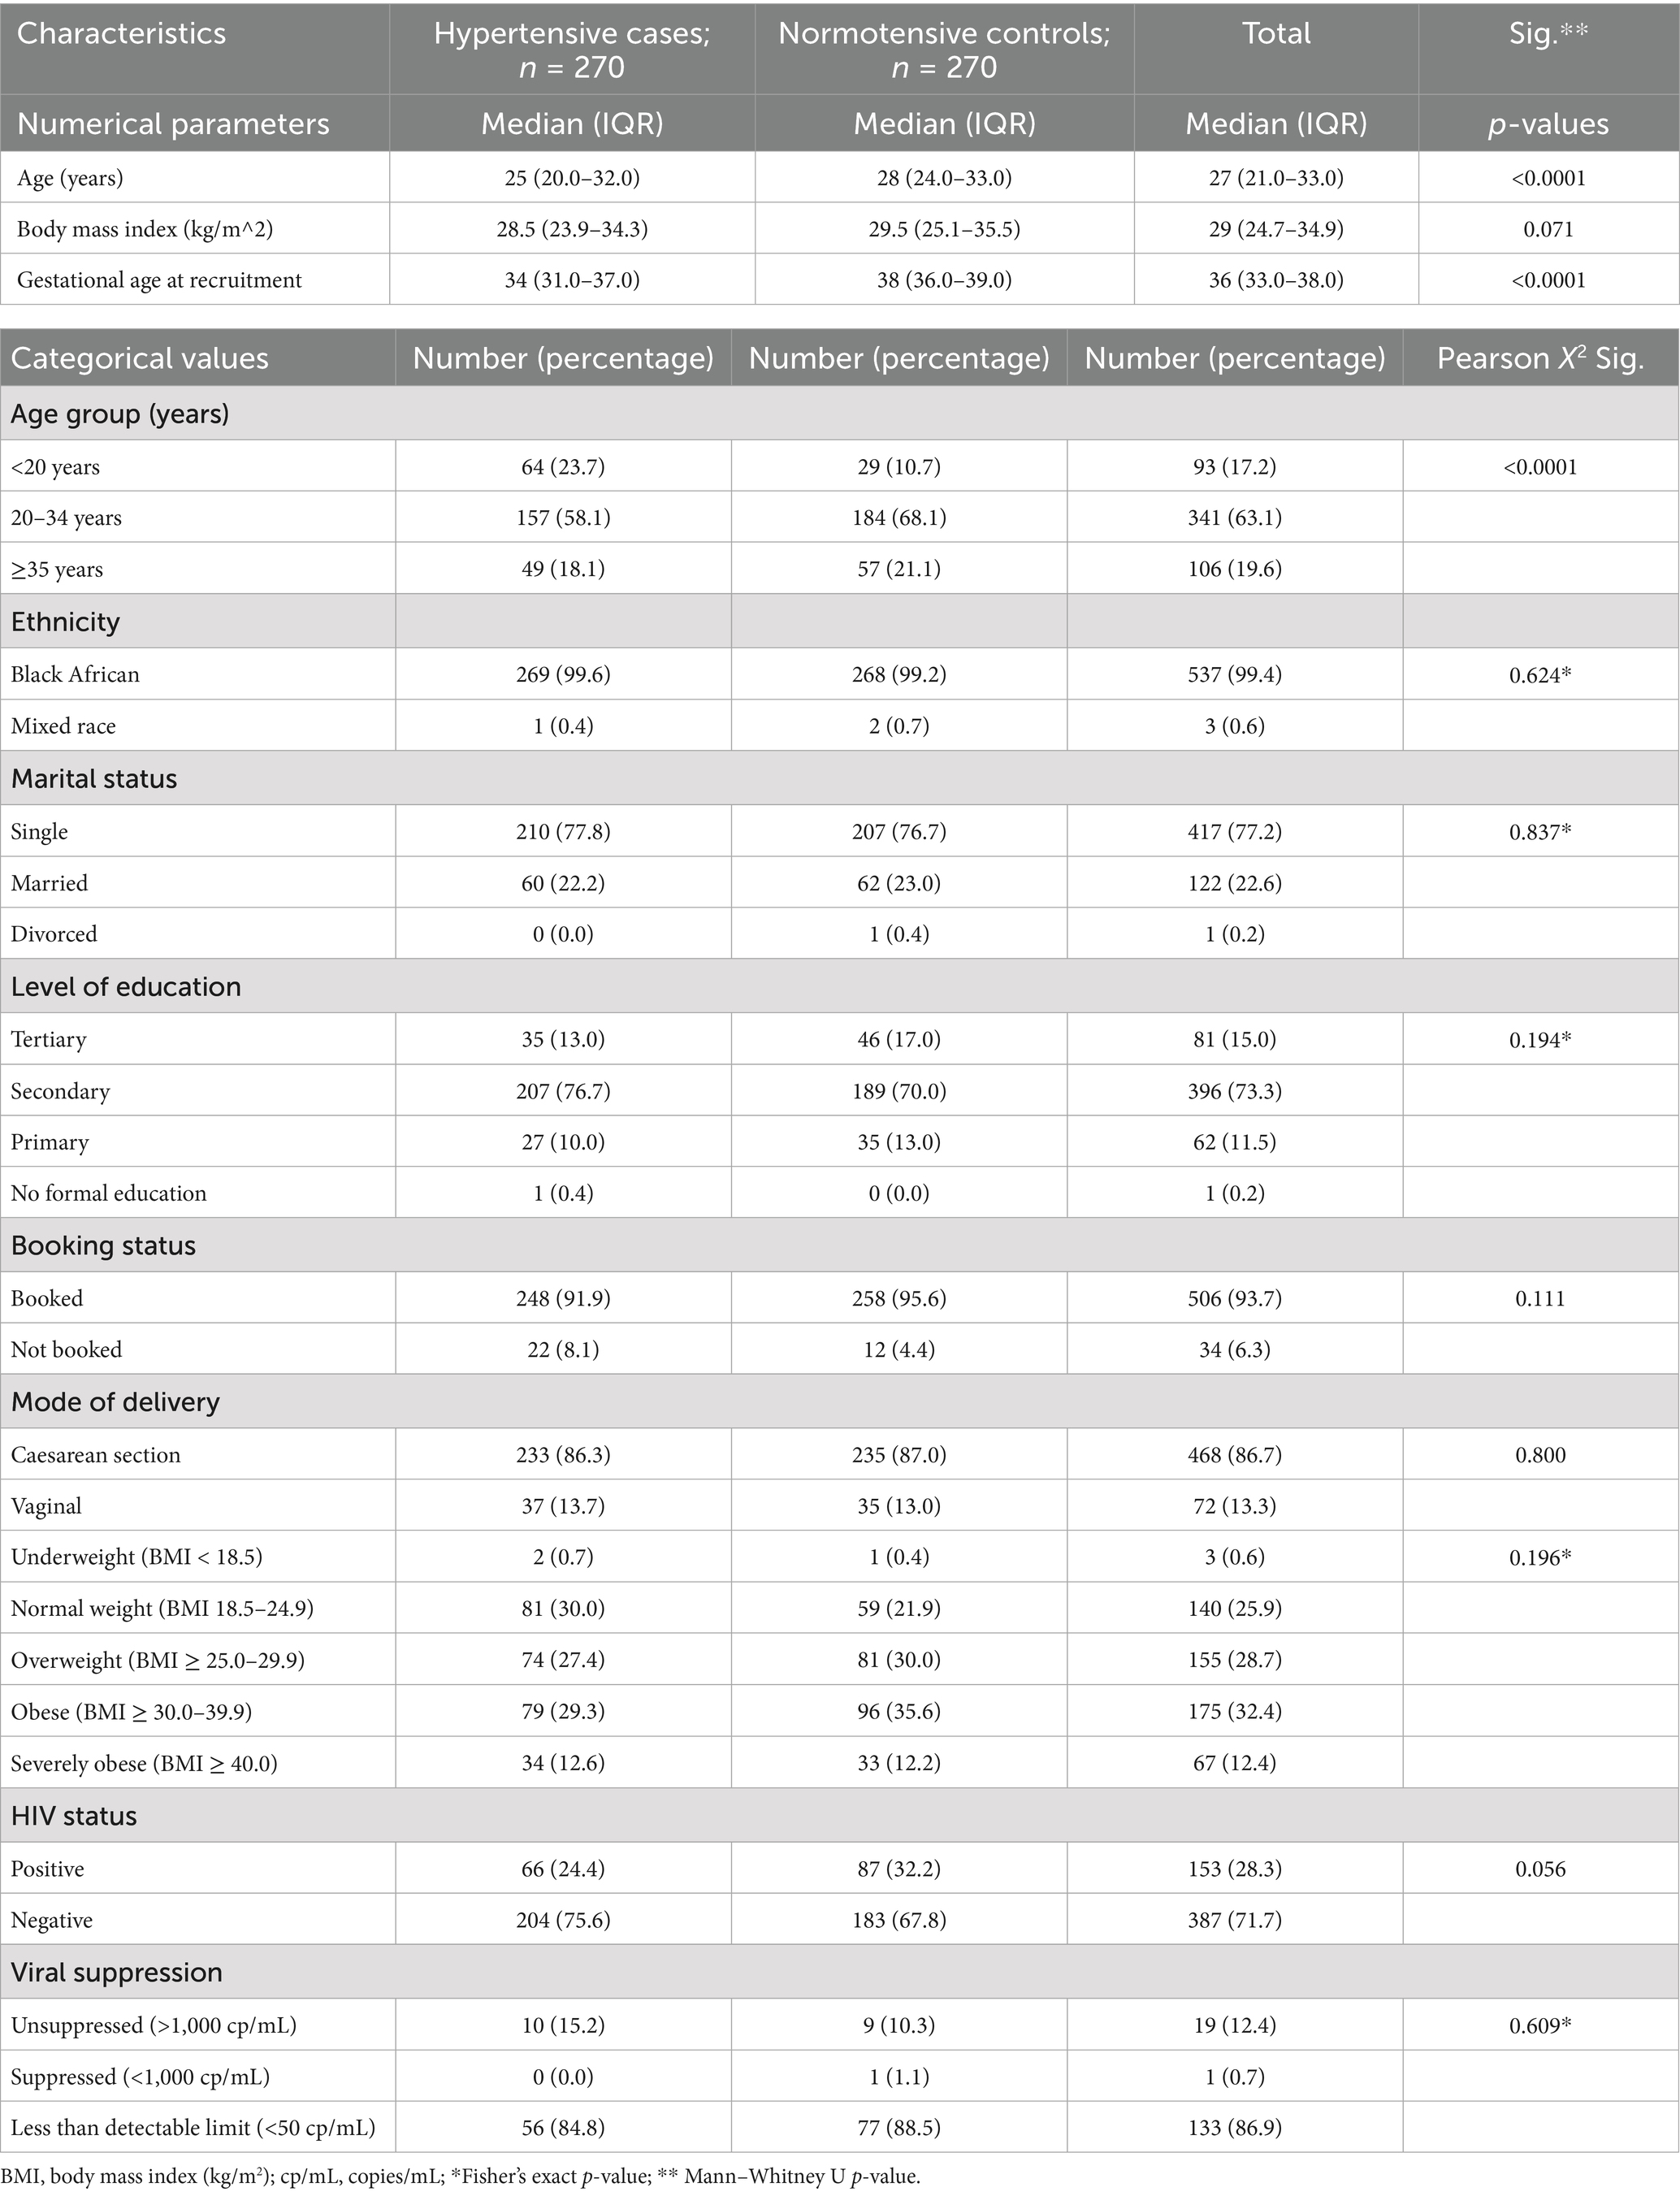
Table 3. General characteristics of hypertensives cases and normotensive controls in the main study.
Most participants (93.7%, n = 434) attended antenatal clinics, while 34 (6.3%) did not. Statistically, antenatal clinic attendance was similar between the hypertensive and non-hypertensive groups (p > 0.05). The median gestational age at enrolment in the study was 36 (IQR: 33.0–38.0) weeks, with the non-hypertensive controls having a significantly higher median gestational age of 38 (IQR 36.0–39.0) weeks compared with the hypertensive cases at 34 weeks (IQR 31.0–37.0; p < 0.0001).
A significant majority of participants (86.7%, n = 468) delivered via caesarean section, while the remaining 13.3% (n = 72) had vaginal births. No significant differences in delivery methods were found between the two groups.
In terms of body weight classification, nearly one-third of the women (32.4%, n = 175; 95% CI = 28.6–36.4%) were classified as obese, while 12.4% (n = 67; 95% CI = 9.8–15.4%) were severely obese, and 0.6% (n = 3; 95% CI = 0.2–1.5%) were underweight.
Overall, 28.3% (n = 153; 95% CI = 24.7–32.2%) of the women in the study were HIV-positive, while the remainder tested negative. There was no significant difference in HIV prevalence between women with HDP and the normotensive controls (p > 0.05). Most of the positive for HIV women had viral loads below detectable limits, with only 12.4% (n = 19; 95% CI = 7.9–12.4%) not achieving viral suppression. Moreover, no significant differences were observed between HIV-positive women with HDP and those who were HIV-positive but normotensive regarding viral suppression (p > 0.05).
Establishment of cSBP and cDBP thresholds for diagnosis of central hypertension
To establish the upper thresholds for normal and abnormal CBP, a linear regression equation and the receiver operating curve analysis were used. The lower of these thresholds was then chosen to represent the threshold of normal and abnormal CBP. Consequently, the upper threshold of normal cSBP was found to be <116 mmHg and that of the normal cDBP was <78 mmHg (Table 4 and Figure 2). CBPs above these thresholds signified central hypertension.
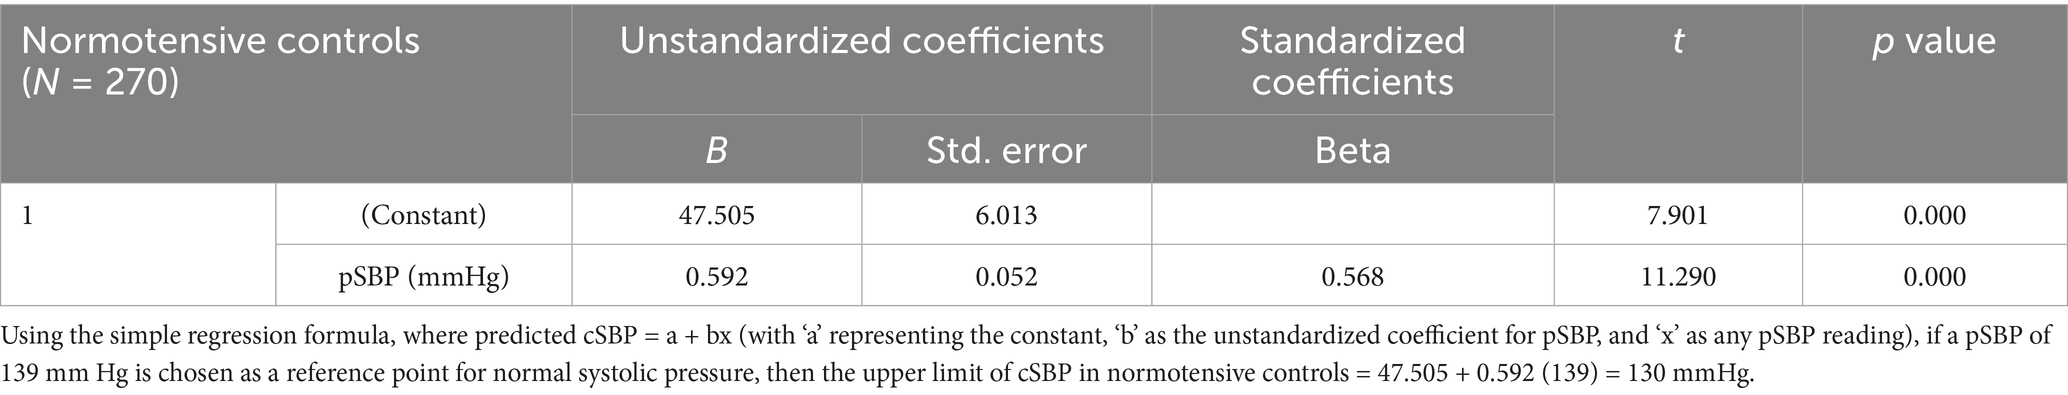
Table 4. Establishment of cSBP threshold in normotensives.
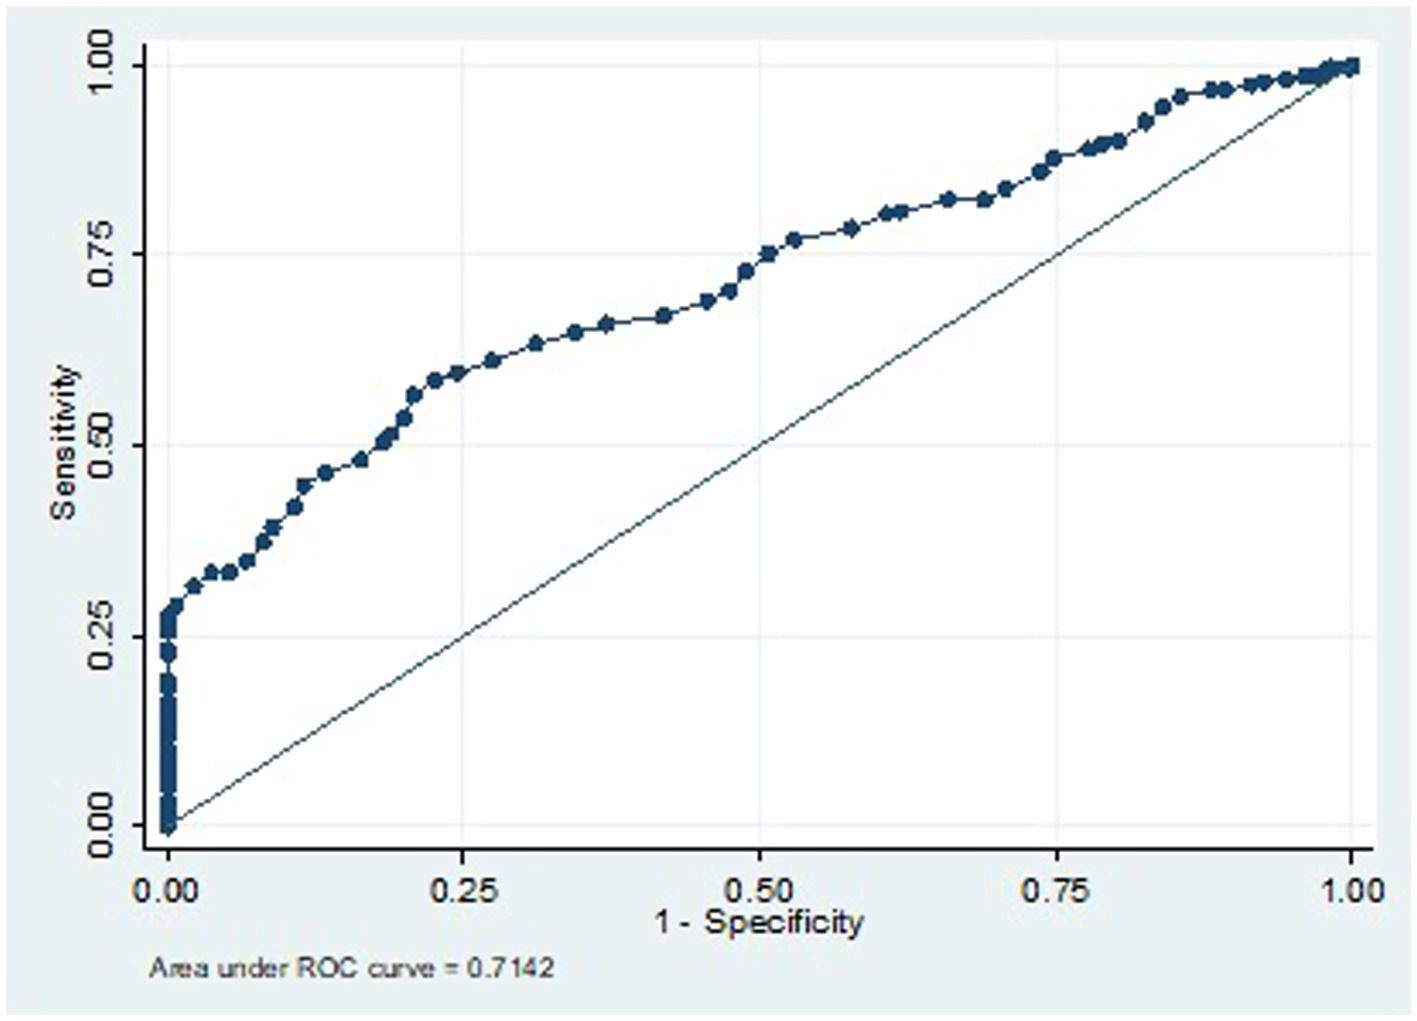
Figure 2. ROC for cSBP cut-off for prediction of central hypertension in women with HDP if 116 mmHg is chosen.
ROC analysis for defining cSBP thresholds for diagnosis of central hypertension during pregnancy
To predict the diagnosis of central hypertension during pregnancy, the ROC analysis results indicate that a cSBP of 116 mm Hg or higher has a sensitivity of 78.5% and a specificity of 50.3%. The cSBp values utilized as predictive variables for the ROC curve were derived exclusively from the HDP group. This model demonstrated a moderate discriminatory ability, with an area under the curve (AUC) of 0.7384 (Figures 2, 3).
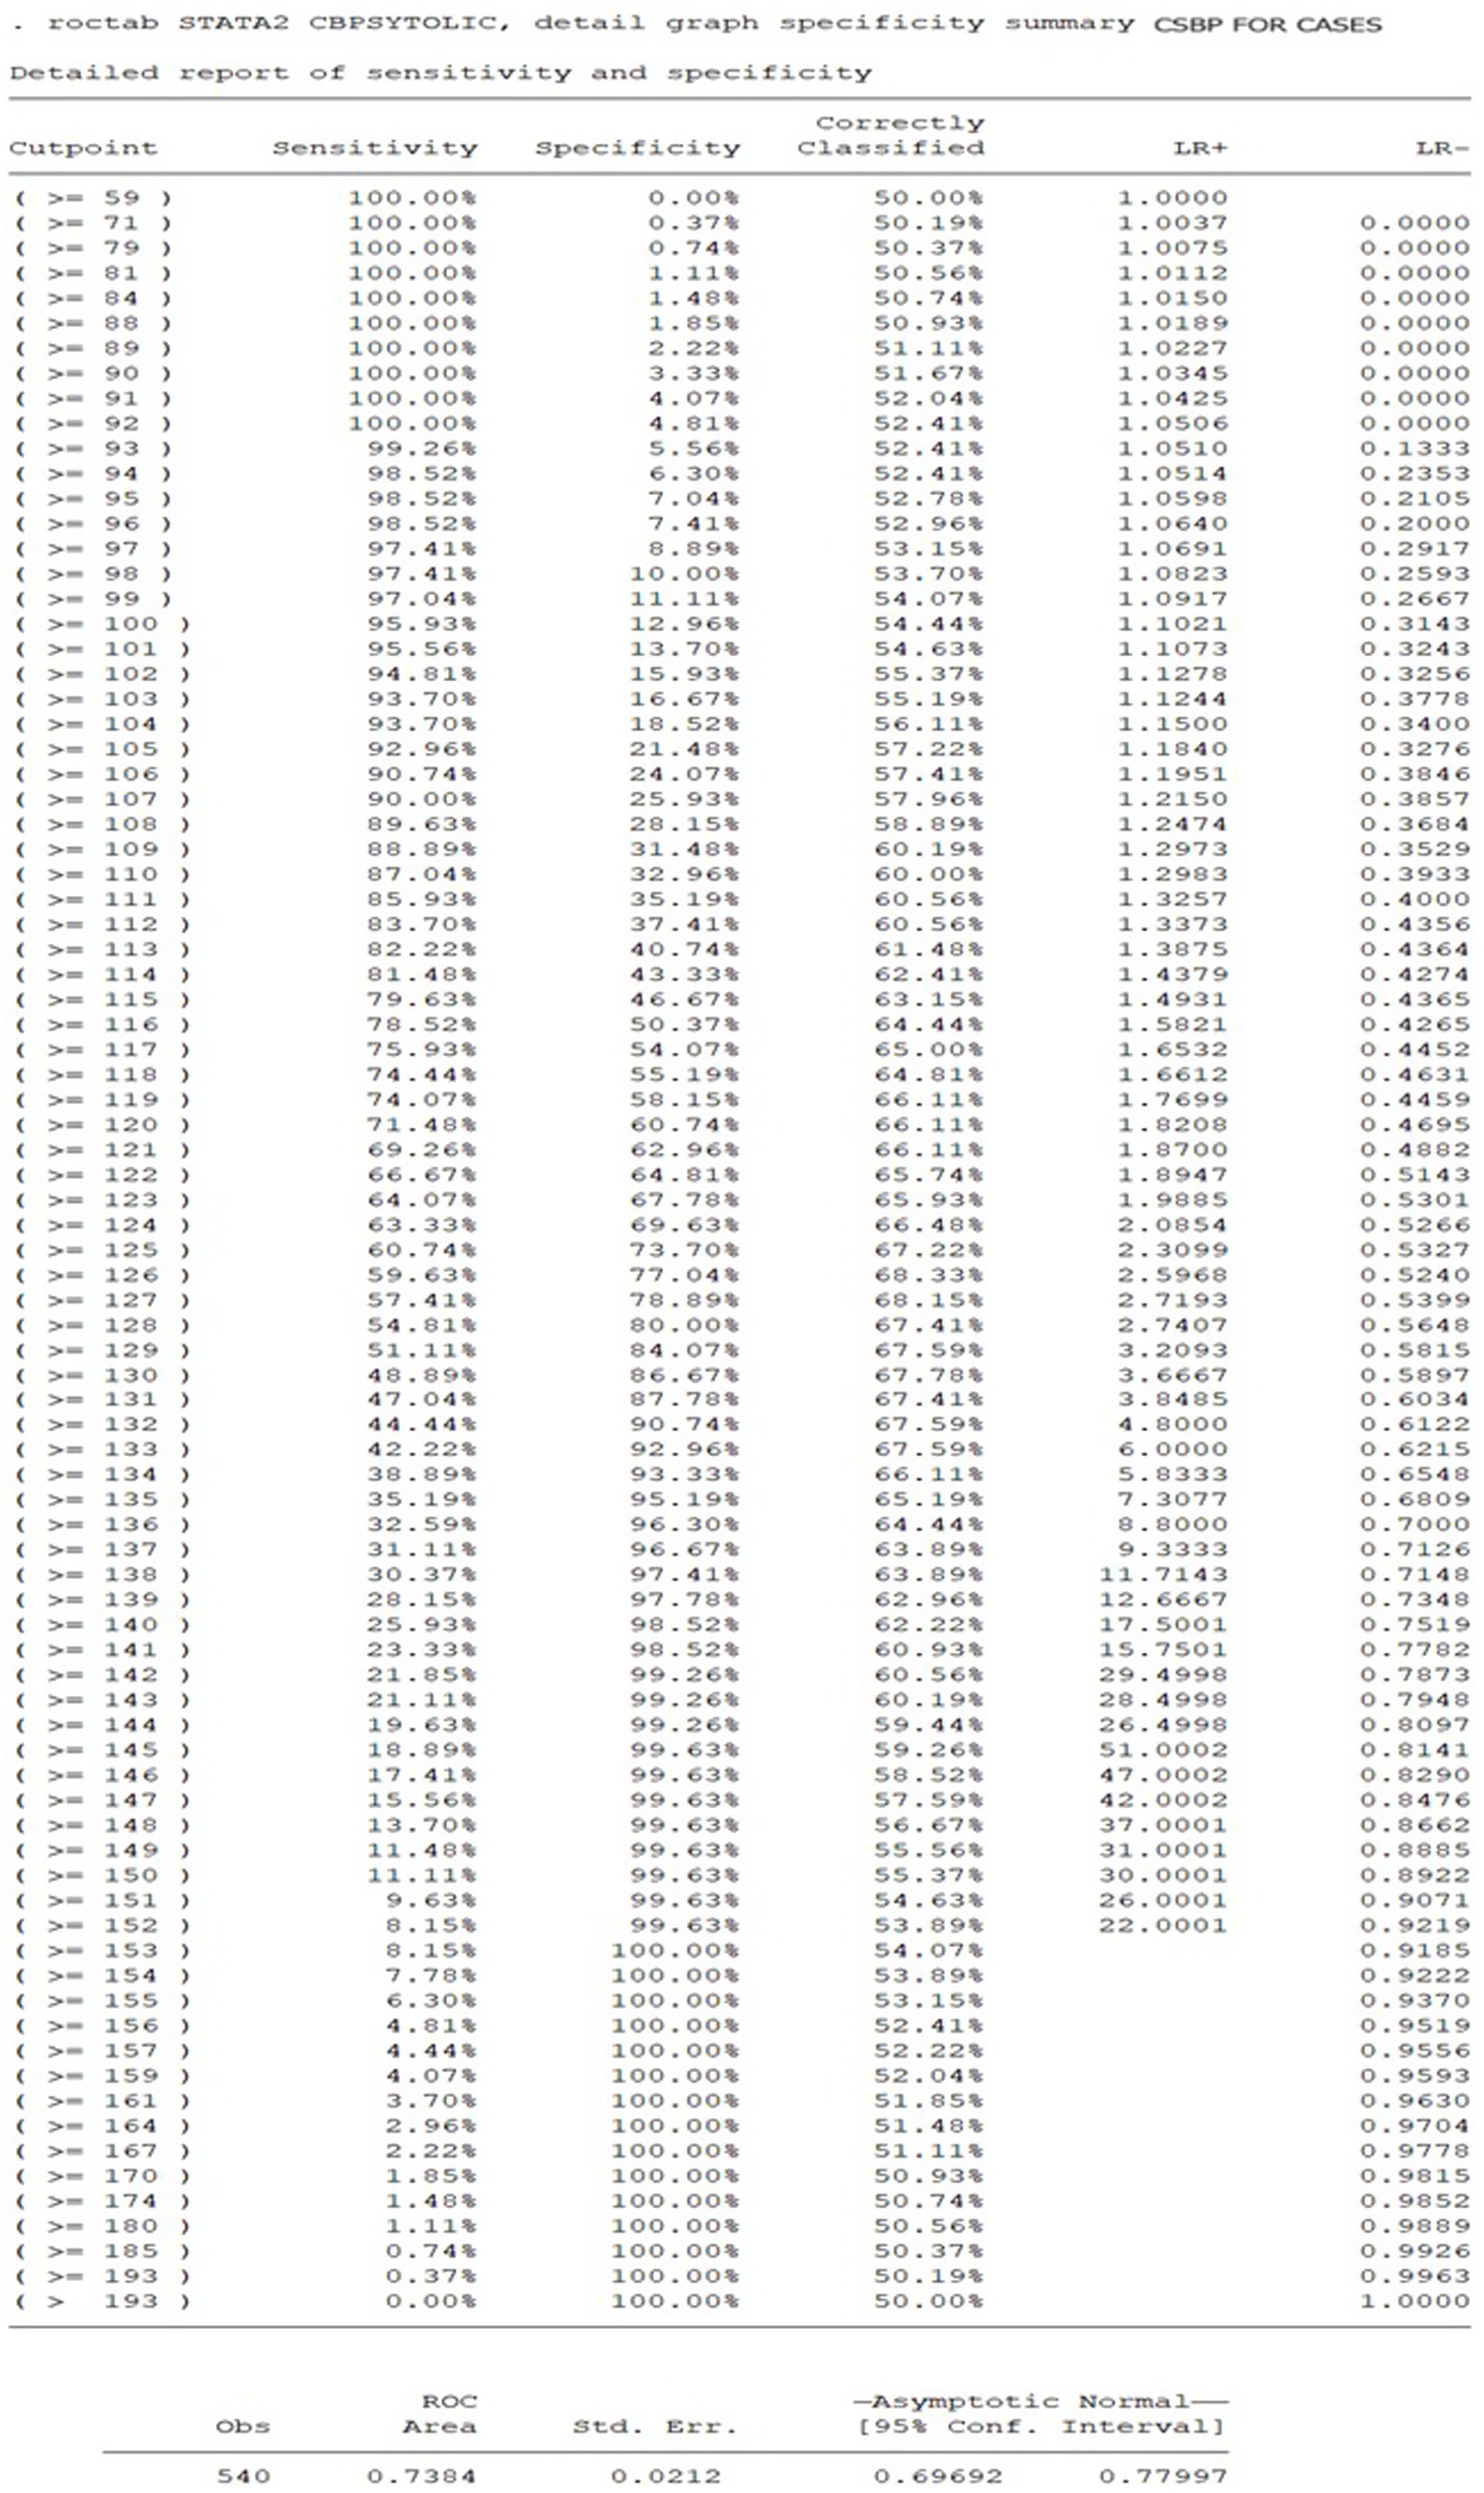
Figure 3. Sensitivity and specificity of cSBP cut-offs for prediction of central hypertension in women with HDP.
Linear regression equation for defining the cSBP and cDBP threshold from PBP
Based on a normal pSBP of <140 mmHg and a diastolic pressure of <90 mmHg, the upper limit of cSBP in normotensive controls was calculated to be 130 mmHg, while the upper limit of cDBP was calculated to be 78 mmHg (see Tables 4, 5) (23).
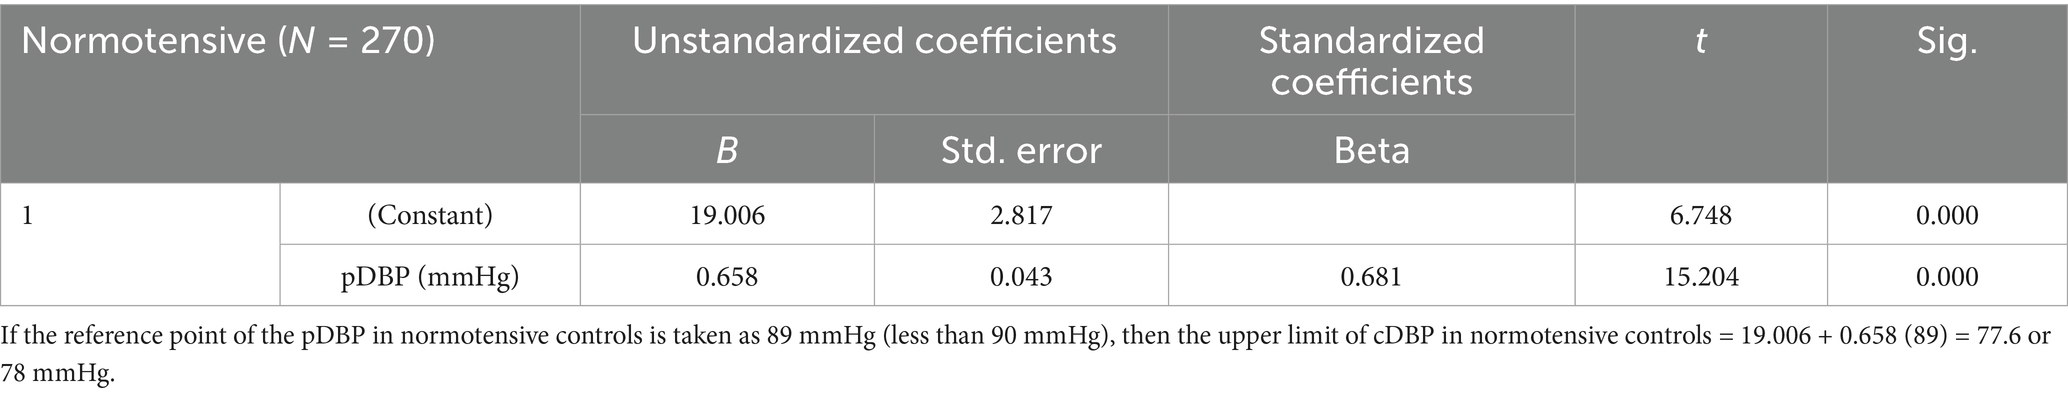
Table 5. Establishment of cDBP threshold in normotensives.
Establishment of thresholds for severe central hypertension
Linear regression equation was used to calculate the thresholds for severe central hypertension from the thresholds of severe PBP, defined as a pSBP of ≥160 mmHg, and/or pDBP of ≥110 mmHg, among women with HDP who were identified to have severe peripheral hypertension (23). The thresholds for severe central hypertension were found to be a cSBP of ≥148 mmHg and/or a cDBP of ≥95 mmHg (see Tables 6, 7).
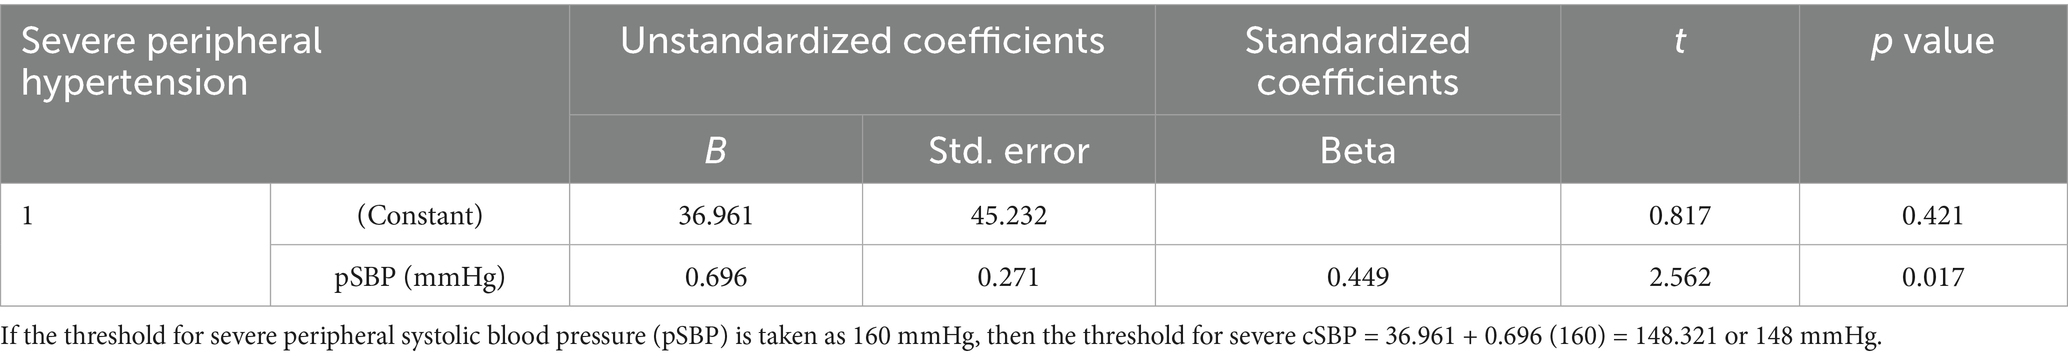
Table 6. Establishment of cSBP thresholds for diagnosis of severe central hypertension based on pSBP of ≥160 mmHg in women with severe peripheral hypertension.
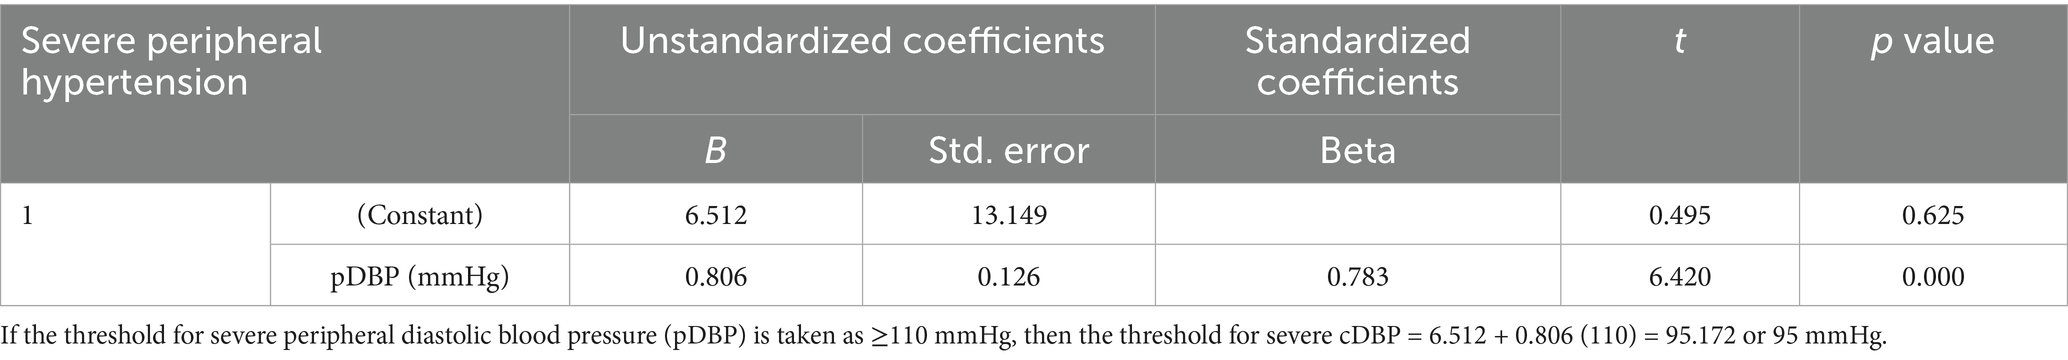
Table 7. Defining cDBP cut-off for severe central hypertension based on pDBP of ≥110 mmHg in women with severe peripheral hypertension.
Correlation of median pSBP, cSBP, pDBP, and cDBP as measured using microlife WatchBP office central among women with HDP and normotensive controls
Among the 270 normotensive controls, the median pSBP was 114.0 (IQR: 104.0–124.0) mmHg, and the median cSBP was 115.0 (IQR: 106.0–125.0) mmHg (see Figures 4, 5). There was a strong positive relationship between the two measurements (Spearman rank correlation coefficient = 0.583; p < 0.0001) as shown in Table 8. The linear regression analysis revealed a positive correlation between pSBP and cSBP, with changes in pSBP being associated with a shift in the cSBP (B = 0.592; p < 0.0001). The difference between median pSBP and cSBP was 1.0 mmHg, but this was not statistically significant (Wilcoxon Signed Rank p = 0.122).
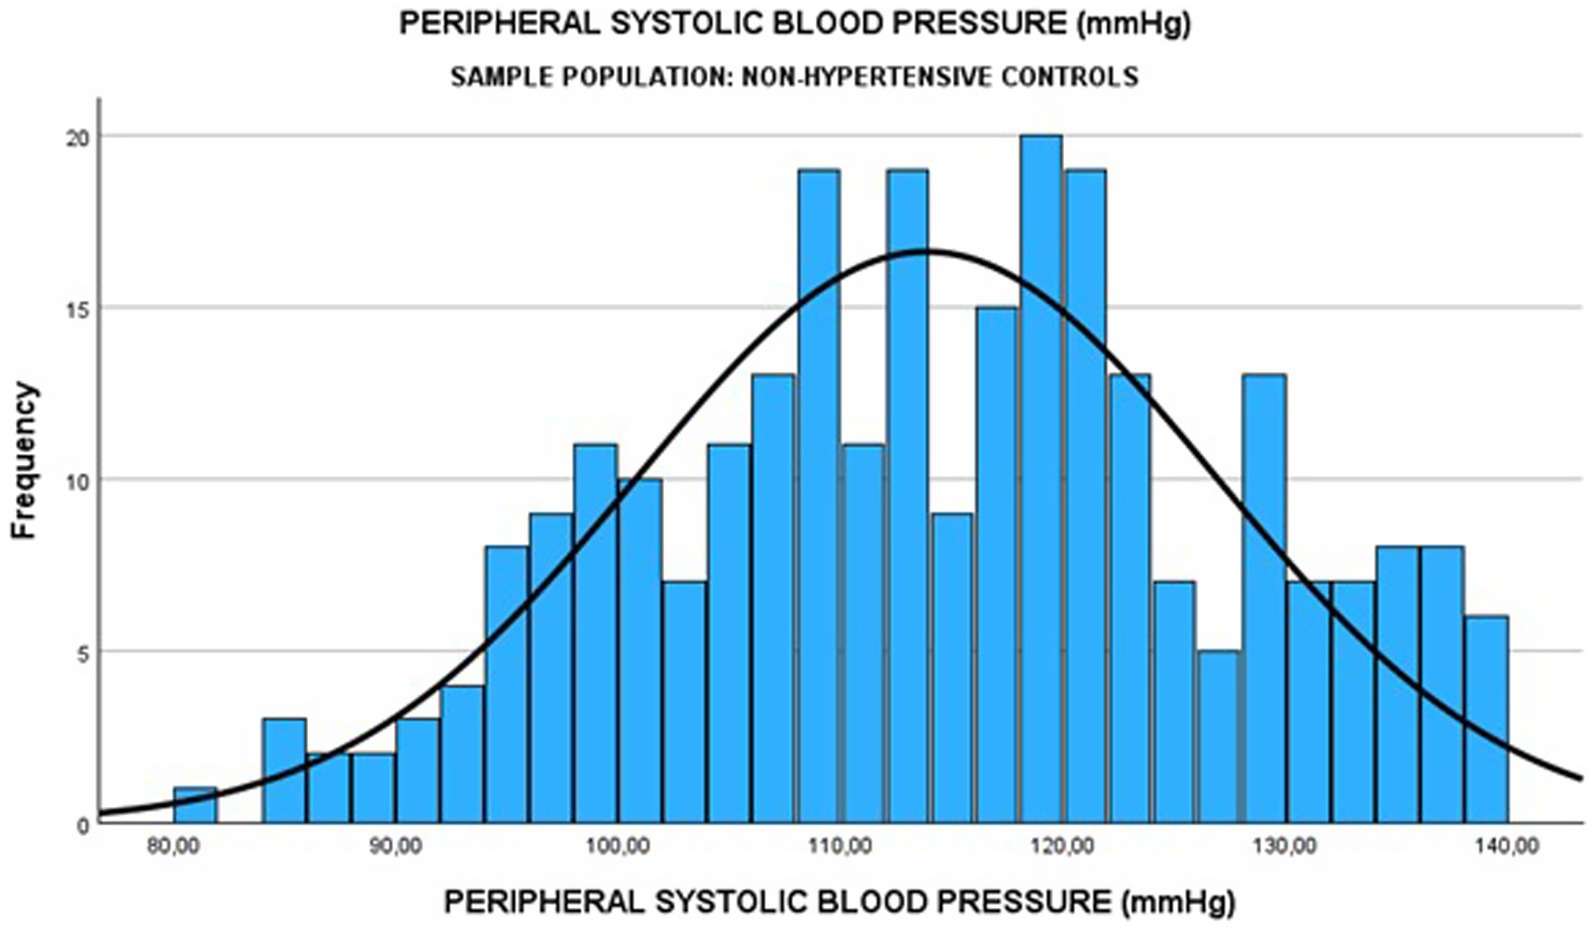
Figure 4. Median pSBP among normotensive pregnant women.
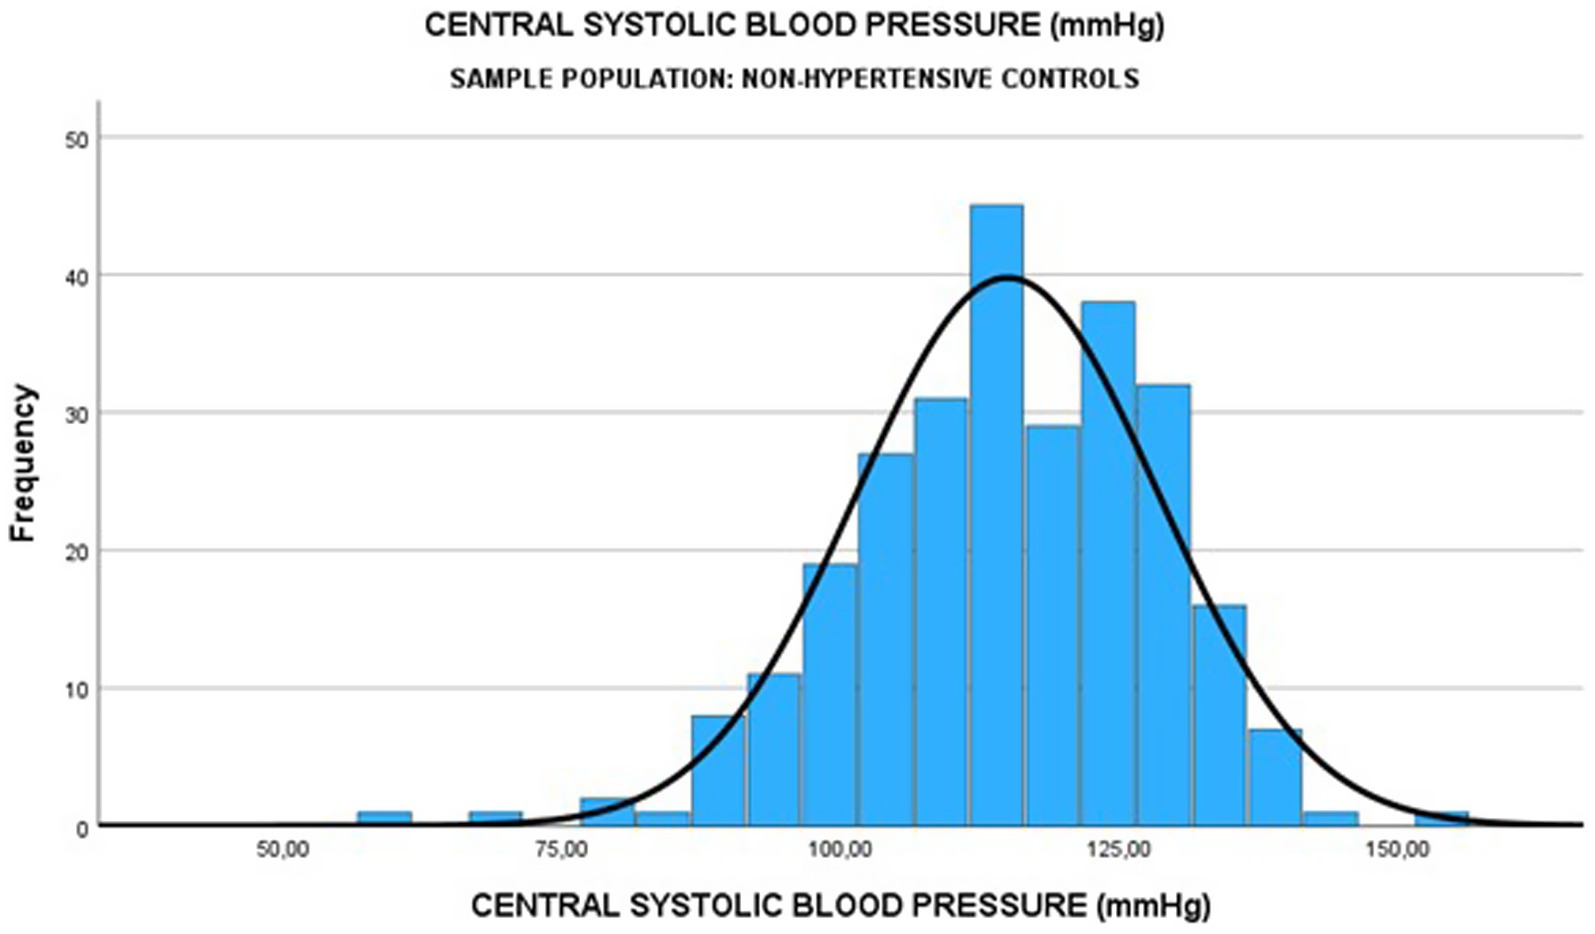
Figure 5. Median cSBP among normotensive pregnant women.
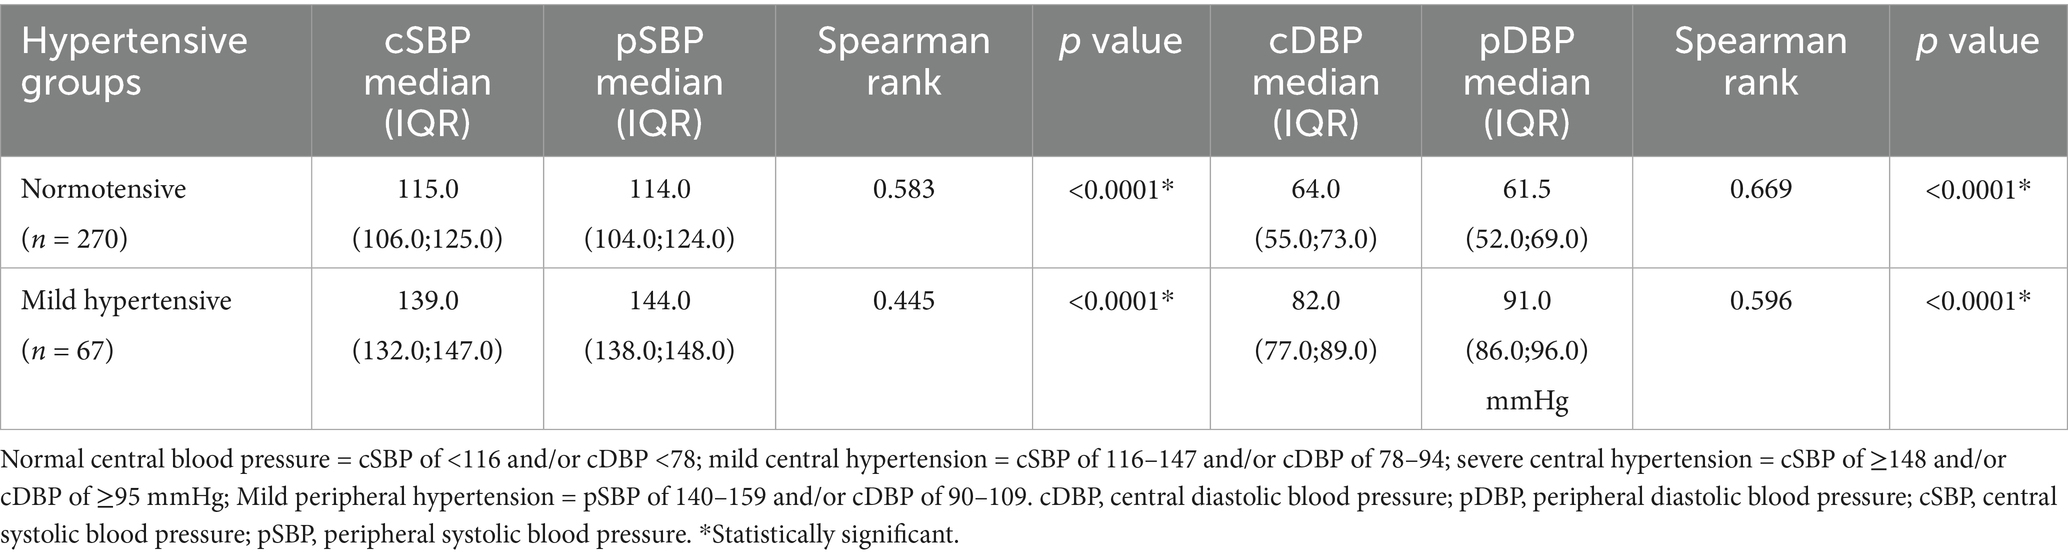
Table 8. Comparison of median pSBP and pDBP with median cSBP and cDBP among women with normal and mild peripheral hypertension as measured using Microlife WatchBP Office Central.
Additionally, the median cSBP [110 (IQR: 101.0–120.0) mmHg] was less than the median pSBP [120.0 (IQR: 112.0–129.0) mmHg] in 119 participants (44%), the median cSBP [119.5 (111.0–128.0) mmHg] was greater than the median pSBP [109.0 (100.0–118.0) mmHg] in 146 participants (54%), and in 5 participants (1.9%), they were equal. The observed difference was not statistically significant (z based on positive ranks = −1.546; Wilcoxon Signed Rank p = 0.122).
Among the 270 normotensive controls, median cDBP was 64.0 (IQR: 55.0–73.0) mmHg, and the median pDBP was 61.5 (IQR: 52.0–69.0) mmHg. There was a strong positive correlation between the two measurements (Spearman rank correlation of 0.669, p < 0.0001) as shown in Table 8. Linear regression analysis also revealed that there was a positive correlation between cDBP and pDBP, with changes in pDBP being significantly associated with a shift in the cDBP (B = 0.658; p < 0.0001). The difference between median pDBP and cDBP was 2.5 mmHg, which was statistically significant (Wilcoxon Signed Rank p < 0.0001).
Additionally, cDBP [58.0 (50.0–66.0) mmHg] was less than pDBP [68.0 (60.0–70.0) mmHg] in 159/270 participants (59%), cDBP [64.0 (IQR: 57.0–73.0) mmHg] was greater than pDBP [57.0 (IQR: 49.0–65.0) mmHg] in 98 participants (36.3%) and was equal in only 13 participants (4.8%). The observed difference was statistically significant (z based on negative ranks = −4.342; Wilcoxon Signed Rank p < 0.0001).
Comparison of median pSBP and median pDBP with cSBP and cDBP among women with mild peripheral hypertension as measured using microlife WatchBP office central
Among 95 women with mild peripheral hypertension, the median pSBP was 144.0(138.0–148.0) mmHg, while the median cSBP was 139.0 (132.0–147.0) mmHg as shown in Table 8. There was a strong positive relationship between the two measurements (Spearman rank r = 0.445; p < 0.0001). Linear regression analysis revealed a strong positive correlation between pSBP and cSBP, with changes in the pSBP being significantly associated with a shift in the cSBP (B = 0.631; p < 0.0001). The difference between the median pSBP and median cSBP was 1.0 mmHg, and this was statistically significant (Wilcoxon Signed Rank p < 0.0001).
Additionally, among the same 95 women with mild peripheral hypertension, the median cSBP was less than the median pSBP in 69 participants, and the median cSBP was greater than the median pSBP in 24 participants, while the two were equal in two participants. The analysis using the Wilcoxon Signed Rank test revealed a statistically significant difference (p < 0.0001).
Furthermore, among the same group of women with mild peripheral hypertension, the median pDBP was 91.0 (86.0.96.0) mmHg, while the median cDBP was 82.0 (77.0–89.0) mmHg. There was a strong positive correlation between the two measurements (Spearman’s rank r = 0.596; p < 0.0001). Linear regression analysis revealed a strongly positive correlation between the pDBP and the cDBP and cDBP, and changes in pDBP were associated with a shift in the cDBP (B = 0.661; p < 0.0001). The difference between the median pDBP and cDBP was 9.0 mmHg, which was statistically significant (p < 0.0001).
Additionally, among these women with mild peripheral hypertension, the median cDBP was less than the median pDBP in 81 participants, while in 14 participants, the median cDBP was greater than the median pDBP. The observed differences were statistically significant (p < 0.0001). Among the 14 participants with a higher median cDBP than the pDBP, four had eclampsia. The median cDBP for the four eclamptic patients was 108 mmHg, while their median pDBP was 93 mmHg. The difference between median cDBP and pDBP among the four participants was 15 mmHg, and it was statistically significant (z based on positive ranks = −6.5; Wilcoxon Signed Rank p < 0.0001).
Twenty-seven of the 102 eclamptic patients had mild peripheral hypertension, while the rest had severe peripheral hypertension. The median pSBP among eclamptic patients with mild peripheral hypertension was 138.0 mmHg (IQR: 133.0–148.0) while the cSBP level in the same group was 145.0 mmHg (IQR: 140.0–150.0).
The overall median cSBP among women with eclampsia (n = 102) was 133.0 mmHg (IQR 120.0–143.0) and the median cDBP was 73.0 mmHg (IQR: 60.0–83.0), and these were significantly higher (p < 0.0001) than the median cSBP of 128.0 mmHg (IQR: 114.0–139) and cDBP of 71.0 mmHg (IQR: 61.0–81.0) among preeclamptic women, with or without severe features, and much higher than the median cSBP of 115 mmHg (IQR:106.0–125.0) and cDBP of 61.5 mmHg (IQR: 52.0–69.0) among normotensive controls (Table 9).
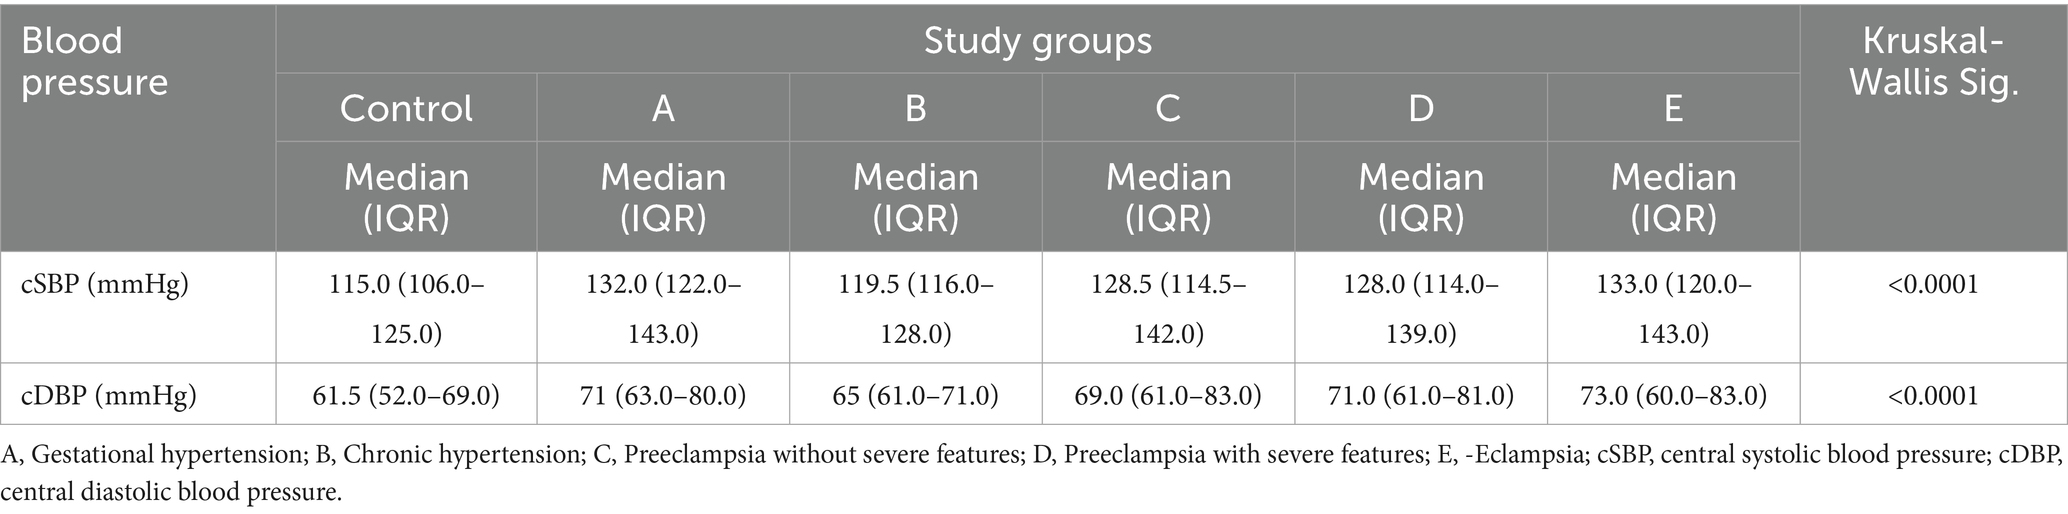
Table 9. Comparison of central blood pressure readings among the different phenotypes of HDP and normotensive controls.
Discussion
Historically, measuring CBP required invasive methods, which limited its application. However, recent advancements in non-invasive technologies have improved the feasibility of obtaining reliable measurements in clinical environments. This transition toward non-invasive techniques facilitates better monitoring, particularly in vulnerable groups like pregnant women.
This study aimed to assess the relationship between peripheral and CBP and to determine the thresholds for mild and severe central hypertension among pregnant women in the third trimester.
The research established that the cut-off for diagnosing central hypertension is a cSBP of 116 mmHg and a cDBP of 78 mmHg. These findings are consistent with the work of Chulkova et al. (26), who noted that a cSBP of 115 mmHg in pregnant women might indicate a risk for PE. Additionally, these results align with a study by Booysen et al. (27), which reported a cSBP upper threshold of 112 mmHg among a cohort of 311 young Black South Africans with a median age of 31. The similarity in our findings can be attributed to the younger demographic and shared background, as both studies focused on younger Black South Africans.
Conversely, research involving older populations has indicated higher thresholds for CBP. For example, a study with over 6,000 participants conducted by Hao et al. (18) established a 90th percentile cutoff for cSBP at 125 mmHg for men and 126 mmHg for women. This is consistent with previous findings from Japan, where a threshold of 129 mmHg was reported (17). Additionally, Cheng et al. (19) demonstrated through a longitudinal study involving 1,272 older participants that a central BP greater than 130/90 mmHg significantly predicts cardiovascular events over a median follow-up of 15 years. While the cut-off values determined by Cheng et al. (19) serve as important benchmarks, they may not fully apply to pregnant populations, where physiological changes result in unique cardiovascular dynamics (20). Moreover, aging is often associated with aortic stiffness, which leads to an earlier return of reflected waves in late systole, contributing to higher central BP levels (10).
For severe central hypertension, our study found that among pregnant women in their third trimester with severe brachial hypertension, cSBP was ≥148 mmHg and cDBP was ≥95 mmHg. To our knowledge, this work is the first to document the threshold for severe central hypertension. However, further studies are needed to validate these findings. These thresholds are considerably lower than those of PBP (160/110 mmHg), which is expected, as CBP is generally lower than PBP due to the inherent physiological differences between the two vascular systems.
One limitation in our calculations is that some normotensive controls displayed higher cSBP and/or cDBP values than their peripheral counterparts. Under typical conditions, cSBP should be lower than pSBP, with minimal variation between pDBP and cDBP. The possible explanation for this finding in our study is that while the participants had normal PBP, their CBP may have already been abnormal.
In comparison of peripheral and CBP, a positive correlation was found between pSBP and cSBP, as well as between pDBP and cDBP among normotensive pregnant women, aligning with previous findings by Fujime et al. (28). Importantly, Fujime et al. analyzed a larger sample of 830 participants, which adds strength to their findings. Similarly, a cross-sectional study by Priyadarsini et al. (29) involving 107 pregnant women and 53 age-matched non-pregnant women also confirmed a strong relationship between brachial systolic blood pressure and cSBP in healthy normotensive pregnant women (29).
These positive correlations could be explained physiologically by the impact of arterial elasticity on circulatory pressure distribution (30). With healthy, elastic arteries, a strong correlation between peripheral and central measurements is expected. Healthy, elastic arteries allow for a more efficient transmission of pressure waves generated by the heartbeat. When arteries are elastic, they can accommodate the surge of blood during systole, dampening the pressure peaks and maintaining a more stable blood flow throughout the body (31).
Additionally, several studies have demonstrated that CBP has a better relationship to future cardiovascular events and mortality and is also more relevant than peripheral brachial BP in predicting target organ damage, as it represents the true load imposed on the heart, brain, kidneys, and the large arteries (32–34). Nevertheless, additional research is necessary to validate these findings, given that some authors dispute the stronger correlation between CBP and cardiovascular events (35, 36).
In this study, the median cSBP among normotensive pregnant women was found to be 115 mmHg. This finding is consistent with the results of Turi et al. (37), who reported a similar mean cSBP of 115 mmHg in healthy pregnant women. However, in our study, the cSBP value was slightly higher, though not significantly, than the pSBP value of 114 mmHg that was observed. Typically, in normotensive individuals, cSBP is expected to be lower than pSBP. This atypical finding raises the possibility that individuals with higher cSBP in this study may have an underlying increase in arterial stiffness or could be at risk of developing it. As arterial stiffness increases, systolic pressure tends to rise. This is due to the early merging of the fast-reflected wave with the forward wave (38). Furthermore, increased arterial stiffness damages more elastic fibers in the blood vessel walls, leading to inadequate buffering and transmission of pulsatile pressure from the heart to target organs (39). Such changes can ultimately result in organ damage, so it is a good idea to closely monitor these patients to assess their risk of high blood pressure in the future.
In this study, cDBP in normotensive controls was less than pDBP in 159 participants, and it was greater than pDBP in 98 participants. This is again an unexpected finding in normotensive controls, as under physiological conditions, the cDBP should either be the same as the pDBP or less than the pDBP (40). This suggests that the 98 individuals with higher cDBP may be having central diastolic hypertension or are at risk of developing central hypertension, while their peripheral diastolic blood pressure puts them in the normal blood pressure category. Only a prospective follow-up study can test this explanation.
There is little correlation between the pBP and the occurrence of eclampsia. Several studies indicate that the blood pressure may be normal or only mildly elevated in women with eclampsia and even with stroke (41–43). The present study found that the median central systolic and diastolic blood pressures, as well as pDBP, were significantly higher in cases of eclampsia compared with those with other HDP and with non-hypertensive controls. This implies that CBP measurement may be better able to distinguish between the subtypes of HDP and phenotypes of PE than PBP.
In addition, the median cSBP for women with eclampsia and mild peripheral hypertension was relatively severe. This suggests that some eclamptic patients with mild pSBP actually have a cSBP that falls into the severe range. This finding may help explain why some patients with mild peripheral hypertension experience eclampsia. This implies that the cSBP might be a better predictor of eclampsia than the pSBP. Central aortic blood pressure plays a crucial role in regulating blood flow to the brain (15). Consequently, it could be inferred that in cases of eclampsia, vasogenic oedema might occur due to elevated CBP, even when brachial blood pressure remains only slightly elevated in the affected women.
The limitation of this study is that all hypertensive patients received antihypertensive treatment, which may have affected their blood pressure readings. However, patients were recruited within 24 h of admission, a time frame during which the pharmacological treatment might not have fully taken effect.
Conclusion
This study established the threshold values for central hypertension as 116/78 mmHg, with severe central hypertension defined as 148/95 mmHg. This study also reinforces the positive correlation between peripheral and CBP in both normotensive and hypertensive populations. Notably, women with eclampsia showed higher CBP levels compared with those having mild hypertension in the severe range. This may clarify why some patients with mild peripheral hypertension experience eclampsia and may thus indicate that CBP is a better predictor of eclampsia than PBP. Further research is needed to confirm these findings.
Data availability statement
The original contributions presented in the study are included in the article/supplementary material, further inquiries can be directed to the corresponding author.
Ethics statement
The studies involving humans were approved by Walter Sisulu University Human Research Committee. The studies were conducted in accordance with the local legislation and institutional requirements. The participants provided their written informed consent to participate in this study.
Author contributions
XM: Writing – original draft, Writing – review & editing, Conceptualization, Data curation, Formal analysis, Investigation, Methodology. SG: Supervision, Writing – review & editing. AH: Supervision, Writing – review & editing. CB: Writing – review & editing, Conceptualization, Methodology, Supervision, Validation. MN: Writing – review & editing, Formal analysis. GB: Conceptualization, Supervision, Writing – review & editing.
Funding
The author(s) declare that financial support was received for the research and/or publication of this article. This research was funded by the Discovery Foundation, reference number 66681, and the South African Medical Research Council, reference number 696335.
Acknowledgments
The authors thank all participants included in this study.
Conflict of interest
The authors declare that the research was conducted in the absence of any commercial or financial relationships that could be construed as a potential conflict of interest.
Generative AI statement
The authors declare that no Gen AI was used in the creation of this manuscript.
Any alternative text (alt text) provided alongside figures in this article has been generated by Frontiers with the support of artificial intelligence and reasonable efforts have been made to ensure accuracy, including review by the authors wherever possible. If you identify any issues, please contact us.
Publisher’s note
All claims expressed in this article are solely those of the authors and do not necessarily represent those of their affiliated organizations, or those of the publisher, the editors and the reviewers. Any product that may be evaluated in this article, or claim that may be made by its manufacturer, is not guaranteed or endorsed by the publisher.
References
1. Lewington, S, Clarke, R, Qizilbash, N, Peto, R, and Collins, R. Age-specific relevance of usual blood pressure to vascular mortality: a meta-analysis of individual data for one million adults in 61 prospective studies. Lancet. (2002) 360:1903–13. doi: 10.1016/s0140-6736(02)11911-8
2. Lacey, B, Lewington, S, Clarke, R, Kong, XL, Chen, Y, Guo, Y, et al. Age-specific association between blood pressure and vascular and non-vascular chronic diseases in 0·5 million adults in China: a prospective cohort study. Lancet Glob Health. (2018) 6:e641–9. doi: 10.1016/S2214-109X(18)30217-1
3. Tapia-Conyer, R, Alegre-Diáz, J, Gnatiuc, L, Wade, R, Ramirez-Reyes, R, Herrington, WG, et al. Association of Blood Pressure with cause-specific mortality in Mexican adults. JAMA Netw Open. (2020) 3:e2018141. doi: 10.1001/jamanetworkopen.2020.18141
4. Martinez, R, Soliz, P, Campbell, NRC, Lackland, DT, Whelton, PK, and Ordunez, P. Association between population hypertension control and ischemic heart disease and stroke mortality in 36 countries of the Americas, 1990-2019: an ecological study. Rev Panam Salud Publica. (2022) 46:e143. doi: 10.26633/RPSP.2022.143
5. Sibai, BM, and Stella, CL. Diagnosis and management of atypical preeclampsia-eclampsia. Am J Obstet Gynecol. (2009) 200:481.e1–7. doi: 10.1016/j.ajog.2008.07.048
6. Protogerou, A, Blacher, J, Stergiou, GS, Achimastos, A, and Safar, ME. Blood pressure response under chronic antihypertensive drug therapy. The role of aortic stiffness in the REASON (preterax in regression of arterial stiffness in a controlled double-blind) study. J Am Coll Cardiol. (2009) 53:445–51. doi: 10.1016/j.jacc.2008.09.046
7. Roman, RB, Kizer, JR, Lee, ET, Galloway, JM, Ali, T, Umans, JG, et al. Central pressure more strongly relates to vascular disease and outcome than does brachial pressure: the strong heart study. Hypertension. (2007) 50:197–203. doi: 10.1161/HYPERTENSIONAHA.107.089078
8. Wang, KL, Cheng, HM, Chuang, SY, Spurgeon, HA, Ting, CT, Lakatta, EG, et al. Central or peripheral systolic or pulse pressure: which best relates to target-organs and future mortality? J Hypertens. (2009) 27:461–7. doi: 10.1097/hjh.0b013e3283220ea4
9. Alsomali, A, Lip, GYH, Akhtar, R, Field, M, Grillo, A, Tidbury, N, et al. Associations between central and brachial blood pressure in patients with hypertension and aortovascular disease: implications for clinical practice. Curr Probl Cardiol. (2025):102874. doi: 10.1016/j.cpcardiol.2024.102874
10. McEniery, CM, Yasmin, N, Hall, IR, Qasem, A, Wilkinson, IB, and Cockcroft, JR. Normal vascular aging: differential effects on wave reflection and aortic pulse wave velocity—the Anglo-Cardiff collaborative trial (ACCT). J Am Coll Cardiol. (2005) 46:1753–60. doi: 10.1016/j.jacc.2005.07.037
11. Cheng, HM, Chuang, SY, Sung, SH, Wu, CC, Wang, JJ, Hsu, PF, et al. 2019 consensus of the Taiwan hypertension society and Taiwan society of cardiology on the clinical application of central blood pressure in the management of hypertension. Acta Cardiol Sin. (2019) 35:234–43. doi: 10.6515/ACS.201905_35(3).20190415B
12. Torrado, J, Farro, I, Zocalo, Y, Farro, F, Sosa, C, Scasso, S, et al. Preeclampsia is associated with increased central aortic pressure, elastic arteries stiffness and wave reflections, and resting and recruitable endothelial dysfunction. Int J Hypertens. (2015) 2015:720683. doi: 10.1155/2015/720683
13. Meeme, A, Buga, GAB, Mammen, M, and Namugowa, A. Endothelial dysfunction and arterial stiffness in pre-eclampsia demonstrated by the EndoPAT method. Cardiovasc J Afr. (2017) 28:23–9. doi: 10.5830/CVJA-2016-047
14. Namugowa, A, Iputo, J, Wandabwa, J, Meeme, A, and Buga, GAB. Comparison of arterial stiffness in preeclamptic and normotensive pregnant women from a semi-rural region of South Africa. Clin Exp Hypertens. (2017) 39:277–83. doi: 10.1080/10641963.2016.1254227
15. Cipolla, MR, and Kraig, RP. Seizures in women with preeclampsia: mechanisms and management. Fetal Matern Med Rev. (2011) 22:91–108. doi: 10.1017/S0965539511000040
16. Miller, EC. Preeclampsia and cerebrovascular disease. Hypertension. (2019) 74:5–13. doi: 10.1161/HYPERTENSIONAHA.118.11513
17. Takase, H, Dohi, Y, and Kimura, G. Distribution of central blood pressure values estimated by Omron HEM-9000AI in the Japanese general population. Hypertens Res. (2013) 36:50–7. doi: 10.1038/hr.2012.122
18. Hao, G, Wang, Z, Zhang, L, Chen, Z, Wang, X, Guo, M, et al. Thresholds of central systolic blood pressure in a normotensive Chinese middle-aged population. Angiology. (2016) 67:174–9. doi: 10.1177/0003319715584134
19. Cheng, HM, Sung, SH, Shih, YT, Chuang, SY, Yu, WC, and Chen, CH. Measurement accuracy of a stand-alone oscillometric central blood pressure monitor: a validation report for microlife WatchBP central office. Am J Hypertens. (2013) 26:42–50. doi: 10.1093/ajh/hps021
20. Mahendru, AA, Everett, TR, Wilkinson, IB, Lees, CC, and McEniery, CM. A longitudinal study of maternal cardiovascular function from preconception to the postpartum period. J Hypertens. (2014) 32:849–56. doi: 10.1097/HJH.0000000000000090
21. Macedo, ML, Luminoso, D, Savvidou, MD, McEniery, CM, and Nicolaide, KH. Maternal wave reflections and arterial stiffness as assessed by applanation tonometry. Hypertension. (2008) 51:1047–51. doi: 10.1161/HYPERTENSIONAHA.107.106062
22. World Medical Association. Declaration of Helsinki World Medical Association declaration of Helsinki ethical principles for medical research involving human subjects. Bull World Health Organ. (2001) 79:373–4. Epub 2003 Jul 2.
23. Brown, MA, Magee, LA, Kenny, LC, Karumanchi, SA, McCarthy, FP, Saito, S, et al. The hypertensive disorders of pregnancy: ISSHP classification, diagnosis & management recommendations for international practice. Pregnancy Hypertens. (2018) 13:291–310. doi: 10.1016/j.preghy.2018.05.004
24. Stergiou, GS, Alpert, B, Mieke, S, Asmar, R, Atkins, N, Eckert, S, et al. A universal standard for the validation of blood pressure measuring devices: association for the advancement of medical instrumentation/European society of hypertension/international organization for standardization (AAMI/ESH/ISO) collaboration statement. Hypertension. (2018) 71:368–74. doi: 10.1161/HYPERTENSIONAHA.117.10237
25. Hurrell, A, Webster, L, Chappell, LC, and Shennan, AH. The assessment of blood pressure in pregnant women: pitfalls and novel approaches. Am J Obstet Gynecol. (2022) 226:S804–18. doi: 10.1016/j.ajog.2020.10.026
26. Chulkov, VS, Sinitsin, SP, and Vereina, NK. Prognostic value of central aortic pressure in pregnant women with hypertension. Kardiologiia. (2015) 55:29–33. doi: 10.18565/cardio.2015.5.29-33
27. Booysen, HL, Norton, GR, Maseko, MJ, Libhaber, CD, Majane, OHI, Sareli, P, et al. Aortic, but not brachial blood pressure category enhances the ability to identify target organ changes in normotensives. J Hypertens. (2013) 31:1124–30. doi: 10.1097/HJH.0b013e328360802a
28. Fujime, M, Tomimatsu, T, Okaue, Y, Koyama, S, Kanagawa, T, Taniguchi, T, et al. Central aortic blood pressure and augmentation index during normal pregnancy. Hypertens Res. (2012) 35:633–8. doi: 10.1038/hr.2012.1
29. Priyadarsini, N, Singh, SC, Sethi, P, Mohapatra, S, Goyal, M, and Rao, BN. Hemodynamic changes in pregnancy: does central blood pressure have any role? Women Health. (2023) 63:150–5. doi: 10.1080/03630242.2022.2164115
30. Jacobs, DR, Duprez, DA, and Shimbo, D. Invited commentary: hypertension and arterial stiffness—origins remain a dilemma. Am J Epidemiol. (2016) 183:609–12. doi: 10.1093/aje/kwv276
31. Warner, DS, Warner, MA, and Gelman, S. Venous function and central venous pressure a physiologic story function of the venous system. Anesthesiology. (2008) 108:735–48. doi: 10.1097/ALN.0b013e3181672607
32. McEniery, CM, Cockcroft, JR, Roman, MJ, Franklin, SS, and Wilkinson, IB. Central blood pressure: current evidence and clinical importance. Eur Heart J. (2014) 35:1719–25. doi: 10.1093/eurheartj/eht565
33. Williams, B, Mancia, G, Spiering, W, Rosei, EA, Azizi, M, Burnier, M, et al. 2018 ESC/ESH guidelines for the management of arterial hypertension. Eur Heart J. (2018) 39:3021–104. doi: 10.1093/eurheartj/ehy339
34. Baba, BA, Johan, PT, and Mohan, JC. Comparsion of central aortic pressure to brachial artery pressure in hypertensive patients on drug treatment: an observational study. Indian Heart J. (2018) 70:S208–12. doi: 10.1016/j.ihj.2018.10.418
35. Huang, SJ, Chen, CP, Buchwalder, L, Yu, YC, Piao, L, Huang, CY, et al. Regulation of CX3CL1 expression in human first-trimester decidual cells: implications for preeclampsia. Reprod Sci. (2019) 26:1256–65. doi: 10.1177/1933719118815592
36. Lamarche, F, Agharazii, M, Madore, F, and Goupil, R. Prediction of cardiovascular events by type I central systolic blood pressure: a prospective study. Hypertension. (2021) 77:319–27. doi: 10.1161/HYPERTENSIONAHA.120.16163
37. Turi, VR, Luca, CT, Gaita, D, Iurciuc, S, Petre, I, Iurciuc, M, et al. Diagnosing arterial stiffness in pregnancy and its implications in the cardio-renal-metabolic chain. Diagnostics (Basel). (2022) 12:2221. doi: 10.3390/diagnostics12092221
38. Kim, HL, and Weber, T. Pulsatile hemodynamics and coronary artery disease. Korean Circ J. (2021) 51:881–98. doi: 10.4070/kcj.2021.0227
39. Laurent, S, and Boutouyrie, P. Arterial stiffness and hypertension in the elderly. Front Cardiovasc Med. (2020) 7:544302. doi: 10.3389/fcvm.2020.544302
40. Agabiti-Rosei, E, Mancia, G, O’Rourke, MF, Roman, MJ, Safar, ME, Smulyan, H, et al. Central blood pressure measurements and antihypertensive therapy: a consensus document. Hypertension. (2007) 50:154–60. doi: 10.1161/HYPERTENSIONAHA.107.090068
41. Douglas, KA, and Redman, CWG. Eclampsia in the United Kingdom. BMJ. (1994) 309:1395–400. doi: 10.1136/bmj.309.6966.1395
42. Sibai, BM. The HELLP syndrome (hemolysis, elevated liver enzymes, and low platelets): much ado about nothing? Am J Obstet Gynecol. (1990) 162:311–6. doi: 10.1016/0002-9378(90)90376-I
Keywords: pregnant women, eclampsia, preeclampsia, hypertensive disorders of pregnancy, arterial stiffness, central and peripheral hypertension
Citation: Mbongozi XB, Galloway SDR, Hunter A, Businge CB, Nanjoh M and Buga GAB (2025) Correlation of peripheral blood pressure with central blood pressure and estimation of central blood pressure thresholds for diagnosis of hypertension during pregnancy. Front. Med. 12:1651854. doi: 10.3389/fmed.2025.1651854
Edited by:
Giuseppe Caminiti, Università Telematica San Raffaele, ItalyReviewed by:
Julian Minetto, Universidad Nacional de La Plata, ArgentinaFrancisco Javier Hernandez Mora, Civil Hospital of Guadalajara, Mexico
Copyright © 2025 Mbongozi, Galloway, Hunter, Businge, Nanjoh and Buga. This is an open-access article distributed under the terms of the Creative Commons Attribution License (CC BY). The use, distribution or reproduction in other forums is permitted, provided the original author(s) and the copyright owner(s) are credited and that the original publication in this journal is cited, in accordance with accepted academic practice. No use, distribution or reproduction is permitted which does not comply with these terms.
*Correspondence: Xolani B. Mbongozi, eG1ib25nb3ppQHdzdS5hYy56YQ==