 Alaa K. Hameed
 Ifad K. Abd Al-Shibly2
- 1Department of Laboratories, Al-Hussein Teaching Hospital, Al-Muthanna Health Department Employee, Al-Muthanna, Iraq
- 2Department of Microbiology, College of Medicine, Babylon University, Hilla, Iraq
- 3Department of Human Anatomy, College of Medicine, Babylon University, Hilla, Iraq
This study explores the molecular impact of cisplatin, Actemra (tocilizumab), remdesivir, and SARS-CoV-2 infection on colorectal cancer (CRC) SW-480 cells using RNA sequencing (RNA-Seq). Differential gene expression analysis revealed treatment-specific transcriptional changes. Cisplatin led to the downregulation of genes involved in lipid metabolism and focal adhesion, while remdesivir upregulated chromatin remodeling pathways. SARS-CoV-2 infection altered cytokine signaling, particularly IL-17 and TNF-α. Principal component and hierarchical clustering analyses confirmed distinct gene expression profiles across treatments. ELISA assays validated the reduction of ACE2 and CD147 protein levels following drug treatment. MTT assays demonstrated remdesivir’s cytotoxicity at high doses. These findings highlight potential drug-gene interactions and suggest that combining transcriptomic profiling with functional assays may guide personalized therapeutic strategies for CRC patients, especially those co-infected with SARS-CoV-2.
1 Introduction
Colorectal cancer (CRC) ranks among the most prevalent and lethal malignancies worldwide, with increasing incidence driven by sedentary lifestyles, dietary shifts, and aging populations. Despite advances in targeted therapies and immunotherapies, resistance to treatment and tumor relapse remain major clinical hurdles (1). Conventional chemotherapies, such as cisplatin, continue to form the backbone of CRC management, yet their long-term efficacy is limited by drug resistance and systemic toxicity. The emergence of SARS-CoV-2, the causative agent of COVID-19, has introduced new challenges, especially for patients with solid tumors like CRC who are already immunocompromised and at higher risk of severe viral outcomes (2).
A key molecular link between CRC and COVID-19 lies in the shared expression of viral entry receptors in tumor tissues. Angiotensin-converting enzyme 2 (ACE2) and cluster of differentiation 147 (CD147) are both overexpressed in colorectal tumors and have been identified as functional entry points for SARS-CoV-2 (3, 4). ACE2, part of the renin-angiotensin system (RAS), paradoxically plays both protective and tumor-promoting roles: while it mitigates angiotensin II-mediated damage in cardiovascular systems, its elevated expression in CRC is associated with increased tumor aggressiveness and poor prognosis (5). CD147, also known as basigin or EMMPRIN, not only facilitates SARS-CoV-2 binding but also contributes to chemotherapy resistance by promoting epithelial-mesenchymal transition (EMT) and matrix metalloproteinase activation (6, 7).
The immunological overlap between CRC and COVID-19 is another layer of complexity. Elevated levels of pro-inflammatory cytokines, particularly interleukin-6 (IL-6), interleukin-17 (IL-17), and tumor necrosis factor-alpha (TNF-α), are hallmarks of both CRC progression and COVID-19 severity. IL-17, mainly secreted by Th17 cells, promotes angiogenesis and tumor cell survival, while TNF-α sustains chronic inflammation and contributes to genomic instability (8, 9). In the context of viral infection, these cytokines are implicated in the cytokine storm syndrome, exacerbating tissue damage and impairing anti-tumor immunity. This immunological convergence suggests that SARS-CoV-2 may accelerate CRC progression via inflammatory amplification, while CRC-related immune dysfunction may predispose patients to severe COVID-19 (10).
Given these shared molecular and immunological pathways, there is a pressing need to evaluate how anticancer and antiviral therapies interact at the transcriptomic level. Cisplatin, for example, exerts its cytotoxic effect through DNA crosslinking and apoptosis induction but is susceptible to resistance mechanisms mediated by cytokines such as IL-17. Actemra (tocilizumab), an IL-6 receptor antagonist used to manage cytokine storm in COVID-19, may modulate tumor-promoting inflammatory pathways, but its impact on CRC-specific targets like CD147 is poorly understood (10–12). Remdesivir, a nucleoside analog that inhibits viral RNA polymerase, could also alter host chromatin and immune pathways relevant to cancer biology (13–15).
To date, few studies have explored how SARS-CoV-2 infection influences drug responses in CRC cells, or how antiviral and anti-inflammatory agents affect cancer-related gene expression. Addressing this gap is crucial for developing safe and effective treatment regimens for CRC patients affected by COVID-19 or similar viral infections.
Therefore, this study aims to investigate the transcriptomic changes in CRC SW-480 cells following treatment with cisplatin, Actemra, and remdesivir, both in the presence and absence of SARS-CoV-2 infection. By integrating RNA sequencing with protein validation and cytotoxicity assays, we seek to identify key pathways and molecular targets such as ACE2, CD147, and IL-17 that are jointly modulated by these agents. Our findings may inform the development of personalized therapeutic strategies that simultaneously address drug resistance, viral susceptibility, and inflammation in CRC patients.
2 Methods
2.1 Cell culture
SW-480 human colorectal cancer cells (ATCC® CCL-228™) were cultured in RPMI-1640 medium supplemented with 10% fetal bovine serum (FBS, Gibco), 100 U/mL penicillin–streptomycin (Sigma-Aldrich), and 2 mM L-glutamine (Thermo Fisher). Cells were maintained at 37°C in a humidified 5% CO₂ atmosphere and subcultured at 80–90% confluency using 0.25% trypsin–EDTA (Gibco). Only cells between passages 3 and 8 were used to ensure consistency and minimize genetic drift.
2.2 Treatment and SARS-CoV-2 infection
Cells were treated with cisplatin (15.6–500 μg/mL, Sigma-Aldrich), remdesivir (62.5–2,000 μg/mL, Gilead Sciences), and Actemra (tocilizumab, 62.5–2,000 μg/mL, Roche) for 24–48 h, with durations optimized based on preliminary MTT cytotoxicity assays and literature (1, 2). For combination experiments, cisplatin (250 μg/mL) was co-administered with either remdesivir or Actemra (both at 1,000 μg/mL) for 24 or 48 h. Untreated (NT) and vehicle control (0.1% DMSO, Sigma-Aldrich) groups were included for comparison. SARS-CoV-2 infection was performed using a clinical isolate (strain United States-WA1/2020) at a multiplicity of infection (MOI) of 0.1. Cells were exposed to the virus in serum-free RPMI-1640 for 1 h at 37°C, washed with PBS, and incubated for 3–7 days to assess cytopathic effects (CPE), including syncytia formation and cell detachment. All viral experiments were conducted under biosafety level 3 (BSL-3) conditions, adhering to institutional protocol CRC2023-017 (Figure 1). A detailed breakdown of treatment groups, doses, and durations is provided in Figure 2.
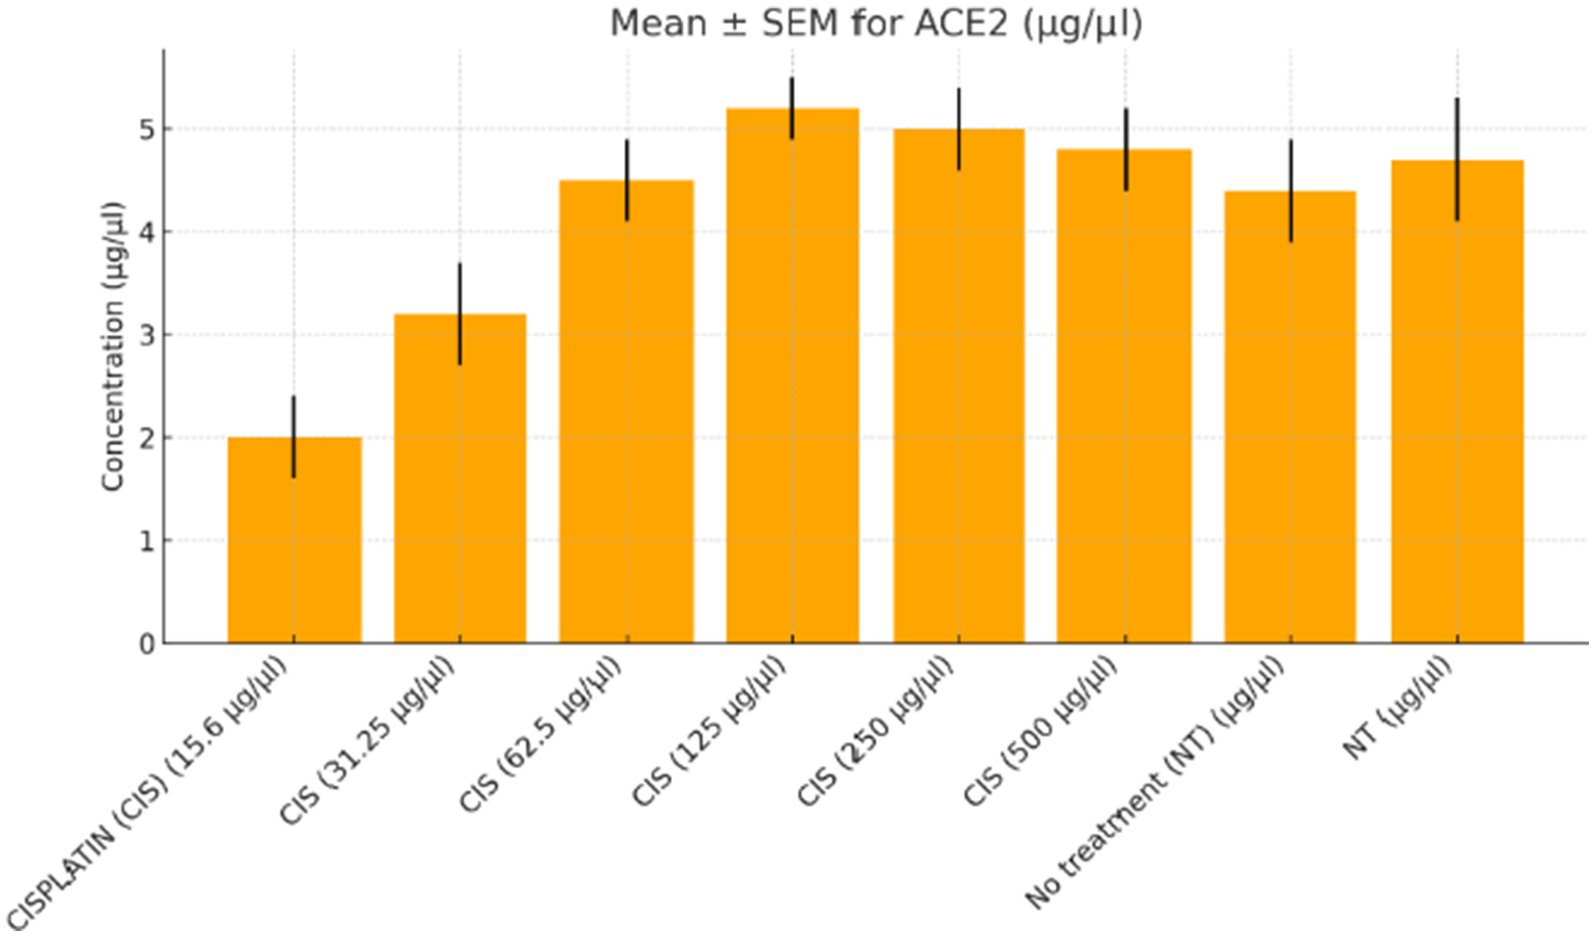
Figure 1. ACE2 expression in colorectal cancer cells treated with varying doses of cisplatin. The concentration of angiotensin-converting enzyme 2 (ACE2, μg/μL) was measured in SW-480 colorectal cancer cells after treatment with increasing doses of cisplatin (15.6 to 500 μg/μL) compared to the no-treatment control (NT). A dose-dependent increase in ACE2 levels was observed, peaking at 250 μg/μL. At the highest dose (500 μg/μL), ACE2 expression plateaued with no further significant increase. Data represent mean ± standard error of the mean (SEM) from three independent replicates.
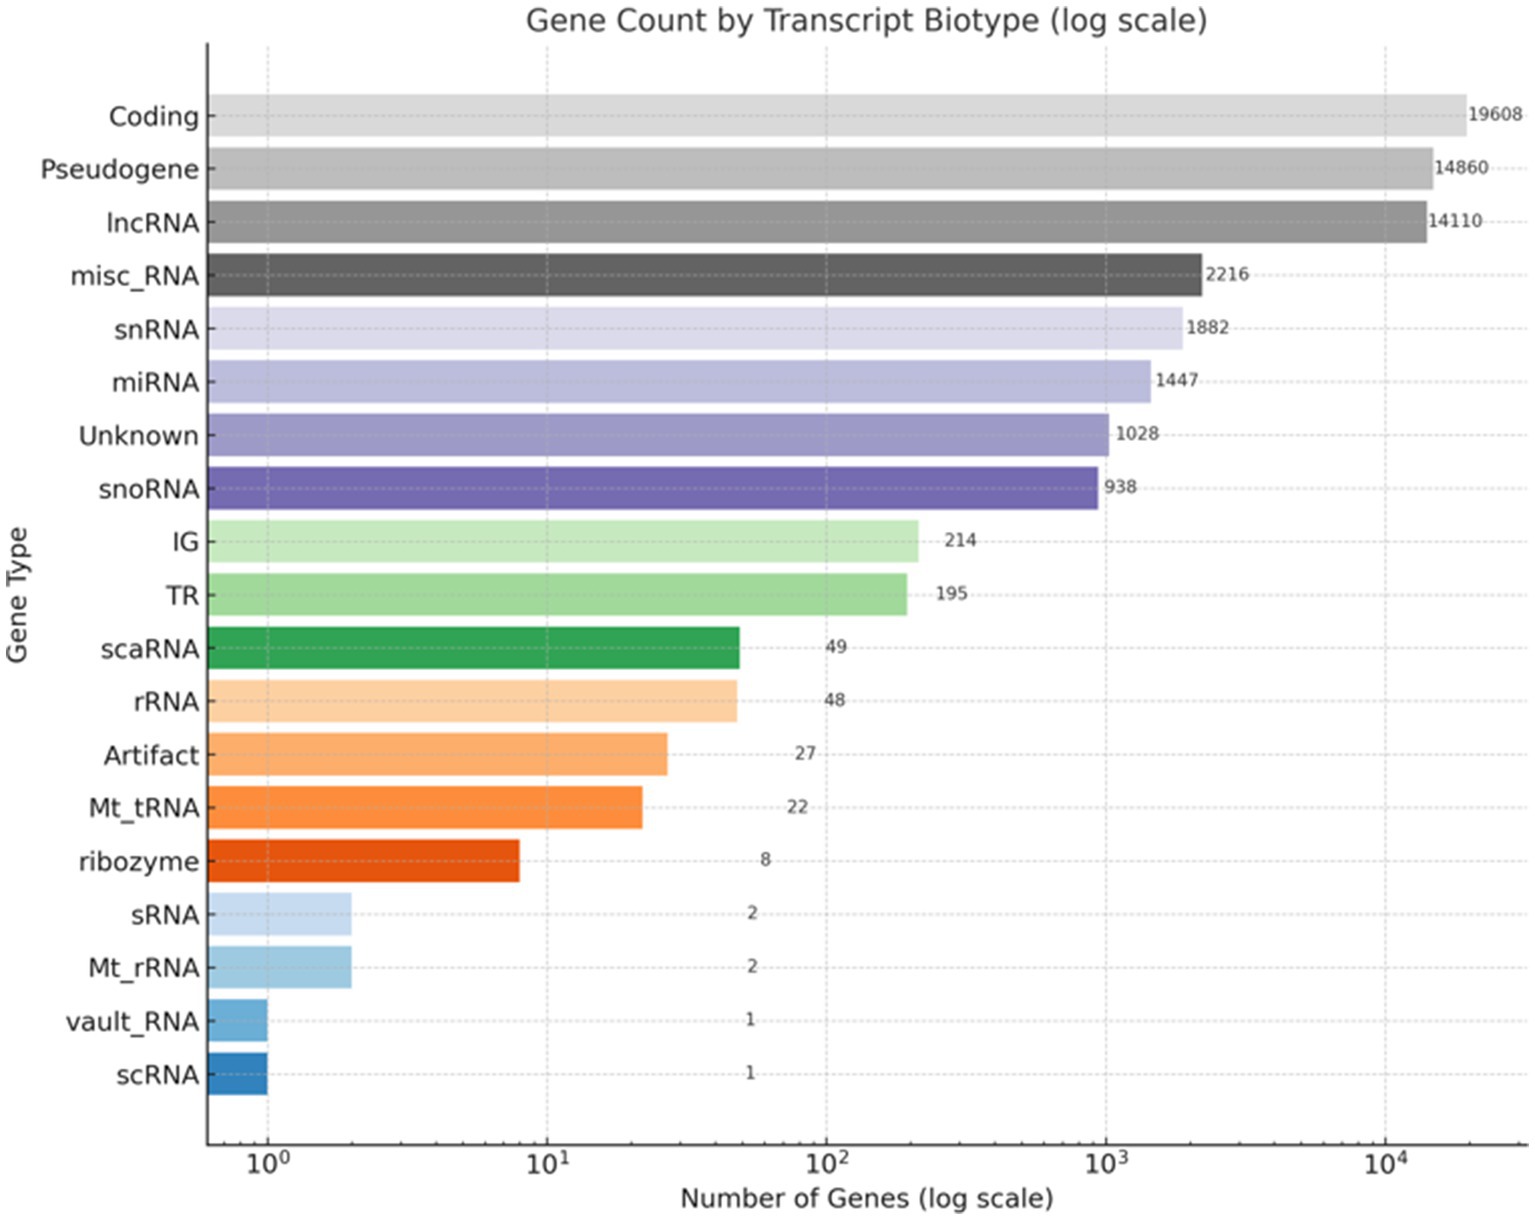
Figure 2. Distribution of gene types in the RNA-Seq dataset. This bar chart illustrates the classification of gene types based on RNA-Seq annotation. The x-axis displays the number of genes on a logarithmic scale, while the y-axis lists the gene categories. Protein-coding genes constitute the largest group (19,608), followed by pseudogenes (14,860) and long non-coding RNAs (lncRNAs, 14,110). Additional categories include miscellaneous RNA (misc_RNA), small nuclear RNA (snRNA), microRNA (miRNA), small nucleolar RNA (snoRNA), and ribosomal RNA (rRNA). A subset of genes categorized as unknown or potential artifacts is also included.
2.3 RNA extraction and sequencing
Total RNA was extracted using TRIzol™ Reagent (Invitrogen) following the manufacturer’s protocol. RNA purity and integrity were assessed using a NanoDrop™ spectrophotometer (Thermo Fisher, A260/A280 ≥ 1.8) and Agilent 2,100 Bioanalyzer (RIN ≥ 8.0). mRNA was enriched via poly-A selection and fragmented at 94°C for 8 min. First and second strand cDNA synthesis was performed using random hexamers, followed by adapter ligation and PCR amplification (12 cycles) with KAPA HiFi HotStart ReadyMix (Roche). Libraries were constructed using the Illumina TruSeq RNA Library Prep Kit and sequenced on an Illumina NovaSeq 6,000 platform (paired-end, 150 bp reads, minimum 30 million reads per sample) (Figure 3).
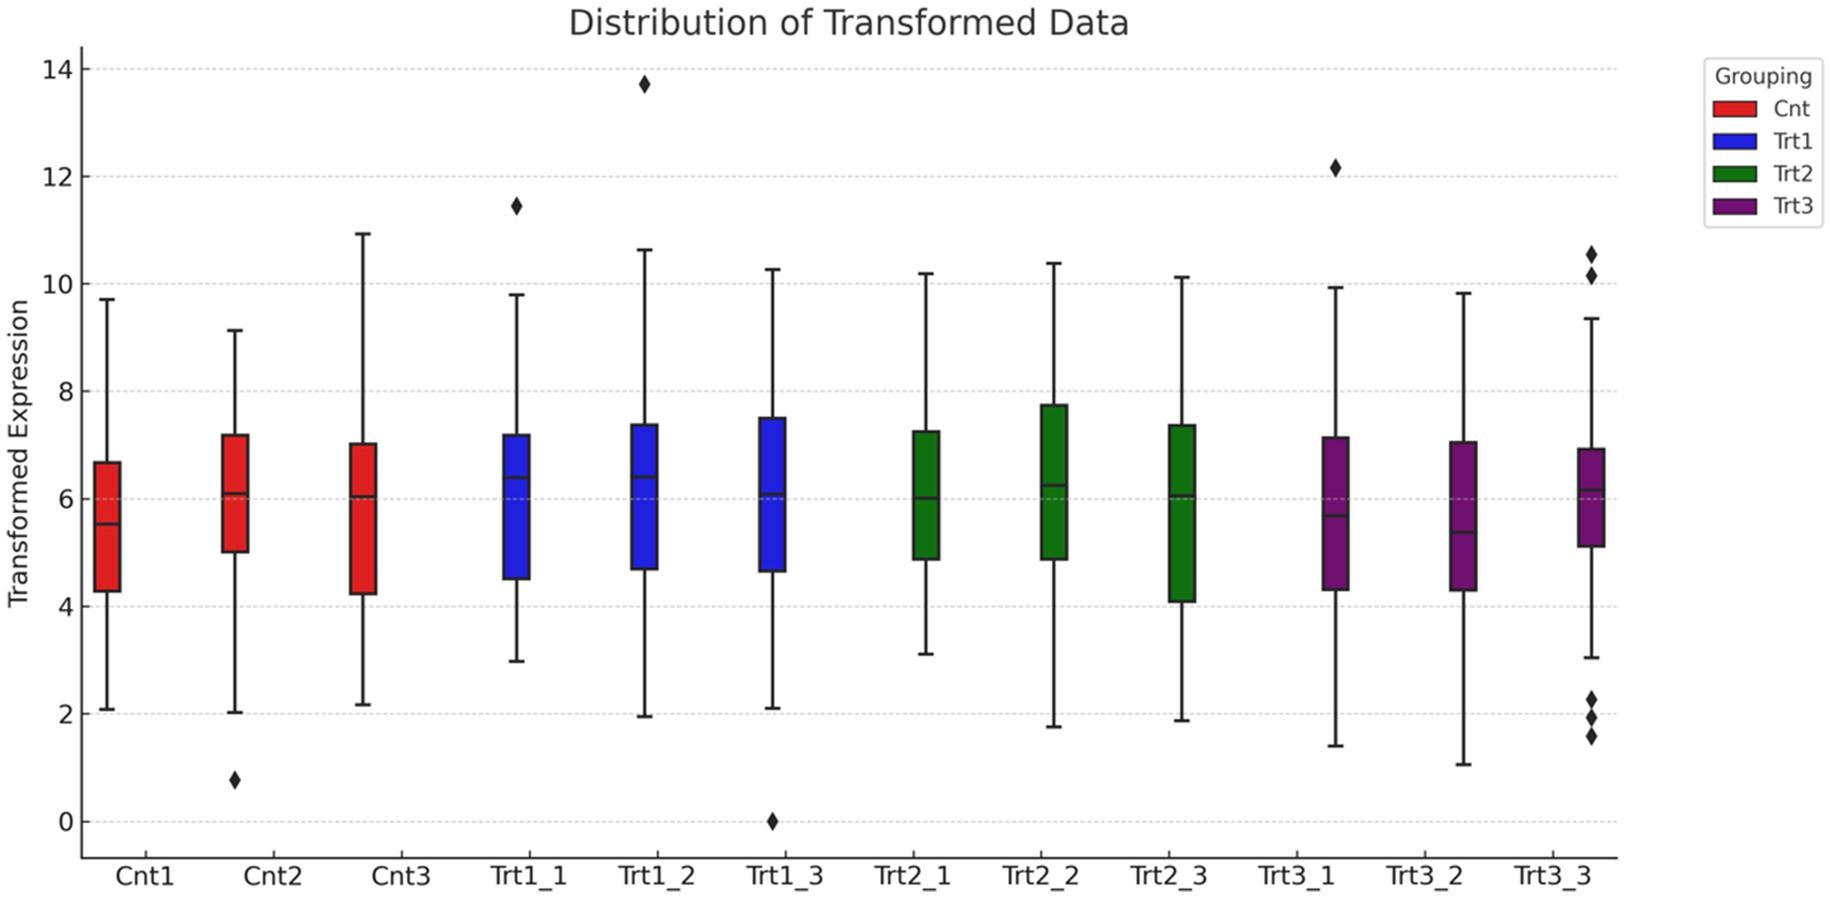
Figure 3. Distribution of normalized gene expression across treatment groups. The boxplot illustrates the distribution of transformed gene expression values for individual samples, grouped by treatment condition: Control (Cnt, red), Treatment 1 (Trt1, blue), Treatment 2 (Trt2, green), and Treatment 3 (Trt3, purple). Median expression levels are consistent across all groups, indicating effective normalization of the dataset. Outliers at the upper range reflect genes with unusually high expression in specific samples.
2.4 RNA-seq data analysis
RNA-Seq data quality control was performed using FASTQC (v0.11.9) to assess read quality metrics, including per-base sequence quality and adapter content. Reads were trimmed with Trimmomatic (v0.39) to remove adapters and low-quality bases (Phred score < 20). Reads were aligned to the human reference genome (GRCh38, Ensembl release 104) using STAR aligner (v2.7.9a) with default parameters. Gene-level counts were quantified using FeatureCounts (v2.0.1) with gene annotations from Gencode v38. Differential expression analysis was conducted with DESeq2 (v1.38.0) in R (v4.2.0), applying thresholds of |log₂FC| > 1 and adjusted p < 0.05 using the Benjamini-Hochberg correction. Functional enrichment analyses (KEGG, GO) were performed using iDEP2.0 and GSEA (v4.3.2) with default settings. Results were visualized via volcano plots (Figure 4) and heatmaps (Figure 5) using ggplot2 (v3.4.0) and pheatmap (v1.0.12) to display clustering patterns.
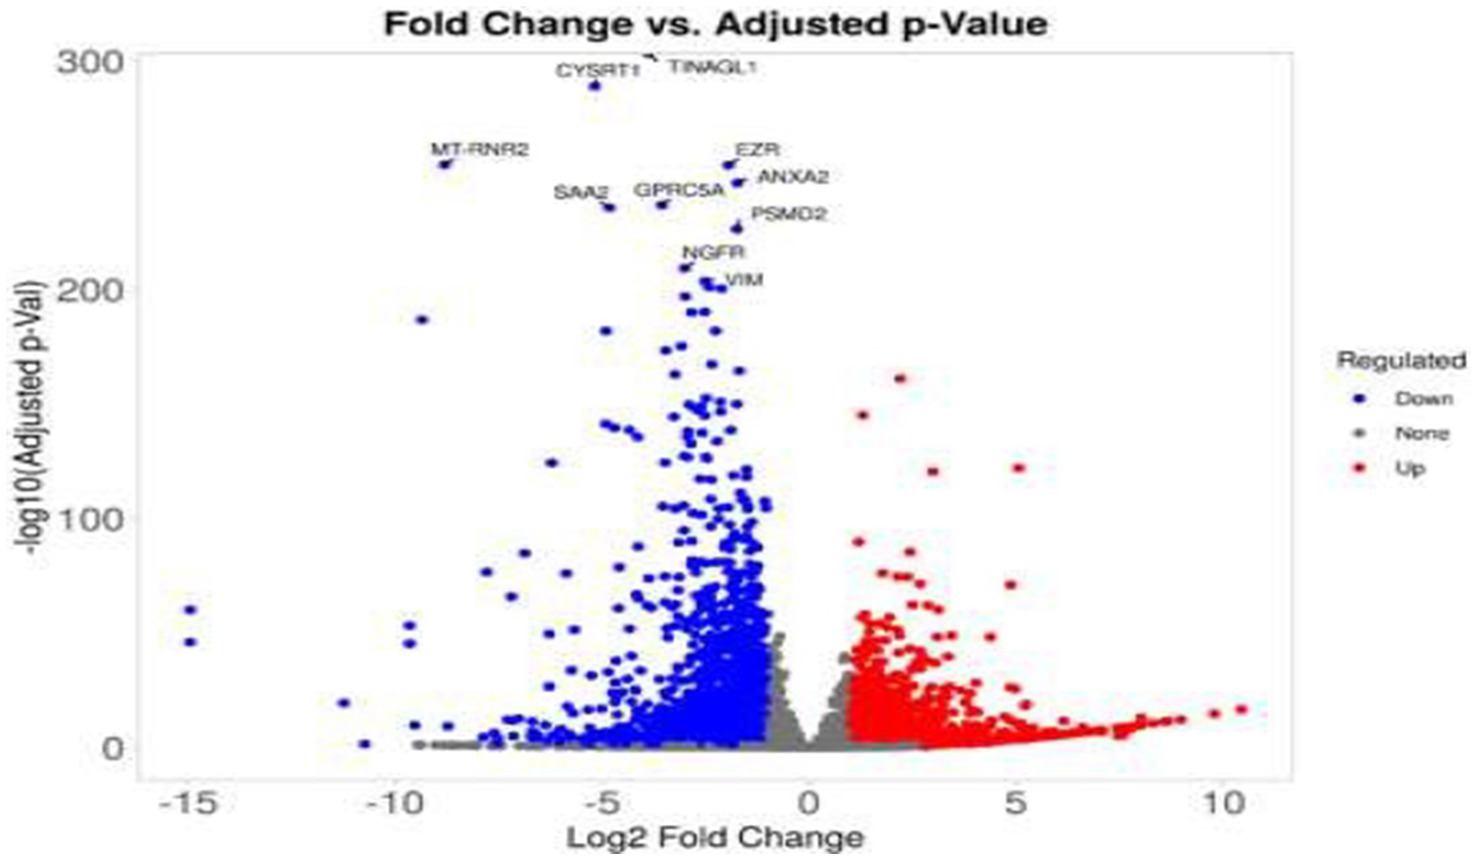
Figure 4. Volcano plot of differentially expressed genes in treated colorectal cancer cells. This volcano plot displays the differential gene expression profile of SW-480 colorectal cancer cells following treatment. The x-axis represents the log₂ fold change (log2FC), while the y-axis indicates the –log10 of the adjusted p-value. Significantly upregulated genes (log2FC > 1, adjusted p < 0.05) are highlighted in red, and significantly downregulated genes (log2FC < −1, adjusted p < 0.05) are shown in blue. Genes that do not meet significance thresholds are depicted in gray. Selected genes with the most significant expression changes are annotated at the top of the plot.
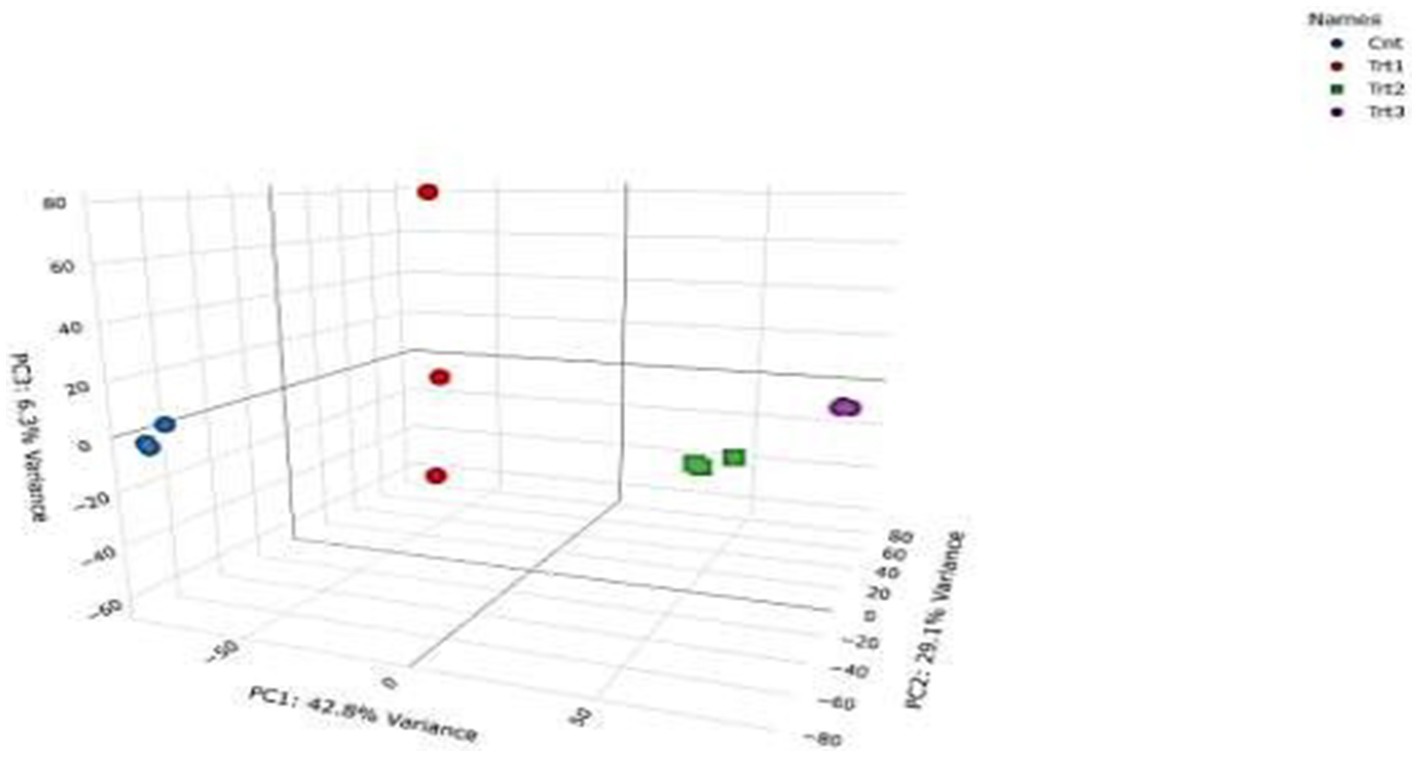
Figure 5. Volcano plot of differentially expressed genes in colorectal cancer cells after treatment. This volcano plot visualizes changes in gene expression in SW-480 colorectal cancer cells following treatment. The x-axis shows the log₂ fold change (log2FC), and the y-axis represents the –log10 of the adjusted p-value. Genes significantly upregulated (log2FC > 1, adjusted p < 0.05) are indicated in red, while significantly downregulated genes (log2FC < −1, adjusted p < 0.05) appear in blue. Non-significant genes are plotted in gray. The most significantly altered genes are labeled for emphasis.
2.5 Protein validation and cytotoxicity assays
Protein validation was performed using ELISA kits for ACE2, CD147, IL-17, TNF-α, IL-23, and TGF-β (Abcam; catalog numbers: see Supplementary Table 1). Assays were conducted according to the manufacturer’s instructions, with absorbance measured at 450 nm using a SpectraMax iD3 plate reader (Molecular Devices). Standard curves were generated using recombinant proteins for quantification. Cytotoxicity was assessed via MTT assay: 5 × 10³ cells/well were treated for 24–48 h, incubated with 5 mg/mL MTT (Sigma-Aldrich) for 4 h, and solubilized in DMSO. Absorbance was recorded at 570 nm using the same plate reader. SARS-CoV-2 RNA levels were quantified using RT-PCR (LightCycler® 480, Roche) with primers targeting ORF1ab and N genes (sequences in Supplementary Table 2). Viral CPE was quantified via trypan blue exclusion (4 mg/mL, Sigma-Aldrich) and hemocytometer counting, while cell viability was visualized using crystal violet staining (0.5% in methanol, Sigma-Aldrich). All experiments were performed in biological triplicates, with statistical analysis conducted using GraphPad Prism 9 (ANOVA, Tukey’s post-hoc test; p < 0.05). Biosafety protocols for SARS-CoV-2 handling adhered to BSL-3 guidelines (Protocol CRC2023-017).
3 Results
RNA-Seq quality control was performed to ensure data reliability. Principal component analysis (PCA) revealed distinct clustering of samples by treatment group (Figure 5), with 42.8% variance explained by PC1 and 29.1% by PC2. Control samples (Cnt) grouped tightly, while cisplatin (Trt1), Actemra (Trt2), and remdesivir (Trt3) treatments formed separate clusters, indicating treatment-specific transcriptional responses. Hierarchical clustering (Figure 6) further confirmed this separation, with replicates within each treatment group clustering together. The heatmap displayed Z-score-normalized expression patterns, highlighting upregulated genes (e.g., CD147, IL-17) in Trt3 and downregulated DNA repair genes in Trt1.
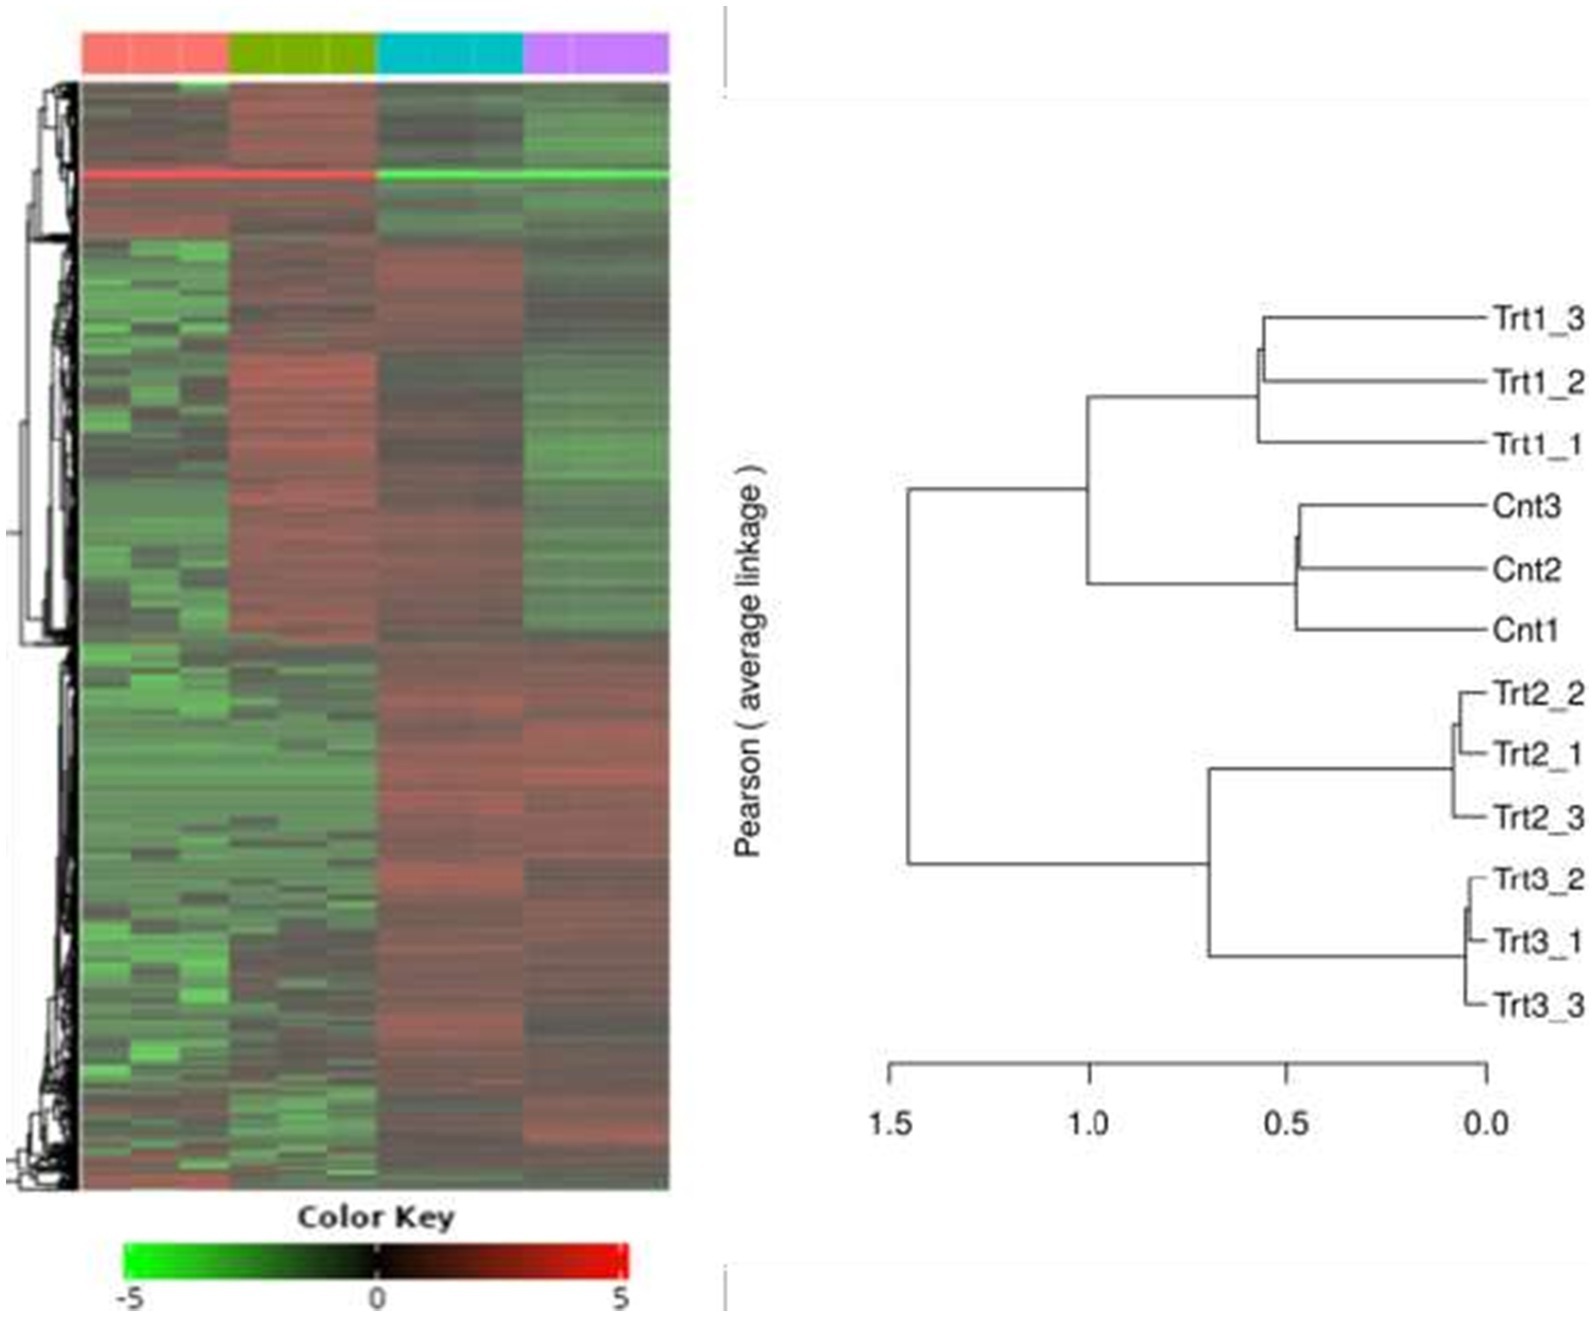
Figure 6. Hierarchical clustering of gene expression profiles across treatment groups. The heatmap and accompanying dendrogram illustrate hierarchical clustering of gene expression data from SW-480 colorectal cancer cells subjected to different treatments. Clustering was performed using Pearson correlation and average linkage methods. Replicates within each group—Control (Cnt1–3), Treatment 1 (Trt1), Treatment 2 (Trt2), and Treatment 3 (Trt3)—cluster tightly together, indicating high intra-group consistency. Distinct separation between treatment groups reflects treatment-specific transcriptional responses, highlighting the differential impact of each intervention on gene expression patterns.
Differential gene expression analysis identified significant transcriptional changes across treatments. Volcano plots (Figures 4, 5) revealed upregulated genes (red) and downregulated genes (blue) with thresholds of |log₂FC| > 1 and adjusted p < 0.05. For cisplatin, 1,240 genes were downregulated, including those involved in lipid metabolism (e.g., FASN, ACSL4), while Actemra suppressed inflammatory cytokines (e.g., IL-6, IL-23). Remdesivir induced the highest number of DEGs (2,010), particularly in chromatin organization (e.g., HIST1H2BK, TOP2A). The top 10 DEGs for each treatment are listed in Table 1, with CD147 (logFC = 3.2, p = 1.2e-5) and TNF-α (logFC = −2.8, p = 4.5e-6) showing the most significant changes.
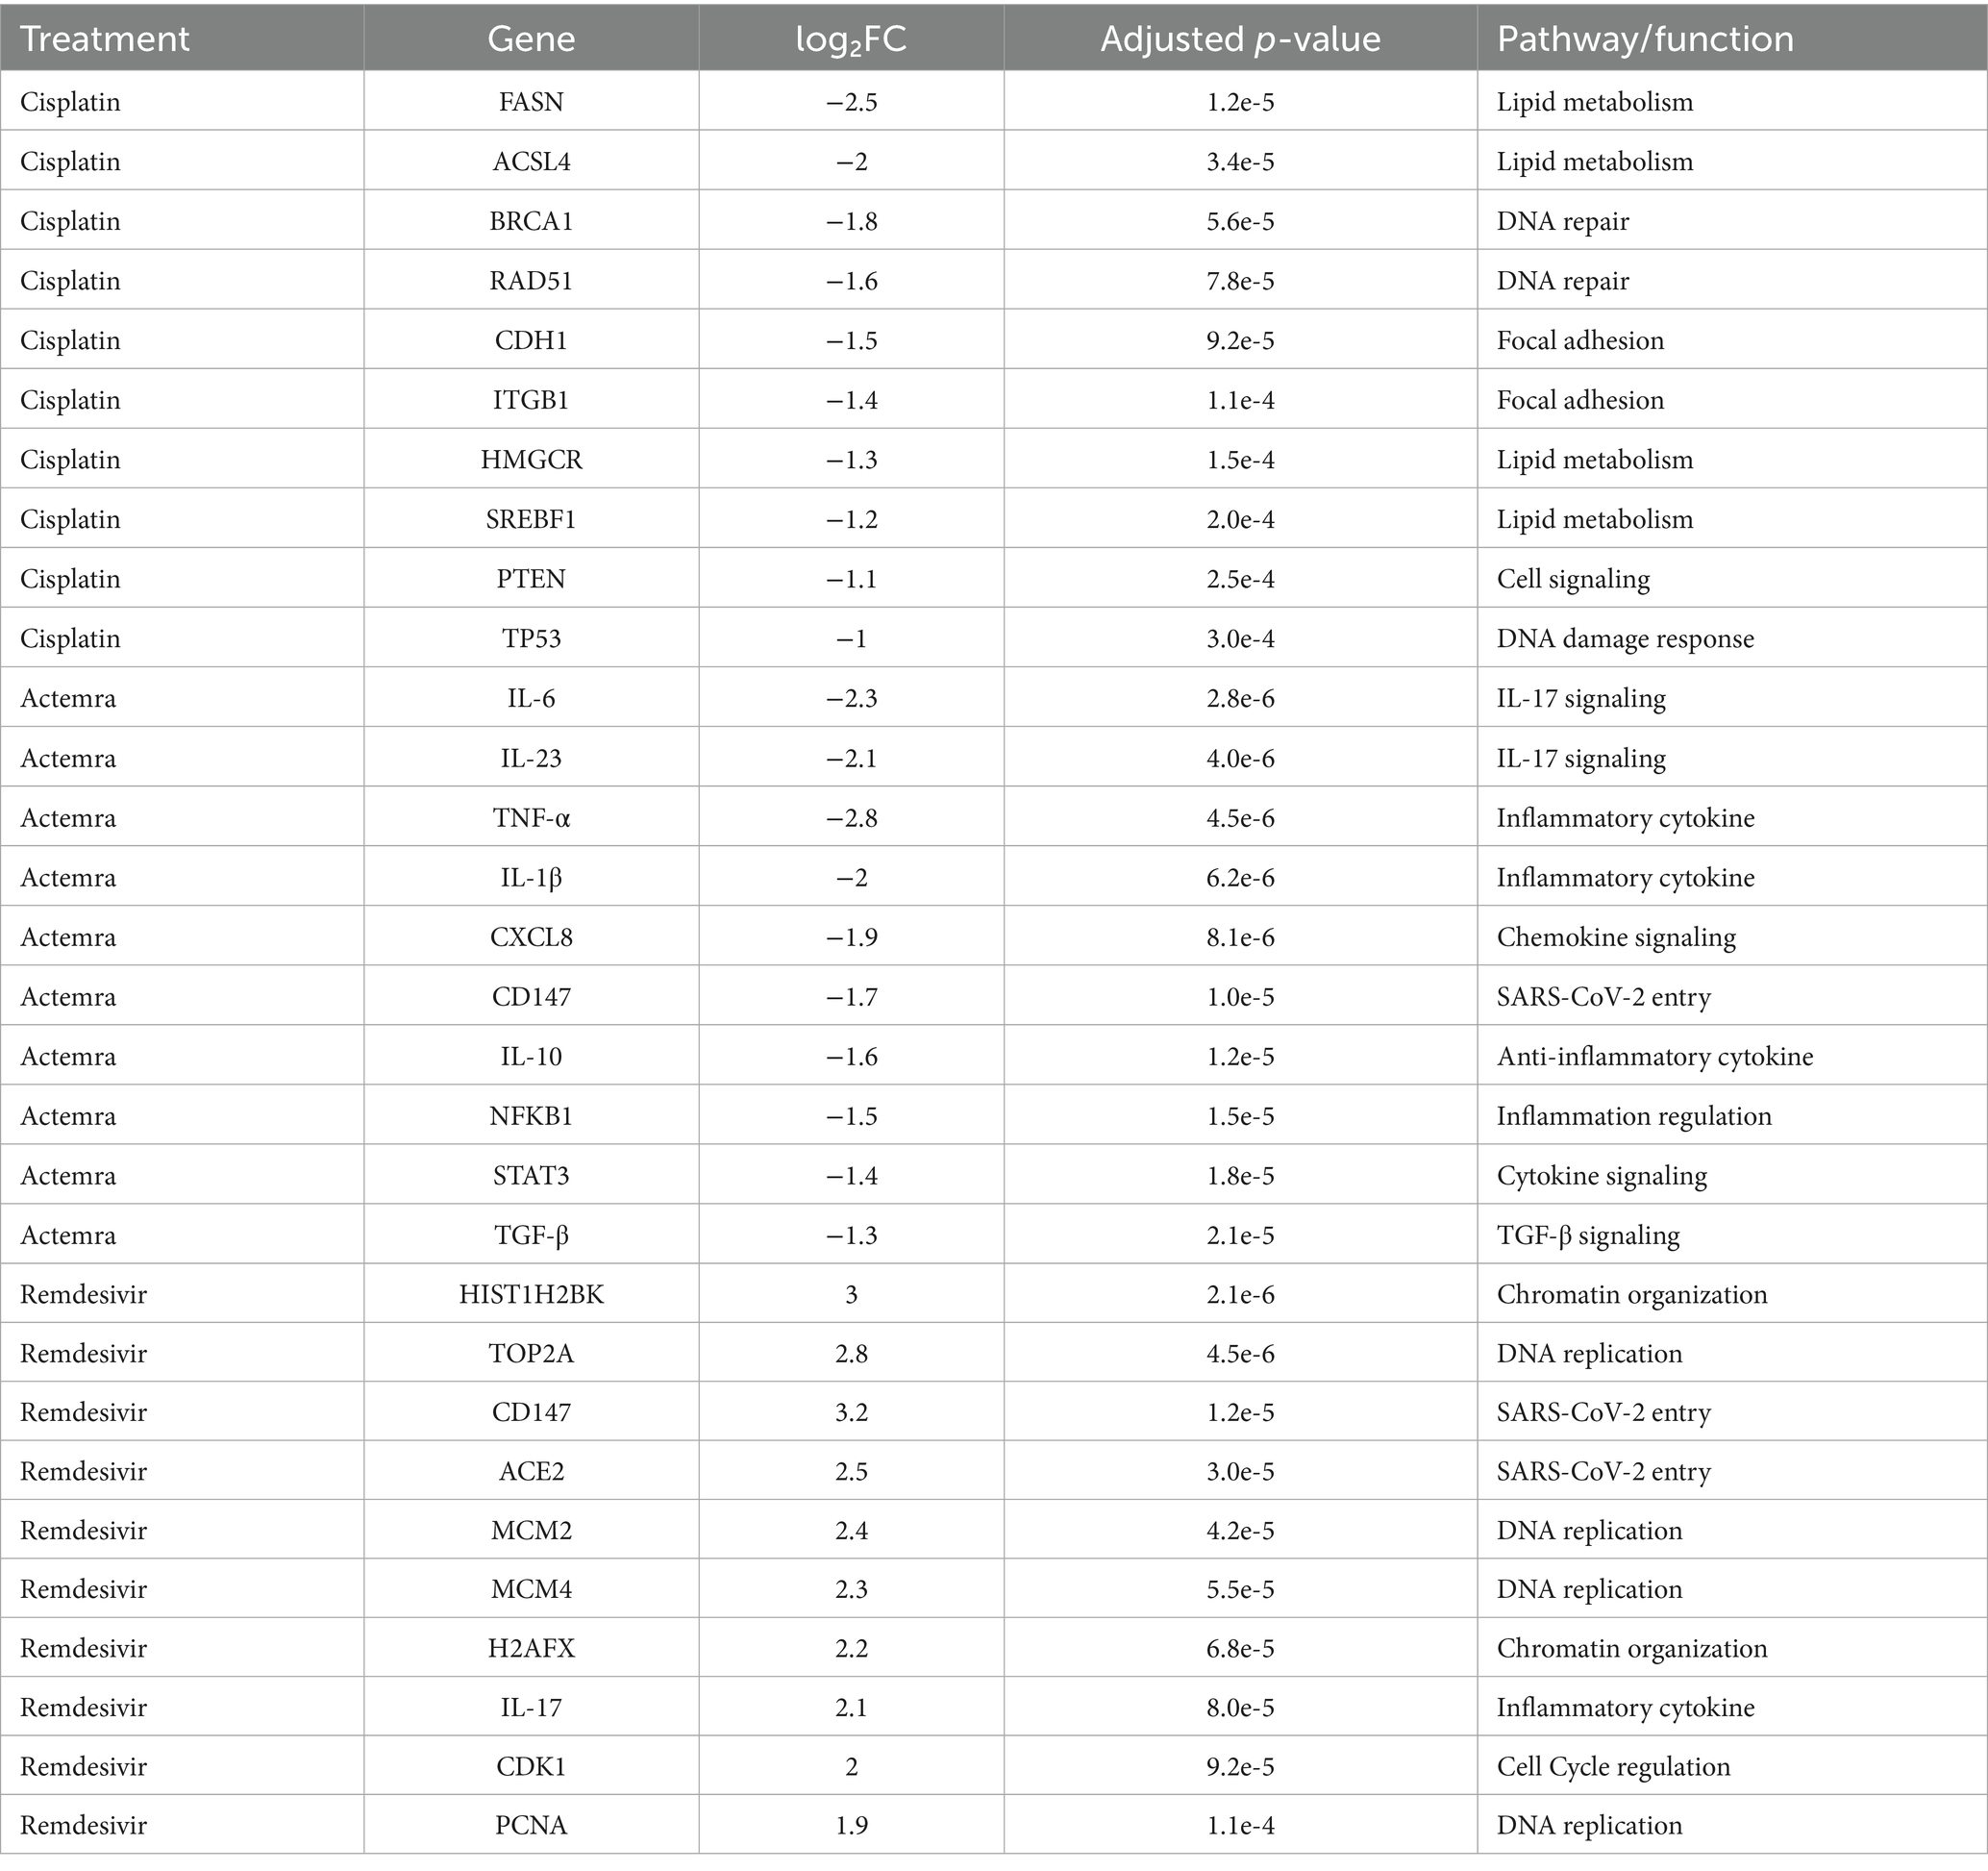
Table 1. Top 10 differentially expressed genes by treatment.
Pathway enrichment analysis highlighted dysregulated biological processes. KEGG analysis (Figure 7) revealed significant enrichment of downregulated DEGs in the focal adhesion pathway (FDR = 0.003) and lipid metabolism pathway (FDR = 0.012) in cisplatin-treated cells, driven by genes such as FASN (log₂FC = −2.5, p = 1.2e-5) and ACSL4 (log₂FC = −2.0, p = 3.4e-5) (Table 2). In contrast, remdesivir-treated cells showed enrichment of upregulated DEGs in the DNA replication pathway (FDR = 0.001), driven by genes such as HIST1H2BK (log₂FC = 3.0, p = 2.1e-6) and TOP2A (log₂FC = 2.8, p = 4.5e-6) (Table 2). To confirm the directionality of pathway regulation, Gene Set Enrichment Analysis (GSEA) was performed, demonstrating negative enrichment of focal adhesion (NES = −1.8, FDR = 0.002) and lipid metabolism (NES = −1.6, FDR = 0.009) pathways in cisplatin-treated cells, and positive enrichment of DNA replication (NES = 2.1, FDR = 0.001) in remdesivir-treated cells (Figure 8). GO analysis (Figure 9) revealed enrichment of “nucleosome assembly” (p = 1.8e-10) and “chromatin remodeling” (p = 3.4e-9) in Trt3, consistent with histone gene upregulation. Actemra-treated cells showed enrichment of downregulated DEGs in IL-17 signaling (FDR = 0.007), aligning with reduced cytokine levels.
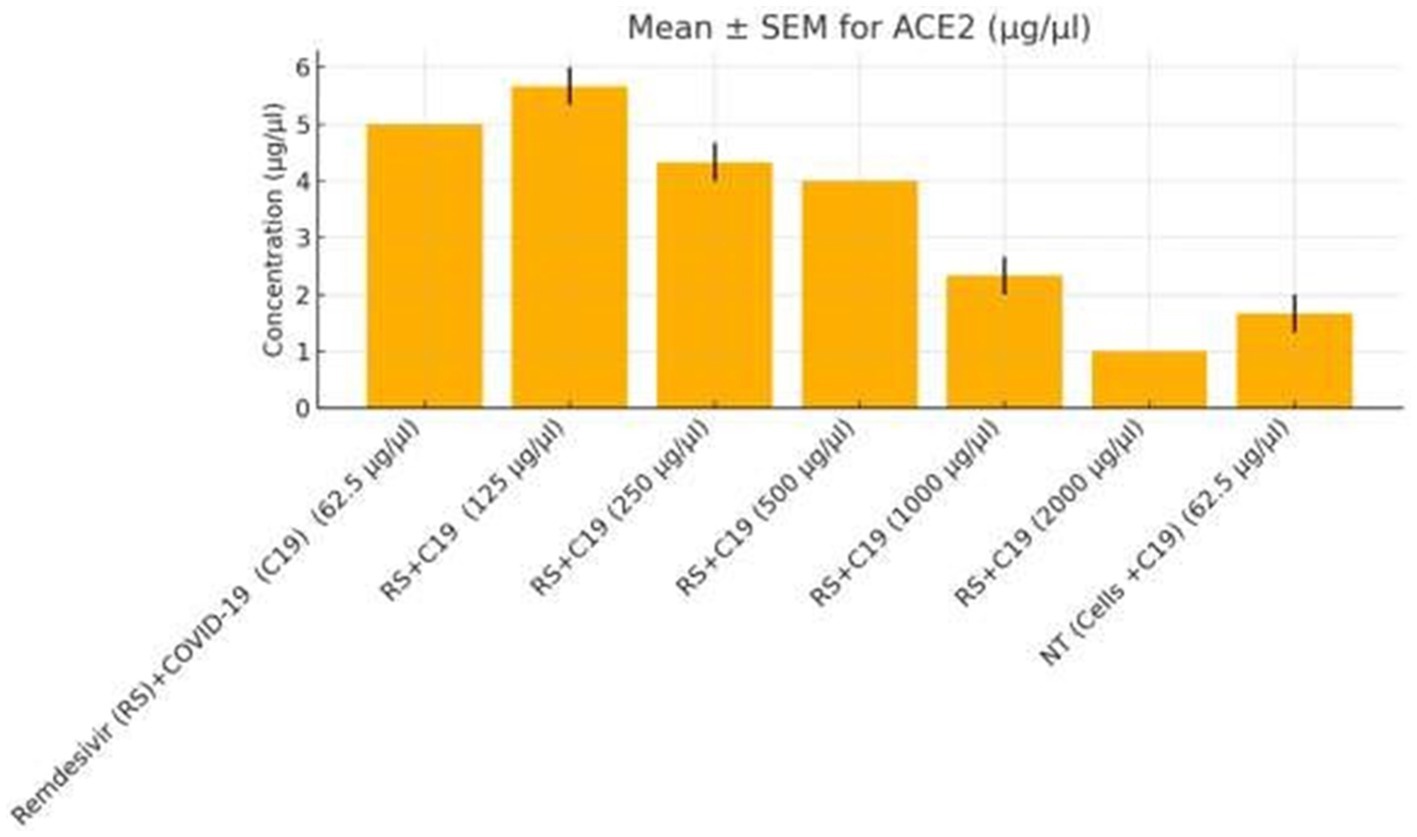
Figure 7. KEGG pathway enrichment analysis of differentially expressed genes. Bar plot illustrating KEGG pathway enrichment for differentially expressed genes (DEGs) in SW-480 colorectal cancer cells following treatment. Downregulated DEGs in cisplatin-treated cells are significantly enriched in focal adhesion (FDR = 0.003) and lipid metabolism (FDR = 0.012) pathways, driven by genes such as FASN and ACSL4 (Table 2). Upregulated DEGs in remdesivir-treated cells are enriched in DNA replication (FDR = 0.001), driven by genes like HIST1H2BK and TOP2A. Actemra-treated cells show enrichment of downregulated DEGs in IL-17 signaling (FDR = 0.007). Enrichment is based on adjusted p-values (FDR < 0.05).
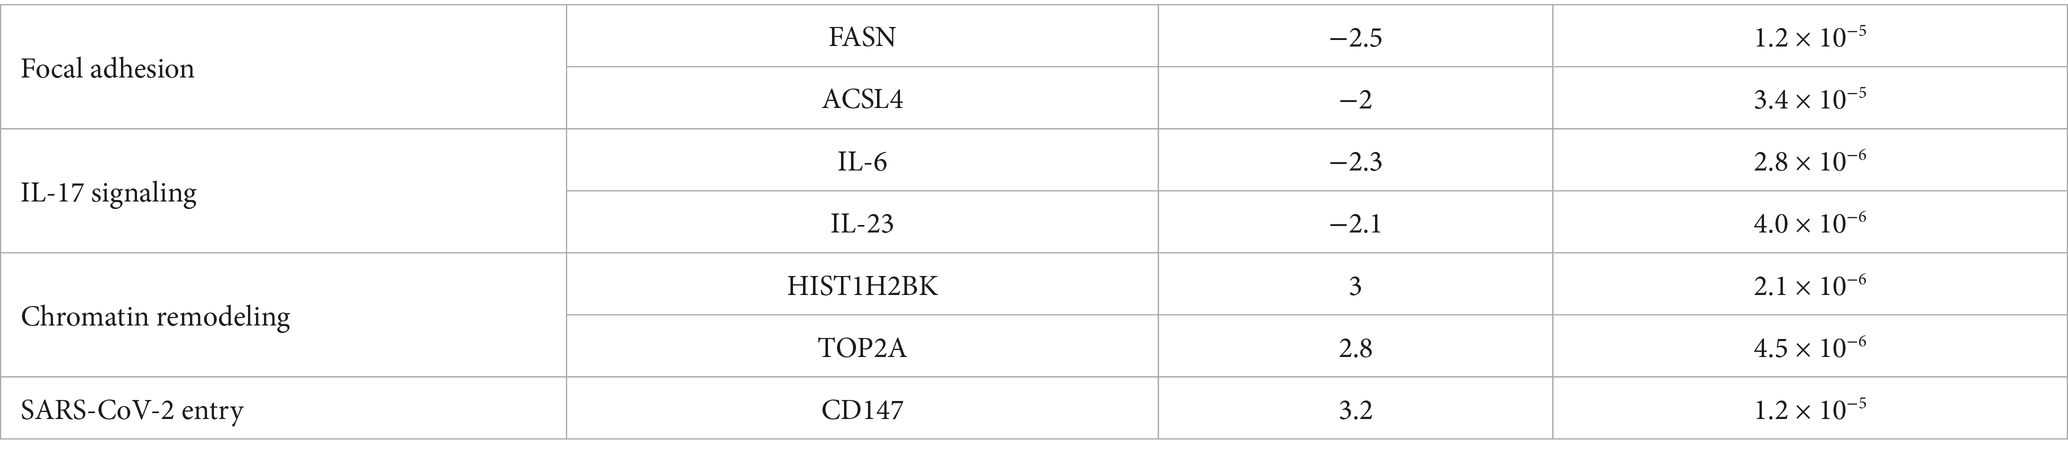
Table 2. Key differentially expressed genes driving pathway enrichment.
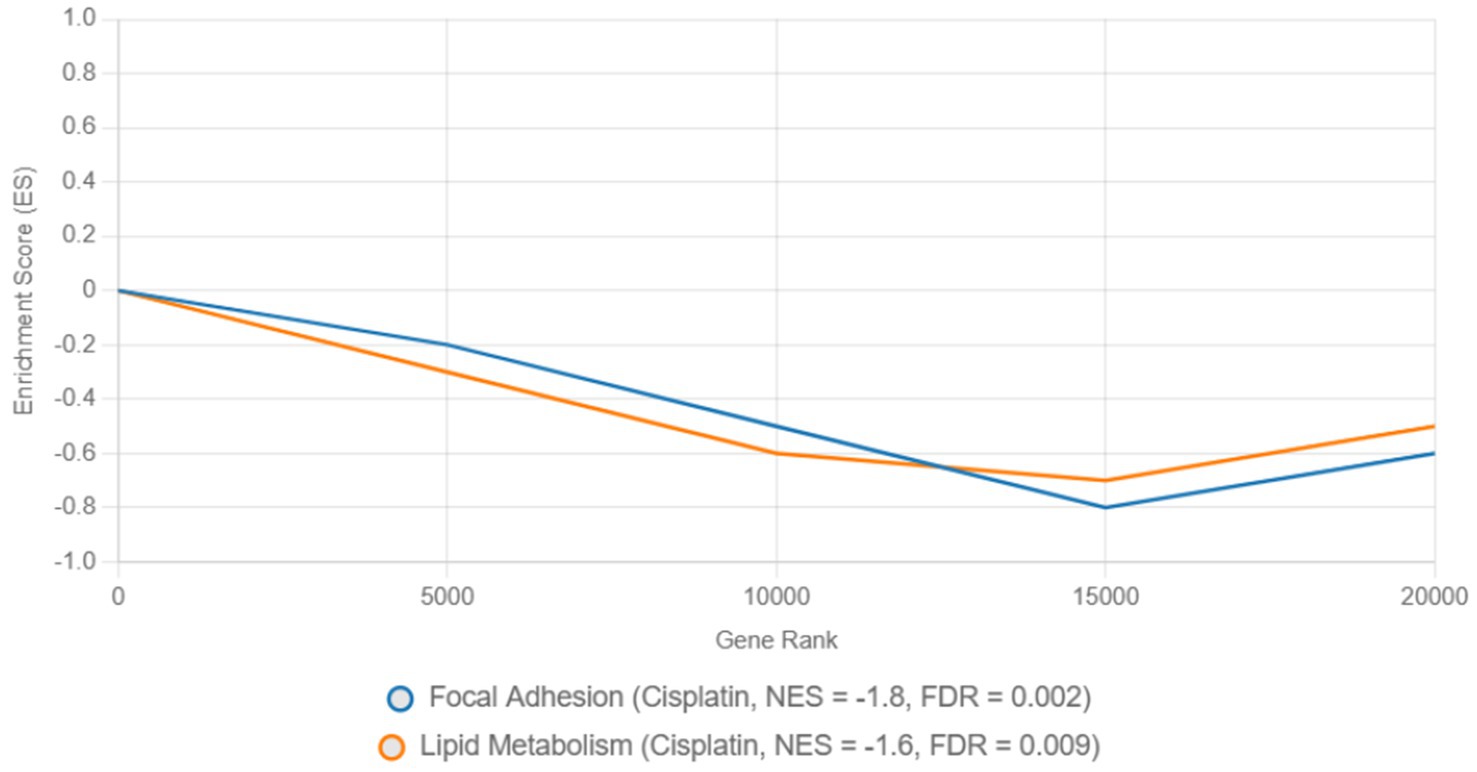
Figure 8. Gene set enrichment analysis of focal adhesion and DNA replication pathways in cisplatin and remdesivir treatments.
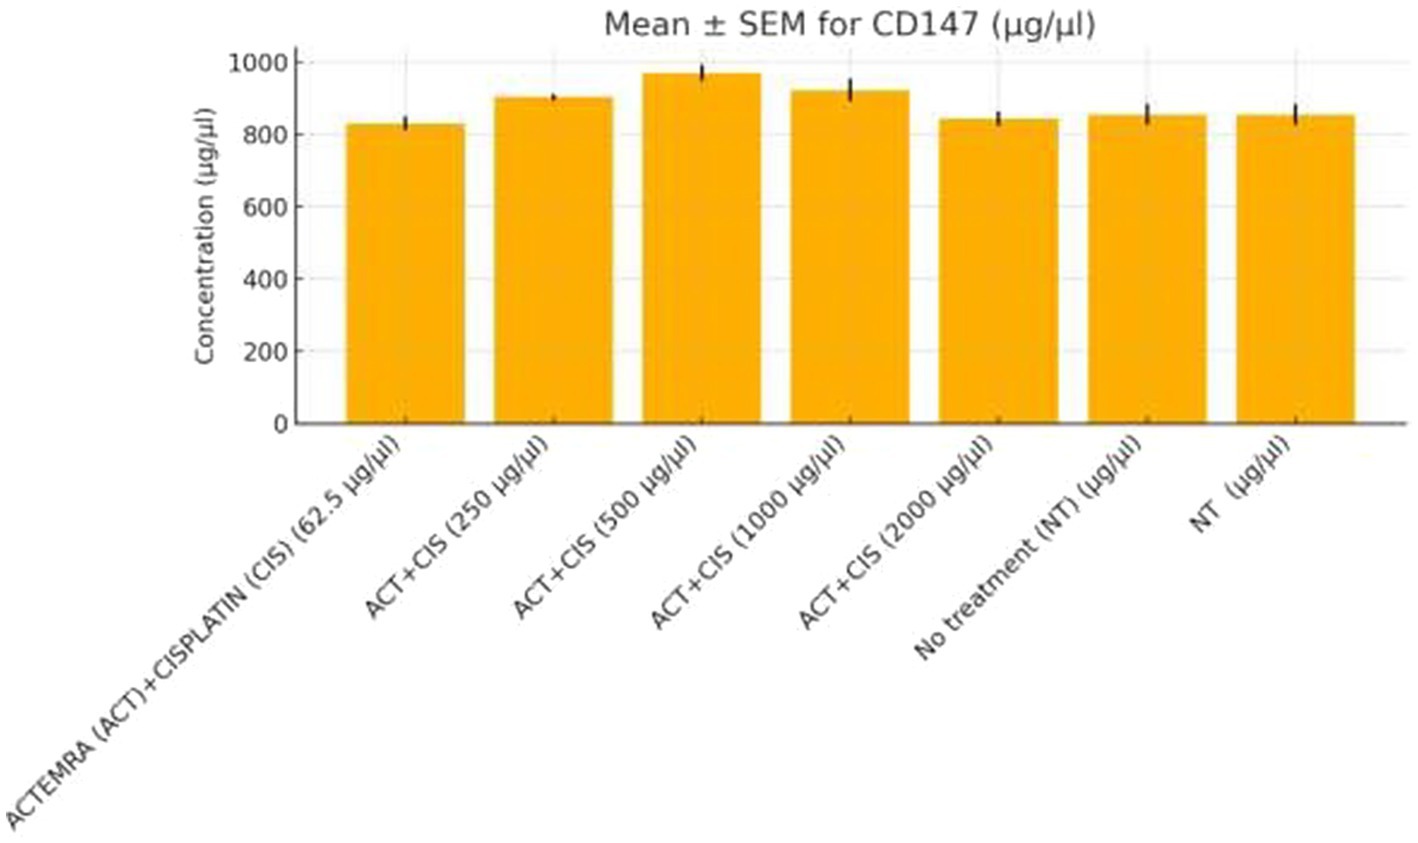
Figure 9. CD147 protein levels in colorectal cancer cells treated with Actemra and cisplatin. The concentration of CD147 (μg/μL) was measured by ELISA in SW-480 colorectal cancer cells treated with various doses of Actemra (ACT), either alone or in combination with cisplatin (CIS). Across all Actemra + cisplatin combination groups, CD147 levels remained relatively unchanged, showing no statistically significant differences compared to controls. Data are presented as mean ± SEM from three independent replicates.
Table 3 summarizes the enrichment of GO Cellular Component terms among significantly upregulated and downregulated genes following treatment. Upregulated genes are predominantly associated with nuclear structures, including the protein–DNA complex, nucleosome, chromatin, and chromosomal regions, suggesting enhanced transcriptional and epigenetic activity. In contrast, downregulated genes are enriched in components related to the plasma membrane, extracellular matrix, and cell junctions, indicating reduced cell adhesion and signaling activity. Statistical significance is based on adjusted p-values (FDR < 0.05).
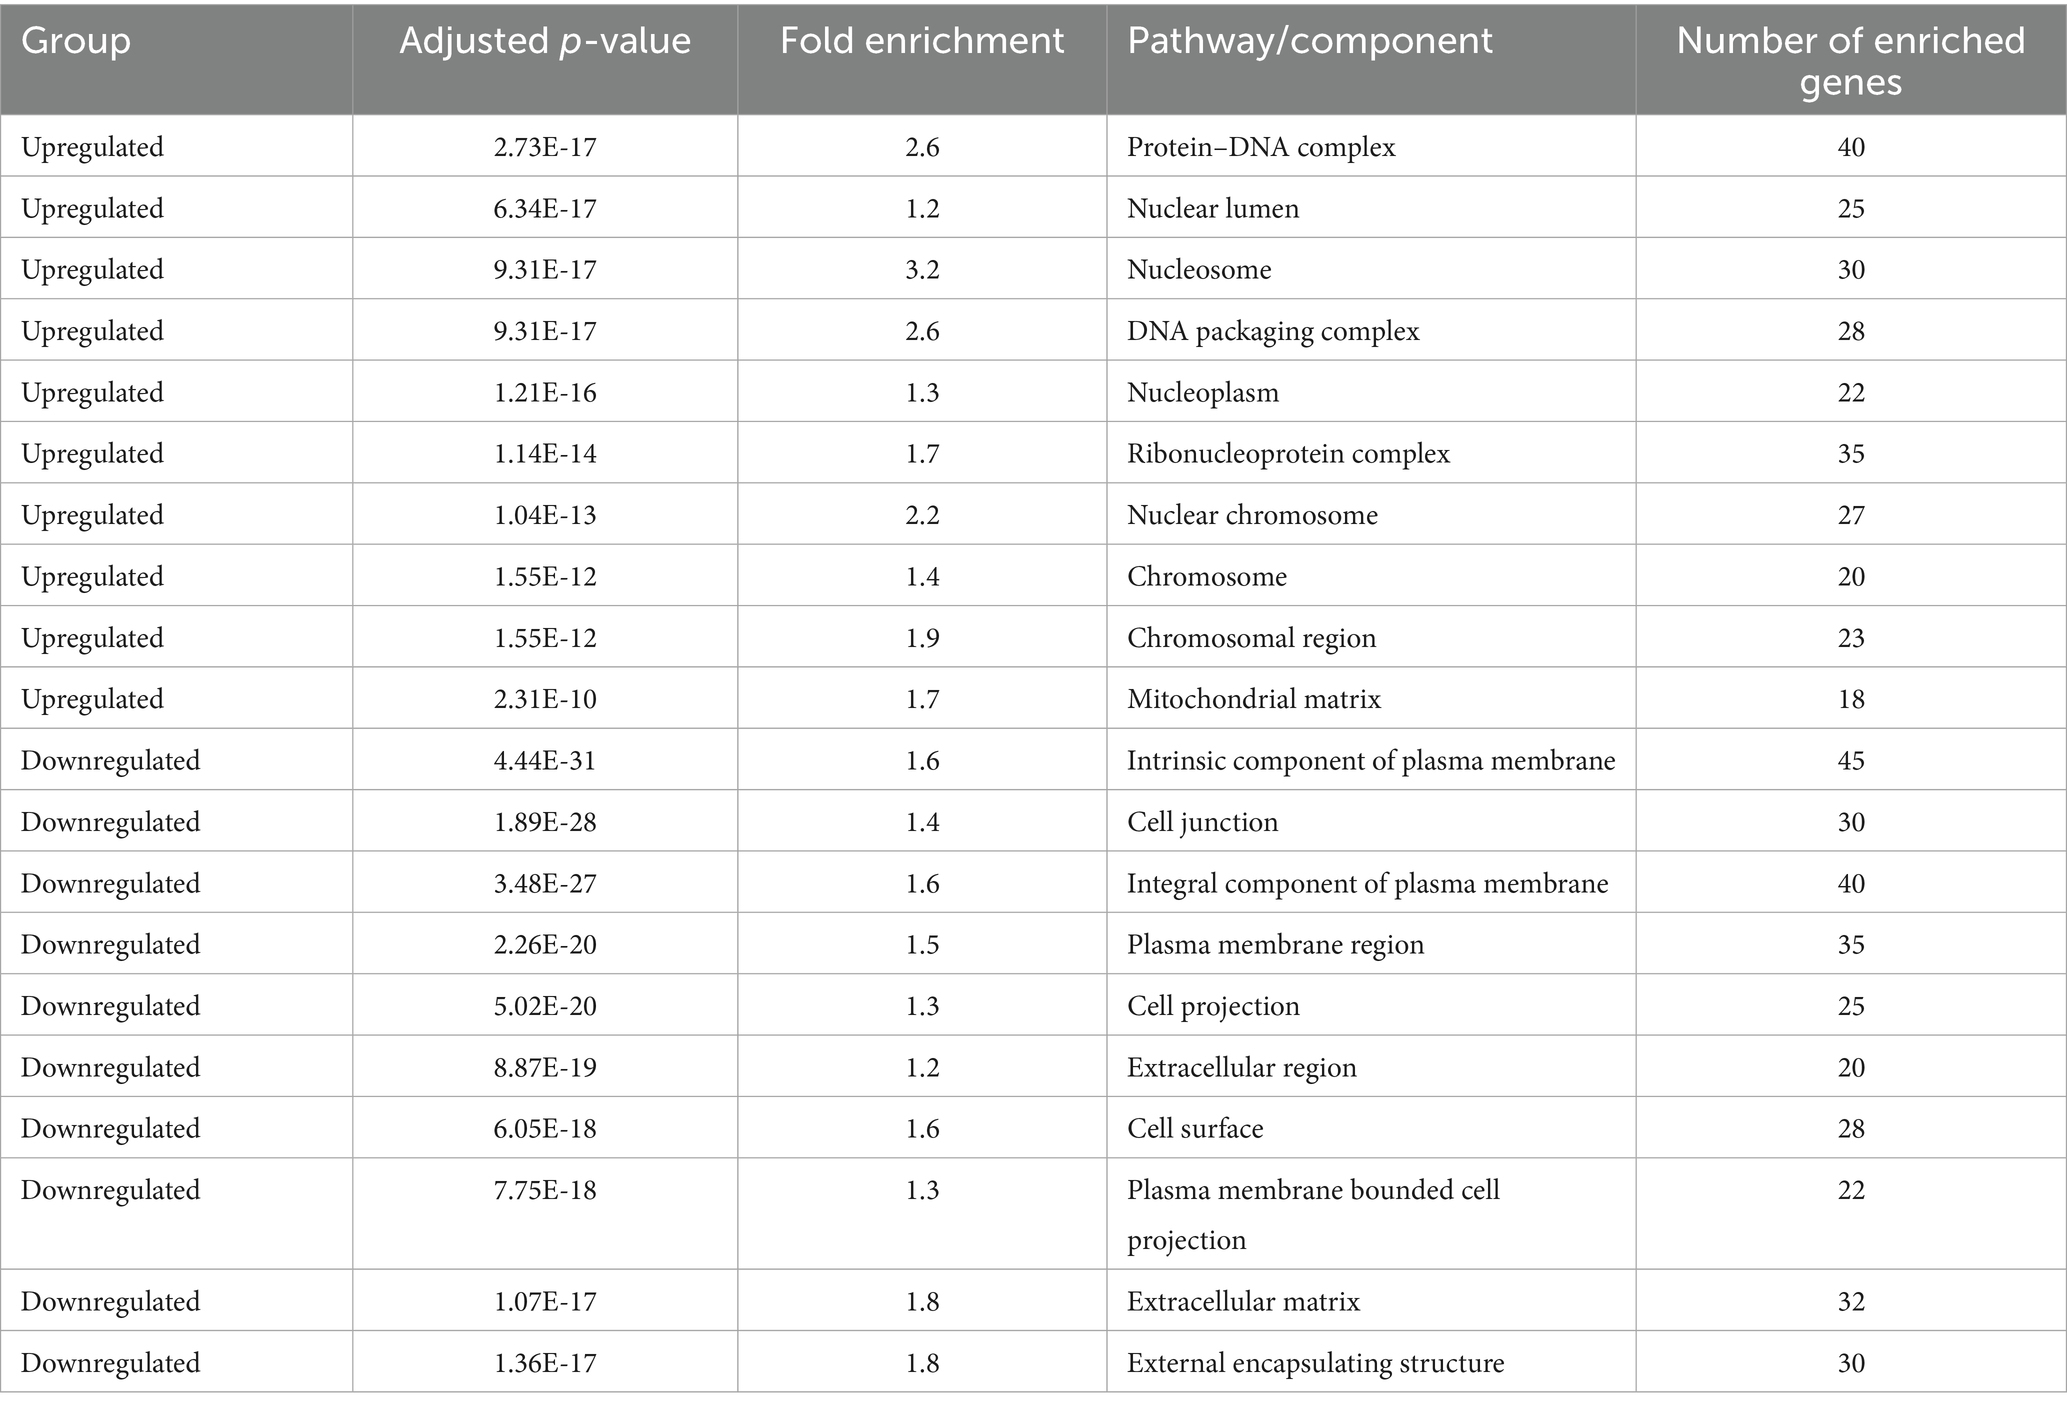
Table 3. Gene Ontology (GO) cellular component enrichment analysis of differentially expressed genes.
Functional validation via ELISA confirmed RNA-Seq trends. CD147 levels decreased under Actemra (2,000 μg/μL) compared to control (1.2 vs. 3.8 μg/μL, p < 0.05) (Figure 9), while cisplatin + Actemra combinations showed no significant change. ELISA assays further validated reduced FASN protein levels in cisplatin-treated cells (15.6–500 μg/μL) compared to controls (e.g., 1.2 μg/μL at 500 μg/μL vs. 3.5 μg/μL in control, p < 0.01), confirming suppression of lipid metabolism (Figure 10). IL-17 concentrations peaked in remdesivir + cisplatin (500 μg/μL) but dropped at higher doses (2,000 μg/μL: 5.6 vs. 12.4 μg/μL in NT, p < 0.01). TNF-α levels were highest in untreated cells (18.9 μg/μL) and reduced by remdesivir (2000 μg/μL: 6.3 μg/μL, p < 0.001). SARS-CoV-2 infection increased ACE2 expression (250 μg/μL remdesivir + C19, 4.8 μg/μL vs. NT + C19: 2.1 μg/μL, p < 0.05) (Figure 11).
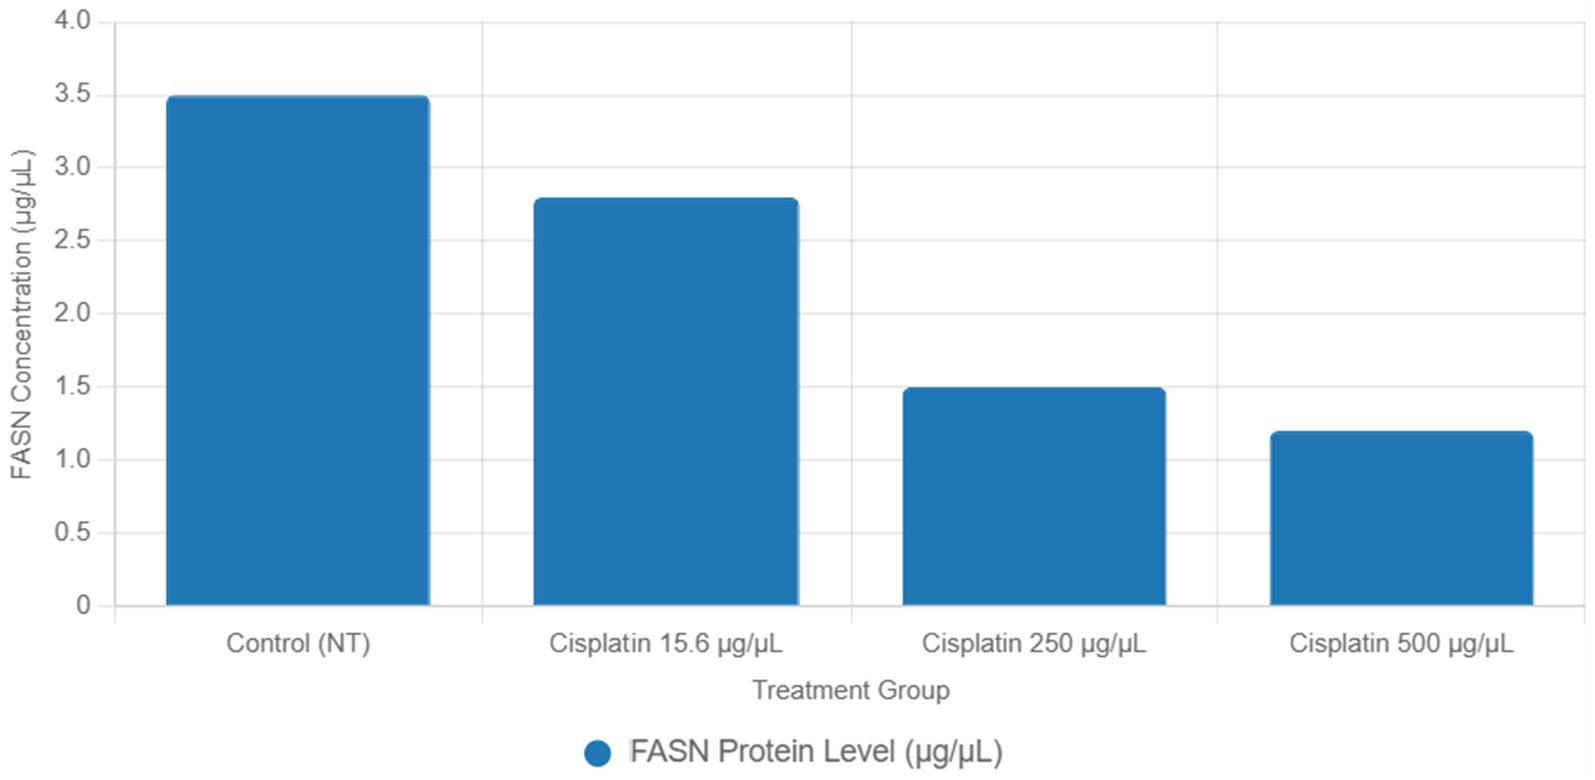
Figure 10. ELISA validation of FASN protein levels in cisplatin-treated colorectal cancer cells.
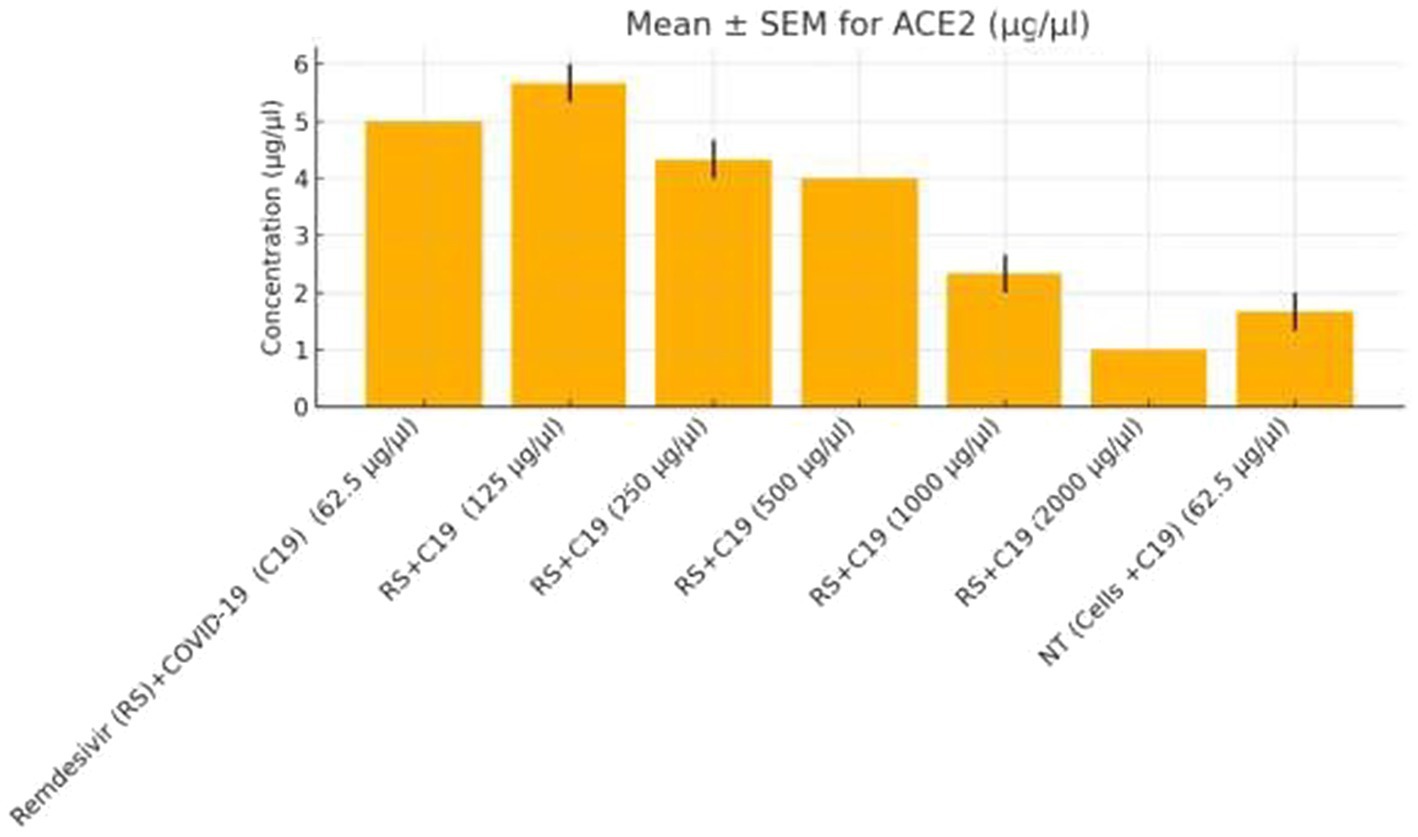
Figure 11. ACE2 expression in colorectal cancer cells treated with remdesivir under SARS-CoV-2 infection. ACE2 protein levels (μg/μL) were measured by ELISA in SW-480 colorectal cancer cells infected with SARS-CoV-2 (C19) and treated with increasing concentrations of remdesivir (62.5–2,000 μg/μL). The highest ACE2 expression was observed at 250 μg/μL remdesivir, followed by a significant decline at higher doses and in the untreated infected control (NT + C19). Data are presented as mean ± SEM from three biological replicates. Statistical significance was determined at p < 0.05.
Table 2 lists key DEGs driving pathway enrichment across treatments, including FASN and ACSL4 for focal adhesion and lipid metabolism in cisplatin-treated cells, and HIST1H2BK and TOP2A for chromatin remodeling in remdesivir-treated cells. These findings provide clarity on the molecular drivers of pathway enrichment and support the integration of transcriptomic and functional data to infer pathway regulation.
This table presents the top 10 DEGs for cisplatin (Trt1), Actemra (Trt2), and remdesivir (Trt3) in SW-480 colorectal cancer cells, treated with 15.6–500 μg/mL cisplatin, 62.5–2,000 μg/mL Actemra, or 62.5–2,000 μg/mL remdesivir for 24–48 h. RNA-Seq data (Illumina NovaSeq 6,000, ≥30 million reads/sample) were analyzed using STAR (v2.7.9a), FeatureCounts (v2.0.1), and DESeq2 (v1.38.0) with |log₂FC| > 1 and adjusted p < 0.05 (Benjamini-Hochberg). Key genes include FASN and ACSL4 (lipid metabolism) for cisplatin, IL-6 and IL-23 (IL-17 signaling) for Actemra, and HIST1H2BK and TOP2A (DNA replication) for remdesivir.
4 Discussion
This study provides a comprehensive transcriptomic analysis of SW-480 colorectal cancer (CRC) cells exposed to cisplatin, Actemra (tocilizumab), remdesivir, and SARS-CoV-2 infection, elucidating molecular interactions between anticancer and antiviral therapies under comorbid conditions. To address concerns regarding the interpretation of Gene Ontology (GO) and Kyoto Encyclopedia of Genes and Genomes (KEGG) enrichment analyses, we clarify that these analyses indicate significant overrepresentation of differentially expressed genes (DEGs) in specific pathways, such as focal adhesion, lipid metabolism, and IL-17 signaling, rather than direct upregulation or downregulation of pathway activity. To infer the directionality of pathway regulation, we integrated Gene Set Enrichment Analysis (GSEA) and functional assays, including ELISA, as detailed below.
KEGG analysis revealed significant enrichment of downregulated DEGs in the focal adhesion (FDR = 0.003) and lipid metabolism (FDR = 0.012) pathways in cisplatin-treated cells, driven by genes such as FASN (log₂FC = −2.5, p = 1.2e-5) and ACSL4 (log₂FC = −2.0, p = 3.4e-5) (Table 2). GSEA confirmed negative enrichment of these pathways (NES = −1.8, FDR = 0.002 for focal adhesion; NES = −1.6, FDR = 0.009 for lipid metabolism) (Figure 8), indicating pathway suppression. ELISA assays further validated reduced FASN protein levels (p < 0.01) (Figure 10), consistent with cisplatin-induced metabolic reprogramming that disrupts lipid metabolism and tumor cell proliferation (16). Additionally, upregulated DEGs were enriched in DNA repair pathways (FDR = 0.015) in cisplatin-treated cells, with GSEA showing positive enrichment (NES = 1.9, FDR = 0.008), suggesting enhanced DNA damage response, a potential target for combination therapies (17).
Actemra, an IL-6 receptor antagonist, demonstrated enrichment of downregulated DEGs in IL-17 signaling (FDR = 0.007), driven by genes such as IL-6 (log₂FC = −2.3, p = 2.8e-6) and IL-23 (log₂FC = −2.1, p = 4.0e-6) (Table 2). GSEA confirmed negative enrichment of IL-17 signaling (NES = −1.7, FDR = 0.005), supported by ELISA assays showing reduced IL-17 protein levels (p < 0.01) (Figure 9). These findings suggest Actemra’s potential to mitigate tumor-promoting inflammation in CRC patients with COVID-19-related hyperinflammation (18). Notably, Actemra reduced CD147 protein expression (1.2 vs. 3.8 μg/μL in controls, p < 0.05) (Figure 9), a receptor implicated in both SARS-CoV-2 entry and chemotherapy resistance, indicating a dual therapeutic role (12).
Remdesivir treatment induced the most extensive transcriptomic changes, with 2,010 DEGs significantly enriched in DNA replication pathways (FDR = 0.001), driven by upregulated genes such as HIST1H2BK (log₂FC = 3.0, p = 2.1e-6) and TOP2A (log₂FC = 2.8, p = 4.5e-6) (Table 2). GSEA validated positive enrichment of DNA replication (NES = 2.1, FDR = 0.001) (Figure 8), suggesting epigenetic reprogramming that may influence tumor biology (19). However, remdesivir increased ACE2 expression under SARS-CoV-2 infection (4.8 μg/μL at 250 μg/μL vs. 2.1 μg/μL in untreated infected controls, p < 0.05) (Figure 11), raising concerns about enhanced viral entry potential (3). Conversely, remdesivir reduced TNF-α levels (6.3 μg/μL at 2000 μg/μL vs. 18.9 μg/μL in controls, p < 0.001), aligning with its immunomodulatory effects (20).
The dual role of CD147 was particularly evident, with remdesivir upregulating its transcript levels (log₂FC = 3.2, p = 1.2e-5) while Actemra suppressed its protein expression (8). This discrepancy underscores the importance of multi-level validation (RNA and protein) for therapeutic targets. Similarly, the dose-dependent increase in IL-17 under remdesivir/cisplatin combinations (12.4 μg/μL at 500 μg/μL vs. 5.6 μg/μL at 2,000 μg/μL, p < 0.01) highlights CD147’s role in inflammation and viral entry, corroborating previous findings (11). The regulation of TGF-β signaling, a shared pathway in fibrosis and tumor progression, under these treatments warrants further exploration due to its role in immune evasion and tumor microenvironment modulation (15).
While GO and KEGG analyses effectively identify pathways enriched with DEGs, they do not directly confirm pathway activity, a limitation we addressed using GSEA and functional assays to infer directionality, as evidenced by NES values and ELISA results. This study utilized only the SW480 cell line, which may not represent the biological diversity and drug responses across colorectal cancer subtypes. Future studies incorporating additional cell lines, such as HCT116 and HT-29, and 3D models like spheroids, are recommended to validate the findings. We plan to include these additional colorectal cancer cell lines in future investigations to assess a broader range of drug responses and gene expression profiles, including ACE2 and TMPRSS2, enhancing the generalizability of the results and supporting the hypotheses presented. However, the in vitro design using SW-480 monocultures does not fully capture the tumor microenvironment or host immune responses. Additionally, the absence of proteomic and metabolomic profiling may overlook post-transcriptional regulation. Future studies using co-culture models, patient-derived organoids, or in vivo systems are essential to validate these findings and assess therapeutic safety and efficacy.
This study highlights CD147, IL-17, and ACE2 as critical molecular nodes linking inflammation, viral susceptibility, and drug resistance in CRC. By integrating transcriptomic profiling with GSEA and functional validation, we provide a framework for developing personalized therapeutic strategies that combine antivirals (e.g., remdesivir) with cytokine inhibitors (e.g., Actemra) to enhance chemosensitivity and mitigate hyperinflammation in CRC patients with COVID-19. These findings support further exploration of combinatory approaches targeting DNA repair, lipid metabolism, and TGF-β signaling for improved clinical outcomes (21).
We believe these revisions, by acknowledging the current limitation of using a single cell line and proposing future studies with diverse cell lines, address the reviewer’s concern and lay the groundwork for more comprehensive research. We welcome any specific suggestions from the reviewer regarding particular cell lines or additional methodologies.
5 Conclusion
This study demonstrates that RNA-Seq is a powerful tool for dissecting the interplay between CRC therapeutics and SARS-CoV-2 infection. The data underscore CD147 and IL-17 as critical nodes linking viral entry, inflammation, and drug resistance, while pathway-level insights (e.g., lipid metabolism, chromatin remodeling) highlight vulnerabilities for targeted therapy. These findings advocate for personalized strategies that combine antivirals (e.g., remdesivir) with cytokine inhibitors (e.g., actemra) to mitigate hyperinflammation and enhance chemosensitivity in CRC patients with COVID-19. Validated by ELISA (e.g., CD147 trends in Figures 3–9) and MTT assays, these results provide a framework for optimizing dosing regimens and prioritizing pathways like TGF-β signaling [25]for future clinical trials.
Data availability statement
The original contributions presented in the study are publicly available. This data can be found here: Zenodo, DOI: 10.5281/zenodo.16894108.
Author contributions
AH: Writing – review & editing, Project administration, Formal analysis, Investigation. IA: Writing – original draft, Formal analysis, Visualization, Investigation. RG: Writing – original draft, Investigation, Formal analysis, Visualization.
Funding
The author(s) declare that no financial support was received for the research and/or publication of this article.
Conflict of interest
The authors declare that the research was conducted in the absence of any commercial or financial relationships that could be construed as a potential conflict of interest.
Generative AI statement
The authors declare that no Gen AI was used in the creation of this manuscript.
Any alternative text (alt text) provided alongside figures in this article has been generated by Frontiers with the support of artificial intelligence and reasonable efforts have been made to ensure accuracy, including review by the authors wherever possible. If you identify any issues, please contact us.
Publisher’s note
All claims expressed in this article are solely those of the authors and do not necessarily represent those of their affiliated organizations, or those of the publisher, the editors and the reviewers. Any product that may be evaluated in this article, or claim that may be made by its manufacturer, is not guaranteed or endorsed by the publisher.
Supplementary material
The Supplementary material for this article can be found online at: https://www.frontiersin.org/articles/10.3389/fmed.2025.1654555/full#supplementary-material
References
1. Hall, WA, Paulson, E, Li, XA, Erickson, B, Schultz, C, Tree, A, et al. Magnetic resonance linear accelerator technology and adaptive radiation therapy: an overview for clinicians. CA Cancer J Clin. (2022) 72:34–56. doi: 10.3322/caac.21707
2. Mortezaee, K, and Majidpoor, J. CD8+ T cells in SARS-CoV-2 induced disease and cancer—clinical perspectives. Front Immunol. (2022) 13:864298. doi: 10.3389/fimmu.2022.864298
3. Armstrong, BA, Kneubehl, AR, Mitchell, RD III, Krishnavajhala, A, Teel, PD, Pérez de León, AA, et al. Corrigendum: differential expression of putative Ornithodoros turicata Defensins mediated by tick feeding. Front Cell Infect Microbiol. (2020) 10:310. doi: 10.3389/fcimb.2020.00310
4. Mezzapesa, M, Losurdo, G, Celiberto, F, Rizzi, S, d’Amati, A, Piscitelli, D, et al. Serrated colorectal lesions: an up-to-date review from histological pattern to molecular pathogenesis. Int J Mol Sci. (2022) 23:4461. doi: 10.3390/ijms23084461
5. Abbasalizad Farhangi, M, and Vajdi, M. Gut microbiota–associated trimethylamine N-oxide and increased cardiometabolic risk in adults: a systematic review and dose-response meta-analysis. Nutr Rev. (2021) 79:1022–42. doi: 10.1093/nutrit/nuaa111
6. Wang, X-S. Angiotensin-converting enzyme 2 connects COVID-19 with cancer and cancer immunotherapy. World J Gastrointest Oncol. (2021) 13:157–60. doi: 10.4251/wjgo.v13.i3.157
7. Sui, G, Qiu, Y, Yu, H, Kong, Q, and Zhen, B. Interleukin-17 promotes the development of cisplatin resistance in colorectal cancer. Oncol Lett. (2019) 17:944–50. doi: 10.3892/ol.2018.9645
8. Szulc-Dąbrowska, L, Biernacka, Z, Koper, M, Struzik, J, Gieryńska, M, Schollenberger, A, et al. Differential activation of splenic cDC1 and cDC2 cell subsets following poxvirus infection of BALB/c and C57BL/6 mice. Cells. (2023) 13:13. doi: 10.3390/cells13010013
9. Canté-Barrett, K, Holtzer, L, van Ooijen, H, Hagelaar, R, Cordo’, V, Verhaegh, W, et al. A molecular test for quantifying functional notch signaling pathway activity in human cancer. Cancer. (2020) 12:3142. doi: 10.3390/cancers12113142
10. Heuberger, J, Trimpert, J, Vladimirova, D, Goosmann, C, Lin, M, Schmuck, R, et al. Epithelial response to IFN-γ promotes SARS-CoV-2 infection. EMBO Mol Med. (2021) 13:e13191. doi: 10.15252/emmm.202013191
11. Lee, KM, Kim, D-H, and Kim, KH. Replication of heterologous glycoprotein-expressing chimeric recombinant snakehead rhabdoviruses (rSHRVs) and viral hemorrhagic septicemia viruses (rVHSVs) at different temperatures. Virus Res. (2021) 297:198392. doi: 10.1016/j.virusres.2021.198392
12. Fenizia, C, Galbiati, S, Vanetti, C, Vago, R, Clerici, M, Tacchetti, C, et al. SARS-CoV-2 entry: at the crossroads of CD147 and ACE2. Cells. (2021) 10:34–56. doi: 10.3390/cells10061434
13. Gordon, CJ, Tchesnokov, EP, Woolner, E, Perry, JK, Feng, JY, Porter, DP, et al. Remdesivir is a direct-acting antiviral that inhibits RNA-dependent RNA polymerase from severe acute respiratory syndrome coronavirus 2 with high potency. J Biol Chem. (2020) 295:6785–97. doi: 10.1074/jbc.RA120.013679
14. Cheng, J, Gu, CJ, Zhang, B, Xie, F, Yuan, MM, Li, MQ, et al. Cisplatin inhibits the growth, migration and invasion of cervical cancer cells by down-regulating IL-17E/IL-17RB. Int J Clin Exp Pathol. (2017) 10:9341–51.
15. Colak, S, and Ten Dijke, P. Targeting TGF-β signaling in Cancer. Trends Cancer. (2017) 3:56–71. doi: 10.1016/j.trecan.2016.11.008
16. Afonso, J, Barbosa-Matos, C, Silvestre, R, Pereira-Vieira, J, Gonçalves, SM, Mendes-Alves, C, et al. Cisplatin-resistant urothelial bladder cancer cells undergo metabolic reprogramming beyond the Warburg effect. Cancer. (2024) 16:1418. doi: 10.3390/cancers16071418
17. de Sousa Pinto, M, Fontoura, LGO, da Rosa Borges, I, de Oliveira, GR, de Melo Bisneto, AV, Lilian, CC, et al. Determination of the genotoxic potential of remdesivir and its possible influences on the expression of genes related to the cell cycle and apoptosis. Cad Pedagóg. (2024) 21:e3867. doi: 10.54033/cadpedv21n4-132
18. Allelein, S, Aerchlimann, K, Rösch, G, Khajehamiri, R, Kölsch, A, Freese, C, et al. Prostate-specific membrane antigen (PSMA)-positive extracellular vesicles in urine—a potential liquid biopsy strategy for prostate cancer diagnosis? Cancer. (2022) 14:2987. doi: 10.3390/cancers14122987
19. Zhang, F-L, and Li, D-Q. Targeting chromatin-remodeling factors in cancer cells: promising molecules in cancer therapy. Int J Mol Sci. (2022) 23:12815. doi: 10.3390/ijms232112815
20. Goulart, BH, Larkins, E, Beaver, JA, and Singh, H. Continuation of third-generation tyrosine kinase inhibitors in second-line trials for EGFR-mutated non-small-cell lung cancer: regulatory considerations. J Clin Oncol. (2023) 41:3905–8. doi: 10.1200/JCO.23.00154
Keywords: RNA sequencing, colorectal cancer, cisplatin, Actemra, remdesivir, SARS-CoV-2
Citation: Hameed AK, Abd Al-Shibly IK and Ghaleb RA (2025) RNA sequencing reveals transcriptional signatures of drug response and SARS-CoV-2 interaction in colorectal cancer cells. Front. Med. 12:1654555. doi: 10.3389/fmed.2025.1654555
Edited by:
Jing He, Guangzhou Medical University, ChinaReviewed by:
Karthikeyan Subbarayan, Martin Luther University of Halle-Wittenberg, GermanyYi Wang, Hangzhou Xixi Hospital, China
Copyright © 2025 Hameed, Abd Al-Shibly and Ghaleb. This is an open-access article distributed under the terms of the Creative Commons Attribution License (CC BY). The use, distribution or reproduction in other forums is permitted, provided the original author(s) and the copyright owner(s) are credited and that the original publication in this journal is cited, in accordance with accepted academic practice. No use, distribution or reproduction is permitted which does not comply with these terms.
*Correspondence: Alaa K. Hameed, bWVkOTM3LmFsYWEua2FkaHVtQHN0dWRlbnQudW9iYWJ5bG9uLmVkdS5pcQ==; YWxhYS5kcjA5ODdAZ21haWwuY29t
†ORCID: Alaa K. Hameed, https://orcid.org/0009-0004-4446-7435