 Kaat Van den Bruel1
 Myroslava Kulyk
 Kurt De Vlam
- 1Department of Rheumatology, University Hospitals Leuven, Leuven, Belgium
- 2Skeletal Biology and Engineering Research Center, Department of Development and Regeneration, Leuven, Belgium
Introduction: This systematic review aimed to evaluate the effects of specific diets, dietary supplements, and probiotics on disease activity, inflammation, and immune response in patients with rheumatoid arthritis (RA), axial spondyloarthritis (axSpA), and psoriatic arthritis (PsA).
Methods: A systematic literature search was conducted in PubMed, Embase, and the Cochrane Library. Randomized clinical trials (RCTs) of patients with RA, axSpA, or PsA undergoing dietary or nutritional interventions were included. Duplicates were removed using EndNote and Rayyan, and study quality was assessed with the Academy of Nutrition and Dietetics Quality Criteria Checklist for Primary Research. Outcomes of interest were changes in immune response, inflammatory biomarkers, and disease activity.
Results: From 2,250 screened articles, 49 studies met the inclusion criteria. In RA, vegan, anti-inflammatory, and Mediterranean diets improved disease activity, inflammation markers, and quality of life. For axSpA, evidence was limited, though supplementation with polyunsaturated fatty acids (PUFAs) showed potential benefits. Across conditions, nutritional supplements such as PUFAs, vitamin D, pomegranate extract, and ginger demonstrated anti-inflammatory and immunomodulatory effects. Probiotics and synbiotics had variable impacts, with synbiotics reducing interleukin-17 (IL-17) levels. In PsA, a hypocaloric diet supplemented with omega-3 fatty acids was associated with reduced disease activity.
Discussion: Dietary interventions and supplementation may support the management of chronic arthritis through modulation of inflammatory and immune pathways. However, due to heterogeneity in study designs, interventions, and outcomes, a meta-analysis was not feasible, and results were synthesized narratively. While findings suggest potential benefits as adjuncts to pharmacological treatment, further high-quality RCTs are required to confirm long-term clinical efficacy.
Systematic review registration: The systematic review is registered in PROSPERO under ID CRD420251010982. https://www.crd.york.ac.uk/PROSPERO/view/CRD420251010982.
1 Introduction
The global prevalence of chronic arthritis is increasing worldwide (1). While pharmacological treatments are well-established, the role of diet and nutrition in disease management remains underrecognized. Chronic arthritis, including rheumatoid arthritis (RA), psoriatic arthritis (PsA), and axial spondyloarthritis (axSpA), has a complex pathogenesis involving genetic predisposition, environmental factors, and immune system activation (2, 3). Diet can modulate the immune response by influencing gut microbiota composition, regulating inflammatory pathways, and altering the balance between pro-inflammatory and anti-inflammatory cytokines (3). Various dietary factors, such as processed foods and additives, can interfere with nutrient absorption, leading to anti-nutritional effects (4). Conversely, optimal nutrition may reduce or delay immune-mediated chronic diseases (5).
Anti-inflammatory diets are dietary patterns designed to reduce chronic inflammation by emphasizing the consumption of foods with anti-inflammatory properties, such as fruits, vegetables, whole grains, nuts, seeds, and fatty fish, while minimizing pro-inflammatory foods like processed foods, added sugars, and red meats (6). According to the systematic review by Genel et al. (7) the anti-inflammatory diet is hypothesized to alleviate symptoms of inflammatory conditions such as osteoarthritis and RA by reducing levels of inflammatory biomarkers, particularly C-reactive protein (CRP) and interleukin-6 (IL-6).
The Mediterranean diet (MD) is a well-researched dietary pattern characterized by high consumption of extra-virgin olive oil (EVOO), fruits, vegetables, nuts, legumes, whole grains, and moderate intake of fish and wine, which collectively contribute to its anti-inflammatory properties. EVOO, rich in polyphenols such as oleuropein and hydroxytyrosol, plays a key role in reducing oxidative stress, low-density lipoprotein (LDL) oxidation, and inflammatory markers (8). Additionally, the MD positively influences gut microbiota composition, enhancing beneficial microbial populations that regulate immune responses and inflammatory pathways (9). Weight loss interventions and dietary regimens, such as gluten-free and Mediterranean diets or supplement use, may potentially improve the natural progression of chronic arthritis and its response to therapy (10). The variation in prevalence of chronic arthritis between continents, with higher rates observed in Western countries, might be indicative (2, 11).
Fatty acids serve as important macronutrients for immunomodulation, with n-3 polyunsaturated fatty acids demonstrating particularly beneficial effects, such as reducing inflammation, modulating immune cell function, and supporting overall immune system balance (5). Polyunsaturated fatty acids (PUFA) (12) can be classified into omega-3 (n-3) and omega-6 fatty acids based on the location of the first double bond relative to the methyl end of the fatty acid chain. The group of n-3 PUFA includes alpha-linolenic acid (ALA), eicosapentaenoic acid (EPA), and docosahexaenoic acid (DHA), which are found in fatty fish (e.g., salmon, mackerel, sardines), as well as in plant-based sources like flaxseeds, chia seeds, and walnuts. The group of n-6 PUFA includes linoleic acid (LA) and arachidonic acid (AA), which are predominantly present in vegetable oils such as soybean, corn, and sunflower oil (12).
Monounsaturated fatty acids (MUFA) (13) are regarded as beneficial fats and include omega-9 fatty acids. The body is able to create omega-9 fatty acids on its own, in contrast to n-3 PUFA and omega-6 fatty acids, which are regarded as necessary fatty acids. Consuming foods high in omega-9 can still be advantageous for general health. The most prevalent omega-9 fatty acid is oleic acid, which may be found in large amounts in foods like avocados and almonds as well as in olive oil. Additionally, polyphenols and carotenoids are promising antioxidants in the context of rheumatic diseases (10).
Flaxseed, derived from the plant Linumusitatissimum, is recognized for its potential health benefits, particularly in managing inflammatory conditions. It is rich in alpha-linolenic acid (ALA), an n-3 PUFA fatty acid known for its anti-inflammatory properties (14). A meta-analysis (15) of 32 clinical trials examined the impact of flaxseed-derived products on inflammatory biomarkers. The analysis revealed that flaxseed intake significantly reduced levels of high-sensitivity CRP (hs-CRP) and TNF-α, both of which are markers of inflammation. However, no significant changes were observed in IL-6 and standard CRP levels (10).
Probiotics, prebiotics, and synbiotics affect the immune system, inflammatory biomarkers, and disease activity (16). Certain meals, such as yogurt, kefir, and other fermented foods, as well as supplements, contain probiotics. Bifidobacterium and Lactobacillus species are common probiotic bacteria. Prebiotics are indigestible fibers that feed beneficial bacteria that are already in the stomach. In the gut, they basically serve as fertilizer for probiotics and other good bacteria. Synbiotics are a combination of probiotics and prebiotics that include good bacteria along with substances that help them grow. Probiotics modulate both innate and adaptive immune responses by influencing the activities of dendritic cells, macrophages, and T and B lymphocytes. Toll-like receptor activation is a key mechanism through which probiotics exert their immunomodulatory effects (17). According to several studies (16), prebiotics can affect immunological and metabolic parameters like IL-6, insulin resistance, and blood glucose levels (18). These findings suggest that the gut microbiota has a role in maintaining the host’s health by controlling the host’s immunological response and metabolism in response to diet (18). While prebiotics predominantly impact the large intestine, probiotics primarily affect both the small and large intestines, therefore combining the two, known as synbiotics, may have a synergistic effect (19).
Emerging evidence highlights the role of gut microbiota in modulating immune responses and influencing the onset and progression of RA (20). Dysbiosis, or an imbalance in gut microbial composition, has been associated with increased intestinal permeability, systemic inflammation, and heightened immune activation (21). Among the most studied probiotics, Lactobacillus casei and Lactobacillus acidophilus have demonstrated anti-inflammatory effects and improvements in arthritis severity in preclinical and clinical studies (22, 23). For instance, animal studies revealed that supplementation with these strains reduced pro-inflammatory cytokines such as IL-6 and TNF-α, while increasing anti-inflammatory mediators like IL-10 (22).
This systematic review aims to synthesize existing evidence on the impact of dietary patterns, nutritional supplements, and probiotics on disease activity, inflammation, and immune modulation in patients with RA, axSpA, and PsA.
2 Methods
2.1 Search strategy
A systematic literature search was conducted from inception to December 2024 in three different electronic databases: PubMed, Embase, and the Cochrane Library. Predefined search terms were used focusing on two key concepts: chronic arthritis and nutrition/diet. Included search terms were “Psoriatic Arthritis,” “Spondyloarthritis,” and “Rheumatoid Arthritis,” incorporating both MeSHterms (e.g., “Arthritis, Psoriatic”[Mesh], “Spondyloarthritis” [Mesh], “Arthritis, Rheumatoid” [Mesh]) and free-text keywords (e.g., “Psoriatic Arthropathy,” “Spinal Arthritis”). For nutrition and diet, included search terms were “Dietary Supplements,” “Probiotics,” “Mediterranean Diet,” and “Nutrition Therapy,” with both MeSH terms (e.g., “Dietary Supplements”[Mesh], “Diet, Mediterranean” [Mesh]) and text words (e.g., “Herbal Supplement,” “Food Supplement,” “Medical Nutrition Therapy”). The Boolean logic (#1 AND #2) was used to combine the two concepts, ensuring specificity. Filters were applied in Embase to exclude conference abstracts. This search was limited to published peer-reviewed articles and did not include grey literature or trial registries.
2.2 Inclusion and exclusion criteria
The study selection process involved the use of Rayyan software for screening. Randomized controlled trials (RCTs) recruiting participants with a diagnosis of RA, axSpA or PsA and a minimum age of 18 years, were eligible for inclusion in the study. Trials comparing a specific dietary intervention (e.g., a particular diet, vitamins, or probiotics) with a control or alternative intervention group were included. Studies that met the eligibility requirements had to compare the effects of the intervention to either the control group, which received no intervention, or the comparison group, which received another type of intervention. Studies published in languages other than English were excluded due to the inability to ensure accurate interpretation. Research involving experimental animal models, trials without a control group, observational studies conducted retrospectively, and studies lacking information on disease outcomes or other critical factors for disease activity were also excluded.
2.3 Data extraction
The systematic review was performed according to the Preferred Reporting Items for Systematic Review and Meta-Analysis (PRISMA) statement (24). Data extraction included study design, participant characteristics, intervention type, and key outcomes. Information on funding sources and potential conflicts of interest was also recorded to evaluate bias. After removing duplicate records, titles and abstracts were screened for relevance. Studies without full text available were removed, followed by a selection process based on the inclusion and exclusion criteria described above. Two reviewers independently screened the studies in a blinded manner to ensure impartiality and minimize bias (KB and MK). Disagreements were resolved through discussion, and if consensus could not be reached, a third reviewer (KV) was consulted. Common reasons included lack of control group, observational design, and non-English language publications. The quality of the included studies was critically assessed using the Academy of Nutrition and Dietetics Quality Criteria Checklist for Primary Research (25). This instrument was specifically chosen for its detailed criteria tailored to the methodological nuances of dietary intervention studies. It provides a comprehensive evaluation across key bias domains—including selection, performance, detection, attrition, and reporting bias—that is comparable to widely used tools like the Cochrane Risk of Bias (RoB 2) tool. Based on this evaluation, each study was classified as positive (met >80% of quality criteria), neutral (met 50–80%), or negative (met <50%) to allow for balanced comparisons.
2.4 Data items
We sought data on key outcomes including disease activity, inflammatory biomarkers, and immune response changes. Disease activity was assessed using standardized scores such as Disease Activity Score-28 (DAS28), Bath Ankylosing Spondylitis Disease Activity Index (BASDAI), Ankylosing Spondylitis Disease Activity Score (ASDAS), Disease Activity in Psoriatic Arthritis Score (DAPSA). Inflammatory biomarkers included CRP, erythrocyte sedimentation rate (ESR), IL-6, TNF-α, and other cytokine levels. Immune response changes were analyzed through markers such as IL-17 expression, FoxP3 gene expression, and alterations in gut microbiota composition.
Other variables collected included participant characteristics (e.g., age, gender, BMI, disease severity, and duration), intervention details (e.g., type, dosage, and duration of supplementation or diet), and trial design features (e.g., randomization, blinding, and control group characteristics). Data on funding sources and potential conflicts of interest were extracted where available.
Missing or unclear data were systematically addressed to minimize bias. If participant-level data were incomplete (e.g., unreported dropouts), the study was classified as having a high risk of attrition bias. Studies lacking essential intervention details (e.g., dosage, administration method) were categorized as unclear and excluded from comparative analyses unless additional information was retrievable from Supplementary material. To mitigate missing data issues, study protocols were cross-referenced, and authors were contacted when feasible. For studies with missing outcome data, a predefined protocol was applied: (1) If dropouts were unreported, the study was categorized as having a high risk of attrition bias; (2) Studies missing essential intervention details were excluded unless further information was available. Missing data were clarified through study protocols or direct author correspondence whenever possible.
2.5 Synthesis methods
The eligibility of studies for synthesis was determined based on the intervention characteristics and their relevance to the planned research objectives. Studies were tabulated by intervention type, population, and reported outcomes. These characteristics were compared to predefined inclusion criteria (as outlined in the “Inclusion and Exclusion Criteria” subsection). Missing data were handled by excluding studies with insufficient reporting for synthesis. No data conversions were performed due to the lack of access to raw datasets. Results of individual studies were tabulated in summary tables (Tables 1–3), detailing key characteristics, interventions, outcomes, and main findings. Results were also narratively synthesized and highlighted in the text for clarity. A narrative synthesis was conducted due to significant clinical and methodological heterogeneity observed across studies. A meta-analysis was not performed as this high heterogeneity—present even within seemingly comparable intervention subgroups — precluded meaningful statistical aggregation. Key sources of heterogeneity included wide variations in intervention designs (e.g., diverse diets, supplements, probiotics), variable dosages, differing study durations, and inconsistent comparator groups. Furthermore, the incomplete reporting of data in many primary studies (e.g., lack of mean changes and standard deviations for key outcomes) made it infeasible to calculate the necessary effect sizes for quantitative pooling. Heterogeneity was therefore explored narratively by categorizing studies based on intervention type (e.g., supplements, probiotics, dietary regimens) and outcome measures (e.g., disease activity, inflammatory biomarkers). The risk of bias due to missing results was assessed by examining the completeness of reported data in each study and excluding studies with insufficient information for outcome evaluation. Reporting bias was minimized by strictly adhering to inclusion criteria and conducting independent screening by two reviewers. Certainty in the evidence for each outcome was evaluated using the Academy of Nutrition and Dietetics Quality Criteria Checklist for Primary Research. Studies were classified as positive, neutral, or negative based on adherence to quality standards and transparency in reporting. To enhance transparency, systematic review was registered in the PROSPERO database (registration number: CRD420251010982).

Table 1. Key features of the included studies, subdivided according to chronic arthritis subtype—rheumatoid arthritis.
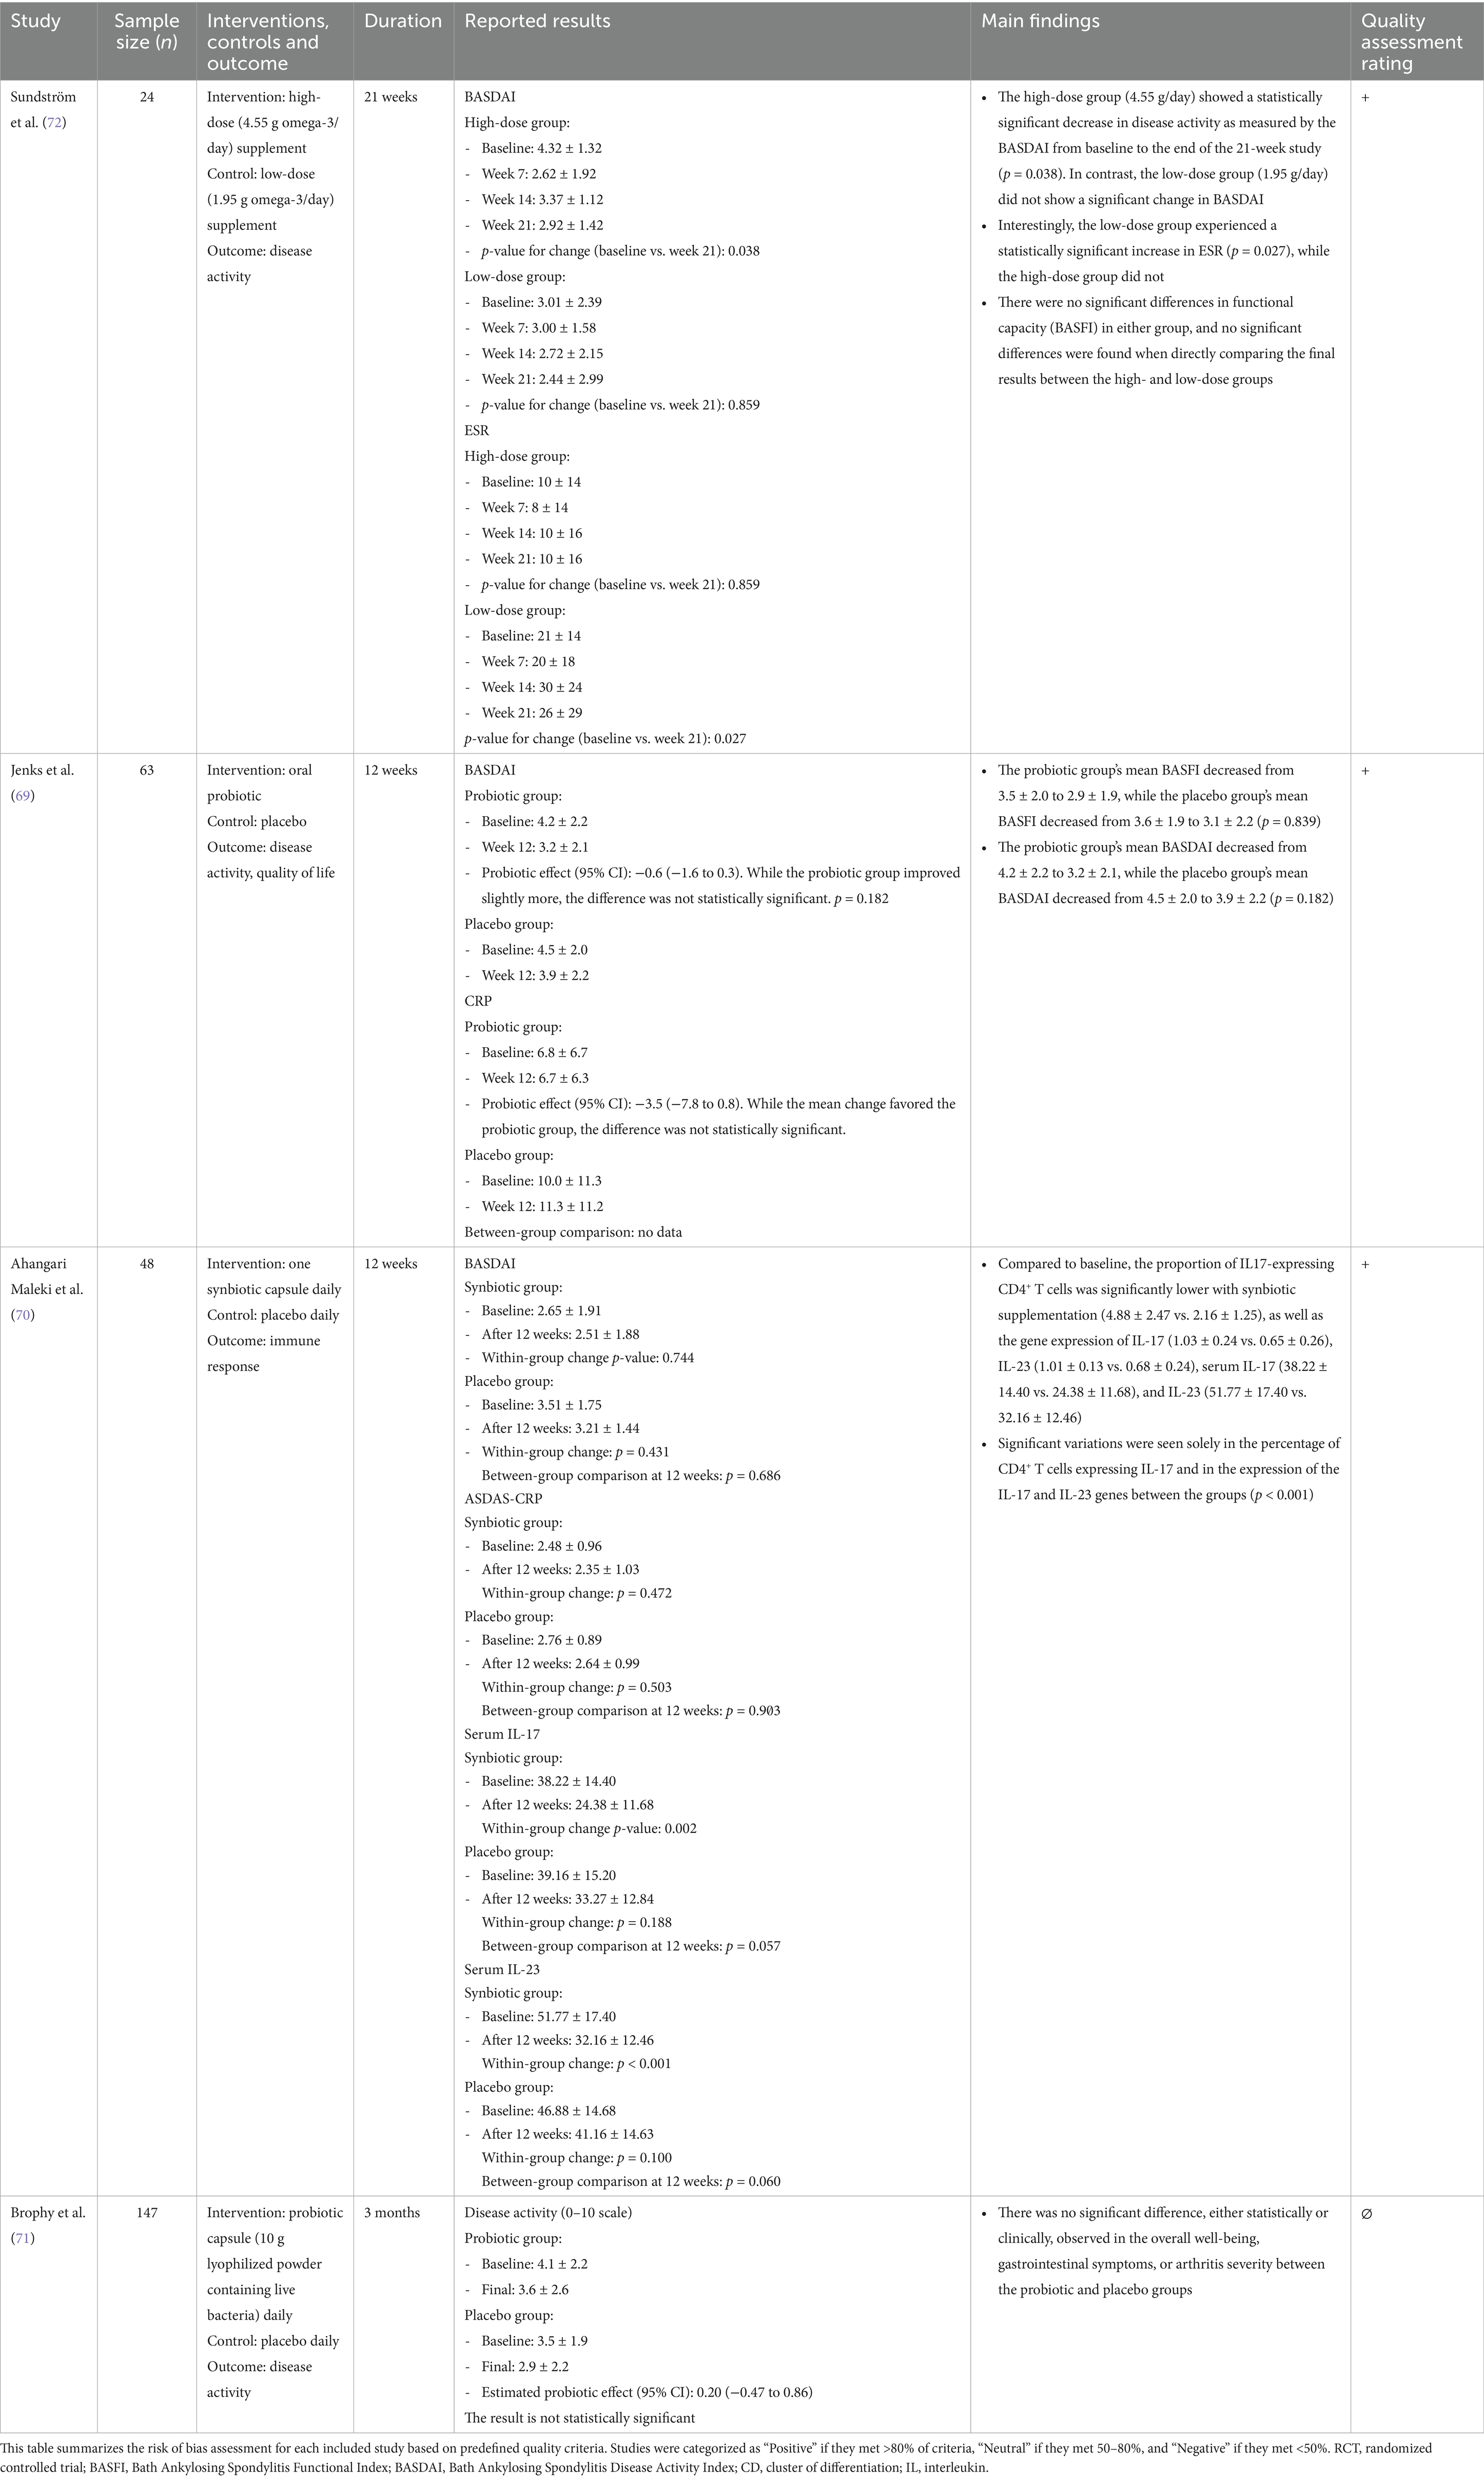
Table 2. Key features of the included studies, subdivided according to chronic arthritis subtype—spondyloarthritis.

Table 3. Key features of the included studies, subdivided according to chronic arthritis subtype—psoriatic arthritis.
2.6 Statistical analysis
Since no meta-analysis was performed, the results from included studies were summarized narratively, taking into account the study design, intervention characteristics, and reported outcomes. Effect sizes, confidence intervals, and p-values reported in the original studies were extracted. Additionally, potential sources of heterogeneity among studies were explored based on differences in methodology, population, and intervention duration.
3 Results
The results are presented by arthritis type (RA, axSpA, PsA) and categorized based on the type of intervention (dietary interventions, supplementation, probiotics, and synbiotics) to facilitate structured comparison.
3.1 Characteristics of eligible studies
Preferred Reporting Items for Systematic Reviews and Meta-analyses (PRISMA) guidelines were followed in creating the flow diagram for screening eligible clinical trials (Figure 1) (24). Figure 1 illustrates the stepwise selection process of eligible studies, highlighting the number of included and excluded records at each screening stage.
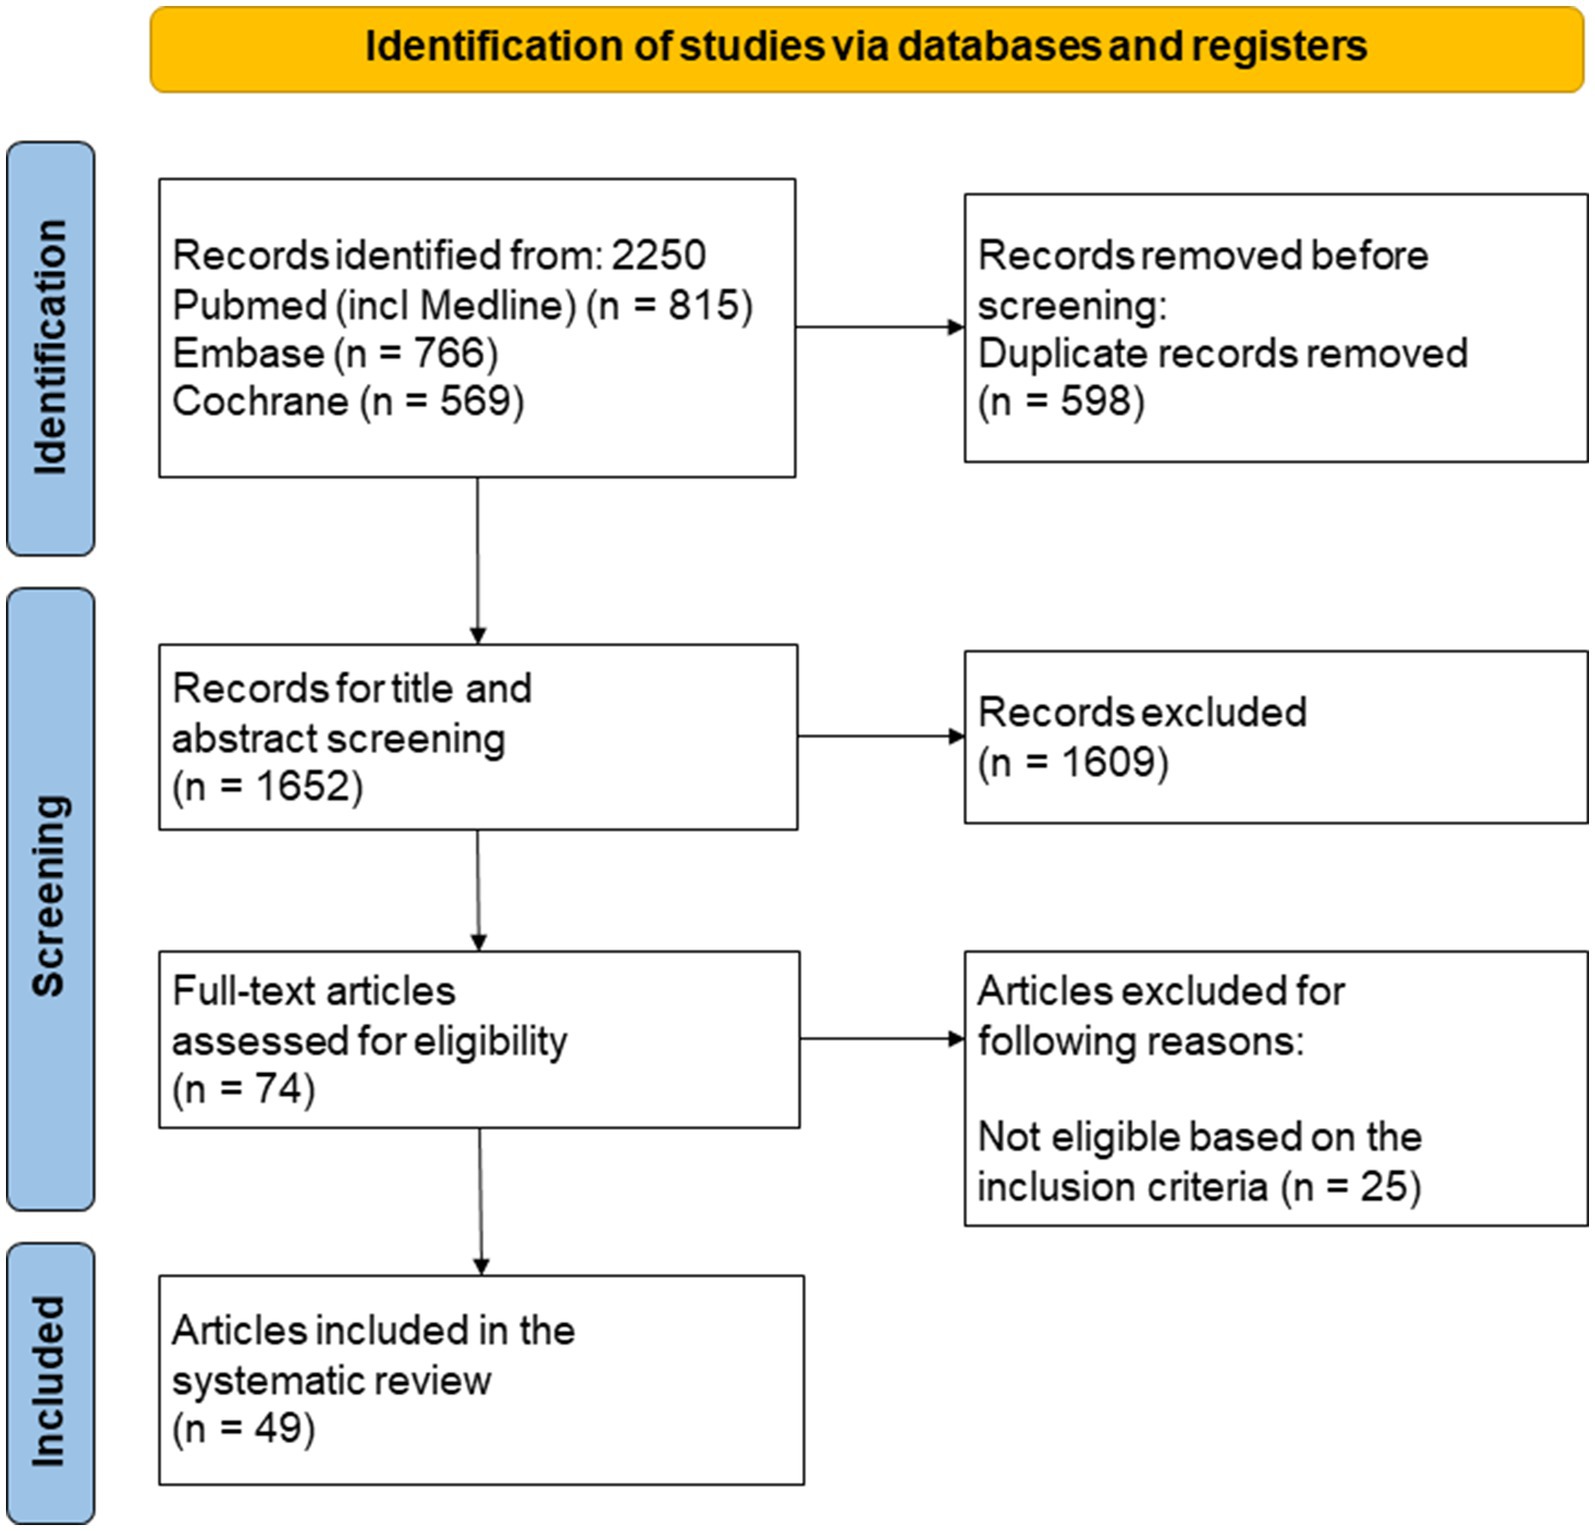
Figure 1. Preferred Reporting Items for Systematic Reviews and Meta-analyses (PRISMA) guidelines were followed in creating the flow diagram for screening eligible clinical trials. This diagram outlines the selection process for studies included in the systematic review. The screening process followed the PRISMA guidelines, including database searches, eligibility criteria, and reasons for exclusion at each stage.
Searching the PubMed, Embase, and the Cochrane Library databases, 2,250 records were found. Following the removal of duplicates, 1,652 records underwent title and abstract screening, of which 1,609 were found ineligible and eliminated. Out of the 74 studies that made it through the full-text screening process, 25 studies did not meet the inclusion criteria. Forty-nine studies were selected for further discussion and quality assessment. The characteristics of included studies are summarized in Table 1 (RA studies), Table 2 (axSpA studies), and Table 3 (PsA studies). A meta-analysis was not performed due to the pervasive clinical and methodological heterogeneity across study designs, interventions, and outcomes (e.g., varying dosages, durations, and reported metrics), which prevented meaningful quantitative pooling of data. Results were therefore synthesized narratively.
The eligible studies included in the systematic review had sample sizes between 12 and 186. The main characteristics of these trials are summarized below. The duration varied from 8 weeks to 12 months. To systematically analyze the effects of nutrition on chronic arthritis, the included studies were classified according to the type of arthritis investigated. Among the studies of RA (Table 1), 24 studies explored the impacts of supplements such as ginger powder (26), polyunsaturated fatty acids (27–43), pomegranate extract (44), vitamin D (45, 46), N-acetylcysteine (47), quercetin (48), and LD-1227 (49). Additionally, nine articles concentrated on probiotics (50–56) and synbiotics (57, 58), while another 10 examined the effects of different diets, including the anti-inflammatory diet (59, 60), Mediterranean diet (61–63), vegan diet and gluten-free diet (64, 65), flaxseed diet (66), fasting regimen (67), and peptide diet (68), on RA. Regarding axSpA (Table 2), three studies (69–71) utilized probiotics as interventions, while one trial (72) supplemented with polyunsaturated fatty acids. In the case of PsA (Table 3), one article (73) investigated the impact of polyunsaturated fatty acid supplementation, while another (74) examined the effect of a hypocaloric diet supplemented with n-3 PUFA.
Thirty-seven out of 49 studies had a positive quality rating in Tables 1–3, indicating a minimal risk of bias. However, 12 studies were rated as neutral, suggesting varying degrees of bias. Less than 80% of participants in several research (28, 32, 35, 36, 39, 48, 71) were followed up with, increasing the risk of bias. The comparability between research groups was compromised in one trial (51) because the probiotic group received MTX treatment more frequently than the placebo group. In four trials (42, 43, 49, 58) dropouts were not mentioned. Incomplete data presentation was noted in one study (49). Additionally, the sample population in one trial (42) was noticeably small, which increased the risk of selection bias.
3.2 Effect of nutrition and diet in RA
3.2.1 Diet
Various dietary interventions, including Mediterranean, anti-inflammatory, vegan, gluten-free, and flaxseed-based diets, as well as fasting and peptide diets, have been investigated for their impact on disease activity, inflammatory biomarkers, and quality of life in patients with RA.
Three studies reported a beneficial effect of the MD. Raad et al. (61) conducted a telehealth-delivered randomized controlled trial with 44 RA patients in Ireland to compare the effects of MD and the Irish Healthy Eating Guidelines (HEG) over 12 weeks. Both groups reported improvements in physical function (MD: HAQ-DI, 0.9 ± 0.5 to 0.5 ± 0.4, p < 0.001; HEG: 1.4 ± 0.7 to 1.0 ± 0.6, p < 0.001) and quality of life (MD: 10.1 ± 7.5 to 4.0 ± 4.7, p < 0.001; HEG: 11.25 ± 7.2 to 7.9 ± 6.4, p = 0.04). However, the MD group experienced significantly better outcomes in both physical function (p = 0.006) and quality of life (p = 0.03) compared to the HEG group, with increased physical activity observed only in the MD group (p = 0.01). Sadeghi et al. (62) evaluated the effects of MD compared to a low-fat, high-carbohydrate diet (LF-HC) and a control diet in a 12-week randomized trial involving 129 overweight and obese RA patients. The MD group showed a significant reduction in DAS28 scores compared to the LF-HC (p = 0.02) and control groups (p = 0.001), independent of weight loss. Serum ESR levels were also significantly lower in the MD group compared to the LF-HC group (p = 0.007) and controls (p < 0.001). Sköldstam et al. (63) conducted a 12-week randomized study comparing MD and a standard Western diet in RA patients with stable but active disease (n = 51). The MD group demonstrated significant improvements in disease activity (DAS28: −0.56, p < 0.001), physical function (HAQ: −0.15, p = 0.020), CRP levels (p = 0.006), and vitality scores from the SF-36 health survey (p = 0.018), while the control group showed no significant changes. A DAS28 reduction of this magnitude, while modest, is generally considered clinically relevant, particularly as it was accompanied by significant improvements in physical function and quality of life. The MD group also experienced weight loss (−3.0 kg, p < 0.001), although weight loss was not correlated with reduced disease activity.
Two trials examined the impact of anti-inflammatory diet (AID) (59, 60). Vadell et al. (59) observed a significant decrease in DAS28-ESR during an 11-month intervention involving 44 participants. Specifically, DAS28-ESR decreased significantly during the intervention period compared to baseline values (median: 3.05 vs. 3.39, p = 0.01) and was significantly lower after the intervention compared to the control diet period (median: 3.05 vs. 3.27, p = 0.04). However, in the main analysis, no statistically significant difference in DAS28-ESR was found between intervention and control diets (p = 0.11). This suggests that while the AID had positive effects during the intervention, its overall efficacy compared to the control diet remains inconclusive based on adjusted analyses. Adam et al. (60) conducted a crossover trial with 68 patients, comparing an AID with a low arachidonic acid intake (<90 mg/day), placebo, fish oil supplementation, and a Western diet (WD). AID alone led to a 14% reduction in tender and swollen joint counts during placebo treatment. Fish oil supplementation enhanced the effect of AID, resulting in significant reductions in tender (28%) and swollen (34%) joint counts compared to baseline (p < 0.01). Compared to the WD, patients on AID combined with fish oil exhibited greater increases in erythrocyte eicosapentaenoic acid levels (244% vs. 217%) and larger reductions in leukotriene B4 (34% vs. 8%, p < 0.01), 11-dehydro-thromboxane B2 (15% vs. 10%, p < 0.05), and prostaglandin metabolites (21% vs. 16%, p < 0.003).
Elkan et al. (64) conducted a randomized study involving 66 patients with active RA to evaluate the effects of a gluten-free vegan diet on disease activity and immune response. Participants were divided into two groups: 38 patients followed a gluten-free vegan diet, while 28 adhered to a well-balanced non-vegan diet for 1 year. Of those who completed the diet regimens for at least 9 months, 40.5% (9/22) in the vegan group achieved an ACR20 response compared to only 4% (1/25) in the non-vegan group. For the intention-to-treat population, the proportions were 34.3% (13/38) and 3.8% (1/28), respectively, demonstrating significantly higher clinical improvement in the vegan diet group, meeting accepted criteria for clinical response in RA. Immunological analysis revealed that IgG antibody levels against gliadin and β-lactoglobulin decreased in the responder subgroup of the vegan diet group but remained unchanged in non-responders and in the non-vegan group. For example, the mean IgG levels against gliadin decreased from 50 to 35 U/mL in responders, highlighting the diet’s potential role in modulating immune reactivity. Additionally, the vegan group showed significant reductions in LDL cholesterol (average decrease of 0.6 mmol/L; p < 0.05) and oxidized LDL levels, suggesting improved cardiovascular risk profiles. In contrast, no significant metabolic changes were observed in the non-vegan group. Radiographic analysis indicated no retardation of joint destruction in either group, implying that while the gluten-free vegan diet improved clinical and immunological outcomes, it did not influence structural joint damage over the 12-month period.
Hafström et al. (65) studied 66 patients with active RA who were randomized to either a vegan gluten-free diet (38 patients) or a well-balanced non-vegan diet (28 patients) for 1 year. Among those who completed at least 9 months on the diets (22 in the vegan group and 25 in the non-vegan group), 40.5% of the vegan diet group (9 patients) achieved the ACR20 improvement criteria compared to only 4% (1 patient) in the non-vegan group. In the intention-to-treat analysis, these figures were 34.3 and 3.8%, respectively. The vegan diet group also demonstrated reductions in IgG antibody levels against gliadin and beta-lactoglobulin, particularly in the responder subgroup, whereas no such changes were observed in the non-vegan group. However, no retardation in radiological destruction was noted in either group.
In a 12-week randomized controlled trial by Ghaseminasab-Parizi et al. (66), the effects of flaxseed consumption (30 g/day) with and without an AID were assessed in 120 patients. Participants were randomly assigned to three groups: flaxseed combined with an AID (AIF group), flaxseed with a regular diet (RF group), and roasted wheat (30 g/day) with a regular diet (RW group) as a control. Significant improvements were observed in DAS28 scores, with a reduction of −0.87 ± 1.11 in the RF group compared to −0.24 ± 0.78 in the RW group (p = 0.014). Both flaxseed groups (AIF and RF) experienced reductions in pain severity (p ≤ 0.001), morning stiffness (p < 0.05), and disease feeling (p < 0.01), as well as improved quality of life and HAQ disability index compared to the RW group (p < 0.001). Morning stiffness decreased significantly in the AIF and RF groups, but no significant difference between these groups was found. Physical and mental health components of quality of life, such as physical functioning, vitality, and emotional well-being, showed notable improvements in the AIF and RF groups compared to RW (p < 0.05). Biomarkers of inflammation, including CRP and ESR, as well as autoantibodies, showed no significant changes between groups, although rheumatoid factor levels trended toward reduction in the AIF group (p = 0.06).
Hartmann et al. (67) conducted a randomized controlled trial (NutriFast-Study) involving 53 RA patients to compare the effects of a 7-day fast followed by an 11-week plant-based diet (PBD) with a 12-week standard anti-inflammatory diet recommended by the German Society for Nutrition (DGE). Of the participants, 50 completed the study per protocol. Although no significant difference was observed between the two groups in the primary outcome of HAQ-DI improvement at 12 weeks (p = 0.66), the fasting group experienced a rapid reduction in HAQ-DI by day 7 (−0.24 ± 0.22, p = 0.01), sustained at 12 weeks (−0.29 ± 0.38), while the DGE group showed delayed improvements beginning at week 6 (−0.24 ± 0.49). Both groups exhibited significant reductions in DAS28 scores at 12 weeks (fasting group: −0.97 ± 0.96. DGE group: −1.14 ± 1.10, p < 0.001 for both), but faster responses were observed in the fasting group, where 36% achieved ACR50 or higher by week 12 compared to 12% in the DGE group, indicating a clinically meaningful response in a higher proportion of patients. Cardiovascular risk factors improved more significantly in the fasting group, including greater weight loss (−3.9 kg vs. −0.7 kg, p < 0.001) and reductions in LDL cholesterol and triglycerides by week 6. Holst-Jensen et al. (68) conducted a randomized controlled trial with 30 RA patients, comparing a four-week liquid peptide diet to a regular diet. The peptide diet significantly reduced pain (p = 0.02), HAQ scores (p = 0.03), and BMI (p = 0.001), but only one patient achieved remission.
3.2.2 Supplementation
Two trials (27, 30) demonstrated a significant reduction in disease activity, measured by the DAS28 score, compared to baseline in patients with RA receiving n-3 PUFA and fish oil. In the study by Berbert et al. (29), 43 participants (34 female, 9 male) were randomly assigned into three groups: Group 1 (n = 13) received a placebo (soy oil), Group 2 (n = 13) received fish oil supplementation at a dose of 3 g/day (containing 90 mg EPA and 60 mg DHA per capsule, 20 capsules daily), and Group 3 (n = 17) received the same fish oil supplementation combined with 9.6 mL/day of olive oil. Significant improvements in clinical indicators such as morning stiffness duration, joint pain intensity, and handgrip strength were observed after 12 and 24 weeks, with the most pronounced effects in the group receiving both fish oil and olive oil.
Several studies (28, 30, 35, 40, 41) demonstrated reductions in swollen and tender joint counts following PUFA supplementation. In Geusens et al. (32), a 12-month, double-blind, randomized trial with 90 RA patients compared 2.6 g/day of n-3 PUFA, 1.3 g/day of n-3 PUFA plus 3 g/day of olive oil, and 6 g/day of olive oil. Only the 2.6 g/day group showed significant improvements in patient-reported outcomes and physician-assessed pain, with more patients reducing antirheumatic medications, highlighting the clinical efficacy of this dose.
Fish oil supplementation has been associated with reductions in key inflammatory markers, including ESR and CRP (27, 33). In the study by Fatel et al. (27), 62 participants (50 female, 12 male) were divided into three groups: the control group (n = 21), the fish oil group (n = 21) receiving 3 g/day of fish oil (containing 180 mg EPA and 120 mg DHA per capsule, 10 capsules daily), and the cranberry juice group (n = 20) receiving the same dose of fish oil combined with 500 mL/day of reduced-calorie cranberry juice. After 90 days, the fish oil group showed significant reductions in DAS28-CRP (p = 0.02) and adiponectin levels (p = 0.02). The cranberry juice group demonstrated even greater benefits, with reductions in DAS28-CRP (p = 0.001), ESR (16.0 to 11.0 mm/h, p = 0.033), and CRP (3.7 to 2.5 mg/dL, p = 0.002), indicating a synergistic effect of fish oil and cranberry juice.
Hosseini et al. (33) investigated fish oil supplementation in 42 rheumatoid arthritis patients over 8 weeks, with doses of 2 g/day for the first 4 weeks followed by 3 g/day for the remaining 4 weeks. Significant reductions in CRP (from 5.1 ± 1.4 to 2.8 ± 1.2 mg/dL, p = 0.002) and ESR (from 36 ± 9 to 20 ± 7 mm/h, p = 0.003) were observed after 8 weeks, alongside clinically significant improvements in joint inflammation.
Other studies also highlighted additional benefits of fish oil supplementation. Proudman et al. (37) found that a unit increase in EPA (1% of total fatty acids) corresponded to a 12% higher likelihood of achieving remission. However, Magaro et al. (42) did not observe significant clinical benefits with PUFA supplementation, and Nordström et al. (43) reported no effects of alpha-linolenic acid (ALA) supplementation on disease activity.
Park et al. (36) used oleic acid (monounsaturated fatty acids, MUFA) as a control group in a study comparing the effects of n-3 PUFA supplementation on RA outcomes. While omega-3 PUFA provided measurable benefits, MUFA did not significantly influence disease activity markers. Dawczynski et al. (31) reported cardioprotective effects of PUFA after an 8-month trial with 45 participants, suggesting that the inclusion of MUFA in combination with PUFA supplementation could influence lipid profiles and cardiovascular risk factors in RA patients.
Additional studies explored dietary interventions combining MUFAs and PUFAs. Goat and sheep cheese were identified as rich sources of PUFA, with long-term consumption potentially reducing atherosclerosis risk by modulating blood lipids and cardiovascular health markers (75).
Aryaeian et al. (26) conducted a randomized, double-blind, placebo-controlled trial with 70 patients with active RA to evaluate the effects of ginger supplementation. Participants received 1,500 mg of ginger powder daily for 12 weeks, resulting in a significant reduction in DAS28-ESR scores (p = 0.001). Gene expression analysis revealed increased FoxP3 (p < 0.05), indicative of enhanced regulatory T cell function, alongside reduced expression of T-bet and RORγt (p < 0.05), suggesting decreased pro-inflammatory activity of Th1 and Th17 cells.
Ghavipour et al. (44) explored pomegranate extract supplementation, finding significant reductions in DAS28 scores after 8 weeks. This improvement was attributed to decreases in swollen and tender joint counts, pain intensity, and ESR levels. Similarly, vitamin D supplementation showed potential benefits in RA. Soubrier et al. (46) reported reduced HAQ scores and significant improvements in ESR and CRP levels after 6 months, while Gopinath et al. (45) observed greater pain relief in the vitamin D group compared to controls.
N-acetylcysteine (NAC) supplementation has also been studied for its potential effects on RA. Esalatmanesh et al. (47) reported significant reductions in disease activity, including morning stiffness and DAS28 scores, along with improvements in inflammatory biomarkers such as nitric oxide (NO), ESR, malondialdehyde (MDA), high-sensitivity СRP, and glutathione peroxidase (GPx) after a 3-month trial with 74 participants. Positive effects on blood lipids, including lower HDL-C and fasting blood sugar levels, were also noted.
Quercetin, a potent antioxidant with anti-inflammatory properties, was tested in a 16-week trial involving 32 patients. However, no significant changes in disease activity or inflammatory biomarkers, such as cytokines and CRP, were observed compared to lipoic acid and placebo groups (48).
Finally, LD-1227, a patented marine extract combining fish-derived peptides, lipoproteins, and DNA, was evaluated by Lorenzetti et al. (49). In a 12-week study with 40 patients, the LD-1227 group showed an 81.0% ACR20 response compared to 44% in the n-3 PUFA group. Improvements were also noted in VAS scores, HAQ scores, morning stiffness, and tender points, alongside reductions in inflammatory biomarkers and gene expression.
3.2.3 Probiotics, prebiotics, and synbiotics
Alavi et al. (50) conducted a 6-month double-blind randomized placebo-controlled trial involving 69 RA patients to evaluate the effects of a dietary plant-derived polysaccharide (dPP) supplement. The active compound (AC) group (n = 33) showed a 12% reduction in agalactosylated (G0F) glycans (p = 0.03), while the placebo group (n = 36) exhibited an 11% reduction in fully digalactosylated (G2) glycans (p = 0.03). Despite these glycan changes, the AC group showed no significant clinical improvements in DAS28 scores, while the placebo group had a slight decrease (difference = 0.63; 95% CI 0.17, 1.10; p = 0.009).
Similarly, Hatakka et al. (52) and Maria de Los Angeles et al. (54) found no statistical differences in DAS28, HAQ, or biochemical parameters with probiotic use. In contrast, Cannarella et al. (51) reported that probiotic consumption for 60 days led to significant decreases in TNF-α and IL-6, along with improved antioxidant capacity. However, the probiotics did not significantly affect the DAS-28 score, suggesting that while inflammation and oxidative stress were reduced, overall disease severity remained unchanged.
Zamani et al. (56) found significant improvements in DAS28 scores, serum insulin levels, HOMA-B function, and CRP concentrations after 8 weeks of probiotic intervention, suggesting a beneficial effect on both inflammation and metabolic markers.
In a 60-day study, Mandel et al. (53) enrolled 45 RA patients, randomly assigning them to either the Bacillus coagulans group (n = 22) or the placebo group (n = 22). The probiotic group showed statistically significant improvements in pain scores, patient global assessment, and self-assessed disability compared to placebo. Additionally, CRP levels decreased, and functional abilities (e.g., walking, daily activities) improved.
In the 8-week trial by Vaghef-Mehrabany et al. (55), Lactobacillus casei 01 supplementation resulted in a significant decrease in disease activity (DAS28, p = 0.039) and an increase in anti-inflammatory cytokine ratios (IL-10/TNF-α, IL-10/IL-12, and IL-10/total Th1; p = 0.039, p = 0.012, and p = 0.014, respectively). By the end of the study, significant differences were observed between the probiotic and placebo groups in IL-10/IL-12 (p = 0.038) and IL-10/total Th1 (p = 0.006), suggesting an improved inflammatory profile in RA patients.
In the study by Zamani et al. (57), 54 RA patients were randomized to receive either a synbiotic capsule containing Lactobacillus acidophilus, Lactobacillus casei, and Bifidobacterium bifidum (2 × 10⁹ CFU/g each) plus 800 mg inulin or a placebo for 8 weeks.
Compared with placebo, synbiotic supplementation resulted in a significant improvement in DAS28 (−1.6 ± 0.8 vs. –0.3 ± 0.5, p < 0.001) and VAS pain scores (−30.4 ± 18.7 vs. –11.5 ± 15.9, p < 0.001), along with reductions in CRP and ESR. Additionally, metabolic markers, including insulin levels (−13.8 ± 26.4 vs. +4.2 ± 28.2 pmol/L, p = 0.01), HOMA-IR (p = 0.03), and HOMA-B (p = 0.01), were significantly improved, and plasma reduced glutathione levels increased (+36.6 ± 63.5 vs. –58.5 ± 154.4 μmol/L, p = 0.005). In contrast, Esmaeili et al. (58) conducted a larger 12-week randomized, placebo-controlled trial involving 186 RA patients who received either a daily 1,000 mg synbiotic supplement or a placebo alongside standard methotrexate and prednisolone treatment. Although significant within-group reductions in DAS28, TJC28, and SJC28 were observed, no significant differences were detected between the synbiotic and placebo groups. While CRP levels decreased in the subgroup receiving higher methotrexate doses (15–20 mg/week), ESR remained unchanged. The overall response rate was similar between groups (65.9% in the synbiotic group vs. 65.3% in the placebo group), suggesting that the synbiotic did not provide additional benefits beyond standard pharmacologic treatment. The authors hypothesized that the short intervention period might have limited the potential benefits and recommended extending the treatment duration to 6 months for a more definitive assessment. Table 1 presents studies on dietary interventions and supplementation in RA.
3.3 Effect of nutrition and diet in patients with axSpA
Research on the role of diet and nutrition in axSpA is limited. Most available studies focus on specific dietary interventions, such as PUFA supplementation, probiotics, and synbiotics. The limited number of studies underscores the need for further research to draw definitive conclusions about the role of diet and nutrition in axSpA management (69–72).
3.3.1 Supplementation
Sundström et al. (72) conducted a 21-week trial involving 24 patients, comparing high-dose (4.55 g/day) and low-dose (1.95 g/day) PUFA supplementation. Disease activity, functional impairment, ESR, and drug consumption were assessed at baseline and weeks 7, 14, and 21. Eighteen patients completed the study, with the high-dose group showing a significant reduction in BASDAI (p = 0.03), while no significant changes were observed in the low-dose group. However, no significant differences were found in drug consumption or functional capacity in either group, nor when comparing the high- and low-dose groups directly. This suggests that higher doses of PUFA may be required to achieve therapeutic effects, but larger controlled trials are needed to confirm these findings.
3.3.2 Probiotics and synbiotics
Jenks et al. (69) and Brophy et al. (71) investigated the effects of probiotic supplementation in axSpA patients but found no statistically or clinically significant differences in disease activity between the probiotic and placebo groups. In Jenks et al. (69), a 12-week randomized controlled trial with 63 patients showed that probiotic supplementation did not significantly improve BASDAI, BASFI, pain, fatigue, or inflammatory markers compared to placebo. Similarly, Brophy et al. (71) conducted an internet-based 12-week randomized trial with 147 patients, where probiotics also failed to improve global well-being, bowel symptoms, or arthritis severity.
In contrast, Ahangari Maleki et al. (70) demonstrated significant immunomodulatory effects of synbiotic supplementation in a 12-week trial involving 48 patients. The study found that synbiotics significantly reduced the proportion of IL-17 expressing CD4+ T cells, downregulated IL-17 and IL-23 gene expression, and decreased serum IL-17 and IL-23 levels. Given the well-established role of these cytokines in driving inflammation in axSpA, these findings suggest that synbiotics may influence key inflammatory pathways. However, despite these immunological changes, synbiotic supplementation did not significantly alter BASDAI or ASDAS-CRP compared with placebo, indicating that while synbiotics may modulate immune responses, their impact on clinical disease activity remains uncertain. Table 2 summarizes studies on axSpA.
3.4 Effect of nutrition and diet in patients with PsA
This review includes two studies focusing on PUFA supplementation and dietary interventions to assess their impact on disease activity and metabolic parameters in PsA patients. One study compared the effects of PUFA supplementation to olive oil (73). A hypocaloric diet-placebo and a diet-fish intervention were employed in the other trial (74).
3.4.1 Diet
Leite et al. (74) conducted a 12-week randomized controlled trial involving 97 patients with PsA, comparing the effects of a hypocaloric diet combined with either placebo or n-3 PUFA supplementation (diet-fish group) against a control group receiving only a placebo. Both diet groups demonstrated significant improvements in disease activity, with reductions in DAS28-CRP and BASDAI scores, particularly in the diet-placebo group (−0.6 ± 0.9; p = 0.004 and −1.39 ± 1.97; p = 0.001, respectively). Additionally, a higher proportion of patients in both diet groups achieved minimal disease activity, a key clinically relevant endpoint that underscores the potential of dietary interventions in PsA management beyond weight loss alone. The diet-fish group experienced significant weight loss (−1.79 ± 2.4 kg; p = 0.004), as well as reductions in waist circumference (−3.28 ± 3.5 cm; p < 0.001) and body fat (−1.2 ± 2.2%; p = 0.006). However, despite these body composition changes, there was no direct correlation between weight loss and disease activity improvement. Notably, improvements in dietary quality, particularly a lower Dietary Inflammatory Index and increased intake of fiber, n-3 PUFA, and antioxidant vitamins, appeared to be more relevant factors in disease activity reduction. Each 100-kcal increase in daily intake was associated with a 3.4-fold worsening of DAS28-ESR scores (OR = 0.34; p = 0.03), highlighting the potential impact of dietary patterns on inflammatory status.
3.4.2 Supplementation
Kristensen et al. (73) conducted a 24-week randomized, double-blind, placebo-controlled trial involving 145 patients with PsA, comparing the effects of daily supplementation with 3 g of n-3 PUFA against a control group receiving olive oil. The primary outcome focused on cardiac autonomic function, with secondary endpoints including hemodynamic measures and disease activity markers. The results demonstrated significant improvements in autonomic function among PUFA-supplemented patients, as indicated by an increase in RR intervals (p = 0.01) and a decrease in heart rate (p = 0.01) in per-protocol analyses. These findings suggest a potential cardioprotective effect of n-3 PUFA, potentially reducing cardiovascular disease risk in PsA patients, who are known to have increased cardiovascular morbidity and mortality. However, disease activity markers such as DAS66/68 and CRP remained unchanged after supplementation, suggesting that PUFA did not significantly alter inflammatory activity in this cohort, likely due to the low baseline disease activity among participants. The study also found no significant changes in blood pressure, pulse wave velocity, or central blood pressure, reinforcing that the primary benefit of PUFA in this context may be through autonomic modulation rather than direct anti-inflammatory effects. Table 3 includes studies on PsA.
4 Discussion
This systematic review comprehensively evaluated the influence of nutrition and diet on three primary types of chronic arthritis: RA, axSpA, and PsA. A total of 49 articles were included, providing insights into the potential benefits and limitations of various dietary interventions, supplements, probiotics, and synbiotics.
For RA, the findings highlight the potential of PUFAs to reduce disease activity (measured by DAS28), inflammatory biomarkers (CRP, ESR, IL-6), and NSAID use, while also modulating lipid and glucose metabolism (27, 30, 35, 40, 41). Specific supplements, such as ginger (26), pomegranate (44), vitamin D (45, 46), N-acetylcysteine (47), quercetin (48), and LD-1227 (49), demonstrated positive effects on disease activity and inflammation. However, inconsistencies in outcomes were noted across some trials, possibly due to variations in dosages, study durations, and patient populations.
Probiotics and synbiotics showed mixed results. Some studies reported significant improvements in disease activity and biomarkers (50, 56, 58), while others observed no notable changes (52, 54). This highlights a critical theme across the literature: the evidence is frequently inconsistent, and these neutral or negative findings from trials must be carefully weighed against the positive reports when considering clinical implications. For instance, the positive effects on disease activity observed with Lactobacillus casei in the Vaghef-Mehrabany et al. (55) trial contrast sharply with the lack of significant changes found with Lactobacillus rhamnosus GG in the Hatakka et al. study (52). Differences in bacterial species (e.g., Lactobacillus, Bifidobacterium), specific strains (e.g., L. casei vs. L. rhamnosus GG), viability (CFU counts), and the presence or absence of prebiotics in synbiotics contribute to diverse immunomodulatory mechanisms and clinical effects, thereby limiting direct comparability and generalizability of findings across this category of interventions. This underscores that ‘probiotics’ cannot be considered a monolithic intervention and that strain-specific effects are a critical factor limiting the generalizability of findings.
Dietary interventions, including the Mediterranean (62, 63), vegan and gluten-free (64, 65), anti-inflammatory (59, 60), peptide (68), and fasting diets (67), were associated with improvements in disease activity, quality of life, cardiovascular risk factors, and inflammatory biomarkers. However, some studies, such as Park et al. (36), observed limited additional effects of n-3 PUFA supplementation in patients with mild and stable disease activity already on antirheumatic medication, potentially due to a ceiling effect.
For axSpA, high-dose n-3 PUFA supplementation demonstrated significant reductions in disease activity, as measured by BASDAI (72). Probiotics did not show significant effects on disease activity or quality of life (69, 71), whereas synbiotics were associated with immunomodulatory effects. For example, Ahangari Maleki et al. (70) showed that synbiotic supplementation reduced IL-17 expressing CD4+ T cells and serum levels of IL-17 and IL-23, which are key drivers of inflammation in axSpA. However, it is crucial to note that these promising biological changes did not consistently translate into significant improvements in clinical disease activity scores like BASDAI or ASDAS-CRP. This highlights a common challenge in nutrition research where effects on surrogate markers do not always correspond to direct clinical benefits, underscoring the importance of patient-relevant outcomes.
For PsA, the role of diet and supplementation remains underexplored. PUFA supplementation showed improvements in cardiac autonomic function (increased RR intervals and decreased heart rate), suggesting potential cardiovascular benefits (73). However, disease activity markers such as DAS66/68 and CRP remained unchanged, likely due to the low baseline disease activity among study participants. Special dietary interventions, including hypocaloric and n-3 PUFA-rich diets, were associated with improvements in disease activity, particularly in the diet-placebo group (74). Weight loss was observed in the diet-fish group, but no correlation was found between weight loss and disease activity. Furthermore, a significant proportion of patients across all groups achieved minimal disease activity, further underscoring the potential role of diet in PsA management.
A key strength of this review is the inclusion of 49 RCTs, allowing for a broad comparison of dietary interventions across three types of arthritis. The studies analyzed covered interventions ranging from short-term (8 weeks) to long-term (12 months), providing insights into both immediate and sustained effects. However, several limitations should be noted. Variations in BMI, gender, disease severity, and duration among participants influenced the outcomes, making comparisons across studies challenging. Differences in study design, such as small sample sizes, short durations, and inconsistent reporting of dropout rates, also limited the reliability of some findings (42, 48). Additionally, variability in the assessment of disease activity and inflammatory biomarkers further complicated direct comparisons. While robust data were available for RA, fewer studies investigated dietary interventions in axSpA and PsA, emphasizing the need for further research in these areas. Finally, the exclusion of studies published in languages other than English is an important limitation. This approach may have introduced a language bias, potentially omitted relevant findings, and thus limiting the global generalizability of our conclusions. This was a pragmatic decision to ensure the accuracy of data interpretation, and we recommend that future reviews on this topic incorporate a multilingual search strategy to provide a more comprehensive evidence base. Furthermore, our search was confined to published articles in major databases and did not extend to grey literature or trial registries. This approach carries a potential risk of reporting bias, as studies with neutral or negative findings may be less likely to be published. Consequently, our review may have overlooked some relevant evidence, and this should be considered when interpreting the findings.
While our review provides valuable insights into the role of nutrition across chronic arthritis types, it is important to contextualize the limited number of eligible RCTs [RCTs for axSpA (3 probiotic/synbiotic RCTs, 1 PUFA RCT) and PsA (2 RCTs)]. This scarcity of evidence from RCTs, while reflecting a true publication gap in high-level evidence for these specific conditions, is also a direct consequence of our stringent inclusion criteria, which exclusively focused on RCTs to ensure the highest level of evidence for causality and efficacy. We acknowledge that observational studies, which were excluded by design, could potentially offer valuable signals and insights into the broader role of nutrition in axSpA and PsA management. While outside the scope of this systematic review, such data could be considered in future research to inform the design and prioritization of subsequent high-quality RCTs.
To advance this field and provide clear, evidence-based guidance, future research should prioritize several key areas. First, methodological rigor must be enhanced through trials with larger sample sizes, longer follow-up periods to assess long-term safety and efficacy, and highly standardized protocols for both dietary and supplement interventions to reduce heterogeneity. This includes developing robust methods for monitoring dietary adherence. Second, to improve clinical applicability, future trials must consistently report on patient-relevant outcomes and evaluate them against established thresholds like the minimal clinically important difference. Third, dedicated research is needed to fill evidence gaps, particularly for under-investigated interventions like synbiotics and for specific populations such as patients with axSpA and PsA. Finally, a greater focus is needed on personalized nutrition, exploring strategies tailored to disease subtype, severity, and individual patient characteristics to optimize arthritis management and support practical implementation in clinical care.
5 Conclusion
In RA, PUFAs and supplements such as ginger, pomegranate, and vitamin D have shown potential in reducing disease activity (e.g., DAS28) and inflammatory markers (CRP, ESR). In axSpA, high-dose PUFA supplementation demonstrated significant reductions in disease activity (BASDAI), while synbiotics showed notable immunomodulatory effects, such as reduced IL-17 levels. Probiotics, however, did not yield significant improvements in disease activity or quality of life. For PsA, PUFA supplementation showed benefits for cardiac autonomic function (e.g., increased RR intervals and reduced heart rate), though effects on disease activity markers such as DAS66/68 and CRP were limited. Special diets, including n-3 PUFA rich and hypocaloric regimens, improved disease activity measures and supported weight loss, though the correlation between weight loss and disease activity remains unclear. Personalized nutritional strategies tailored to disease type, severity, and patient characteristics are essential for optimizing arthritis management. Therefore, future research must prioritize methodologically rigorous trials with standardized protocols, patient-relevant outcomes, and a focus on long-term safety and efficacy to build a robust evidence base for the role of nutrition in managing chronic inflammatory arthritis.
Data availability statement
The original contributions presented in the study are included in the article/supplementary material, further inquiries can be directed to the corresponding author.
Author contributions
KB: Data curation, Writing – original draft, Investigation. MK: Data curation, Visualization, Investigation, Writing – review & editing, Writing – original draft. BN: Writing – review & editing, Supervision, Methodology, Conceptualization, Validation. KV: Conceptualization, Writing – review & editing, Data curation, Methodology, Investigation, Formal analysis.
Funding
The author(s) declare that no financial support was received for the research and/or publication of this article.
Conflict of interest
The authors declare that the research was conducted in the absence of any commercial or financial relationships that could be construed as a potential conflict of interest.
Generative AI statement
The authors declare that no Gen AI was used in the creation of this manuscript.
Any alternative text (alt text) provided alongside figures in this article has been generated by Frontiers with the support of artificial intelligence and reasonable efforts have been made to ensure accuracy, including review by the authors wherever possible. If you identify any issues, please contact us.
Publisher’s note
All claims expressed in this article are solely those of the authors and do not necessarily represent those of their affiliated organizations, or those of the publisher, the editors and the reviewers. Any product that may be evaluated in this article, or claim that may be made by its manufacturer, is not guaranteed or endorsed by the publisher.
References
1. Finckh, A, Gilbert, B, Hodkinson, B, Bae, SC, Thomas, R, Deane, KD, et al. Global epidemiology of rheumatoid arthritis. Nat Rev Rheumatol. (2022) 18:591–602. doi: 10.1038/s41584-022-00827-y
2. Azuaga, AB, Ramirez, J, and Canete, JD. Psoriatic arthritis: pathogenesis and targeted therapies. Int J Mol Sci. (2023) 24:4901. doi: 10.3390/ijms24054901
3. Cutolo, M, and Nikiphorou, E. Nutrition and diet in rheumatoid arthritis. Nutrients. (2022) 14:888. doi: 10.3390/nu14040888
4. Jiang, Y, Jarr, K, Layton, C, Gardner, CD, Ashouri, JF, Abreu, MT, et al. Therapeutic implications of diet in inflammatory bowel disease and related immune-mediated inflammatory diseases. Nutrients. (2021) 13:890. doi: 10.3390/nu13030890
5. Barrea, L, Muscogiuri, G, Frias-Toral, E, Laudisio, D, Pugliese, G, Castellucci, B, et al. Nutrition and immune system: from the Mediterranean diet to dietary supplementary through the microbiota. Crit Rev Food Sci Nutr. (2021) 61:3066–90. doi: 10.1080/10408398.2020.1792826
6. Yu, X, Pu, H, and Voss, M. Overview of anti-inflammatory diets and their promising effects on non-communicable diseases. Br J Nutr. (2024) 132:898–918. doi: 10.1017/S0007114524001405
7. Genel, F, Kale, M, Pavlovic, N, Flood, VM, Naylor, JM, and Adie, S. Health effects of a low-inflammatory diet in adults with arthritis: a systematic review and meta-analysis. J Nutr Sci. (2020) 9:e37. doi: 10.1017/jns.2020.31
8. Camargo, A, Delgado-Lista, J, Garcia-Rios, A, Cruz-Teno, C, Yubero-Serrano, EM, Perez-Martinez, P, et al. Expression of proinflammatory, proatherogenic genes is reduced by the Mediterranean diet in elderly people. Br J Nutr. (2012) 108:500–8. doi: 10.1017/S0007114511005812
9. Espin, JC, Gonzalez-Sarrias, A, and Tomas-Barberan, FA. The gut microbiota: a key factor in the therapeutic effects of (poly)phenols. Biochem Pharmacol. (2017) 139:82–93. doi: 10.1016/j.bcp.2017.04.033
10. Katsimbri, P, Korakas, E, Kountouri, A, Ikonomidis, I, Tsougos, E, Vlachos, D, et al. The effect of antioxidant and anti-inflammatory capacity of diet on psoriasis and psoriatic arthritis phenotype: nutrition as therapeutic tool? Antioxidants. (2021) 10:157. doi: 10.3390/antiox10020157
11. Gioia, C, Lucchino, B, Tarsitano, MG, Iannuccelli, C, and Di Franco, M. Dietary habits and nutrition in rheumatoid arthritis: can diet influence disease development and clinical manifestations? Nutrients. (2020) 12:1456. doi: 10.3390/nu12051456
12. Khan, I, Hussain, M, Jiang, B, Zheng, L, Pan, Y, Hu, J, et al. Omega-3 long-chain polyunsaturated fatty acids: metabolism and health implications. Prog Lipid Res. (2023) 92:101255. doi: 10.1016/j.plipres.2023.101255
13. Schwingshackl, L, and Hoffmann, G. Monounsaturated fatty acids, olive oil and health status: a systematic review and meta-analysis of cohort studies. Lipids Health Dis. (2014) 13:154. doi: 10.1186/1476-511X-13-154
14. Chera, EI, Pop, RM, Parvu, M, Soritau, O, Uifalean, A, Catoi, FA, et al. Flaxseed ethanol extracts' antitumor, antioxidant, and anti-inflammatory potential. Antioxidants. (2022) 11:892. doi: 10.3390/antiox11050892
15. Rahimlou, M, Jahromi, NB, Hasanyani, N, and Ahmadi, AR. Effects of flaxseed interventions on circulating inflammatory biomarkers: a systematic review and meta-analysis of randomized controlled trials. Adv Nutr. (2019) 10:1108–19. doi: 10.1093/advances/nmz048
16. Al-Habsi, N, Al-Khalili, M, Haque, SA, Elias, M, Olqi, NA, and Al Uraimi, T. Health benefits of prebiotics, probiotics, synbiotics, and postbiotics. Nutrients. (2024) 16:3955. doi: 10.3390/nu16223955
17. Colella, M, Charitos, IA, Ballini, A, Cafiero, C, Topi, S, Palmirotta, R, et al. Microbiota revolution: how gut microbes regulate our lives. World J Gastroenterol. (2023) 29:4368–83. doi: 10.3748/wjg.v29.i28.4368
18. Ballini, A, Charitos, IA, Cantore, S, Topi, S, Bottalico, L, and Santacroce, L. About functional foods: the probiotics and prebiotics state of art. Antibiotics. (2023) 12:635. doi: 10.3390/antibiotics12040635
19. Markowiak, P, and Slizewska, K. Effects of probiotics, prebiotics, and synbiotics on human health. Nutrients. (2017) 9:1021. doi: 10.3390/nu9091021
20. Chen, J, Wright, K, Davis, JM, Jeraldo, P, Marietta, EV, Murray, J, et al. An expansion of rare lineage intestinal microbes characterizes rheumatoid arthritis. Genome Med. (2016) 8:43. doi: 10.1186/s13073-016-0299-7
21. Alpizar-Rodriguez, D, Lesker, TR, Gronow, A, Gilbert, B, Raemy, E, Lamacchia, C, et al. Prevotella copri in individuals at risk for rheumatoid arthritis. Ann Rheum Dis. (2019) 78:590–3. doi: 10.1136/annrheumdis-2018-214514
22. Paul, AK, Paul, A, Jahan, R, Jannat, K, Bondhon, TA, Hasan, A, et al. Probiotics and amelioration of rheumatoid arthritis: significant roles of Lactobacillus casei and Lactobacillus acidophilus. Microorganisms. (2021) 9:1070. doi: 10.3390/microorganisms9051070
23. Bungau, SG, Behl, T, Singh, A, Sehgal, A, Singh, S, Chigurupati, S, et al. Targeting probiotics in rheumatoid arthritis. Nutrients. (2021) 13:3376. doi: 10.3390/nu13103376
24. Page, MJ, McKenzie, JE, Bossuyt, PM, Boutron, I, Hoffmann, TC, Mulrow, CD, et al. The PRISMA 2020 statement: an updated guideline for reporting systematic reviews. BMJ. (2021) 372:n71. doi: 10.1136/bmj.n71
25. Academy of Nutrition and Dietetics. Evidence analysis manual: steps in the academy evidence analysis process. Chicago: Academy of Nutrition and Dietetics (2022). 107 p.
26. Aryaeian, N, Shahram, F, Mahmoudi, M, Tavakoli, H, Yousefi, B, Arablou, T, et al. The effect of ginger supplementation on some immunity and inflammation intermediate genes expression in patients with active rheumatoid arthritis. Gene. (2019) 698:179–85. doi: 10.1016/j.gene.2019.01.048
27. Fatel, ECS, Rosa, FT, Alfieri, DF, Flauzino, T, Scavuzzi, BM, Lozovoy, MAB, et al. Beneficial effects of fish oil and cranberry juice on disease activity and inflammatory biomarkers in people with rheumatoid arthritis. Nutrition. (2021) 86:111183. doi: 10.1016/j.nut.2021.111183
28. Bahadori, B, Uitz, E, Thonhofer, R, Trummer, M, Pestemer-Lach, I, McCarty, M, et al. Omega-3 fatty acids infusions as adjuvant therapy in rheumatoid arthritis. JPEN J Parenter Enteral Nutr. (2010) 34:151–5. doi: 10.1177/0148607109342130
29. Berbert, AA, Kondo, CR, Almendra, CL, Matsuo, T, and Dichi, I. Supplementation of fish oil and olive oil in patients with rheumatoid arthritis. Nutrition. (2005) 21:131–6. doi: 10.1016/j.nut.2004.03.023
30. Dawczynski, C, Dittrich, M, Neumann, T, Goetze, K, Welzel, A, Oelzner, P, et al. Docosahexaenoic acid in the treatment of rheumatoid arthritis: a double-blind, placebo-controlled, randomized cross-over study with microalgae vs. sunflower oil. Clin Nutr. (2018) 37:494–504. doi: 10.1016/j.clnu.2017.02.021
31. Dawczynski, C, Schubert, R, Hein, G, Muller, A, Eidner, T, Vogelsang, H, et al. Long-term moderate intervention with n-3 long-chain PUFA-supplemented dairy products: effects on pathophysiological biomarkers in patients with rheumatoid arthritis. Br J Nutr. (2009) 101:1517–26. doi: 10.1017/S0007114508076216
32. Geusens, P, Wouters, C, Nijs, J, Jiang, Y, and Dequeker, J. Long-term effect of omega-3 fatty acid supplementation in active rheumatoid arthritis. A 12-month, double-blind, controlled study. Arthritis Rheum. (1994) 37:824–9. doi: 10.1002/art.1780370608
33. Hosseini, SA, Rahim, F, and Mola, K. Omega-3 induced change in clinical parameters of rheumatoid arthritis. J Med Sci. (2009) 9:93–7. doi: 10.3923/jms.2009.93.97
34. Kremer, JM, Lawrence, DA, Jubiz, W, DiGiacomo, R, Rynes, R, Bartholomew, LE, et al. Dietary fish oil and olive oil supplementation in patients with rheumatoid arthritis. Clinical and immunologic effects. Arthritis Rheum. (1990) 33:810–20. doi: 10.1002/art.1780330607
35. Kremer, JM, Lawrence, DA, Petrillo, GF, Litts, LL, Mullaly, PM, Rynes, RI, et al. Effects of high-dose fish oil on rheumatoid arthritis after stopping nonsteroidal antiinflammatory drugs. Clinical and immune correlates. Arthritis Rheum. (1995) 38:1107–14. doi: 10.1002/art.1780380813
36. Park, Y, Lee, A, Shim, SC, Lee, JH, Choe, JY, Ahn, H, et al. Effect of n-3 polyunsaturated fatty acid supplementation in patients with rheumatoid arthritis: a 16-week randomized, double-blind, placebo-controlled, parallel-design multicenter study in Korea. J Nutr Biochem. (2013) 24:1367–72. doi: 10.1016/j.jnutbio.2012.11.004
37. Proudman, SM, Cleland, LG, Metcalf, RG, Sullivan, TR, Spargo, LD, and James, MJ. Plasma n-3 fatty acids and clinical outcomes in recent-onset rheumatoid arthritis. Br J Nutr. (2015) 114:885–90. doi: 10.1017/S0007114515002718
38. Remans, PH, Sont, JK, Wagenaar, LW, Wouters-Wesseling, W, Zuijderduin, WM, Jongma, A, et al. Nutrient supplementation with polyunsaturated fatty acids and micronutrients in rheumatoid arthritis: clinical and biochemical effects. Eur J Clin Nutr. (2004) 58:839–45. doi: 10.1038/sj.ejcn.1601883
39. Sundrarjun, T, Komindr, S, Archararit, N, Dahlan, W, Puchaiwatananon, O, Angthararak, S, et al. Effects of n-3 fatty acids on serum interleukin-6, tumour necrosis factor-alpha and soluble tumour necrosis factor receptor p55 in active rheumatoid arthritis. J Int Med Res. (2004) 32:443–54. doi: 10.1177/147323000403200501
40. van der Tempel, H, Tulleken, JE, Limburg, PC, Muskiet, FA, and van Rijswijk, MH. Effects of fish oil supplementation in rheumatoid arthritis. Ann Rheum Dis. (1990) 49:76–80. doi: 10.1136/ard.49.2.76
41. Kremer, JM, Bigauoette, J, Michalek, AV, Timchalk, MA, Lininger, L, Rynes, RI, et al. Effects of manipulation of dietary fatty acids on clinical manifestations of rheumatoid arthritis. Lancet. (1985) 1:184–7. doi: 10.1016/S0140-6736(85)92024-0
42. Magaro, M, Altomonte, L, Zoli, A, Mirone, L, De Sole, P, Di Mario, G, et al. Influence of diet with different lipid composition on neutrophil chemiluminescence and disease activity in patients with rheumatoid arthritis. Ann Rheum Dis. (1988) 47:793–6. doi: 10.1136/ard.47.10.793
43. Nordström, DC, Honkanen, VE, Nasu, Y, Antila, E, Friman, C, and Konttinen, YT. Alpha-linolenic acid in the treatment of rheumatoid arthritis. A double-blind, placebo-controlled and randomized study: flaxseed vs. safflower seed. Rheumatol Int. (1995) 14:231–4. doi: 10.1007/BF00262088
44. Ghavipour, M, Sotoudeh, G, Tavakoli, E, Mowla, K, Hasanzadeh, J, and Mazloom, Z. Pomegranate extract alleviates disease activity and some blood biomarkers of inflammation and oxidative stress in rheumatoid arthritis patients. Eur J Clin Nutr. (2017) 71:92–6. doi: 10.1038/ejcn.2016.151
45. Gopinath, K, and Danda, D. Supplementation of 1,25 dihydroxy vitamin D3 in patients with treatment naive early rheumatoid arthritis: a randomised controlled trial. Int J Rheum Dis. (2011) 14:332–9. doi: 10.1111/j.1756-185X.2011.01684.x
46. Soubrier, M, Lambert, C, Combe, B, Gaudin, P, Thomas, T, and Sibilia, J. A randomised, double-blind, placebo-controlled study assessing the efficacy of high doses of vitamin D on functional disability in patients with rheumatoid arthritis. Clin Exp Rheumatol. (2018) 36:1056–60.
47. Esalatmanesh, K, Jamali, A, Esalatmanesh, R, Soleimani, Z, Khabbazi, A, and Malek Mahdavi, A. Effects of N-acetylcysteine supplementation on disease activity, oxidative stress, and inflammatory and metabolic parameters in rheumatoid arthritis patients: a randomized double-blind placebo-controlled trial. Amino Acids. (2022) 54:433–40. doi: 10.1007/s00726-022-03134-8
48. Bae, SC, Jung, WJ, Lee, EJ, Yu, R, and Sung, MK. Effects of antioxidant supplements intervention on the level of plasma inflammatory molecules and disease severity of rheumatoid arthritis patients. J Am Coll Nutr. (2009) 28:56–62. doi: 10.1080/07315724.2009.10719762
49. Lorenzetti, A, Solimene, U, Rastmanesh, R, Marotta, F, He, F, Rasulova, S, et al. Adjuvant benefit of a peptide-rich marine biology formula (LD-1227) in rheumatoid arthritis: a randomized, double-blind, controlled study. Funct Foods Health Dis. (2022) 12:488–501. doi: 10.31989/ffhd.v12i9.960
50. Alavi, A, Goodfellow, L, Fraser, O, Tarelli, E, Bland, M, and Axford, J. A double-blind, randomized, placebo-controlled study to explore the efficacy of a dietary plant-derived polysaccharide supplement in patients with rheumatoid arthritis. Rheumatology. (2011) 50:1111–9. doi: 10.1093/rheumatology/keq427
51. Cannarella, LAT, Mari, NL, Alcantara, CC, Iryioda, TMV, Costa, NT, Oliveira, SR, et al. Mixture of probiotics reduces inflammatory biomarkers and improves the oxidative/nitrosative profile in people with rheumatoid arthritis. Nutrition. (2021) 89:111282. doi: 10.1016/j.nut.2021.111282
52. Hatakka, K, Martio, J, Korpela, M, Herranen, M, Poussa, T, Laasanen, T, et al. Effects of probiotic therapy on the activity and activation of mild rheumatoid arthritis—a pilot study. Scand J Rheumatol. (2003) 32:211–5. doi: 10.1080/03009740310003695
53. Mandel, DR, Eichas, K, and Holmes, J. Bacillus coagulans: a viable adjunct therapy for relieving symptoms of rheumatoid arthritis according to a randomized, controlled trial. BMC Complement Altern Med. (2010) 10:1. doi: 10.1186/1472-6882-10-1
54. de Los Angeles Pineda, M, Thompson, SF, Summers, K, de Leon, F, Pope, J, and Reid, G. A randomized, double-blinded, placebo-controlled pilot study of probiotics in active rheumatoid arthritis. Med Sci Monit. (2011) 17:CR347–54. doi: 10.12659/msm.881808
55. Vaghef-Mehrabany, E, Homayouni Rad, A, Alipour, B, Vaghef-Mehrabany, L, and Saghafi Asl, M. Formulation and design of probiotic supplements for rheumatoid arthritis patients. Pharm Sci. (2018) 24:44–51. doi: 10.15171/PS.2018.08
56. Zamani, B, Golkar, HR, Farshbaf, S, Emadi-Baygi, M, Tajabadi-Ebrahimi, M, Jafari, P, et al. Clinical and metabolic response to probiotic supplementation in patients with rheumatoid arthritis: a randomized, double-blind, placebo-controlled trial. Int J Rheum Dis. (2016) 19:869–79. doi: 10.1111/1756-185X.12888
57. Zamani, B, Farshbaf, S, Golkar, HR, Bahmani, F, and Asemi, Z. Synbiotic supplementation and the effects on clinical and metabolic responses in patients with rheumatoid arthritis: a randomised, double-blind, placebo-controlled trial. Br J Nutr. (2017) 117:1095–102. doi: 10.1017/S000711451700085X
58. Esmaeili, F, Salesi, M, Askari, G, Esmaeilisharif, A, Maracy, M, Karimzadeh, H, et al. Efficacy of synbiotic supplementation in improving rheumatoid arthritis. Res Pharm Sci. (2020) 15:263–72. doi: 10.4103/1735-5362.288432
59. Vadell, AKE, Barebring, L, Hulander, E, Gjertsson, I, Lindqvist, HM, and Winkvist, A. Anti-inflammatory diet in rheumatoid arthritis (ADIRA)-a randomized, controlled crossover trial indicating effects on disease activity. Am J Clin Nutr. (2020) 111:1203–13. doi: 10.1093/ajcn/nqaa019
60. Adam, O, Beringer, C, Kless, T, Lemmen, C, Adam, A, Wiseman, M, et al. Anti-inflammatory effects of a low arachidonic acid diet and fish oil in patients with rheumatoid arthritis. Rheumatol Int. (2003) 23:27–36. doi: 10.1007/s00296-002-0234-7
61. Raad, T, George, E, Griffin, A, Larkin, L, Fraser, A, Kennedy, N, et al. Effects of a telehealth-delivered Mediterranean diet intervention in adults with rheumatoid arthritis (MEDRA): a randomised controlled trial. BMC Musculoskelet Disord. (2024) 25:631. doi: 10.1186/s12891-024-07742-1
62. Sadeghi, A, Tabatabaiee, M, Mousavi, MA, Mousavi, SN, Abdollahi Sabet, S, and Jalili, N. Dietary pattern or weight loss: which one is more important to reduce disease activity score in patients with rheumatoid arthritis? A randomized feeding trial. Int J Clin Pract. (2022) 2022:6004916. doi: 10.1155/2022/6004916
63. Sköldstam, L, Hagfors, L, and Johansson, G. An experimental study of a Mediterranean diet intervention for patients with rheumatoid arthritis. Ann Rheum Dis. (2003) 62:208–14. doi: 10.1136/ard.62.3.208
64. Elkan, AC, Sjoberg, B, Kolsrud, B, Ringertz, B, Hafström, I, and Frostegard, J. Gluten-free vegan diet induces decreased LDL and oxidized LDL levels and raised atheroprotective natural antibodies against phosphorylcholine in patients with rheumatoid arthritis: a randomized study. Arthritis Res Ther. (2008) 10:R34. doi: 10.1186/ar2388
65. Hafström, I, Ringertz, B, Spangberg, A, von Zweigbergk, L, Brannemark, S, Nylander, I, et al. A vegan diet free of gluten improves the signs and symptoms of rheumatoid arthritis: the effects on arthritis correlate with a reduction in antibodies to food antigens. Rheumatology. (2001) 40:1175–9. doi: 10.1093/rheumatology/40.10.1175
66. Ghaseminasab-Parizi, M, Nazarinia, MA, and Akhlaghi, M. The effect of flaxseed with or without anti-inflammatory diet in patients with rheumatoid arthritis, a randomized controlled trial. Eur J Nutr. (2022) 61:1377–89. doi: 10.1007/s00394-021-02707-9
67. Hartmann, AM, Dell'Oro, M, Spoo, M, Fischer, JM, Steckhan, N, Jeitler, M, et al. To eat or not to eat-an exploratory randomized controlled trial on fasting and plant-based diet in rheumatoid arthritis (NutriFast-study). Front Nutr. (2022) 9:1030380. doi: 10.3389/fnut.2022.1030380
68. Holst-Jensen, SE, Pfeiffer-Jensen, M, Monsrud, M, Tarp, U, Buus, A, Hessov, I, et al. Treatment of rheumatoid arthritis with a peptide diet: a randomized, controlled trial. Scand J Rheumatol. (1998) 27:329–36. doi: 10.1080/03009749850154339
69. Jenks, K, Stebbings, S, Burton, J, Schultz, M, Herbison, P, and Highton, J. Probiotic therapy for the treatment of spondyloarthritis: a randomized controlled trial. J Rheumatol. (2010) 37:2118–25. doi: 10.3899/jrheum.100193
70. Ahangari Maleki, M, Malek Mahdavi, A, Soltani-Zangbar, MS, Yousefi, M, and Khabbazi, A. Randomized double-blinded controlled trial on the effect of synbiotic supplementation on IL-17/IL-23 pathway and disease activity in patients with axial spondyloarthritis. Immunopharmacol Immunotoxicol. (2023) 45:43–51. doi: 10.1080/08923973.2022.2112220
71. Brophy, S, Burrows, CL, Brooks, C, Gravenor, MB, Siebert, S, and Allen, SJ. Internet-based randomised controlled trials for the evaluation of complementary and alternative medicines: probiotics in spondyloarthropathy. BMC Musculoskelet Disord. (2008) 9:4. doi: 10.1186/1471-2474-9-4
72. Sundström, B, Stalnacke, K, Hagfors, L, and Johansson, G. Supplementation of omega-3 fatty acids in patients with ankylosing spondylitis. Scand J Rheumatol. (2006) 35:359–62. doi: 10.1080/03009740600844357
73. Kristensen, S, Schmidt, EB, Schlemmer, A, Rasmussen, C, Lindgreen, E, Johansen, MB, et al. The effect of marine n-3 polyunsaturated fatty acids on cardiac autonomic and hemodynamic function in patients with psoriatic arthritis: a randomised, double-blind, placebo-controlled trial. Lipids Health Dis. (2016) 15:216. doi: 10.1186/s12944-016-0382-5
74. Leite, BF, Morimoto, MA, Gomes, CMF, Klemz, BNC, Genaro, PS, Shivappa, N, et al. Dietetic intervention in psoriatic arthritis: the DIETA trial. Adv Rheumatol. (2022) 62:12. doi: 10.1186/s42358-022-00243-6
Keywords: rheumatoid arthritis, psoriatic arthritis, spondyloarthritis, nutrition, diet, probiotics, synbiotics, polyunsaturated fatty acids (PUFA)
Citation: Van den Bruel K, Kulyk M, Neerinckx B and De Vlam K (2025) Nutrition and diet in rheumatoid arthritis, axial spondyloarthritis, and psoriatic arthritis: a systematic review. Front. Med. 12:1655165. doi: 10.3389/fmed.2025.1655165
Edited by:
Gloria Candelas, Hospital Clinico San Carlos Servicio de Reumatología, SpainReviewed by:
Dalifer Freites, San Carlos University Clinical Hospital, SpainInes Perez Sancristobal, Severo Ochoa University Hospital, Spain
Copyright © 2025 Van den Bruel, Kulyk, Neerinckx and De Vlam. This is an open-access article distributed under the terms of the Creative Commons Attribution License (CC BY). The use, distribution or reproduction in other forums is permitted, provided the original author(s) and the copyright owner(s) are credited and that the original publication in this journal is cited, in accordance with accepted academic practice. No use, distribution or reproduction is permitted which does not comply with these terms.
*Correspondence: Myroslava Kulyk, bXlyb3NsYXZhLmt1bHlrQGt1bGV1dmVuLmJl