 Bao Qi1
 Lu Zhang
 Chunyang Meng
 Wei Wei
 Qingwei Li
- 1Department of Spine Surgery, Affiliated Hospital of Jining Medical University, Jining, Shandong, China
- 2Department of Interventional Radiography, Affiliated Hospital of Jining Medical University, Jining, China
- 3Department of Medical Research Center, Affiliated Hospital of Jining Medical University, Jining, China
- 4China Medical University, Shenyang, Liaoning, China
- 5Department of Spine Surgery, Dalian Central Hospital, Dalian, Liaoning, China
Background: Osteoporotic vertebral compression fractures (OVCFs) pose a significant health burden in older adult populations, with postoperative re-fracture (re.fra) complicating recovery. Existing models (e.g., FRAX, QFracture) inadequately address comorbidities and modifiable lifestyle factors. This study aimed to develop and validate a novel nomogram integrating these underrecognized yet critical predictors for personalized risk stratification.
Methods: A retrospective cohort of 560 older adult OVCF patients undergoing percutaneous vertebroplasty (PVP) was analyzed. Patients were randomly divided into training (70%, n = 392) and testing (30%, n = 168) cohorts. Univariable and backward stepwise multivariable logistic regression identified independent re.fra predictors. A nomogram was developed and internally validated using area under the curve (AUC), calibration curves (slopes, intercepts), Brier scores, and decision curve analysis (DCA) to assess discrimination, calibration, and clinical utility.
Results: Independent predictors included tumor history [adjusted odds ratio (aOR) = 12.29, 95% CI: 2.50–60.35], scoliosis (aOR = 6.46, 95% CI: 2.97–14.03), mental disorders (aOR = 5.91, 95% CI: 2.73–12.82), alcohol use ≥10 years (aOR = 3.69, 95% CI: 1.90–7.17), and chronic kidney disease (aOR = 3.12, 95% CI: 1.61–6.06). Hypertension exhibited a paradoxical protective association (aOR = 0.50, 95% CI: 0.27–0.93). The nomogram demonstrated strong discrimination [AUC:0.886 (training), 0.827 (testing)], excellent calibration in training (slope = 1.000, Brier = 0.118) with slight deviation in testing (slope = 0.697, Brier = 0.162), and superior net benefit over treat-all/none strategies across thresholds (DCA).
Conclusion: This validated nomogram integrates often-overlooked comorbidities and lifestyle factors to predict post-PVP re.fra risk, providing a practical tool for personalized management and highlighting the need for multidisciplinary care in high-risk subgroups such as those with scoliosis, mental disorders, or prolonged alcohol use. The intriguing protective association of hypertension, however, requires cautious interpretation and further investigation before clinical application.
Introduction
OVCFs pose a significant global health burden, especially in the older adult, with prevalence rising in tandem with aging populations. As the most common manifestation of osteoporotic fractures, OVCFs often lead to debilitating pain, spinal deformity, and increased mortality, profoundly impairing quality of life and imposing significant socioeconomic costs (1). PVP is a widely used minimally invasive intervention for OVCFs that do not respond to conservative treatment, providing rapid pain relief and vertebral stabilization (2). However, postoperative re.fra—occurring in up to 52% of older adult patients—remain a critical complication (3), necessitating repeat interventions and exacerbating morbidity.
Existing studies have identified demographic, and treatment-related risk factors for OVCF re.fra, including advanced age, low bone mineral density (BMD), cement leakage et al. (4, 5). However, the influence of age-related comorbidities and modifiable lifestyle factors on OVCF re.fra risk remains poorly understood. Chronic conditions such as diabetes mellitus (DM), CKD, mental disorders, and lifestyle factors like prolonged alcohol use are prevalent in older adult populations and may synergistically exacerbate skeletal fragility (6–8). Notably, prior predictive models often overlook these multifactorial interactions, relying instead on limited variables without robust validation, thereby hindering clinical utility.
This study aimed to develop and validate a nomogram that integrates both traditional and novel risk factors—including comorbidities and lifestyle variables—to predict re.fra risk in older adult OVCF patients following PVP. Using a large retrospective cohort, we identified key predictors and constructed a clinically actionable tool for personalized risk stratification. Our model emphasizes a holistic view of bone health in the older adult, with implications for international clinical practice and resource allocation.
Methods
Study design and cohort selection
This retrospective cohort study enrolled 560 patients diagnosed with OVCF who underwent PVP between August 1, 2015 and December 31, 2024 at a tertiary medical center. The study cohort comprised 560 patients who underwent surgical intervention for OVCF. Patients were divided into a training set (n = 392, 70%) and a testing set (n = 168, 30%) using a random sampling method to ensure balanced distribution of baseline characteristics. Inclusion criteria were: (1) age ≥50 years, (2) confirmed diagnosis of OVCF based on radiographic evidence, and (3) availability of complete clinical and follow-up data. Exclusion criteria included: (1) pathological fractures due to malignancy, (2) previous spinal surgery, and (3) incomplete medical records. This study was ethically approved by the institutional review committee of Jining Medical College (Approval No. 2024-08-C024). The studies were conducted in accordance with the local legislation and institutional requirements. The participants provided their written informed consent to participate in this study.
Data collection and variables
Baseline demographic and clinical variables were extracted from electronic health records, including age, sex, occupation, insurance status, comorbidities [hypertension, DM, chronic obstructive pulmonary disease, CKD, mental disorders, scoliosis (defined by a Cobb angle ≥10° on standardized spinal radiographs, as confirmed by orthopedic surgeons or radiologists), and tumor history (defined as a history of benign tumors or previously treated and currently non-metastatic malignant tumors; patients with active malignancy or metastatic spinal disease were excluded as per exclusion criteria)], and lifestyle factors [alcohol use ≥10 years (defined as a history of regular alcohol consumption sustained for more than 10 years, based on retrospective electronic health record review; documented occasional or social drinking without sustained habit was excluded)]. Missing values were addressed using predictive mean matching, a multiple imputation method preserving data distribution integrity (9). OVCF re.fra was defined as a new vertebral fracture occurring within 24 months after PVP, confirmed by two independent radiologists. The follow-up period for all included patients ranged from 24 to 36 months. Variables were standardized using predefined criteria [e.g., hypertension: systolic/diastolic blood pressure ≥140/90 mmHg (10)].
Statistical analysis
Baseline characteristics and group comparison
Continuous variables were reported as mean ± standard deviation and compared using Student’s t-test if normally distributed; otherwise, the Mann–Whitney U test was used. Normality was assessed using the Shapiro–Wilk test. Categorical variables (e.g., comorbidities) were expressed as frequencies (%) and analyzed via Pearson’s chi-square or Fisher’s exact test. A p-value >0.05 indicated no significant imbalance between training and testing sets, except for prespecified variables (DM, mental disorders), which were retained for adjustment in subsequent analyses.
Risk factor identification
Univariable logistic regression was performed to assess associations between candidate variables and OVCF re.fra. Variables with p < 0.10 in univariable analysis were included in a backward stepwise multivariable logistic regression model. aOR with 95% confidence intervals (CI) were computed.
Nomogram development
A nomogram was constructed based on the final multivariable model, with points assigned to each predictor proportional to its regression coefficient. Total points were converted to predicted OVCF re.fra probabilities using a linear predictor scale. The nomogram’s discriminative ability was visualized by mapping point ranges to probability thresholds (1–97%).
Model performance evaluation
Model discrimination was assessed via AUC. Calibration was evaluated using calibration curves, the Hosmer–Lemeshow test, and Brier scores (lower values indicate better accuracy). DCA quantified clinical utility by comparing net benefits across threshold probabilities (11). Since DCA can display the false- and the true-positive fractions as functions of the risk threshold, it compensates for deficiency of receiver operating characteristic (ROC) curves (12).
Validation strategy
Internal validation was conducted by evaluating model performance in the testing set. Overfitting was assessed by comparing training and testing AUCs, with a ΔAUC <0.10 deemed acceptable. All analyses were performed using R 4.3.0 (packages: rms, pROC, rmda), with two-tailed p < 0.05 considered statistically significant.
Results
Baseline characteristics of the cohort
The study cohort comprised 560 patients with OVCF, divided into a training set (n = 392, 70%) and a testing set (n = 168, 30%). Baseline characteristics were well-balanced between the two sets, with no significant differences in most demographic and clinical variables (all p > 0.05, Table 1). The mean age of the cohort was 69.91 ± 6.77 years, with a slightly higher proportion of females (54.5%) compared to males (45.5%). The majority of the patients were retirees (73.0%) and had health insurance coverage (94.8%). Key comorbidities included hypertension (62.1%), DM (42.3%), chronic obstructive pulmonary disease (54.8%), and CKD (29.5%). Notably, the prevalence of OVCF re.fra was consistent across the training (31.6%) and testing sets (38.1%, p = 0.166), ensuring comparable risk profiles for model development and validation. However, significant imbalances were observed in DM and mental disorders, with higher prevalence in the validation set (DM: 49.4% vs. 39.3%, p = 0.033; mental disorders: 29.8% vs. 21.2%, p = 0.038). These findings suggest that the training and validation sets were generally well-balanced for most baseline characteristics, though the observed disparities in DM and mental disorders warrant consideration in subsequent analyses to mitigate potential confounding effects.
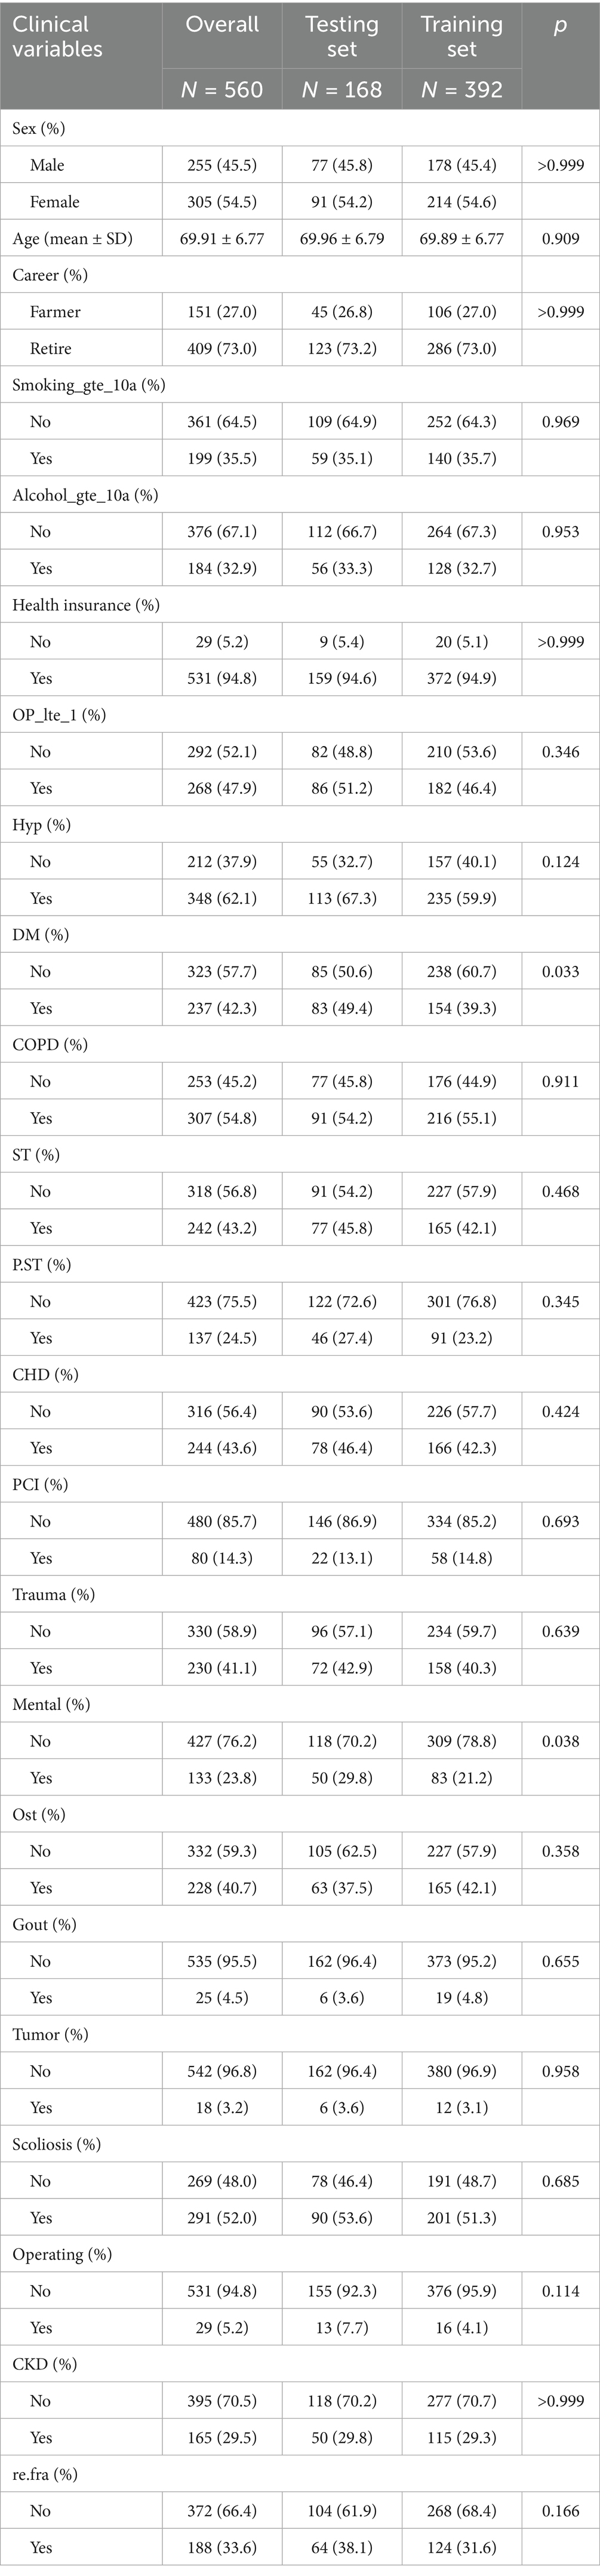
Table 1. Baseline characteristics of the study population in the training and testing sets.
Independent risk factors for postoperative OVCF re.fra
Univariable and multivariable logistic regression analyses were performed to identify factors associated with OVCF re.fra. In univariable analysis, significant predictors included alcohol use for ≥10 years (OR = 2.02, 95% CI: 1.30–3.15, p = 0.002), hypertension (OR = 0.41, 95% CI: 0.26–0.63, p < 0.001), mental disorders (OR = 7.92, 95% CI: 4.63–13.55, p < 0.001), scoliosis (OR = 15.28, 95% CI: 8.30–28.15, p < 0.001), CKD (OR = 6.05, 95% CI: 3.76–9.74, p < 0.001), and tumor history (OR = 3.15, 95% CI: 0.98–10.12, p = 0.054). After adjustment in the multivariable model, alcohol use for ≥10 years (aOR = 3.69, 95% CI: 1.90–7.17, p < 0.001), mental disorders (aOR = 5.91, 95% CI: 2.73–12.82, p < 0.001), scoliosis (aOR = 6.46, 95% CI: 2.97–14.03, p < 0.001), CKD (aOR = 3.12, 95% CI: 1.61–6.06, p < 0.001), and tumor history (aOR = 12.29, 95% CI: 2.50–60.35, p = 0.002) remained independently associated with OVCF re.fra. Hypertension retained significance but with reduced effect size (aOR = 0.50, 95% CI: 0.27–0.93, p = 0.028) (Table 2).
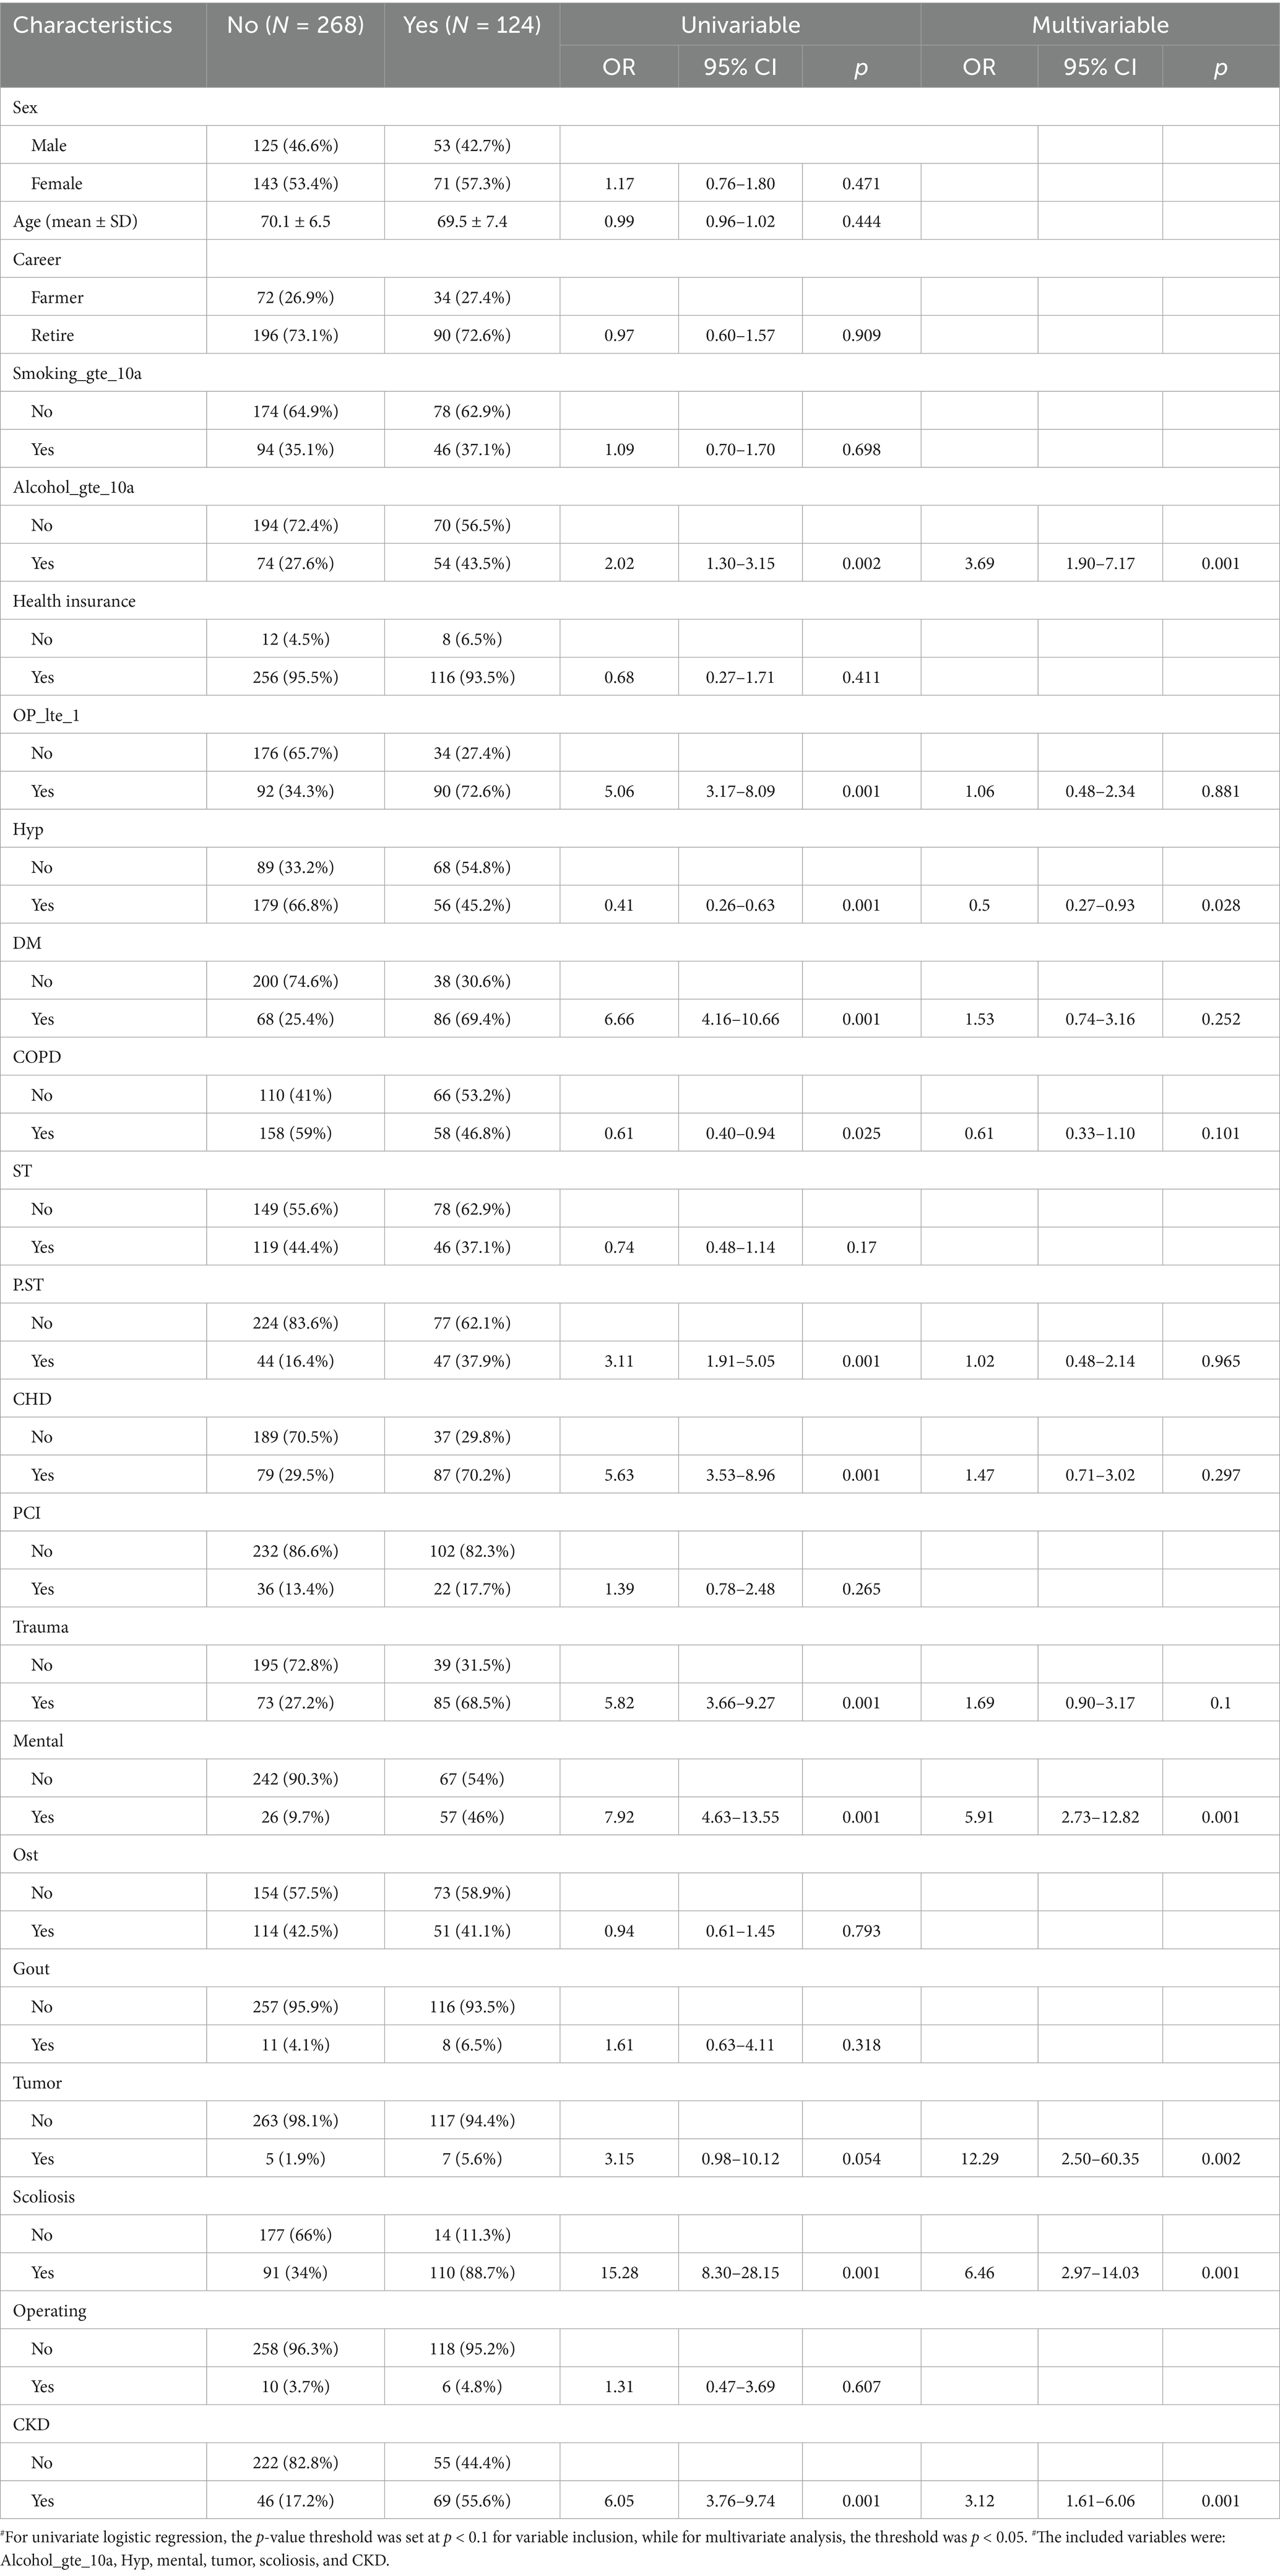
Table 2. Univariate and multivariate logistic regression analysis of factors associated with risk factors for refracture.
Nomogram for OVCF re.fra risk prediction
Nomograms for predicting OVCF re.fra risk were constructed based on the multivariable logistic regression model (Figures 1A,B). Key predictors included alcohol use for ≥10 years, hypertension, mental disorders, tumor history, scoliosis, and CKD. Each variable was assigned a weighted point score proportional to its regression coefficient. The total points derived from individual predictors were mapped to a linear predictor scale and corresponding OVCF re.fra probability. For example, a total score of 310 points translated to a predicted probability of 0.899 (89.9%). The probability scale ranged from 0.01 (1%) at 100 points to 0.97 (97%) at 350 points, demonstrating the model’s discriminative capacity across a wide risk spectrum.
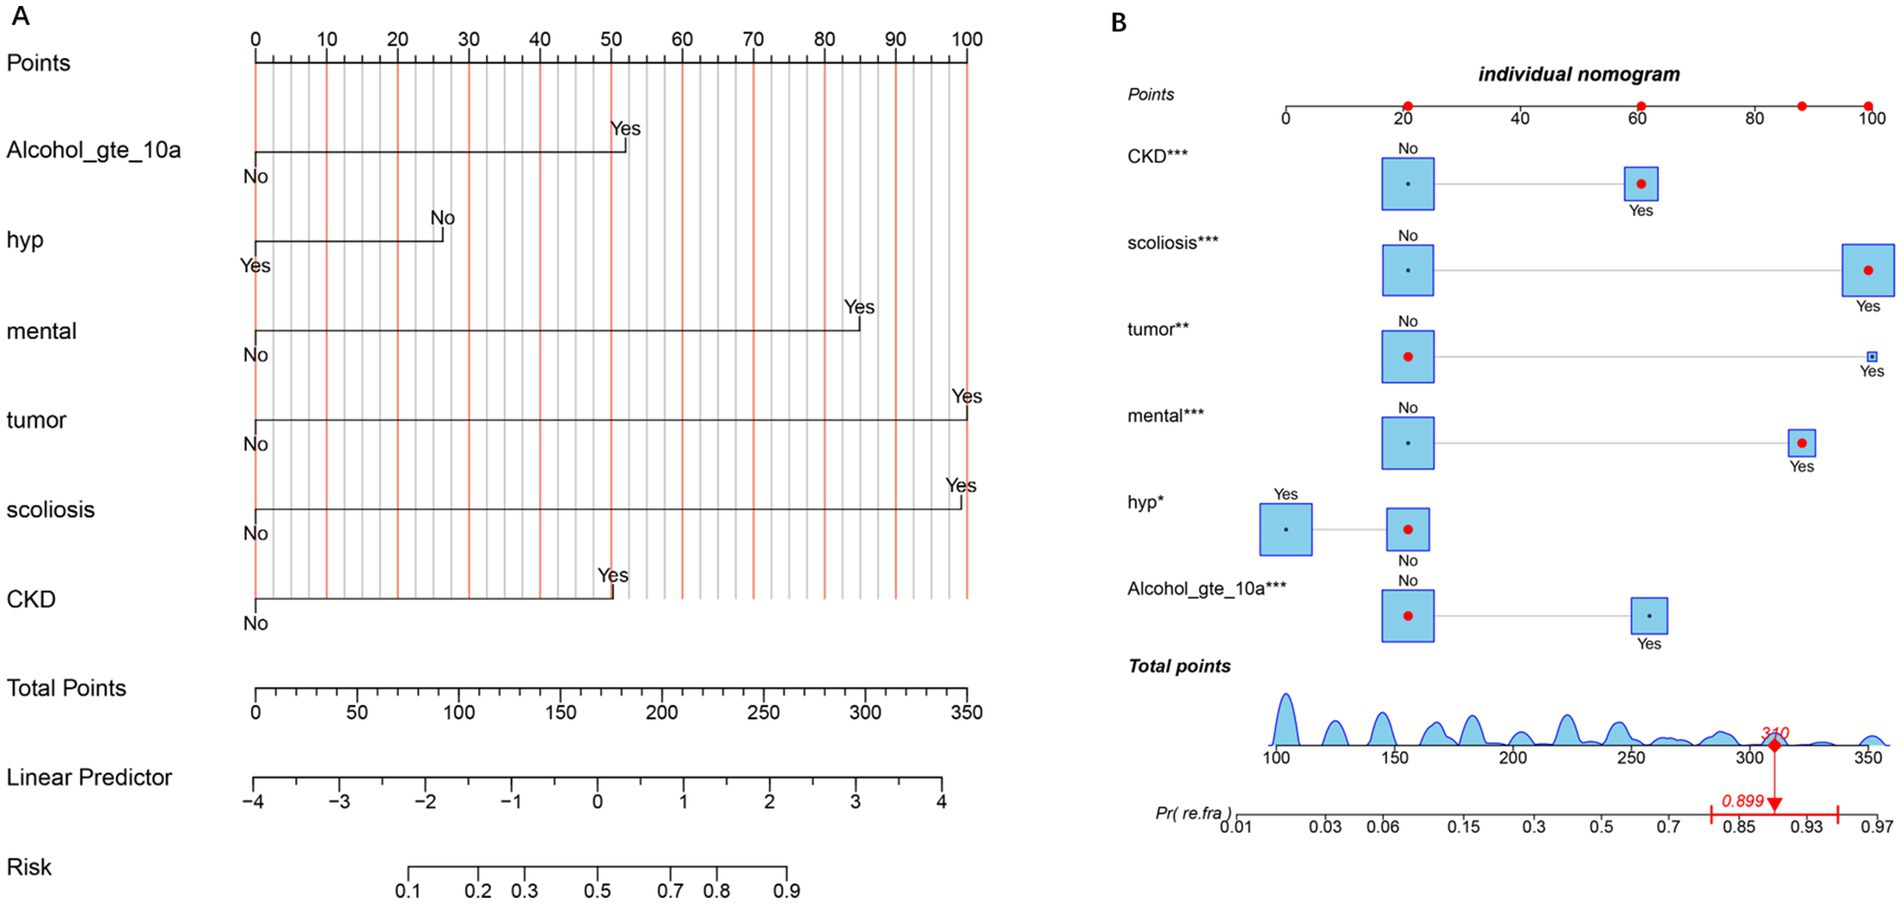
Figure 1. Nomogram for predicting the risk of refracture. (A) The nomogram illustrates the contribution of each predictor (e.g., Alcohol_gte_10a, hypertension, mental health, tumor, scoliosis, and CKD) to the total points, which are then mapped to the linear predictor and the corresponding risk probability. The “No” and “Yes” options for each predictor indicate the absence or presence of the condition, respectively. Higher total points correlate with an increased risk of the outcome. (B) Individual nomogram displaying the detailed point allocation for each predictor, with asterisks denoting the statistical significance of variables (*p < 0.05, **p < 0.01, and ***p < 0.001). The bottom axis shows the total points, which are converted to the predicted probability of the refracture, with an example calculation (310 points ≈89.9% risk).
Predictive performance of the model
The predictive performance of the model was evaluated using ROC curve analysis for both the training and testing datasets (Figures 2A,B). In the training set, the model demonstrated excellent discriminative ability, with an AUC of 0.886. This high AUC value indicates strong predictive accuracy in distinguishing between individuals with and without OVCF re.fra within the training cohort. The model’s performance was further validated in the testing set, where it achieved an AUC of 0.827. Although slightly lower than the training set, this AUC value still reflects good predictive performance, suggesting that the model generalizes well to the unknown data. The minimal reduction in performance (ΔAUC = 0.059) implies no substantial overfitting, underscoring the model’s stability and clinical applicability.
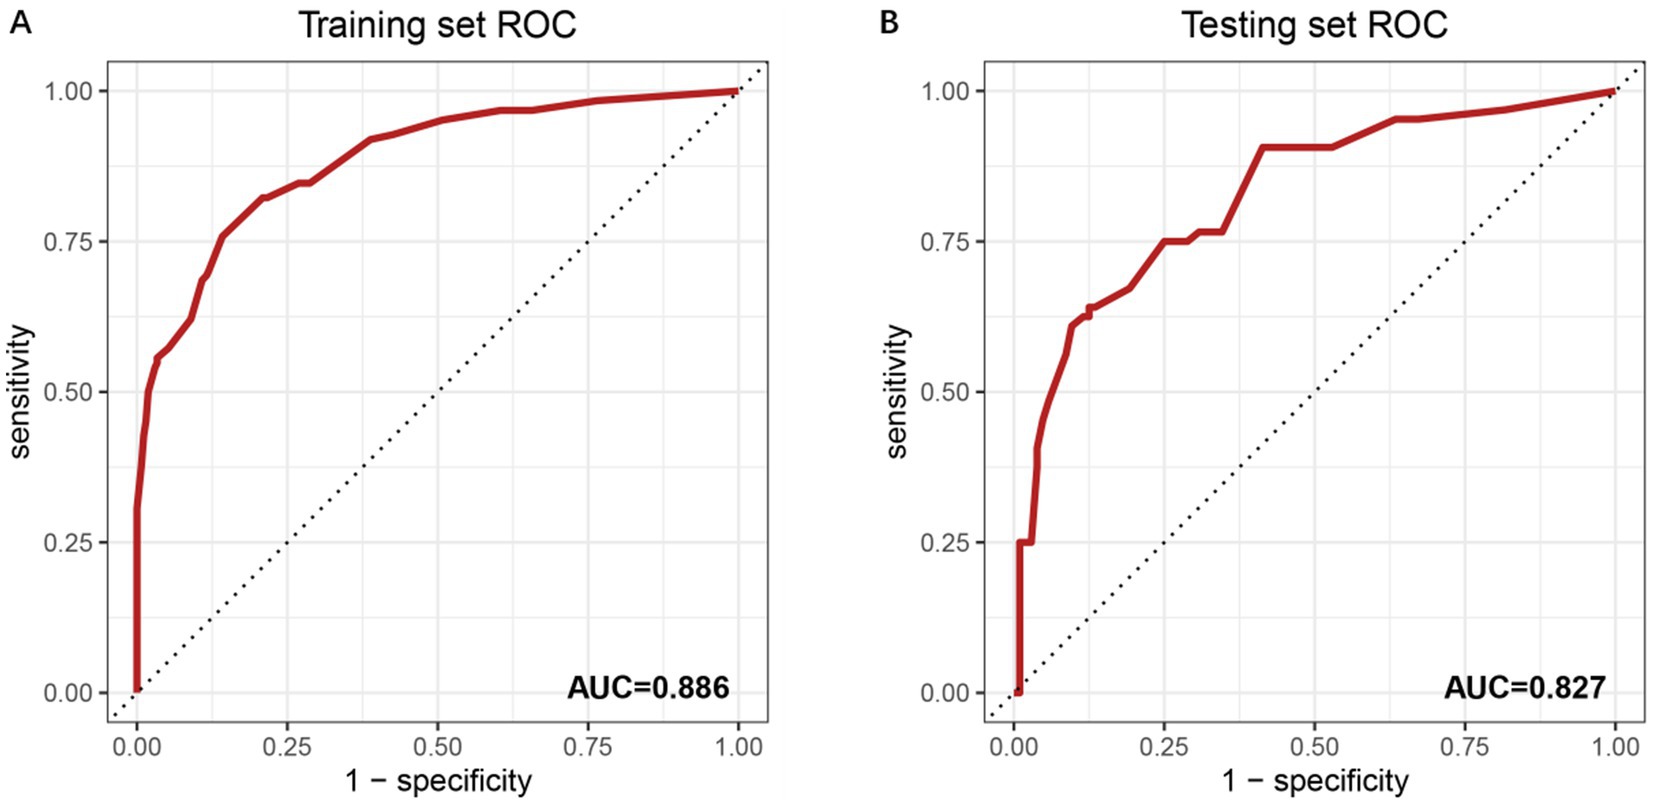
Figure 2. ROC curves for model performance evaluation. (A) ROC curve of the training set with an AUC of 0.886. The x-axis represents the false positive rate (1-specificity), and the y-axis denotes the true positive rate (sensitivity). The diagonal dashed line indicates a reference performance (AUC = 0.5). Numerical labels (0.00, 0.25, 0.50, 0.75, 1) correspond to key thresholds for specificity and sensitivity. (B) ROC curve of the independent testing set, showing an AUC of 0.827. The reduced AUC compared to the training set suggests the model’s generalizability. Threshold values (0.00, 0.25, 0.50, 0.75, 1) align with standard ROC interpretation.
Calibration of the prediction model
The calibration of the prediction model was assessed using calibration curves for both the training and testing sets (Figures 3A,B). In the training set, the model demonstrated excellent calibration, with a calibration slope of 1.000 and an intercept of 0.000, indicating near-perfect agreement between predicted and observed probabilities. The Brier score, a measure of overall model accuracy, was 0.118, further supporting the model’s strong predictive performance. In the testing set, the model maintained good calibration, though with a slight decrease in performance compared to the training set. The calibration slope was 0.697, and the intercept was 0.095, suggesting minor deviations from ideal calibration. The Brier score increased to 0.162, reflecting a modest reduction in accuracy. Despite this, the model retained strong discriminatory power and reasonable calibration in the independent validation cohort.
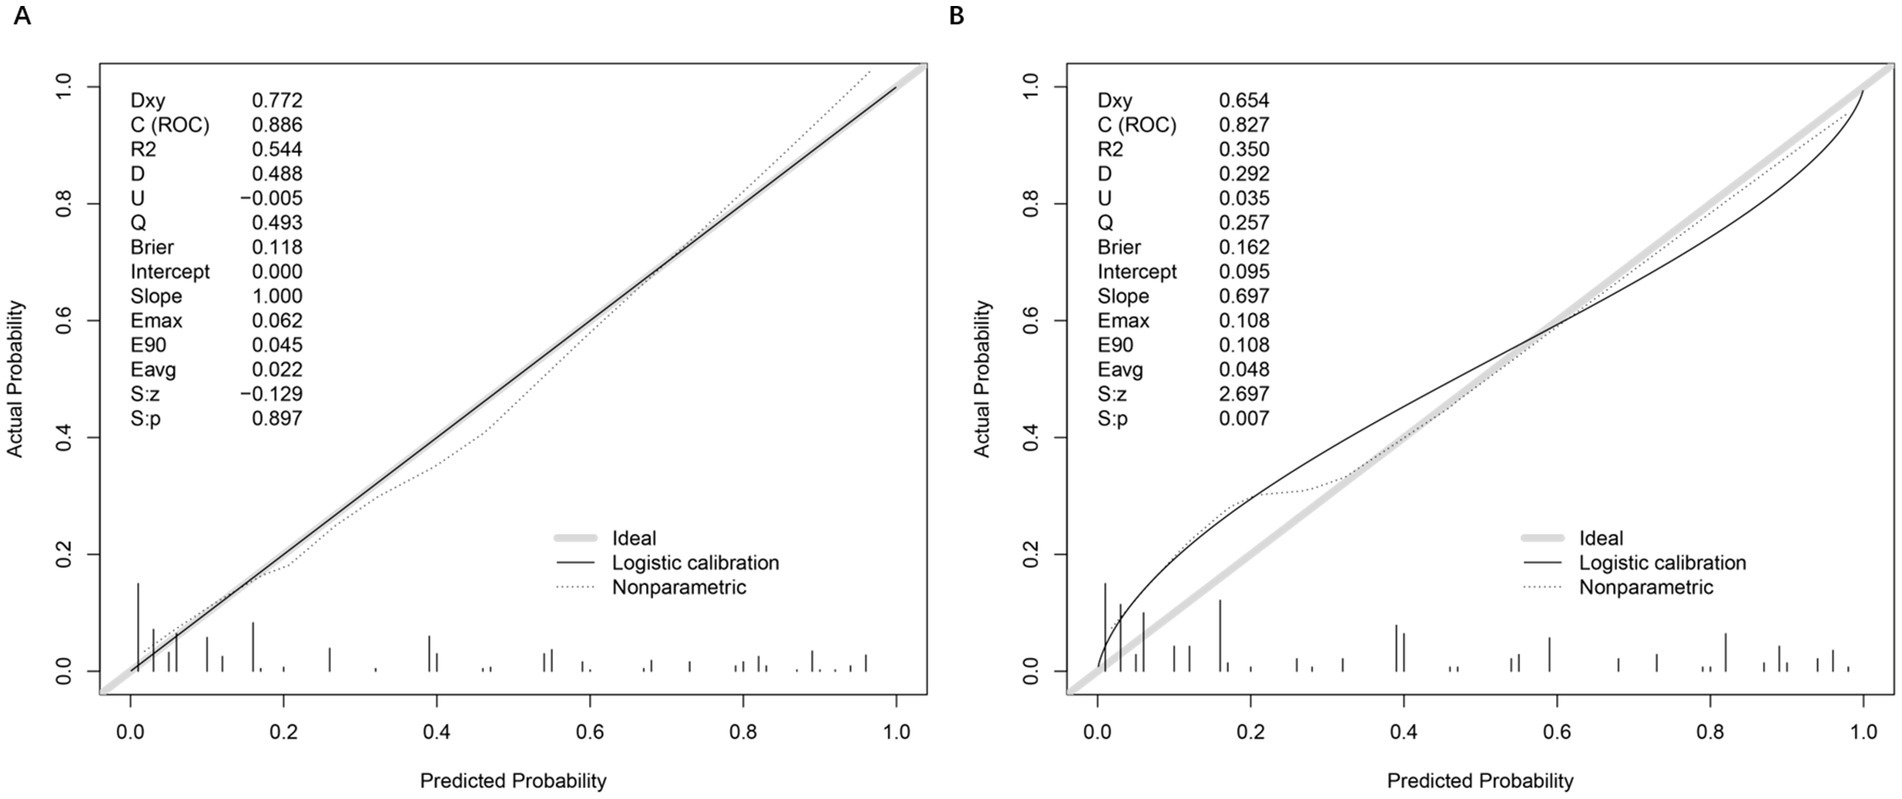
Figure 3. Calibration plots and performance metrics for model validation. (A) Calibration plot of the training set, comparing actual versus predicted probabilities. Key metrics include Somers’ Dxy (0.772), C-index (ROC = 0.886), R2 (0.544), and Brier score (0.118). The logistic calibration curve (solid line) and nonparametric ideal line (dashed) demonstrate model fit. Slope (1.000) and intercept (0.000) indicate minimal calibration drift. Additional metrics (Emax = 0.062, E90 = 0.045, Eavg = 0.022) reflect small calibration errors. (B) Moderate agreement between predicted and observed OVCF re.fra probabilities, with a calibration slope of 0.697 (ideal = 1.000), Brier score of 0.162, and integrated calibration index (Eavg = 0.048), reflecting an average 4.8% deviation between predictions and outcomes. While the model retained clinical utility (Brier <0.2), significant slope deviation (0.697 vs. 1.0) and intercept shift (0.095) indicated overfitting and systematic overestimation in high-risk subgroups (predicted probabilities >0.3), as evidenced by nonparametric calibration divergence and elevated errors (Emax = E90 = 0.108, Eavg = 0.048). The Spiegelhalter test (S: p = 0.007) and reduced discrimination metrics (Dxy = 0.654, C-index = 0.827, R2 = 0.350) further underscored the need for recalibration to improve accuracy in high-risk populations. These deviations primarily occur in two regions: (1) For predicted probabilities <0.3, the model shows slight overestimation of risk (observed events were ~10% lower than predicted), likely due to fewer low-risk cases in our cohort; (2) At higher predicted probabilities (0.7–0.9), we observe modest underestimation, where actual event rates exceeded predictions by ~8%.
These patterns may reflect the testing set’s higher prevalence of diabetes (49.4% vs. 39.3%) and mental disorders (29.8% vs. 21.2%), which could amplify risk in high-risk subgroups. Importantly, despite these calibration deviations, the model maintains strong discriminative ability (AUC = 0.827) and clinical utility across all thresholds (DCA in Figure 4), suggesting limited practical impact on risk stratification.
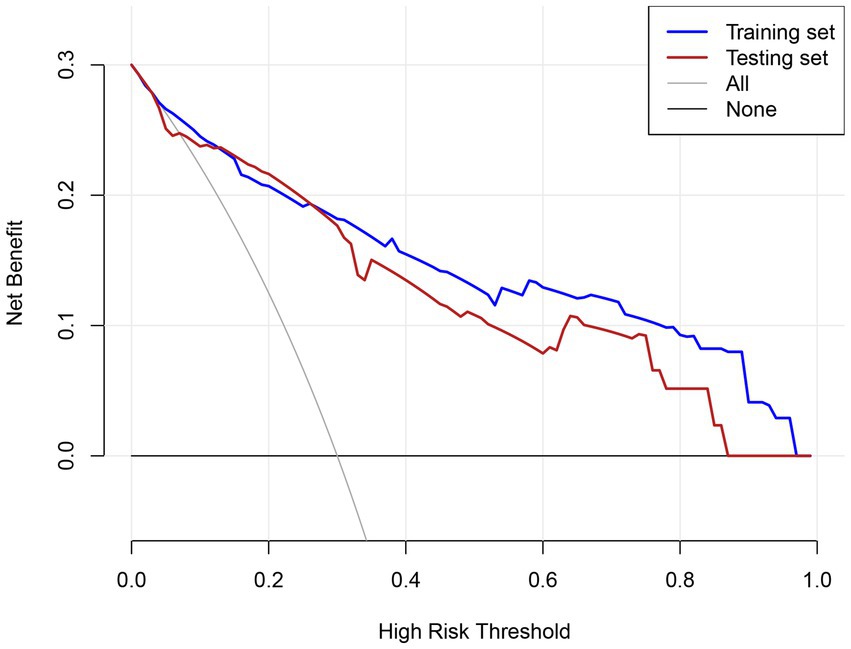
Figure 4. DCA evaluating the clinical utility of the predictive model across different risk thresholds.
Clinical utility of the prediction model
The clinical utility of the prediction model was evaluated using DCA across the training and testing sets (Figure 4). In the training set, the model demonstrated a consistently higher net benefit compared to the “treat all” and “treat none” strategies across most threshold probabilities, particularly in the range of 0.1 to 0.8. Similarly, in the testing set, the model maintained a higher net benefit over a wide range of thresholds, although the net benefit was slightly lower compared to the training set. The DCA highlights that the prediction model provides significant clinical value across a broad spectrum of risk thresholds, enabling clinicians to tailor interventions based on individualized risk assessments.
The model demonstrated strong discriminative ability in both cohorts, with an area under the curve (AUC) of 0.886 (95% CI: 0.850–0.922) in the training cohort and 0.827 (95% CI: 0.762–0.893) in the validation cohort. Further evaluation through decision curve analysis, plotting net benefit for the training set (solid line), testing set (dashed line), and reference strategies (“All” and “None”), revealed superior clinical utility across the 0.1–1.0 risk threshold range. This confirms its potential for guiding clinical decisions within clinically relevant probability thresholds.
Discussion
This study developed and validated a nomogram to predict postoperative re.fra risk in patients with OVCF undergoing surgical intervention. By analyzing a cohort of 560 patients, we identified several independent risk factors, including alcohol use ≥10 years, mental disorders, scoliosis, CKD, and tumor history. The model demonstrated strong discriminative performance (AUC: 0.886 in training, 0.827 in testing), good calibration, and significant clinical utility across a wide range of risk thresholds. These findings underscore the model’s potential to guide personalized postoperative management and preventive strategies in high-risk populations.
The rationality and robustness of Nomotus construction
Our nomogram was developed using established clinical prediction model methods, incorporating multivariable logistic regression to combine independent predictors into a user-friendly visual tool. This approach is supported by prior studies demonstrating the utility of nomograms in refracture risk prediction (13, 14). Our model incorporates six clinically significant predictors, including both modifiable (e.g., alcohol use) and non-modifiable (e.g., scoliosis) factors, aligning with previous research highlighting their roles in bone health and fracture risk (15). The inclusion of novel factors such as mental disorders and tumor history, alongside traditional variables like CKD and scoliosis, enhances the model’s specificity and predictive granularity, addressing a critical gap in existing tools that often overlook these factors. The nomogram’s robust performance is evidenced by high AUC values (0.886 in the training set and 0.827 in the testing set), acceptable calibration (Brier scores: 0.118–0.162), and minimal overfitting (ΔAUC = 0.059), which are comparable to or exceed those of widely used models like fracture risk assessment tool (16) and QFracture (17). These metrics underscore the model’s generalizability and clinical applicability, consistent with guidelines for transparent and reproducible predictive modeling (18). By translating complex statistical outputs into actionable risk probabilities, this nomogram provides a practical tool for tailored interventions in patients post-PVP.
Interpretation of key risk factors
This study identified a history of neoplasms as a critical risk factor for OVCF re.fra, demonstrating an exceptionally high aOR of 12.29 (95% CI: 2.50–60.35, p = 0.002). Probably involves the following mechanisms: (1) direct tumor-mediated bone destruction through receptor activator of NF-κB ligand/osteoprotegerin axis dysregulation, increasing osteoclast activity and (2) treatment-induced skeletal damage, where Chemotherapy can be affected on physiological function of movement system and the skeleton construction. Mineral status disorders and skeletal changes lead to secondary forms of osteopenia and osteoporosis which would increase the risk of fracture (19, 20). However, the limited subgroup sizes (n = 18 with tumors). Future studies should prioritize multicenter cohorts to expand tumor subgroup analyses, integrate longitudinal receptor activator of nuclear factor-kappa B ligand/osteoprotegerin monitoring with imaging, elucidate chemotherapy-induced osteotoxicity mechanisms, and test multimodal interventions (antiresorptives, tailored exercise, nutritional support) for fracture prevention in cancer survivors. Clinical protocols for post-PVP management must prioritize cancer survivors, implementing enhanced monitoring (biannual DXA with trabecular bone score) and early antiresorptive therapy [zoledronic acid reduced fracture risk by 10% in this subgroup (21)]. These findings underscore the need for oncology-orthopedics collaborative care models to address this high-risk population.
This study identified scoliosis as the most significant risk factor for OVCF re.fra except tumor history (aOR = 6.46, 95% CI: 2.97–14.03, p < 0.001), exerting the profound impact through altered spinal biomechanics and uneven load distribution. The previous biomechanical studies emphasizing scoliosis as a critical important of vertebral stress redistribution (22). Scoliosis alters load distribution across adjacent vertebrae, increasing fracture susceptibility—a mechanism corroborated by Fang et al. (23), who reported scoliosis is an independent risk factor for re.fra after OVCF laminoplasty and a possible risk factor for re.fra after surgery. In osteoporotic patients, this mechanical instability is further exacerbated by reduced BMD, creating a synergistic risk environment (24, 25). The inclusion of scoliosis in our nomogram provides a critical tool for identifying high-risk individuals, particularly those with severe degenerative scoliosis, who may benefit from targeted interventions. These interventions include bracing to redistribute spinal loads, physical therapy, and early osteoporosis prevention measures. Additionally, addressing malnutrition, which is common in the older adult and impairs bone healing, through adequate intake of protein, calcium, and vitamin D is crucial for bone health and fracture prevention (26).
Mental disorders merged as significant independent risk factors for OVCF re.fra, demonstrating a nearly six-fold increased risk (aOR = 5.91, 95% CI: 2.73–12.82, p < 0.001). This finding aligns with comprehensive meta-analyses indicating 51% higher fracture rates among psychiatric patients compared to the general population (27). Probably involves the following mechanisms: (1) pharmacological effects of psychotropic medications, particularly selective serotonin reuptake inhibitors, with longitudinal studies demonstrating 4–6% BMD reduction through anticholinergic-mediated osteoclast activation (28). (2) Behavioral consequences of mental illness, including poor adherence to anti-osteoporosis therapies and sedentary lifestyles, directly impair bone remodeling capacity (29). (3) Malnutrition and depression-induced endocrine alterations (depression is associated with decreased levels of gonadal hormones estrogen and testosterone, which are key regulators of bone formation) create a catabolic metabolic environment (28, 29). The high prevalence of mental disorders in our cohort (23.8%) underscores the critical need for integrated care models that simultaneously address psychiatric and bone health. Such models should incorporate routine bone density monitoring, fall prevention strategies, and medication reviews for patients receiving long-term psychotropic treatment. These findings emphasize the importance of multidisciplinary approaches in OVCF management to mitigate the substantial re.fra risk associated with mental health comorbidities.
This study identified prolonged alcohol consumption as a significant modifiable risk factor for OVCF re.fra, with an aOR of 3.69 (95% CI: 1.90–7.17, p < 0.001). Probably involves the following mechanisms: chronic alcohol consumption exerts direct toxic effects on osteoblasts, suppressing bone formation as evidenced by reduced serum osteocalcin levels and histomorphometric findings of decreased trabecular bone volume and osteoid synthesis (30). Concurrently, alcohol disrupts calcium-regulating hormones: acute intoxication induces transient hypoparathyroidism, leading to hypocalcemia and hypercalciuria, while chronic abuse is associated with impaired vitamin D metabolism, including reduced serum levels of 25-hydroxyvitamin D and 1,25-dihydroxyvitamin D. This results in diminished intestinal calcium absorption and compensatory secondary hyperparathyroidism, which fails to adequately stimulate bone remodeling due to alcohol-induced skeletal resistance to parathyroid hormone. Additionally, malnutrition (e.g., low dietary calcium and protein intake), magnesium deficiency, and liver dysfunction exacerbate these effects by further impairing vitamin D activation, calcium homeostasis, and osteoblast function (31). Collectively, these pathways culminate in a low bone turnover state characterized by reduced bone formation and accelerated skeletal fragility. The elevated aOR in our surgical cohort compared to population-based studies (OR = 1.5–2.0) likely reflects synergistic interactions with perioperative risk factors. These findings emphasize the critical need for structured alcohol cessation programs in post-PVP care, particularly for patients with >10-year consumption history. It is worth mentioning that data on variables such as alcohol consumption were retrospectively collected from medical records, which may lack precise quantitative details. Therefore, future prospective studies will benefit from standardized tools that more accurately quantify alcohol intake.
Previous research has established complex associations between hypertension and bone metabolism, with multiple studies demonstrating a positive correlation between hypertension and lumbar spine BMD, however the results are conflicting (32). Epidemiological evidence suggests hypertensive patients face increased osteoporosis risk, potentially due to a similar pathogenetic etiology between hypertension and osteoporosis (33). However, our study revealed a paradoxical protective association between hypertension and OVCF re.fra risk (aOR = 0.50, 95% CI: 0.27–0.93, p = 0.028), potentially mediated through antihypertensive pharmacotherapy. This apparent contradiction may be explained by specific therapeutic interventions: thiazide diuretics demonstrate bone-protective effects through enhanced calcium homeostasis, showing 6.03% higher lumbar spine BMD in users compared to non-users (34), while calcium channel blockers may directly stimulate osteoblast activity (35). Furthermore, a bone metabolic mechanisms study demonstrat that thiazide diuretics’ direct osteoanabolic effects through NCC expression in osteoblasts, enhancing differentiation via increased Runx2/osteopontin expression and mineralized nodule formation (36). Nevertheless, this protective association should be interpreted with caution, as it may also stem from unmeasured confounders such as nutritional factors or vitamin D status, which were not fully adjusted for in our analysis. The potential mediating role of specific antihypertensive agents—particularly the purported skeletal benefits of thiazide diuretics—remains a compelling yet unverified hypothesis. Future studies should incorporate prospectively collected medication data to evaluate class-specific effects and include longitudinal biomarkers to disentangle direct and pharmacologically mediated effects. Until then, despite this observed association, clinical practice should maintain standard osteoporosis management for all OVCF patients, regardless of hypertension status.
Limitations
This study has several limitations: (1) As a single-center, retrospective study with only internal validation, the generalizability of the nomogram may be limited by regional variations in patient demographics, clinical practices, and healthcare systems; (2) the small sample size in certain subgroups—particularly tumor history (n = 18)—may lead to statistical instability and overestimation of effects, and unmeasured confounders such as nutritional status, medication adherence, and vitamin D levels might further influence refracture risk; these findings thus require cautious interpretation; (3) The model was developed and validated in a specific Chinese population, and its performance may be influenced by genetic, lifestyle, dietary, or medical system differences in other regions. Thus, external validation in diverse international cohorts is essential before broader application.
Conclusion
This study developed and validated a clinically practical nomogram for predicting re.fra risk in older adult OVCF patients undergoing PVP, integrating both traditional and novel risk factors such as umor history, scoliosis, mental disorders, prolonged alcohol use and CKD. The model demonstrated robust discriminative performance, excellent calibration, and significant clinical utility across diverse risk thresholds. These findings highlight the critical interplay between comorbidities, lifestyle factors, and bone health, providing a tailored tool for risk stratification and personalized postoperative management. Future multicenter studies should further validate these predictors and explore targeted interventions to mitigate re.fra in high-risk populations.
Data availability statement
The original contributions presented in the study are included in the article/supplementary material, further inquiries can be directed to the corresponding authors.
Ethics statement
The studies involving humans were approved by the institutional review committee of Jining Medical College. The studies were conducted in accordance with the local legislation and institutional requirements. The participants provided their written informed consent to participate in this study.
Author contributions
BQ: Data curation, Formal analysis, Funding acquisition, Writing – original draft. QW: Methodology, Writing – original draft. GC: Data curation, Writing – original draft. LZ: Software, Writing – original draft. CM: Funding acquisition, Writing – review & editing. WW: Methodology, Software, Writing – original draft. HW: Formal analysis, Visualization, Writing – review & editing. QL: Funding acquisition, Writing – review & editing.
Funding
The author(s) declare that financial support was received for the research and/or publication of this article. This study was supported by the Medical and Health Technology Project of Shandong Province (202404070100), Jining City Bureau of Science and Technology Foundation of Jining City China (2023YXNS039 and 2024YXNS064), and the Project of Doctoral Research for Affiliated of Jining Medical University (2022-BS-009).
Conflict of interest
The authors declare that the research was conducted in the absence of any commercial or financial relationships that could be construed as a potential conflict of interest.
Generative AI statement
The authors declare that no Gen AI was used in the creation of this manuscript.
Any alternative text (alt text) provided alongside figures in this article has been generated by Frontiers with the support of artificial intelligence and reasonable efforts have been made to ensure accuracy, including review by the authors wherever possible. If you identify any issues, please contact us.
Publisher’s note
All claims expressed in this article are solely those of the authors and do not necessarily represent those of their affiliated organizations, or those of the publisher, the editors and the reviewers. Any product that may be evaluated in this article, or claim that may be made by its manufacturer, is not guaranteed or endorsed by the publisher.
References
1. Muijs, SP, van Erkel, AR, and Dijkstra, PD. Treatment of painful osteoporotic vertebral compression fractures: a brief review of the evidence for percutaneous vertebroplasty. J Bone Joint Surg Br. (2011) 93:1149–53. doi: 10.1302/0301-620X.93B9.26152
2. Alexandru, D, and So, W. Evaluation and management of vertebral compression fractures. Perm J. (2012) 16:46–51. doi: 10.7812/TPP/12-037
3. Buchbinder, R, Johnston, RV, Rischin, KJ, Homik, J, Jones, CA, Golmohammadi, K, et al. Percutaneous vertebroplasty for osteoporotic vertebral compression fracture. Cochrane Database Syst Rev. (2018) 4:CD006349. doi: 10.1002/14651858.CD006349
4. Jing, C, Wang, H, Liu, P, Yang, S, Zhang, L, Yang, P, et al. Effect of sarcopenia on refractures of adjacent vertebra after percutaneous kyphoplasty. BMC Musculoskelet Disord. (2024) 25:210. doi: 10.1186/s12891-024-07295-3
5. Qian, L, Chen, Q, Wang, D, Pan, Q, Jian, Q, and Ma, Y. Study on the relationship between the use of bisphosphonates for antiosteoporosis and vertebral re-fracture after vertebroplasty. Evid Based Complement Alternat Med. (2022) 2022:3223437. doi: 10.1155/2022/3223437
6. Khairallah, P, and Nickolas, TL. Updates in CKD-associated osteoporosis. Curr Osteoporos Rep. (2018) 16:712–23. doi: 10.1007/s11914-018-0491-3
7. Poiana, C, and Capatina, C. Fracture risk assessment in patients with diabetes mellitus. J Clin Densitom. (2017) 20:432–43. doi: 10.1016/j.jocd.2017.06.011
8. Maurel, DB, Boisseau, N, Benhamou, CL, and Jaffre, C. Alcohol and bone: review of dose effects and mechanisms. Osteoporos Int. (2012) 23:1–16. doi: 10.1007/s00198-011-1787-7
9. Bailey, BE, Andridge, R, and Shoben, AB. Multiple imputation by predictive mean matching in cluster-randomized trials. BMC Med Res Methodol. (2020) 20:72. doi: 10.1186/s12874-020-00948-6
10. Shimamoto, K. Diagnostic criteria and diagnostic considerations for hypertension in the elderly. Nihon Rinsho. (2005) 63:1000–4.
11. Fitzgerald, M, Saville, BR, and Lewis, RJ. Decision curve analysis. JAMA. (2015) 313:409–10. doi: 10.1001/jama.2015.37
12. Kerr, KF, Brown, MD, Zhu, K, and Janes, H. Assessing the clinical impact of risk prediction models with decision curves: guidance for correct interpretation and appropriate use. J Clin Oncol. (2016) 34:2534–40. doi: 10.1200/JCO.2015.65.5654
13. Ju, G, and Liu, X. A nomogram prediction model for refracture in elderly patients with osteoporotic vertebral compression fractures after percutaneous vertebroplasty. Eur Spine J. (2023) 32:3919–26. doi: 10.1007/s00586-023-07843-w
14. Qian, Y, Hu, X, Li, C, Zhao, J, Zhu, Y, Yu, Y, et al. Development of a nomogram model for prediction of new adjacent vertebral compression fractures after vertebroplasty. BMC Surg. (2023) 23:197. doi: 10.1186/s12893-023-02068-6
15. Qi, B, Kong, X, Meng, C, and Li, Q. Analysis of the impact of underlying diseases in the elderly on postoperative re-fractures after osteoporotic compression fractures. J Orthop Surg Res. (2024) 19:556. doi: 10.1186/s13018-024-04907-5
16. Kanis, JA, Johansson, H, Harvey, NC, and McCloskey, EV. A brief history of FRAX. Arch Osteoporos. (2018) 13:118. doi: 10.1007/s11657-018-0510-0
17. Hippisley-Cox, J, and Coupland, C. Predicting risk of osteoporotic fracture in men and women in England and Wales: prospective derivation and validation of QFractureScores. BMJ. (2009) 339:b4229. doi: 10.1136/bmj.b4229
18. Moons, KG, Altman, DG, Reitsma, JB, Ioannidis, JP, Macaskill, P, Steyerberg, EW, et al. Transparent reporting of a multivariable prediction model for individual prognosis or diagnosis (TRIPOD): explanation and elaboration. Ann Intern Med. (2015) 162:W1–W73. doi: 10.7326/M14-0698
19. Terpos, E, Christoulas, D, Gavriatopoulou, M, and Dimopoulos, MA. Mechanisms of bone destruction in multiple myeloma. Eur J Cancer Care. (2017) 26:e12761. doi: 10.1111/ecc.12761
20. Lipton, A, and Jun, S. RANKL inhibition in the treatment of bone metastases. Curr Opin Support Palliat Care. (2008) 2:197–203. doi: 10.1097/SPC.0b013e32830baac2
21. Tang, B, Zeng, H, Hu, S, Liu, K, Wu, L, and Shi, X. Percutaneous vertebroplasty combined with zoledronic acid in treatment and prevention of osteoporotic vertebral compression fractures: a systematic review and meta-analysis of comparative studies. World Neurosurg. (2022) 157:75–87. doi: 10.1016/j.wneu.2021.09.131
22. Mao, W, Dong, F, Huang, G, He, P, Chen, H, Qin, S, et al. Risk factors for secondary fractures to percutaneous vertebroplasty for osteoporotic vertebral compression fractures: a systematic review. J Orthop Surg Res. (2021) 16:644. doi: 10.1186/s13018-021-02722-w
23. Fang, SY, Dai, JL, Min, JK, and Zhang, WL. Analysis of risk factors related to the re-fracture of adjacent vertebral body after PKP. Eur J Med Res. (2021) 26:127. doi: 10.1186/s40001-021-00592-w
24. Nishida, M, Yagi, M, Suzuki, S, Takahashi, Y, Nori, S, Tsuji, O, et al. Persistent low bone mineral density in adolescent idiopathic scoliosis: a longitudinal study. J Orthop Sci. (2023) 28:1099–104. doi: 10.1016/j.jos.2022.07.005
25. Xu, L, Sun, X, Huang, S, Zhu, Z, Qiao, J, Zhu, F, et al. Degenerative lumbar scoliosis in Chinese Han population: prevalence and relationship to age, gender, bone mineral density, and body mass index. Eur Spine J. (2013) 22:1326–31. doi: 10.1007/s00586-013-2678-8
26. Fang, XY, Xu, HW, Chen, H, Zhang, SB, Yi, YY, Ge, XY, et al. Association between poor nutritional status and increased risk for subsequent vertebral fracture in elderly people with percutaneous vertebroplasty. Clin Interv Aging. (2022) 17:1503–12. doi: 10.2147/CIA.S376916
27. Bolton, JM, Morin, SN, Majumdar, SR, Sareen, J, Lix, LM, Johansson, H, et al. Association of mental disorders and related medication use with risk for major osteoporotic fractures. JAMA Psychiatry. (2017) 74:641–8. doi: 10.1001/jamapsychiatry.2017.0449
28. Rizzoli, R, Cooper, C, Reginster, JY, Abrahamsen, B, Adachi, JD, Brandi, ML, et al. Antidepressant medications and osteoporosis. Bone. (2012) 51:606–13. doi: 10.1016/j.bone.2012.05.018
29. Mezuk, B, Eaton, WW, and Golden, SH. Depression and osteoporosis: epidemiology and potential mediating pathways. Osteoporos Int. (2008) 19:1–12. doi: 10.1007/s00198-007-0449-2
30. Lalor, BC, France, MW, Powell, D, Adams, PH, and Counihan, TB. Bone and mineral metabolism and chronic alcohol abuse. Q J Med. (1986) 59:497–511.
31. Ronis, MJ, Wands, JR, Badger, TM, de la Monte, SM, Lang, CH, and Calissendorff, J. Alcohol-induced disruption of endocrine signaling. Alcohol Clin Exp Res. (2007) 31:1269–85. doi: 10.1111/j.1530-0277.2007.00436.x
32. Li, S, Li, L, Feng, A, Huang, T, Chen, C, He, N, et al. The role of hypertension in bone mineral density among males older than 50 years and postmenopausal females: evidence from the US National Health and Nutrition Examination Survey, 2005–2010. Front Public Health. (2023) 11:1142155. doi: 10.3389/fpubh.2023.1142155
34. Giles, TD, Sander, GE, Roffidal, LE, Quiroz, AC, and Mazzu, AL. Comparative effects of nitrendipine and hydrochlorothiazide on calciotropic hormones and bone density in hypertensive patients. Am J Hypertens. (1992) 5:875–9. doi: 10.1093/ajh/5.12.875
35. Wen, L, Wang, Y, Wang, H, Kong, L, Zhang, L, Chen, X, et al. L-type calcium channels play a crucial role in the proliferation and osteogenic differentiation of bone marrow mesenchymal stem cells. Biochem Biophys Res Commun. (2012) 424:439–45. doi: 10.1016/j.bbrc.2012.06.128
36. Dvorak, MM, De Joussineau, C, Carter, DH, Pisitkun, T, Knepper, MA, Gamba, G, et al. Thiazide diuretics directly induce osteoblast differentiation and mineralized nodule formation by interacting with a sodium chloride co-transporter in bone. J Am Soc Nephrol. (2007) 18:2509–16. doi: 10.1681/ASN.2007030348
Keywords: OVCF, refracture, risk factor, nomogram, PVP
Citation: Qi B, Wu Q, Chen G, Zhang L, Meng C, Wei W, Wang H and Li Q (2025) Predicting re-fracture risk factors in older adult osteoporotic vertebral fractures patients with comorbidities: development and validation of nomogram. Front. Med. 12:1664157. doi: 10.3389/fmed.2025.1664157
Edited by:
Marios Kyriazis, National Gerontology Centre, CyprusReviewed by:
Shangmin Chen, Shantou University, ChinaHusna Ahmad Ainuddin, Universiti Teknologi MARA Puncak Alam, Malaysia
Loc Vu, Tân Tạo University, Vietnam
Copyright © 2025 Qi, Wu, Chen, Zhang, Meng, Wei, Wang and Li. This is an open-access article distributed under the terms of the Creative Commons Attribution License (CC BY). The use, distribution or reproduction in other forums is permitted, provided the original author(s) and the copyright owner(s) are credited and that the original publication in this journal is cited, in accordance with accepted academic practice. No use, distribution or reproduction is permitted which does not comply with these terms.
*Correspondence: Chunyang Meng, bWVuZ2NodW55YW5nMTYwMEBtYWlsLmpubWMuZWR1LmNu; Hong Wang, V2FuZ2hvbmdzcGluZUAxMjYuY29t; Qingwei Li, cGxhc3VyZzA2MThAbWFpbC5qbm1jLmVkdS5jbg==