Abstract
Background:
Most previous studies on myopia in children and adolescents have primarily focused on genetic and environmental factors. This study aimed to explore modifiable behavioral, sociodemographic, and psychological contributors to myopia and to evaluate the potential of machine learning (ML) models in identifying at-risk individuals.
Methods:
A cross-sectional survey was conducted in eight primary and secondary schools in a Chinese province between October and December 2023. The dataset was split into training and testing sets (7:3). LASSO regression identified potential predictors, followed by multivariate logistic regression to determine independent risk factors. Ten machine learning algorithms were used to build prediction models: logistic regression, support vector machine (SVM), gradient boosting machine (GBM), neural network (NNET), extreme gradient boosting (XGBoost), k-nearest neighbors (KNN), random forest adaptive boosting (AdaBoost), LightGBM, and CatBoost. Model performance was evaluated using accuracy, F1 score, specificity, sensitivity, and area under the receiver operating characteristic (ROC) curve (AUC). SHapley Additive exPlanations (SHAP) were used to interpret variable contributions in the best-performing model.
Results:
The study included 2,086 children and adolescents (mean age 9.8 ± 2.7 years; 50.5% female), with an overall myopia prevalence of 25.12%. Independent risk factors for myopia included parental myopia, only-child status, physical activity level, mother’s education level, age, and physical activity behavior. Among all models, the LightGBM algorithm achieved the best predictive performance (AUC = 0.738, 95% CI: 0.709–0.767). SHAP analysis identified parental myopia, physical activity level, only-child status, and physical activity behavior as the most influential predictors.
Conclusion:
Although ML models showed limited predictive accuracy, they helped identify modifiable risk factors associated with childhood and adolescent myopia. These findings may inform the design of targeted prevention strategies and early behavioral interventions rather than serve as clinical diagnostic tools.
Introduction
Myopia is an increasingly severe public health issue worldwide and is particularly prominent among children and adolescents (1, 2). In recent years, with changes in the social environment and lifestyle, the incidence of myopia has significantly increased, especially in Asian countries, where the prevalence of myopia among children and adolescents has reached alarming levels (3). Myopia not only affects the quality of life of children but also may lead to a range of eye health issues, such as fundus lesions and retinal detachment, and even increases the risk of blindness in adulthood (4).
Importantly, extensive research has confirmed that prolonged lack of outdoor activities and physical exercise not only impacts physical health but also creates conditions conducive to the development of myopia. The dopamine hypothesis explains that outdoor light stimulates retinal dopamine release, inhibiting axial elongation (5, 6). Studies like Rai et al. have demonstrated clear urban–rural and gender gradients in myopia prevalence, confirming light exposure rather than demographics as the key protective factor (7). Together with near work and peripheral defocus theories (8, 9), these mechanisms highlight the multifactorial nature of myopia development. The overindulgence and high academic expectations often present in only-child families may increase children’s eye strain and psychological stress, further promoting the onset of myopia (10). Thus, beyond genetic predisposition, environmental and behavioral factors—including family dynamics—play crucial roles in myopia development.
Beyond these traditional factors (11), an increasing number of studies have focused on the relationship between myopia and mental health. Psychological stress (12, 13), anxiety/depression (14, 15), and other factors are considered important psychological factors affecting eye health. Excessive academic and environmental pressure may exacerbate the progression of myopia. Moreover, the occurrence of myopia is often accompanied by abnormal body posture (16), changes in personality traits (17), and emotional changes (18), further illustrating the significant impact of mental health on myopia. Therefore, in addition to traditional environmental and behavioral factors, understanding the role of psychological factors will help researchers comprehensively grasp the mechanisms of myopia development and facilitate more effective intervention strategies.
In recent years, machine learning has been widely applied in myopia research, particularly in the prediction of axial length, myopia risk assessment, and the identification of factors influencing myopia (19, 20). Machine learning can handle complex, multidimensional datasets and reveal nonlinear relationships that traditional statistical methods struggle to capture, providing new perspectives for accurate prediction and early screening of myopia (20, 21). Therefore, this study aims to apply machine learning approaches to identify key modifiable risk factors associated with myopia among children and adolescents, focusing on a wide range of predictors including demographic characteristics, genetic background, physical activity, psychological stress, screen-related behavior, dietary patterns, sleep routines, and academic pressure. Rather than solely optimizing prediction accuracy, we seek to quantify the relative contribution of these variables to myopia risk, particularly those behavioral and psychological factors that can be improved through interventions, thereby providing evidence-based guidance for public health prevention strategies.
Methods
Subject of investigation
This study was conducted from October to December 2023 in eight primary and secondary schools located in a prefecture-level city in a certain province of China, and involved vision screening and accompanying questionnaire surveys. In accordance with the inclusion criteria (including cooperation with the survey, no eye diseases during the survey period, and no history of keratoconus treatment), data were collected from 2,112 participants. The study included 17 features, such as student demographics, parental information, physical activity level, lifestyle behaviors, generalized anxiety, and academic pressure. Prior to the study, the purpose and procedures of the research were thoroughly explained to the parents or legal guardians, and a written informed consent form, approved by the Ethics Committee of East China Normal University and adhering to the Declaration of Helsinki, was signed before the research commenced (HR476–2020).
Examination items
Questionnaire survey
The questionnaire included personal information about the students (such as gender, age, grade, place of residence, and myopia status), family information (such as number of children, myopia status, education level, parental occupation, and household income), lifestyle factors (dietary habits, sleep behaviors, exercise behaviors), the International Physical Activity Questionnaire (IPAQ, short version), the Generalized Anxiety Scale, and the Sources of Academic Stress for Middle School Students Questionnaire.
The international physical activity questionnaire (IPAQ, short version)
The IPAQ was used to assess physical activity levels. According to the Guidelines for Data Processing and Analysis of the International Physical Activity Questionnaire by the World Health Organization and the calculation principles proposed by Fan Mengyu (22), physical activity levels are categorized into three groups—low, moderate, and high—on the basis of the frequency and duration of various types of physical activity within a week. MET-minutes were calculated using the formula: MET intensity × duration (minutes) × frequency (days/week). High level: Participants engage in vigorous-intensity physical activity at least 3 days per week and accumulate a total of at least 1,500 MET-minutes per week, or they engage in transportation, moderate, and/or vigorous-intensity physical activities for 7 or more days, accumulating at least 3,000 MET-minutes per week. Moderate level: Participants engage in vigorous-intensity physical activity for at least 3 days, with at least 20 min of activity per day, or moderate-intensity physical activity for at least 5 days, with at least 30 min of activity per day, or they engage in transportation, moderate-, and/or vigorous-intensity physical activity for 5 or more days, accumulating at least 600 MET-minutes per week. Low level: Participants reported no physical activity, or the level of physical activity did not meet the criteria for moderate and high levels.
Generalized anxiety disorder 7 (GAD-7)
The GAD-7 is a brief self-assessment scale (23) consisting of 7 items. Each item is rated on a 4-point scale: 3 = nearly every day; 2 = more than half the days; 1 = several days; 0 = not at all. The total score is the sum of the scores for all 7 items, with a range of 0–21 points. The following cutoff points were used to categorize anxiety levels: 0–4 (minimal/no anxiety), 5–9 (mild anxiety), 10–14 (moderate anxiety), and 15–21 (severe anxiety).
Sources of academic stress for middle school students (SSS)
This scale was developed by Chen Xu (24) in 2004 and uses a five-point Likert scale, with ratings ranging from 1 to 5 corresponding to “no stress,” “slightly stressful,” “moderately stressful,” “highly stressful,” and “extremely stressful,” respectively. A higher score indicates greater stress.
Lifestyle questionnaire
Lifestyle behavior information was collected via a frequency survey designed by the research team. This questionnaire contains simple questions to gather data on the lifestyle behaviors of children and adolescents. It covers four behavior areas: eye-related behavior, sleep behavior, dietary habits, and physical activity behavior. Examples include “In the past month, how much time did you spend watching TV after school on school days?” with 5 options: “None, Half an hour, One hour, Less than two hours, More than two hours”; “In the past month, how many hours of sleep (including naps) did you get daily?” with 2 options: “8 h or more, Less than 8 h”; “In the past month, how often did you pay attention to balanced nutrition in your diet?” with 4 options: “Never, Occasionally, Frequently, Always”; “In the past month, how did you feel after physical education classes?” with 3 options: “Sweaty and tired, Sweaty but relaxed, Not sweaty and relaxed.”
Myopia
Myopia status was determined through a parental questionnaire in which parents or legal guardians were asked to report whether their child had been diagnosed with myopia by a medical professional. The specific item was: “Has your child been diagnosed with myopia by an eye doctor?”
Data processing
In this study, a questionnaire was used to collect student information. Prior to completing the questionnaire, the researchers provided instructions on how to fill it out, and the class teachers supervised the completion and collection of the questionnaires to ensure their quality. A total of 2,112 participants’ data were collected. During the data preprocessing process, blank samples were removed, and missing values in some samples were filled in. Ultimately, 2,086 samples were retained. The dataset was then divided into a training set (n = 1,461) and a test set (n = 625) at a 7:3 ratio.
Myopia prediction model
Variable selection and model construction were performed using the training set data. First, univariate logistic regression was applied to the training set to identify key factors related to myopia. Various machine learning (ML) algorithms, including the support vector machine (SVM), gradient boosting machine (GBM), neural network (NNET), extreme gradient boost (XGBoost), K-nearest neighbor (KNN), random forest adaptive boosting (AdaBoost), light gradient boosting machine (LightGBM), and categorical boosting (CatBoost) algorithms, were subsequently used to build prediction models.
In the model construction process, each machine learning algorithm was first used to build classification models on the basis of the training set, with automatic parameter optimization used to determine the best hyperparameters for each model. Next, the models were evaluated on the test set, and the best model was selected on the basis of various performance metrics. The area under the curve (AUC) was used as the primary evaluation metric to automatically compare the predictive performance of different models, and receiver operating characteristic (ROC) curves were generated to display each model’s performance on the test dataset. Additionally, other evaluation metrics, were used including accuracy, F1 score, specificity, and sensitivity. These metrics provide a comprehensive reflection of the model’s performance across different aspects and help to assess the effectiveness and stability of the model.
Furthermore, we used R to calculate the Shapley values of each influencing factor in the LightGBM model, measuring the contribution of each feature to the prediction results. By calculating the mean absolute Shapley value for each variable across all the measurements and ranking them, we further assessed the feature importance in the LightGBM model. The greater the feature importance is, the greater its impact on the occurrence of myopia. In the Shapley value visualization, each point represents a sample, and the color intensity reflects the importance of the feature, with yellow indicating high importance and purple indicating low importance.
Results
General situation
A total of 2,086 children and adolescents aged 6 to 16 years (9.8 ± 2.7 years) were included in this study. Among them, 1,032 were male (49.5%), and 1,054 were female (50.5%). There were 1,697 primary school students (81.3%) and 389 middle school students (18.7%). A total of 524 students were diagnosed with myopia, yielding a myopia rate of 25.12%. Among these, 290 boys had myopia (55.4%), and 234 girls had myopia (44.6%), with a statistically significant difference between genders (χ2 = 9.95, p = 0.002). In terms of grade level, 345 primary school students had myopia (20.33%), and 179 middle school students had myopia (46.01%).
The distribution of physical activity levels was as follows: 354 students (17.0%) were classified as high, 311 students (14.9%) were classified as moderate, and 1,421 students (68.1%) were classified as low. Overall, the physical activity levels of the children and adolescents in the study were relatively low. The anxiety score was 2.71 ± 4.32. In terms of anxiety severity, 1,579 students (75.6%) had normal levels of anxiety, 351 students (16.8%) had mild anxiety, 75 students (3.6%) had moderate anxiety, 50 students (2.4%) had moderate-to-severe anxiety, and 31 students (1.5%) had severe anxiety. The academic stress score was 149.40 ± 57.83. In terms of stress severity, 234 students (11.2%) reported no stress, 518 students (24.8%) reported mild stress, 450 students (21.6%) reported moderate stress, 848 students (40.7%) reported moderate-to-severe stress, and 36 students (1.7%) reported extreme stress.
The study results show that anxiety and academic stress levels are relatively high among children and adolescents, which should be a cause for concern for relevant authorities. The detailed characteristics are shown in Table 1, and no statistically significant differences were found between the training and testing sets.
Table 1
| Variables | Training set (N = 1,461) | Testing set (N = 625) | p value |
|---|---|---|---|
| Personal information | |||
| Myopia | 0.999 | ||
| Yes | 367 | 157 | |
| No | 1,094 | 468 | |
| Age | 9 (6–16) | 9 (6–16) | 0.827 |
| Gender | 0.908 | ||
| Male | 724 | 308 | |
| Female | 737 | 317 | |
| Residence | 0.566 | ||
| Countryside | 372 | 172 | |
| Townships | 159 | 73 | |
| County town | 867 | 350 | |
| Municipal | 63 | 30 | |
| Stage | 0.504 | ||
| Primary school | 1,194 | 503 | |
| Middle school | 267 | 122 | |
| Family information | |||
| Number of children | 0.758 | ||
| Only child | 249 | 110 | |
| Multiple children | 1,212 | 515 | |
| Family income (monthly/RMB) | 0.042 | ||
| Under 4,000 | 493 | 238 | |
| 4,000–5,999 | 467 | 203 | |
| 6,000–7,999 | 270 | 83 | |
| 8,000–9,999 | 126 | 51 | |
| 10,000 and above | 105 | 50 | |
| Parental occupation | 0.265 | ||
| Self-employed | 295 | 109 | |
| Intellectuals/cadres | 72 | 34 | |
| Worker | 342 | 131 | |
| Farmers | 493 | 236 | |
| Other | 259 | 115 | |
| Parental myopia | 0.954 | ||
| Yes | 503 | 216 | |
| No | 958 | 409 | |
| Father’s level of education | 0.329 | ||
| Below high school | 1,057 | 436 | |
| University and above | 210 | 91 | |
| Unknown | 194 | 98 | |
| Mother’s level of education | 0.165 | ||
| Below high school | 1,011 | 420 | |
| University and above | 242 | 96 | |
| Unknown | 208 | 109 | |
| Lifestyle behavioral factors | |||
| Physical Activity Level | 0.091 | ||
| High level | 247 | 107 | |
| Medium level | 202 | 109 | |
| Low level | 1,012 | 409 | |
| Eating behavior | 9.20 (2.10) | 9.14 (2.07) | 0.445 |
| Sleep behavior | 7.89 (1.38) | 7.93 (1.35) | 0.423 |
| Exercise behavior | 4.48 (0.76) | 4.44 (0.81) | 0.054 |
| Eye-related Behavior | 24.81 (2.66) | 24.69 (2.83) | 0.521 |
| Psychological factor | |||
| Anxiety level | 2.61 (4.19) | 2.92 (4.62) | 0.016 |
| Level of academic stress | 148.93 (58.34) | 150.49 (56.65) | 0.317 |
Baseline characteristics of the study cohort.
Model performance and comparisons
A total of 17 variables were collected on the basis of the inclusion criteria. Through LASSO regression analysis, six variables associated with myopia were selected: physical activity level, mother’s education level, parental myopia status, gender, only child status, and physical activity behavior. These predictive variables were then included in both univariate and multivariate logistic regression analyses. The results indicated that children with myopic parents had a significantly greater risk of myopia (OR = 3.13, 95% CI: 2.27–4.17). Similarly, only child status was associated with a greater risk of myopia (OR = 1.71, 95% CI: 1.15–2.55), and increasing age was also linked to a greater likelihood of myopia (OR = 1.78, 95% CI: 1.60–1.99). Low physical activity levels and insufficient physical activity were significantly associated with an increased risk of myopia (OR = 0.67, 95% CI: 0.47–0.96; OR = 0.71, 95% CI: 0.60–0.85). Additionally, children with a higher maternal education level had a significantly increased risk of myopia (OR = 1.56, p = 0.039). The details are presented in Table 2.
Table 2
| Variables | Univariable | Multivariable | ||
|---|---|---|---|---|
| OR (95% CI) | p value | OR (95% CI) | p value | |
| Gender | ||||
| Male | ||||
| Female | 0.75 (0.59–0.95) | 0.015 | 0.76 (0.58–1.00) | 0.052 |
| Stage | ||||
| Primary school | ||||
| Middle school | 3.46 (2.62–4.58) | <0.001 | 0.66 (0.40–1.10) | 0.110 |
| Residence | ||||
| Countryside | ||||
| Townships | 1.84 (1.24–2.75) | 0.003 | 1.01 (0.64–1.61) | 0.962 |
| County town | 0.88 (0.66–1.17) | 0.392 | 1.23 (0.81–1.86) | 0.336 |
| Municipal | 1.42 (0.79–2.53) | 0.241 | 1.47 (0.75–2.89) | 0.268 |
| Number of children | ||||
| Only child | ||||
| Multiple children | 1.54 (1.10–2.17) | 0.013 | 1.71 (1.15–2.55) | 0.008 |
| Family income (monthly/RMB) | ||||
| Under 4,000 | ||||
| 4,000–5,999 | 1.14 (0.85–1.51) | 0.386 | ||
| 6,000–7,999 | 0.93 (0.66–1.32) | 0.702 | ||
| 8,000–9,999 | 0.90 (0.57–1.43) | 0.653 | ||
| 10,000 and above | 0.84 (0.51–1.40) | 0.510 | ||
| Parental myopia | ||||
| Yes | ||||
| No | 2.08 (1.64–2.70) | <0.001 | 3.13 (2.27–4.17) | <0.001 |
| Parental occupation | ||||
| Self-employed | ||||
| Intellectuals/cadres | 1.52 (0.85–2.71) | 0.159 | 0.86 (0.42–1.78) | 0.687 |
| Worker | 1.52 (1.06–2.19) | 0.023 | 0.97 (0.63–1.48) | 0.879 |
| Farmers | 1.08 (0.76–1.53) | 0.656 | 0.83 (0.54–1.27) | 0.388 |
| Other | 1.39 (0.94–2.05) | 0.097 | 1.21 (0.77–1.90) | 0.401 |
| Physical activity level | ||||
| High level | ||||
| Medium level | 1.12 (0.75–1.67) | 0.575 | 0.89 (0.57–1.40) | 0.616 |
| Low level | 0.62 (0.46–0.84) | 0.002 | 0.67 (0.47–0.96) | 0.027 |
| Father’s level of education | ||||
| Below high school | ||||
| University and above | 0.89 (0.63–1.26) | 0.504 | ||
| Unknown | 0.79 (0.54–1.14) | 0.199 | ||
| Mother’s level of education | ||||
| Below high school | ||||
| University and above | 1.40 (1.03–1.91) | 0.033 | 1.56 (1.02–2.38) | 0.039 |
| Unknown | 1.03 (0.73–1.46) | 0.858 | 0.87 (0.57–1.32) | 0.500 |
| Age | 1.51 (1.42–1.62) | <0.001 | 1.78 (1.60–1.99) | <0.001 |
| Anxiety level | 1.01 (0.99–1.04) | 0.333 | ||
| Sleep behavior | 0.95 (0.88–1.04) | 0.284 | ||
| Eating behavior | 0.97 (0.92–1.02) | 0.253 | ||
| Exercise behavior | 0.70 (0.60–0.81) | <0.001 | 0.71 (0.60–0.85) | p < 0.001 |
| Eye-related Behavior | 0.97 (0.93–1.01) | 0.105 | ||
| Level of academic stress | 1.00 (1.00–1.00) | 0.084 | ||
Multivariate logistic regression analysis for identifying independent risk factors.
On the basis of the selected independent risk factors—physical activity level, mother’s education level, parental myopia status, gender, only child status, and physical activity behavior—ten machine learning models were constructed to predict the risk of myopia in children and adolescents. These models included logistic regression, SVM, GBM, NNET, XGBoost, KNN, Random forest, AdaBoost, LightGBM, and CatBoost. The performance comparison of each model is shown in Figure 1. The results indicate that the LightGBM model had the highest AUC value in the training set (AUC = 0.738, 95% CI: 0.709–0.767).
Figure 1
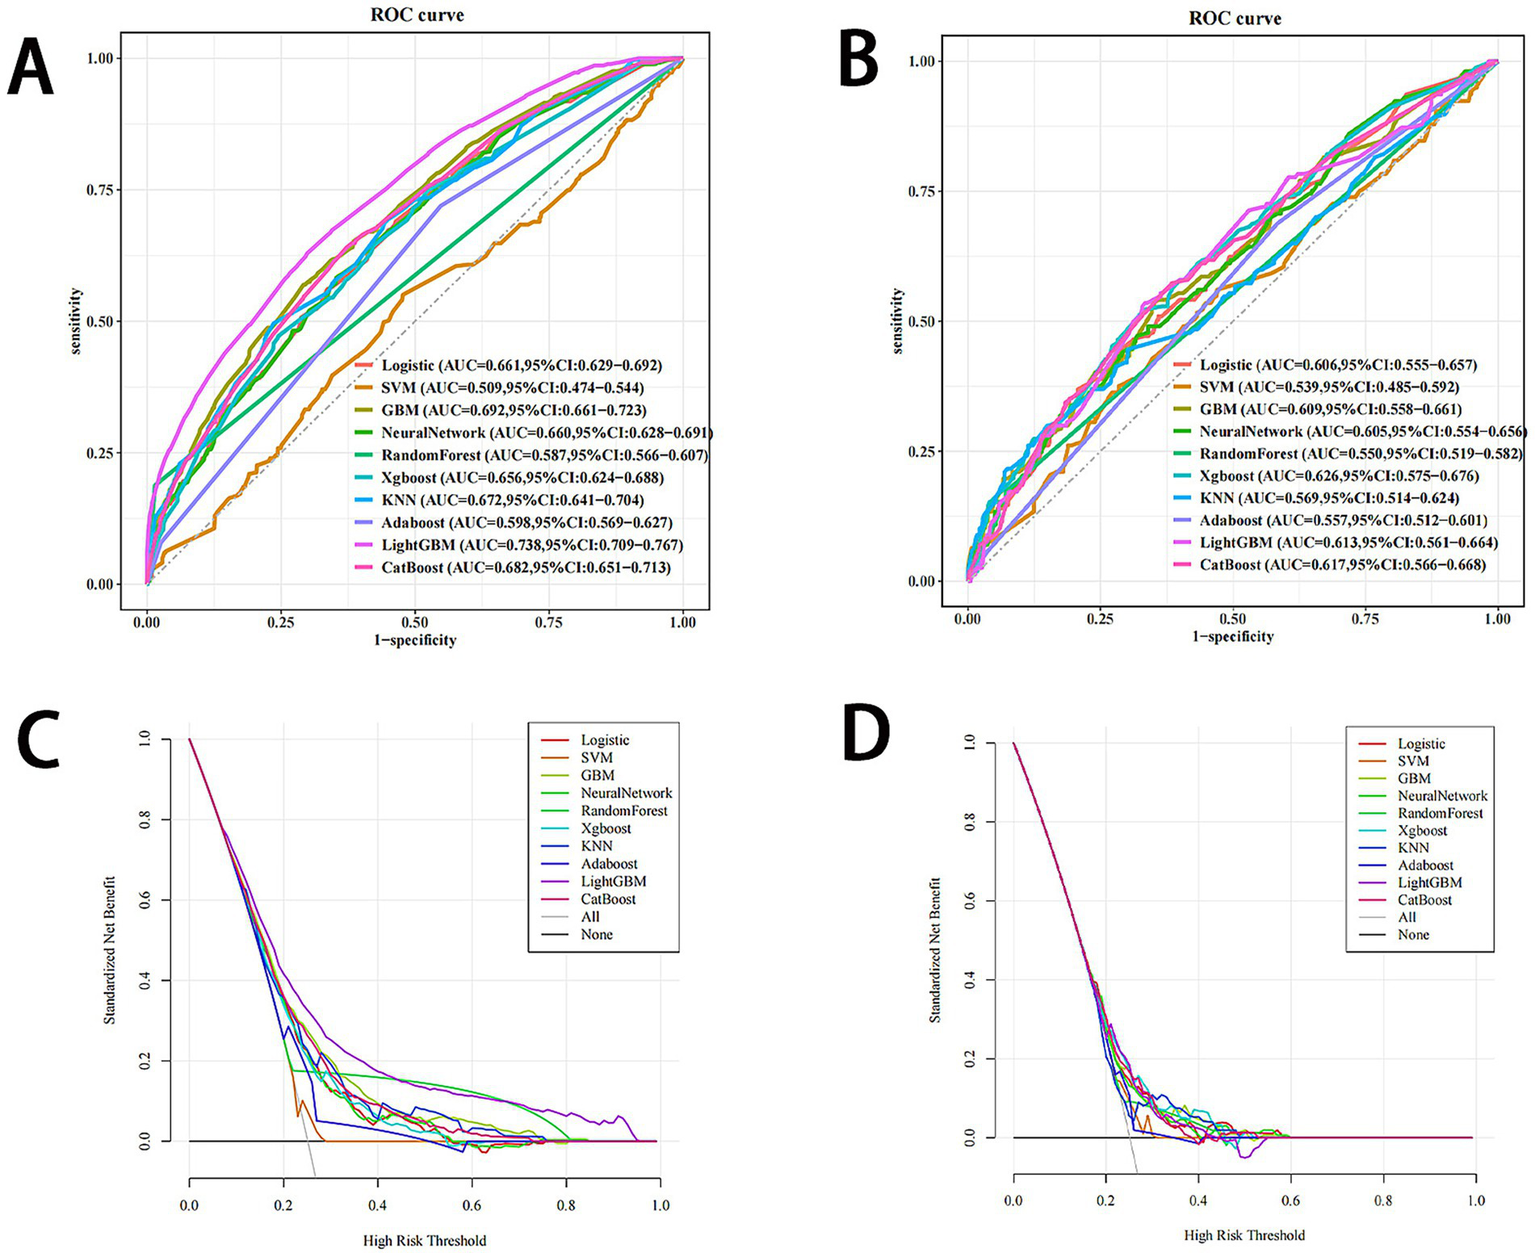
Comprehensive evaluation of machine learning models. (A) ROC curves and AUC values of the training set. (B) ROC curves and AUC values of the testing set. (C) Decision curve analysis of the logistic, SVM, GBM, neural network, Xogboost, KNN, Random forest AdaBoost, LightGBM, and CatBoost models in the training set. (D) Decision curve analysis of the logistic, SVM, GBM, neural network, Xogboost, KNN, Random forest AdaBoost, LightGBM, and CatBoost models in the testing set. ROC, receiver operating characteristic; AUC, area under the receiver operating characteristic curve; logistic, logistic regression; VM, support vector machine; GBM, gradient boosting machine; Xgboost, extreme gradient boosting; KNN, k-nearest neighbors; AdaBoost, adaptive boosting; LightGBM, light gradient boosting machine; CatBoost, categorical boosting.
In addition, the five performance metrics for the LightGBM model in the training set were as follows: accuracy = 0.683, sensitivity = 0.629, specificity = 0.701, F1 score = 0.499, as shown in Table 3. In the testing set, the five performance metrics for LightGBM were as follows: accuracy = 0.634, sensitivity = 0.535, specificity = 0.667, F1 score = 0.423. Overall, the LightGBM model exhibited the best performance.
Table 3
| Model | Accuracy | Sensitivity | Specificity | F1 score |
|---|---|---|---|---|
| Training set | ||||
| Logistic | 0.575 | 0.689 | 0.537 | 0.449 |
| SVM | 0.53 | 0.55 | 0.523 | 0.37 |
| GBM | 0.674 | 0.569 | 0.708 | 0.467 |
| NeuralNetwork | 0.631 | 0.583 | 0.647 | 0.443 |
| Xgboost | 0.684 | 0.471 | 0.756 | 0.429 |
| KNN | 0.697 | 0.496 | 0.764 | 0.451 |
| RandomForest | 0.668 | 0.545 | 0.705 | 0.445 |
| AdaBoost | 0.52 | 0.719 | 0.452 | 0.429 |
| LightGBM | 0.683 | 0.629 | 0.701 | 0.499 |
| CatBoost | 0.631 | 0.64 | 0.628 | 0.466 |
| Testing set | ||||
| Logistic | 0.686 | 0.369 | 0.793 | 0.372 |
| SVM | 0.637 | 0.363 | 0.729 | 0.334 |
| GBM | 0.621 | 0.535 | 0.65 | 0.415 |
| NeuralNetwork | 0.629 | 0.471 | 0.682 | 0.389 |
| Xgboost | 0.632 | 0.522 | 0.669 | 0.416 |
| KNN | 0.712 | 0.299 | 0.85 | 0.343 |
| RandomForest | 0.635 | 0.515 | 0.675 | 0.415 |
| AdaBoost | 0.485 | 0.688 | 0.417 | 0.401 |
| LightGBM | 0.634 | 0.535 | 0.667 | 0.423 |
| CatBoost | 0.605 | 0.573 | 0.615 | 0.422 |
Comparison of performance metrics across models.
Model interpretations
The contributions of the predictive factors to the prediction results were quantified via SHAP (SHapley Additive exPlanations). SHAP applies a game-theory-based method to evaluate the importance of each feature. SHAP significance analysis via the LightGBM model visualized the ranking of feature importance, as shown in Figure 2A. Our analysis identified the top six risk factors associated with myopia: parental myopia status, physical activity level, only child status, physical activity behavior score, mother’s education level, and gender.
Figure 2
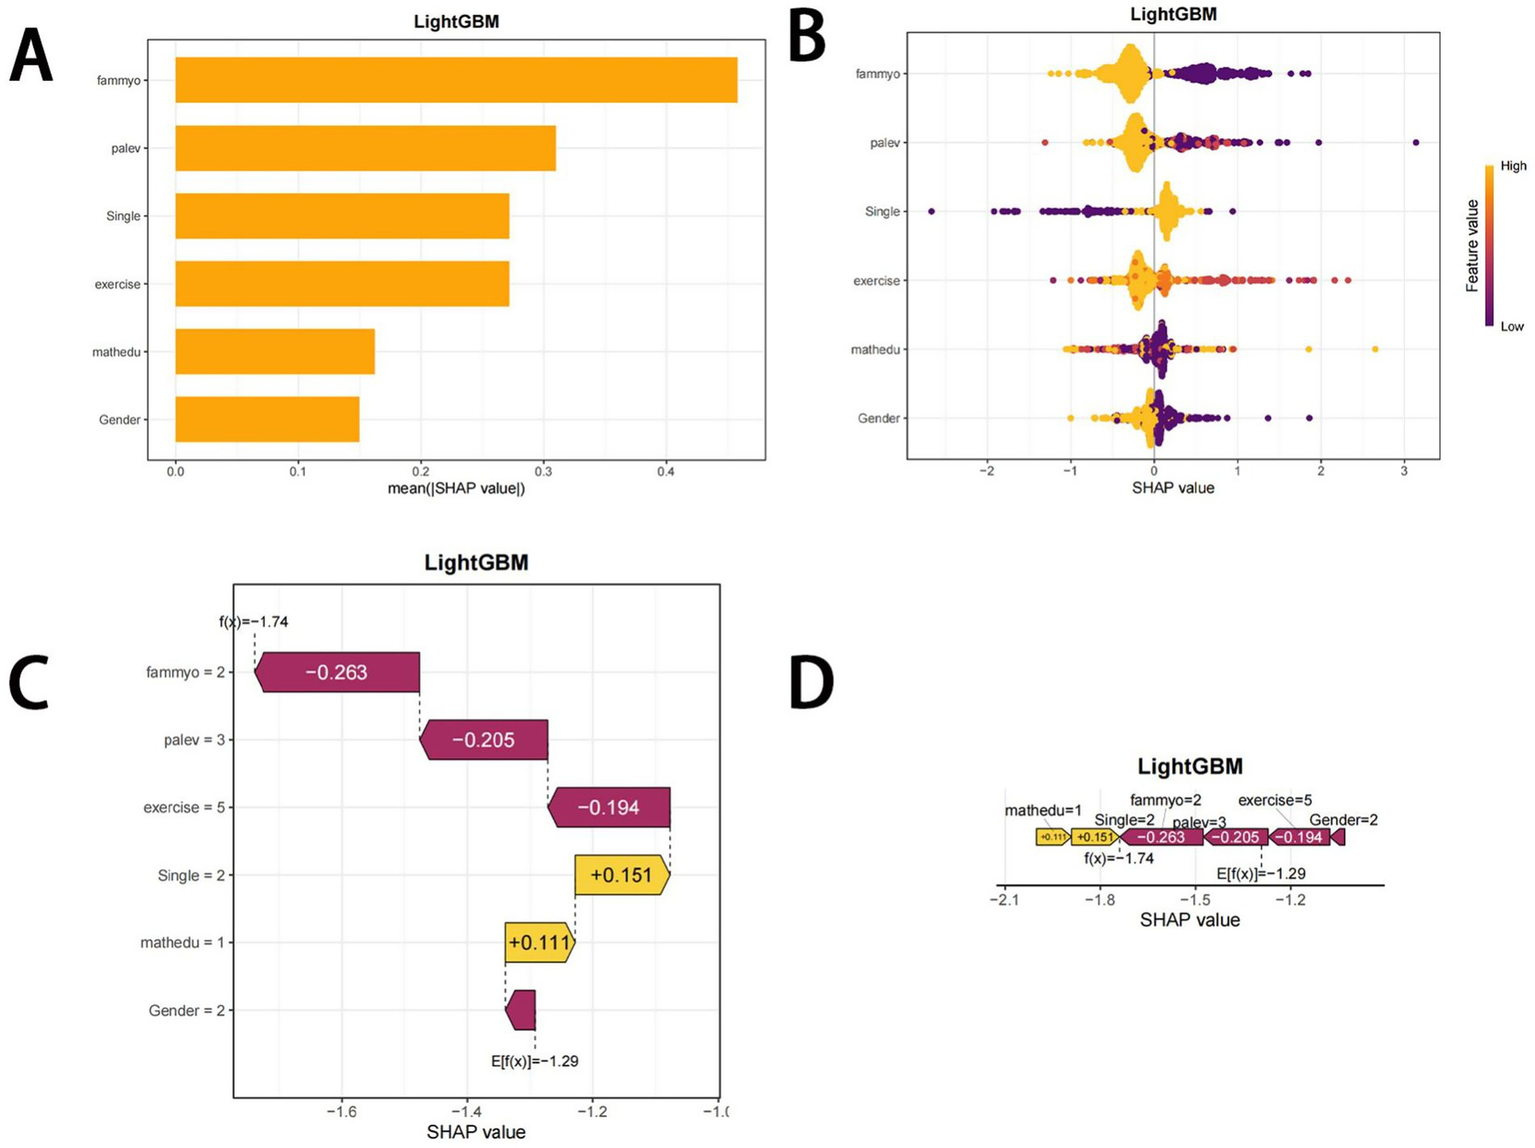
SHAP plots. (A) Bar chart of the mean absolute SHAP value for each predictor of the LightGBM model in descending order. (B) SHAP summary plot showing feature importance for each predictor of the LightGBM model in descending order. The upper predictors are more important to the model’s predictive outcome. A dot is created for each feature attribution value for the LightGBM model of each student. The further away a dot is from the baseline SHAP value of zero, the stronger its effect on the model output. The dots are colored according to the values of the features. Yellow represents higher feature values, and red represents lower feature values. (C) Consent waterfall plot showing an example of interpretability analysis for a student. The yellow part of the feature value represents a positive effect on the model. The deep red part of the feature value represents a negative effect on the model (D). The force plots provide personalized feature attributions via two representative examples. SHAP, Shapley additive explanations.
The SHAP summary plot (Figure 2B) further supplements this ranking by visually displaying the impact of each feature on the model’s output. A positive Shapley value for each feature indicates increased risk, whereas a negative value suggests decreased risk. To further illustrate the application of the LightGBM model, we randomly selected an individual from the validation cohort. The waterfall plot displays the feature contributions for this individual, with yellow and purple bars representing the contributing features to myopia risk prediction (Figures 2C,D).
These visualizations help relevant stakeholders quickly understand which factors are most strongly associated with the increase or decrease in myopia risk among children and adolescents. The results show that parental myopia, low physical activity level, and only child status are the top three factors contributing to the prediction of myopia risk, with Figures 2C,D demonstrating the specific impact of these factors on individual myopia predictions.
Discussion
This study explored predictors of myopia among children and adolescents in a province of China using various machine learning algorithms. Key predictors included parental myopia, gender, maternal education level, only-child status, general physical activity levels, and specific school-based physical activity behaviors. These findings are consistent with prior research and underscore the multifactorial nature of myopia development, involving both genetic predispositions and modifiable lifestyle patterns.
This study included 2,086 children and adolescents aged 6 to 16 years. The results revealed that the overall myopia rate among students was 25.12%, of which 55.4% were boys and 44.6% were girls. The results revealed that the overall myopia rate among students was 25.12% with notable differences between middle school students (85.24%) and primary school students (25.52%). This finding further confirms the high incidence of myopia among children and adolescents in recent years, particularly among middle school students (25, 26). Additionally, physical activity level, anxiety level, and academic pressure have been identified as important factors influencing myopia risk (15, 27, 28). Our data show that children and adolescents generally have low levels of physical activity, along with high levels of anxiety and academic pressure, which is consistent with studies both domestically and internationally (29). These results suggest that the health behaviors, psychological state, and academic pressure of children and adolescents are closely related to the onset of myopia, highlighting the importance of early and comprehensive intervention strategies.
Through LASSO regression, we identified parental myopia status, only child status, physical activity level, maternal education level, age, and physical activity behavior as independent risk factors for myopia in children and adolescents, which is consistent with several studies. Specifically, genetic factors have been shown to significantly influence myopia risk, with adolescents who have a family history of myopia being at greater risk than those with parents who do not have myopia (30). Additionally, age is positively correlated with the occurrence of myopia, and the myopia rate increases significantly with age (31). Notably, this study confirms that low physical activity levels and insufficient physical activity behavior are significantly associated with a greater risk of myopia (32), with physical activity behavior primarily referring to activities during physical education classes, which further emphasizes the important role of school-based physical education in myopia prevention. On the other hand, this finding also supports the concept proposed by Yan Jinhui (33) regarding the combined effect of “outdoor activities” and “exercise” in myopia prevention. Moreover, children from only child families and those with higher maternal education levels face a greater risk of myopia. Research by Quan Xiaojun (10) revealed that only children have a higher myopia rate than nononly children do, and the risk of myopia increases with higher maternal education. This may be due to the stronger influence of the mother’s education level on the child’s education level than the father’s education level does (34). Compared with nononly children, only children tend to receive more attention from their parents, particularly those with a greater likelihood of attending extracurricular classes, which in turn increases the risk of myopia (35).
To more accurately predict myopia risk in children and adolescents and select the best predictive model, this study used the six feature variables selected by LASSO regression to build and compare nine machine learning models. By utilizing metrics such as accuracy, precision, F1 score, specificity, sensitivity, and area under the receiver operating characteristic curve (AUC), we provide a scientific and comprehensive evaluation framework for myopia risk prediction. The results revealed that the LightGBM model performed the best (training set: AUC 0.738; testing set: AUC 0.613). LightGBM is a gradient boosting decision tree-based machine learning algorithm designed for efficient model construction and training, suitable for large-scale and high-dimensional datasets, and widely applied in multiple fields, especially in medical diagnostics (36, 37). However, the importance ranking in the LightGBM model reflects only the overall influence of variables and does not express the role of variables in specific categories. Therefore, this study introduces the SHAP method to explain the importance and contribution of variables in the LightGBM model.
This study utilized SHAP (Shapley additive explanations) analysis to further uncover the contributions of key features, such as physical activity level, physical activity behavior score, parental myopia status, gender, and mother’s education level, in predicting myopia outcomes, thereby providing interpretable insights for myopia prevention strategies. These findings are highly consistent with the conclusions of the literature, further validating the importance of these factors in the onset of myopia. Our study revealed that parental myopia is crucial for predicting whether children and adolescents will develop myopia. A large body of research has confirmed that genetics is the most direct explanation for myopia, with children of myopic parents being at a greater risk of developing myopia (38). Moreover, genetic-environmental effects may also play a role, where parental behaviors and rearing practices increase myopia risk in children, with environmental factors acting as intermediaries in the genetic-myopia relationship (39). Notably, physical activity also plays a critical role in myopia. Our results show that physical activity level and physical activity behavior, particularly related to school sports activities, significantly contribute to predicting myopia risk in children and adolescents. These factors reflect students’ enthusiasm for participating in physical education classes and their physical exertion during these activities, demonstrating a close relationship between high levels of physical activity and lower myopia risk. These findings also highlight the strong role of outdoor activities and physical exercise in mitigating myopia. Extensive research has confirmed the significant effect of outdoor activities on reducing myopia risk (40, 41), primarily emphasizing the importance of daylight environments (42). Moreover, physical activities themselves, with their rich content and differentiated exercise methods, are considered to have a positive impact on promoting adolescent visual health and slowing myopia progression. Physical activity at different thresholds can have differential effects on myopia prevention. For example, long-duration (≥24 weeks), moderate-frequency (3–4 times/week), and short-duration (60–90 min) exercise regimens have been proven to be reference thresholds for positive effects (43). Physical activity promotes overall blood circulation, enhances muscle strength, regulates eye muscle function, and alleviates tension in the ciliary muscles, thus effectively slowing the progression of myopia (44). For example, sports such as table tennis can help relax the ciliary muscles and reduce the occurrence of accommodative myopia (pseudomyopia) (33). Furthermore, regular and intense physical activity can increase choroidal and ocular blood flow and stabilize ciliary body regulation, ensuring proper involvement of the choroid in refractive regulation, which guides the process of visual acuity development and promotes eye health (18, 45).
The contribution of physical activity and related behavioral scores to myopia risk was among the most prominent findings in this study. Children and adolescents with lower overall physical activity levels and less favorable activity behaviors were at increased risk of myopia, reinforcing the importance of modifiable lifestyle factors. SHAP analysis further highlighted the predictive contributions of only-child status, maternal education level, and gender. While maternal education emerged as a significant predictor across multiple models, the direction of its influence varied. This inconsistency may reflect a non-linear relationship shaped by interacting contextual factors. For instance, higher maternal education could imply increased health awareness and resources but may also correlate with heightened academic demands or increased screen exposure—both of which may negatively affect eye health. These findings point to the need for further research into the nuanced role of parental education in myopia development. Gender emerged as a significant predictor in our models, with females showing higher myopia risk, consistent with many international studies from East Asian populations (7). This gender difference may reflect multiple factors including behavioral patterns and outdoor activity levels. The consistent identification of this pattern across multiple machine learning algorithms validates its significance and demonstrates ML’s unique value: unlike traditional hypothesis-driven analyses constrained by international literature assumptions, our data-driven approach revealed population-specific patterns. This finding underscores that myopia interventions must be tailored to local behavioral contexts rather than following universal gender-based strategies.
These ML models could be integrated into clinical workflows as screening tools in pediatric clinics and schools. Healthcare providers could input basic information (parental myopia, physical activity levels) to generate instant risk assessments, enabling efficient triage and personalized prevention strategies. For clinicians, this provides evidence-based decision support and streamlines screening. For patients, it offers accessible risk assessment without specialized equipment. The SHAP visualizations help doctors explain specific risk factors to parents, improving communication and intervention compliance. Such tools are particularly valuable in resource-limited settings where access to eye care specialists is restricted.
The identification of unexpected patterns, such as the complex interplay between demographic and behavioral factors, exemplifies machine learning’s unique contribution to epidemiological research. Unlike hypothesis-driven approaches that may be constrained by existing assumptions, our machine learning models objectively identified risk patterns specific to our population. The convergence of multiple algorithms on similar predictors, despite their different underlying mechanisms, strengthens confidence in these findings. Furthermore, SHAP analysis provided transparent, interpretable insights into how each factor contributes to predictions, addressing common concerns about machine learning’s “black box” nature. Collectively, our results support the utility of machine learning models in identifying meaningful risk factors for myopia. SHAP-based interpretation underscores the critical role of physical activity, lending empirical support to the “environment-behavior interaction” hypothesis. From a public health perspective, these insights suggest that strengthening school-based physical activity programs may be a promising direction for myopia prevention strategies.
Limitations and future directions
First, the study sample is primarily derived from a specific province in China, and the regional nature of the sample may limit the generalizability of the results, affecting their applicability to broader populations. Second, although the study collected a rich dataset through questionnaires, there may be biases in self-reported data, especially concerning sensitive issues such as behavior and mental health, which could affect the accuracy of the data. Additionally, this study did not include clinical indicators or physiological data, focusing primarily on modifiable behavioral factors, which may limit the comprehensive understanding of the mechanisms behind myopia. Finally, this study was designed as a single-center study and lacked external validation. Therefore, the reliability of the findings needs to be validated in other regions. Future research should explore the effects of different behavioral interventions, particularly personalized physical activity programs for children and adolescents, to improve the precision and effectiveness of myopia prevention. Longitudinal cohort studies will also help validate the causal relationships between these behavioral factors and myopia, advancing myopia prevention strategies in a more scientific and systematic direction.
Conclusion
This study developed nine machine learning models based on six features selected via LASSO regression to explore risk factors associated with myopia in children and adolescents. Among these, the LightGBM model achieved the highest performance (AUC = 0.738 in training; 0.613 in validation), though overall predictive accuracy remained modest. These findings suggest that while machine learning offers potential for risk stratification and variable interpretation in myopia research, its current application for individualized prediction may be limited without further external validation.
Statements
Data availability statement
The original contributions presented in the study are included in the article/supplementary material, further inquiries can be directed to the corresponding author.
Ethics statement
The studies involving humans were approved by East China Normal University (HR476–2020). The studies were conducted in accordance with the local legislation and institutional requirements. Written informed consent for participation in this study was provided by the participants’ legal guardians/next of kin.
Author contributions
YX: Writing – original draft, Writing – review & editing, Conceptualization, Data curation, Formal analysis, Funding acquisition, Investigation, Methodology, Project administration, Resources, Software, Supervision, Validation, Visualization. WZ: Conceptualization, Data curation, Investigation, Resources, Writing – original draft. WY: Software, Supervision, Validation, Visualization, Writing – original draft. XW: Methodology, Supervision, Validation, Visualization, Writing – review & editing. QZ: Data curation, Investigation, Writing – original draft. SD: Funding acquisition, Project administration, Validation, Visualization, Writing – original draft, Writing – review & editing.
Funding
The author(s) declare that financial support was received for the research and/or publication of this article. This research is supported by the 2024 Youth Fund for Humanities and Social Science Research of the Ministry of Education (No. 24YJC890008) and the 75th batch of Postdoctoral Funding in China (2024M750911).
Acknowledgments
We would like to express our sincere gratitude to all the participants, data collectors, and researchers involved in this study. Special thanks to the local schools and institutions for their cooperation and support during the data collection process.
Conflict of interest
The authors declare that the research was conducted in the absence of any commercial or financial relationships that could be construed as a potential conflict of interest.
Generative AI statement
The authors declare that no Gen AI was used in the creation of this manuscript.
Any alternative text (alt text) provided alongside figures in this article has been generated by Frontiers with the support of artificial intelligence and reasonable efforts have been made to ensure accuracy, including review by the authors wherever possible. If you identify any issues, please contact us.
Publisher’s note
All claims expressed in this article are solely those of the authors and do not necessarily represent those of their affiliated organizations, or those of the publisher, the editors and the reviewers. Any product that may be evaluated in this article, or claim that may be made by its manufacturer, is not guaranteed or endorsed by the publisher.
Abbreviations
AbbreviationsML, Machine learning; SVM, Support vector machine; GBM, Gradient boosting machine; NNET, Neural network; XGBoost, Extreme gradient boost; KNN, K-nearest neighbors; AdaBoost, Adaptive boosting; LightGBM, Light gradient boosting machine; CatBoost, Categorical boosting; SHAP, SHapley Additive exPlanations; AUC, Area under the receiver operating characteristic curve; ROC, receiver operating characteristic.
References
1.
Nieman C Swenor B Yeh C . WHO world reports on hearing and vision: meeting the growing needs of older adults. Innov Aging. (2020) 4:807–7. doi: 10.1093/geroni/igaa057.2930
2.
Zhou S Yang L Lu B Wang H Xu T Du D et al . Association between parents’ attitudes and behaviors toward children’s visual care and myopia risk in school-aged children. Medicine. (2017) 96:e9270. doi: 10.1097/MD.0000000000009270
3.
Dong L Kang YK Li Y Wei WB Jonas JB . Prevalence and time trends of myopia in children and adolescents in china: a systemic review and meta-analysis. Retina. 40:399–411. doi: 10.1097/IAE.0000000000002590
4.
Fricke T Holden B Wilson D Schlenther G Naidoo K Resnikoff S et al . Global cost of correcting vision impairment from uncorrected refractive error. Bull World Health Org. (2012) 90:728–38. doi: 10.2471/BLT.12.104034
5.
Feldkaemper M Schaeffel F . An updated view on the role of dopamine in myopia. Exp Eye Res. (2013) 114:106–19. doi: 10.1016/j.exer.2013.02.007
6.
Zhou X Pardue MT Iuvone PM Qu J . Dopamine signaling and myopia development: what are the key challenges. Prog Retin Eye Res. (2017) 61:60–71. doi: 10.1016/j.preteyeres.2017.06.003
7.
Rai BB Ashby RS French AN Maddess T . Rural-urban differences in myopia prevalence among myopes presenting to Bhutanese retinal clinical services: a 3-year national study. Graefes Arch Clin Exp Ophthalmol. (2021) 259:613–21. doi: 10.1007/s00417-020-04891-6
8.
Huang H-M Chang DS-T Wu P-C . The association between near work activities and myopia in children—a systematic review and Meta-analysis. PLoS One. (2015) 10:e0140419. doi: 10.1371/journal.pone.0140419
9.
Smith EL Hung L-F Huang J . Relative peripheral hyperopic defocus alters central refractive development in infant monkeys. Vis Res. (2009) 49:2386–92. doi: 10.1016/j.visres.2009.07.011
10.
Quan XJ Zhang Q . Family structure and health risks: an empirical analysis based on adolescent myopia. China Youth Study. (2020) 6:53–60.
11.
O’Donoghue L Kapetanankis VV McClelland JF Logan NS Owen CG Saunders KJ et al . Risk factors for childhood myopia: findings from the NICER study. Invest Ophthalmol Vis Sci. (2015) 56:1524–30. doi: 10.1167/iovs.14-15549
12.
Li L Zhang J Chen M Li X Chu Q Jiang R et al . Contribution of Total screen/online-course time to Asthenopia in children during COVID-19 pandemic via influencing psychological stress. Front Public Health. (2021) 9:736617. doi: 10.3389/fpubh.2021.736617
13.
Liu J . Understanding risks of refractive error among Chinese children amidst pandemic disruptions: results from a rapid survey. BMC Ophthalmol. (2021) 21:370. doi: 10.1186/s12886-021-02133-9
14.
Łazarczyk JB Urban B Konarzewska B Szulc A Bakunowicz-Łazarczyk A Żmudzka E et al . The differences in level of trait anxiety among girls and boys aged 13–17 years with myopia and emmetropia. BMC Ophthalmol. (2016) 16:201. doi: 10.1186/s12886-016-0382-2
15.
Wang XYJD Yang J Xian Y . Analysis of social anxiety status and its risk factors among myopic primary school students in Urumqi. Chin J Contemp Pediatr. (2019) 21:184–8.
16.
Wang F Feng Q . Research on the relationship between adolescent myopia and abnormal body posture. China Youth Study. (2022) 8:80–8. doi: 10.19633/j.cnki.11-2579/d.2022.0033
17.
Du S Xu W . Adolescent “myopia personality” and its urban–rural differences: empirical evidence from the China education panel survey. Basic Educ. (2024) 21:68–80. doi: 10.3969/j.issn.1005-2232.2024.02.005
18.
Kong L Yang J Yang T . Investigation of mental health status in patients with pathological myopia and analysis of related factors influencing anxiety and depression. Int J Psychiatry. (2018) 45:1088–91. doi: 10.13479/j.cnki.jip.2018.06.039
19.
Tang T Yu Z Xu Q Peng Z Fan Y Wang K et al . A machine learning-based algorithm used to estimate the physiological elongation of ocular axial length in myopic children. Eye Vis. (2020) 7:50. doi: 10.1186/s40662-020-00214-2
20.
Tu Y Hu X Zeng C Ye M Zhang P Jin X et al . A machine-learning approach to discerning prevalence and causes of myopia among elementary students in Hubei. Int Ophthalmol. (2022) 42:2889–902. doi: 10.1007/s10792-022-02279-5
21.
Yang X Chen G Qian Y Wang Y Zhai Y Fan D et al . Prediction of myopia in adolescents through machine learning methods. IJERPH. (2020) 17:463. doi: 10.3390/ijerph17020463
22.
Fan M Lyu J He PP . Calculation methods for physical activity levels in the international physical activity questionnaire. Chin J Epidemiol. (2014) 35:961–4. doi: 10.3760/cma.j.issn.0254-6450.2014.08.019
23.
Chen Y . A study on the applicability of the patient health questionnaire-adolescent version and the 7-item generalized anxiety disorder scale in adolescents with major depressive disorder. China: Southern Medical University (2024).
24.
Chen X . Study on academic stress, coping strategies, and psychological mechanisms of coping in middle school students. China: Southwest Normal University (2004).
25.
Song H Liu Y Song Y . Analysis of myopia status and its influencing factors among primary and secondary school students in Beijing. Chin J Sch Health. (2010) 31:818–20. doi: 10.16835/j.cnki.1000-9817.2010.07.023
26.
French AN Morgan IG Mitchell P Rose KA . Patterns of myopigenic activities with age, gender and ethnicity in Sydney schoolchildren. Ophthalmic Physiol Opt. (2013) 33:318–28. doi: 10.1111/opo.12045
27.
Wang BN Wang LJ Chen RZ . The relationship between physical activity and myopia in children and adolescents: a systematic review and meta-analysis. China Sport Sci Technol. (2022) 58:62–72. doi: 10.16470/j.csst.2019160
28.
Wei RH Zhang J Jin N . Research on the monitoring path of the implementation of the “double reduction” policy: a perspective from big data management of eye health among primary and secondary school students in Tianjin. J Tianjin Normal Univ. (2023) 22:47–53.
29.
Tong H-J Huang Z-M Li Y-L Chen Y-M Tian B Ding L-L et al . Machine learning to analyze the factors influencing myopia in students of different school periods. Front Public Health. (2023) 11:1169128. doi: 10.3389/fpubh.2023.1169128
30.
Guo Q Wang L Chen G . The current status of myopia and its influencing factors among adolescents in Hefei City. Chin J Prev Med. (2025) 26:55–60. doi: 10.16506/j.1009-6639.2025.01.010
31.
Wang M Shi R Chen Z . The current status of myopia and the rate of age-related increase in children and adolescents in Hebei province. Chin J Prev Med. (2024) 25:119–22. doi: 10.16506/j.1009-6639.2024.01.021
32.
Xuan X Chen YR Liu ZK . Mental health status and influencing factors of myopic middle school students: a comparison with middle school students with normal vision. Chin J Spec Educ. (2021) 8:91–6. Available online at: https://qikan.cqvip.com/Qikan/Article/Detail?id=7105611535
33.
Yan JH Cai YJ Zhang YA . Utility elements for myopia prevention and control in adolescents: outdoor environment and physical exercise. J Xi’an Phys Educ Univ. (2023) 40:210–20. doi: 10.16063/j.cnki.issn1001-747x.2023.02.009
34.
Cai W . The impact of maternal education on the educational and social status of offspring in the family context. J Guangzhou Univ. (2016) 15:63–9.
35.
Zhang X Li T Wang W . Myopia detection and its related factors in fourth-grade students in China. Chin J Dis Control. (2024) 28:869–908. doi: 10.16462/j.cnki.zhjbkz.2024.08.001
36.
Meng Q . Light GBM:a highly efficient gradient boosting decision tree: neural information processing systems. New York: Curran Associates Inc. (2017).
37.
Qiuqian W GaoMin F KeZhu Z Chenchen C . A light gradient boosting machine learning-based approach for predicting clinical data breast cancer. Multiscale Multidiscip Model Exp Des. (2025) 8:75. doi: 10.1007/s41939-024-00662-6
38.
Gu X Chen X . Analysis of myopia influencing factors and development and validation of a prediction model based on machine learning for primary and secondary school students. Int J Ophthalmol. (2025) 25:328–36. doi: 10.3980/j.issn.1672-5123.2025.2.29
39.
Tao FB . Special interpretation of the “comprehensive public health intervention technical guidelines for myopia prevention and control in children and adolescents”. China School Health. (2023) 44:1445–9. doi: 10.16835/j.cnki.1000-9817.2023.10.002
40.
Guggenheim JA Northstone K McMahon G Ness AR Deere K Mattocks C et al . Time outdoors and physical activity as predictors of incident myopia in childhood: a prospective cohort study. Invest Ophthalmol Vis Sci. (2012) 53:2856–65. doi: 10.1167/iovs.11-9091
41.
Gupta S Joshi A Saxena H Chatterjee A . Outdoor activity and myopia progression in children: a follow-up study using mixed-effects model. Indian J Ophthalmol. (2021) 69:3446–50. doi: 10.4103/ijo.IJO_3602_20
42.
Jin JX Wu XY Wan YH . Association between outdoor activities and myopia in adolescents. Chin J Sch Health. (2013) 34:1284–7. doi: 10.16835/j.cnki.1000-9817.2025012
43.
Hu DN . Research progress on the etiology and pathogenesis of myopia. J Optom Ophthalmol. (2004) 7:1–5. Available online at: https://kns.cnki.net/kcms2/article/abstract?v=IPzr95zWmwRL-k6AurbFOLqHR0o7v8stsdPpz70TdhllXC_zICEbIh1uZ6WIkrQEqciq_A8tW3sYs--JXMt4X1B23zJ1VruyqIWml5O0liUjqlI2jr8MgjNWdLYZx-NLJwfGOfXgckv1KK-0HzCLkhnIB6BMG7lsiP0HAexX8oVQFYBewfydMA==&uniplatform=NZKPT&language=CHS
44.
Wu KL Guo LX Zhu EG . Study on the current status of vision and exercise intervention among clinical medicine students. J Wannan Med Coll. (2020) 39:84–7.
45.
Li XQ Jeppesen P Larsen M Munch IC . Subfoveal choroidal thickness in 1323 children aged 11 to 12 years and association with puberty: the Copenhagen child cohort 2000 eye study. Invest Ophthalmol Vis Sci. (2014) 55:550. doi: 10.1167/iovs.13-13476
Summary
Keywords
children and adolescents, myopia, modifiable risk factors, LightGBM, machine learning
Citation
Xi Y, Zhu W, Yan W, Wei X, Zhao Q and Dai S (2025) Optimizing myopia prediction in children and adolescents using machine learning: a multi-factorial risk assessment model. Front. Med. 12:1672432. doi: 10.3389/fmed.2025.1672432
Received
11 August 2025
Accepted
20 October 2025
Published
13 November 2025
Volume
12 - 2025
Edited by
Michael Wormstone, The University of Nottingham Ningbo, China
Reviewed by
Bhim Bahadur Rai, Australian National University, Australia
Tavish Gupta, All India Institute of Medical Sciences, India
Updates
Copyright
© 2025 Xi, Zhu, Yan, Wei, Zhao and Dai.
This is an open-access article distributed under the terms of the Creative Commons Attribution License (CC BY). The use, distribution or reproduction in other forums is permitted, provided the original author(s) and the copyright owner(s) are credited and that the original publication in this journal is cited, in accordance with accepted academic practice. No use, distribution or reproduction is permitted which does not comply with these terms.
*Correspondence: Shengting Dai, daishengting@ecust.edu.cn
Disclaimer
All claims expressed in this article are solely those of the authors and do not necessarily represent those of their affiliated organizations, or those of the publisher, the editors and the reviewers. Any product that may be evaluated in this article or claim that may be made by its manufacturer is not guaranteed or endorsed by the publisher.