Abstract
Objectives:
To investigate blood indicators associated with short-term mortality risk in older patients with hip fracture, and further evaluate the incremental predictive value of incorporating these indicators into existing clinical models.
Methods:
Data from 1881 patients in our institutional hip fracture database between January 2013 and December 2023 were retrospectively analyzed. The study outcome was all-cause mortality within 90 days of admission. Stepwise logistic regression, the Boruta algorithm, and Lasso regression were performed to identify features associated with mortality risk. Following feature selection, two predictive models were developed: Model A (clinical indicators only) and Model B (both clinical and blood indicators). Predictive performance was assessed using the area under the curve (AUC), net reclassification improvement (NRI), and integrated discrimination improvement (IDI).
Results:
Of the 1881 patients, 217 (11.5%) died within 90 days. Stepwise logistic regression identified 12 significant features associated with mortality risk, the Boruta algorithm identified 25 important features, and Lasso regression analysis selected 18 features with non-zero coefficients (all P < 0.05). Model B significantly outperformed Model A across all feature selection methods (all P < 0.001): stepwise logistic regression (AUC: 0.822 vs. 0.753), the Boruta algorithm (AUC: 0.820 vs. 0.749), and Lasso regression (AUC: 0.826 vs. 0.756). Model B also showed significant reclassification improvements (all P < 0.001): stepwise logistic regression (NRI: 0.733, IDI: 0.107), the Boruta algorithm (NRI: 0.762, IDI: 0.113), and Lasso regression (NRI: 0.725, IDI: 0.112).
Conclusion:
Various blood indicators were associated with 90-day mortality in older patients with hip fracture, and significantly enhanced the predictive ability of clinical models for short-term mortality risk. By utilizing these blood indicators, clinicians can comprehensively and objectively assess the physiological status of hip fracture patients at admission, thereby facilitating the early identification of high-risk patients and guiding personalized treatment strategies.
1 Introduction
With aging intensifying, hip fractures have become a major global public health issue (1). Data from the Global Burden of Disease Study (GBD) revealed a rapid rise in hip fracture incidence among people aged 60 years and older across 204 countries and territories from 1990 to 2019 (1). Another study projected a 1.91-fold increase in annual hip fractures across 19 countries and regions by 2050 compared to 2018 (2). Notably, despite significant medical advancements, the mortality rate among older patients with hip fracture remains high. Recently, a meta-analysis of 244 studies involving over a million hip fracture patients reported that in-hospital, 30-day, and 1-year mortality rates were 1.4–5.5%, 1.2–7.4%, and 10.8–23.8%, respectively (3). As is well known, identifying high-risk individuals early and accurately is crucial for the timely initiation and optimization of personalized interventions, thereby improving the prognosis of hip fracture patients (4).
To accurately predict the mortality risk in patients sustaining hip fractures, numerous risk prediction models have been established. Among these, some are specifically designed for hip fractures, including the Nottingham Hip Fracture Score (NHFS) (5), the Almelo Hip Fracture Score (AHFS) (6), and the models developed by Jiang et al. (7) and Holt et al. (8). Other models, such as the Charlson Comorbidity Index (CCI) (9), the American Society of Anesthesiologists (ASA) classification (10), and the American College of Surgeons National Surgical Quality Improvement Program (ACS-NSQIP) Surgical Risk Calculator (11), are also used but are not tailored for hip fractures. However, these models may be limited by complexity, inherent subjectivity and potential overestimation of mortality risk (12–14).
In clinical practice, routine blood indicators are easily accessible and cost-effective, and can objectively reflect the severity of a patient’s condition. Many blood indicators have been demonstrated to be significantly associated with the mortality risk in hip fracture patients, such as hemoglobin (15), lymphocyte count (16), neutrophil count (17), and albumin level (18). A recent systematic review indicated that six of 23 mortality prediction models were commonly used for hip fracture patients, including the NHFS, CCI, AHFS, Jiang et al., Holt et al., and ACS-NSQIP (19). However, only two of these six models (NHFS and AHFS) incorporate a single blood parameter, specifically hemoglobin. Therefore, this study aimed to systematically investigate blood indicators associated with short-term mortality risk in older patients with hip fracture, and further evaluate the incremental predictive value of incorporating these indicators into existing clinical models.
2 Materials and methods
2.1 Patients and study design
This study retrospectively analyzed data from our institutional hip fracture database, which has been extensively used for prognostic research in hip fractures (20–23). Between January 2013 and December 2023, a total of 2713 patients diagnosed with femoral neck or intertrochanteric fractures were initially enrolled in the database. Patients were excluded from the database if they met any of the following criteria: (1) aged under 60 years; (2) old fractures (> 3 weeks after injury), pathological fractures, or periprosthetic fractures; (3) high-energy fractures (e.g., traffic accidents, falls from a height greater than standing height); (4) lack of follow-up data. In this study, patients with less than 90 days of follow-up or without blood tests were further excluded. The flowchart of patient selection is illustrated in Figure 1. Our Institutional Ethics Committee approved the study protocol (No. 2022-04-040-K01), and patients provided written informed consent for the research use of their clinical data.
FIGURE 1

Study flowchart. This flowchart illustrates the study design, including case inclusion and exclusion criteria, data collection process, feature selection methods, and evaluation of incremental predictive value.
2.2 Data collection
Previous study has reported that when the missing data rate exceeds 15.0%, the multiple imputation by chained equations (MICE) method may yield unreliable results (24). Therefore, the following variables were extracted from the database, and those with missing rates over 15.0% were excluded to ensure data quality and the reliability of subsequent analyses.
(1) Demographic data included age, sex, body mass index (BMI), smoking status, and marital status. According to our previous study (22), smoking status was categorized as non-smoker or smoker (current or former), and marital status was classified as widowed or other (married, divorced or never-married).
(2) For objective assessment of patients’ comorbidity burden, the CCI was calculated for each patient based on admission diagnoses and past medical history.
(3) Fracture characteristics included time to admission (TTA) and fracture type. TTA, defined as the interval from injury occurrence to hospital admission, was determined from admission records (25). Fracture type was grouped as either femoral neck or intertrochanteric fracture based on discharge diagnoses and imaging findings.
(4) Given the documented association between blood indicators and mortality in hip fracture patients, the following blood indicators were collected at the first 24 h after admission.
(i) Blood routine tests included white blood cell (WBC), neutrophil, lymphocyte, monocyte, red blood cell (RBC), hemoglobin, hematocrit, mean corpuscular volume (MCV), mean corpuscular hemoglobin (MCH), mean corpuscular hemoglobin concentration (MCHC), red cell distribution width-standard deviation (RDW-SD), red cell distribution width-coefficient of variation (RDW-CV), and platelet.
(ii) Biochemical tests included liver function (albumin, prealbumin, alanine aminotransferase [ALT], alkaline phosphatase [ALP]), renal function (creatinine, blood urea nitrogen [BUN], uric acid), electrolytes (potassium, sodium, calcium), and blood glucose.
(iii) Coagulation function tests included international normalized ratio (INR), prothrombin time (PT), and activated partial thromboplastin time (APTT).
(5) Other blood indicators that have not been previously reported to be associated with mortality in hip fracture patients were also collected. These included eosinophil, basophil, mean platelet volume (MPV), plateletcrit, fibrinogen, thrombin time, antithrombin III activity (AT-III), β2-microglobulin (β2-MG), adenosine deaminase (ADA), aspartate aminotransferase (AST), total bile acids (TBA), direct bilirubin (D-BIL), total bilirubin (T-BIL), globulin, total protein, albumin to globulin ratio (AGR), magnesium (Mg), phosphorus (P), chloride (CL), and bicarbonate (HCO3).
2.3 Study outcome
The study outcome was the short-term mortality rate, defined as all-cause mortality within 90 days of admission (26). Patient survival status was ascertained through three methods (22). (1) For in-hospital deaths, the exact time of death was obtained from hospital death records. (2) For discharged patients, annual telephone follow-up was conducted until May 2024, and the date of death was recorded when applicable. (3) If telephone follow-up failed after three attempts, post-discharge survival status was verified through outpatient, emergency or inpatient medical records. Cases for whom survival status could not be determined using these three methods were considered lost to follow-up, resulting in a loss to follow-up rate of 7.50% in our database.
2.4 Statistical analysis
Prior to analysis, missing values were detected in 28 variables, with missing data rates ranging from 0.3 to 13.8%. Missing values were imputed using the random forest method for multiple imputation (27). Continuous variables are expressed as mean ± standard deviation (SD) or median [interquartile range (IQR)] based on the Shapiro-Wilk normality test results, and categorical variables are presented as numbers (percentages). Differences between the survival and deceased groups were compared using the t-test, Wilcoxon rank-sum test or Pearson’s chi-square test.
To identify variables associated with mortality risk, this study employed three feature selection approaches: filter, wrapper and embedded methods (Figure 1). Initially, univariate feature selection was performed to eliminate features that were not significantly associated with the outcome (P > 0.05), and Spearman correlation analysis was used to remove redundant features with strong correlation (|ρ| ≥ 0.7). Subsequently, stepwise logistic regression was employed to identify features associated with mortality, with mortality risk quantified as odds ratio (OR) and 95% confidence interval (CI). Additionally, the Boruta algorithm, a feature selection method based on random forests, was applied to assess feature importance through the use of shadow features and iterative processes (28). Lasso regression, a widely used embedded feature selection method, was also applied (29). To optimize the selection of features associated with mortality, the lambda value corresponding to the minimum mean squared error (lambda.min) was chosen as the regularization parameter.
Following feature selection, logistic regression was conducted to construct two predictive models: Model A, which included only clinical indicators, and Model B, which incorporated both clinical and blood indicators (Figure 1). The area under the curve (AUC), net reclassification improvement (NRI), and integrated discrimination improvement (IDI) were used to evaluate the incremental predictive value of incorporating additional indicators into the existing model (30). Receiver operating characteristic (ROC) curves were plotted to calculate the AUC, and the DeLong test was employed to compare the AUC differences between the two models. The “PredictABEL” package was utilized to compute and compare the NRI and IDI for both models.
All reported P-values were two-sided, and P < 0.05 was considered statistically significance. Statistical analyses were performed using R statistical software (version 4.2.2; R Project for Statistical Computing).
3 Results
3.1 Patient characteristics
A total of 1,881 older patients with hip fracture were included in this study, of whom 35.5% were male, with a median age of 80.0 years. The most common comorbidities were chronic pulmonary disease (21.6%), diabetes mellitus (21.4%), and cerebrovascular disease (12.7%). The characteristics of the patients are presented in Table 1. During the 90-day follow-up period, 217 deaths occurred, yielding a 90-day mortality rate of 11.5% (95% CI: 10.2–13.1%). Among these, 39 deaths (2.1%) were in-hospital, and 113 deaths (6.0%) occurred within 30 days of admission. Compared with the survival group, the deceased group was older, had a greater proportion of males and smokers, a higher CCI score, longer TTA, and lower BMI (all P < 0.05). However, marital status and fracture type approached but did not reach statistical significance (P > 0.05). Among the 47 blood indicators, 11 showed no statistically significant differences between groups, whereas the remaining indicators exhibited statistically significant differences.
TABLE 1
| Variables | All (n = 1881) |
Survival group (n = 1664) |
Deceased group (n = 217) |
P-value |
|---|---|---|---|---|
| Age, years | 80.0 (73.0, 85.0) | 79.0 (72.0, 85.0) | 84.0 (78.0, 87.0) | < 0.001 |
| Male, n (%) | 668 (35.5) | 568 (34.1) | 100 (46.1) | < 0.001 |
| BMI, Kg/m2 | 21.3 (19.1, 23.9) | 21.4 (19.1, 23.9) | 20.8 (18.7, 22.6) | 0.003 |
| Smoker, n (%) | 436 (23.2) | 369 (22.2) | 67 (30.9) | 0.006 |
| Widowed, n (%) | 507 (27.0) | 436 (26.2) | 71 (32.7) | 0.051 |
| CCI | 1.0 (0, 1.0) | 1.0 (0, 1.0) | 1.0 (1.0, 3.0) | < 0.001 |
| TTA, hours | 10.0 (3.0, 48.0) | 9.0 (3.0, 48.0) | 24.0 (5.0, 72.0) | 0.001 |
| Fracture type, n(%) | 0.091 | |||
| Femoral neck | 899 (47.8) | 807 (48.5) | 92 (42.4) | |
| Intertrochanteric | 982 (52.2) | 857 (51.5) | 125 (57.6) | |
| Blood indicators | ||||
| WBC, 109/L | 8.8 (6.8, 11.1) | 8.7 (6.8, 10.9) | 9.5 (6.6, 12.0) | 0.043 |
| Neutrophil, 109/L | 7.1 (5.2, 9.5) | 7.0 (5.2, 9.4) | 7.8 (5.2, 10.7) | 0.018 |
| Lymphocyte, 109/L | 0.9 (0.6, 1.2) | 0.9 (0.6, 1.2) | 0.7 (0.5, 0.9) | < 0.001 |
| Monocyte, 109/L | 0.5 (0.4, 0.7) | 0.5 (0.4, 0.7) | 0.6 (0.4, 0.8) | 0.027 |
| RBC, 109/L | 3.7 (3.3, 4.2) | 3.8 (3.3, 4.2) | 3.5 (2.9, 4.0) | < 0.001 |
| Hemoglobin, g/L | 112.0 (98.0, 125.0) | 113.0 (99.0, 126.0) | 103.0 (86.0, 121.0) | < 0.001 |
| Hematocrit,% | 34.7 (30.4, 38.5) | 35.0 (31.1, 38.7) | 31.9 (27.4, 36.9) | < 0.001 |
| MCV, fL | 93.6 (90.0, 97.3) | 93.5 (90.0, 97.2) | 94.1 (88.9, 97.4) | 0.791 |
| MCH, pg | 30.4 (28.9, 31.7) | 30.4 (29.0, 31.7) | 30.4 (28.6, 31.6) | 0.373 |
| MCHC, g/L | 323.0 (315.0, 331.0) | 324.0 (316.0, 332.0) | 322.0 (313.0, 330.0) | 0.026 |
| RDW-SD, fL | 46.8 (44.1, 50.3) | 46.7 (44.0, 49.8) | 48.7 (45.5, 52.8) | < 0.001 |
| RDW-CV,% | 13.8 (13.2, 14.7) | 13.8 (13.1, 14.6) | 14.4 (13.6, 15.6) | < 0.001 |
| Platelet, 109/L | 147.0 (108.0, 194.0) | 147.0 (108.0, 194.0) | 149.0 (108.0, 200.0) | 0.854 |
| Albumin, g/L | 38.9 (35.8, 41.9) | 39.2 (36.2, 42.1) | 36.5 (33.3, 39.3) | < 0.001 |
| Prealbumin, mg/L | 171.0 (130.9, 210.0) | 174.8 (135.2, 213.1) | 145.0 (111.0, 183.2) | < 0.001 |
| ALT, U/L | 16.0 (12.0, 23.0) | 16.0 (12.0, 23.0) | 16.0 (12.0, 23.0) | 0.604 |
| ALP, U/L | 84.0 (68.0, 103.0) | 83.0 (68.0, 102.0) | 89.0 (68.0, 117.0) | 0.013 |
| Creatinine, μmol/L | 67.0 (55.0, 87.0) | 65.0 (55.0, 83.3) | 86.3 (62.0, 128.6) | < 0.001 |
| BUN, mmol/L | 6.8 (5.3, 9.0) | 6.6 (5.2, 8.6) | 9.3 (6.8, 12.7) | < 0.001 |
| Uric acid, μmol/L | 284.0 (219.4, 367.0) | 279.0 (215.9, 360.0) | 315.7 (260.0, 433.3) | < 0.001 |
| Potassium, mmol/L | 3.9 (3.6, 4.2) | 3.9 (3.6, 4.2) | 4.0 (3.6, 4.4) | 0.004 |
| Sodium, mmol/L | 141.5 (139.1, 143.7) | 141.6 (139.3, 143.7) | 140.5 (137.6, 143.1) | < 0.001 |
| Calcium, mmol/L | 2.2 (2.0, 2.3) | 2.2 (2.1, 2.3) | 2.1 (2.0, 2.2) | < 0.001 |
| Glucose, mmol/L | 7.0 (5.9, 8.9) | 6.9 (5.8, 8.8) | 7.6 (6.1, 10.3) | < 0.001 |
| INR | 1.0 (1.0, 1.1) | 1.0 (1.0, 1.1) | 1.1 (1.0, 1.2) | < 0.001 |
| PT, s | 12.1 (11.5, 12.8) | 12.0 (11.5, 12.7) | 12.6 (11.7, 13.5) | < 0.001 |
| APTT, s | 27.7 (25.2, 30.9) | 27.6 (25.1, 30.6) | 28.9 (26.3, 32.7) | < 0.001 |
| Eosinophil, 109/L | 0.03 (0.01, 0.10) | 0.03 (0.01, 0.10) | 0.03 (0, 0.10) | 0.100 |
| Basophil, 109/L | 0.02 (0.01, 0.03) | 0.02 (0.01, 0.03) | 0.02 (0.01, 0.03) | 0.347 |
| MPV, fL | 12.0 (11.0, 13.0) | 12.0 (11.0, 13.0) | 11.8 (10.9, 12.9) | 0.023 |
| Plateletcrit | 0.2 (0.1, 0.2) | 0.2 (0.1, 0.2) | 0.2 (0.1, 0.2) | 0.524 |
| Fibrinogen, g/L | 3.3 (2.6, 4.1) | 3.2 (2.6, 4.1) | 3.5 (2.7, 4.5) | 0.006 |
| Thrombin time, s | 17.4 (16.3, 18.6) | 17.4 (16.2, 18.6) | 17.4 (16.4, 18.7) | 0.749 |
| AT-III,% | 86.5 (77.3, 96) | 86.7 (78.1, 96.3) | 83.2 (71.1, 92.9) | < 0.001 |
| β2-MG, mg/L | 2.7 (2.1, 3.7) | 2.6 (2.0, 3.5) | 3.8 (2.7, 6.3) | < 0.001 |
| ADA, U/L | 11.6 (8.7, 15.4) | 11.0 (8.6, 15.0) | 13.1 (9.7, 18.6) | < 0.001 |
| AST, U/L | 23.0 (19.0, 29.0) | 23.0 (19.0, 28.0) | 25.0 (19.0, 34.0) | 0.016 |
| TBA, μmol/L | 5.0 (2.9, 8.7) | 4.9 (2.9, 8.6) | 5.4 (3.3, 10.2) | 0.040 |
| D-BIL, μmol/L | 4.5 (3.0, 6.8) | 4.4 (3.0, 6.6) | 5.1 (3.3, 8.8) | < 0.001 |
| T-BIL, μmol/L | 14.7 (10.5, 20.2) | 14.7 (10.6, 20.1) | 15.2 (9.8, 21.8) | 0.508 |
| Globulin, g/L | 25.8 (22.7, 29.5) | 25.7 (22.6, 29.4) | 27.0 (23.2, 30.7) | 0.017 |
| Total protein, g/L | 65.2 ± 7.2 | 65.4 ± 7.1 | 63.7 ± 7.4 | 0.002 |
| AGR | 1.5 (1.3, 1.7) | 1.5 (1.3, 1.7) | 1.4 (1.1, 1.6) | < 0.001 |
| Mg, mmol/L | 0.9 (0.8, 0.9) | 0.9 (0.8, 0.9) | 0.9 (0.8, 0.9) | 0.336 |
| P, mmol/L | 0.9 (0.8, 1.1) | 0.9 (0.8, 1.1) | 1.0 (0.9, 1.2) | < 0.001 |
| Chloride, mmol/L | 104.1 (101.1, 106.9) | 104.1 (101.2, 106.8) | 103.4 (99.9, 107.2) | 0.090 |
| HCO3, mmol/L | 24.1 (21.7, 26.6) | 24.1 (21.8, 26.6) | 23.4 (20.5, 26.6) | 0.023 |
Comparison of patient characteristics between the survival and deceased groups.
Continuous variables are expressed as mean ± SD or median (IQR), and categorical variables are presented as numbers (%). Bold P-values denote significance.
3.2 Feature selection
After excluding 13 statistically non-significant variables (Table 1), Spearman correlation analysis was conducted on the remaining features. As shown in Figure 2, seven pairs of features exhibited strong correlations: WBC and neutrophil (ρ = 0.973), RBC and hemoglobin (ρ = 0.858), RBC and hematocrit (ρ = 0.893), hemoglobin and hematocrit (ρ = 0.976), INR and PT (ρ = 0.976), globulin and total protein (ρ = 0.767), globulin and AGR (ρ = −0.830). Accordingly, the five redundant features (neutrophil, RBC, hematocrit, INR and globulin) were excluded from further analysis.
FIGURE 2

Spearman correlation heatmap of predictive features. Blue shading indicates positive correlations, while red shading indicates negative correlations.
Subsequently, stepwise logistic regression identified 12 features significantly associated with mortality risk, including age, smoking status, CCI, WBC, lymphocyte, albumin, BUN, glucose, PT, β2-MG, ADA, and D-BIL (Table 2). Concurrently, the Boruta algorithm identified 25 important features, which were ranked in descending order of importance as follows: BUN, β2-MG, creatinine, D-BIL, hemoglobin, albumin, uric acid, prealbumin, calcium, PT, age, CCI, AGR, glucose, P, RDW-CV, HCO3, total protein, MCHC, lymphocyte, monocyte, RDW-SD, AST, ADA, and AT-III (Figure 3). Lasso regression analysis demonstrated that as the regularization parameter lambda increased, the regression coefficients were progressively compressed, with some eventually reaching zero (Figure 4A). The optimal lambda value, corresponding to the minimum mean squared error, was determined to be 0.0078 through five-fold cross-validation (Figure 4B). Consequently, 18 features with non-zero coefficients were selected, including age, sex, smoking, CCI, WBC, lymphocyte, RDW-CV, albumin, prealbumin, creatinine, BUN, glucose, PT, MPV, β2-MG, ADA, D-BIL, and P.
TABLE 2
| Variables | Univariate | Multivariate | ||
|---|---|---|---|---|
| OR (95% CI) | P-value | OR (95% CI) | P-value | |
| Age | 1.063 (1.044–1.083) | < 0.001 | 1.060 (1.037–1.083) | < 0.001 |
| Smoker | 1.568 (1.144–2.13) | 0.005 | 1.479 (1.039–2.088) | 0.028 |
| CCI | 1.491 (1.376–1.618) | < 0.001 | 1.230 (1.107−1.364) | < 0.001 |
| WBC | 1.045 (1.006–1.085) | 0.021 | 1.054 (1.010–1.099) | 0.015 |
| Lymphocyte | 0.383 (0.26–0.553) | < 0.001 | 0.583 (0.392–0.834) | 0.005 |
| Albumin | 0.877 (0.849–0.906) | < 0.001 | 0.895 (0.863–0.928) | < 0.001 |
| BUN | 1.143 (1.113–1.174) | < 0.001 | 1.069 (1.033–1.107) | < 0.001 |
| Glucose | 1.064 (1.034–1.095) | < 0.001 | 1.037 (1.000–1.074) | 0.044 |
| PT | 1.307 (1.203–1.428) | < 0.001 | 1.151 (1.045–1.262) | 0.003 |
| β2-MG | 1.156 (1.118–1.198) | < 0.001 | 1.042 (1.000−1.086) | 0.049 |
| ADA | 1.048 (1.03−1.066) | < 0.001 | 1.035 (1.013−1.057) | 0.001 |
| D-BIL | 1.071 (1.041−1.103) | < 0.001 | 1.046 (1.013−1.080) | 0.005 |
Feature selection for independent mortality predictors using stepwise logistic regression.
FIGURE 3

Feature selection results using the Boruta algorithm. Features are categorized based on their importance: important features (green), possibly important features (yellow), unimportant features (red), and shadow features (blue).
FIGURE 4

Lasso regression results. (A) The coefficient plot of the Lasso regression model, illustrating the trajectory of each predictor’s coefficient as the regularization parameter (lambda) increases. (B) The selection of the optimal lambda value through cross-validation, highlighting the point at which the model achieves the best balance between bias and variance, ensuring robust predictor selection.
3.3 Incremental predictive value of blood indicators
Following feature selection, two predictive models were developed: Model A (clinical indicators only) and Model B (both clinical and blood indicators, Table 3). As evaluated by ROC curve analysis, Model B exhibited significantly superior performance, with higher AUC values compared to Model A, regardless of whether blood indicators were selected using stepwise logistic regression (0.822 [0.794–0.849] vs. 0.753 [0.722–0.784], P < 0.001, Figure 5A), the Boruta algorithm (0.820 [0.792–0.848] vs. 0.749 [0.718–0.781], P < 0.001, Figure 5B), or Lasso regression (0.826 [0.799–0.853] vs. 0.756 [0.725–0.787], P < 0.001, Figure 5C). Furthermore, Model B significantly enhanced reclassification ability after incorporating blood indicators selected by three different methods: stepwise logistic regression (NRI: 0.733 [0.597–0.868], IDI: 0.107 [0.082–0.133]), the Boruta algorithm (NRI: 0.762 [0.629–0.895], IDI: 0.113 [0.086–0.140]), and Lasso regression (NRI: 0.725 [0.589–0.860], IDI: 0.112 [0.085–0.139]) (all P < 0.001, Table 3).
TABLE 3
| Feature selection methods | Feature subsets | NRI (95% CI) | IDI (95% CI) |
|---|---|---|---|
| Stepwise logistic regression | Model A: age, smoking, CCI Model B: Model A and WBC, lymphocyte, albumin, BUN, glucose, PT, β2-MG, ADA, D-BIL. |
0.733 (0.597–0.868) | 0.107 (0.082–0.133) |
| Boruta algorithm | Model A: age, CCI Model B: Model A and BUN, β2-MG, creatinine, D-BIL, hemoglobin, albumin, uric acid, prealbumin, calcium, PT, AGR, glucose, P, RDW-CV, HCO3, total protein, MCHC, lymphocyte, monocyte, RDW-SD, AST, ADA, AT-III. |
0.762 (0.629–0.895) | 0.113 (0.086–0.140) |
| Lasso regression | Model A: age, sex, smoking, CCI Model B: Model A and WBC, lymphocyte, RDW-CV, albumin, prealbumin, creatinine, BUN, glucose, PT, MPV, β2-MG, ADA, D-BIL, P. |
0.725 (0.589–0.860) | 0.112 (0.085–0.139) |
Comparison of NRI and IDI differences between model A (clinical indicators only) and model B (clinical and blood indicators) for predicting 90-day mortality.
FIGURE 5
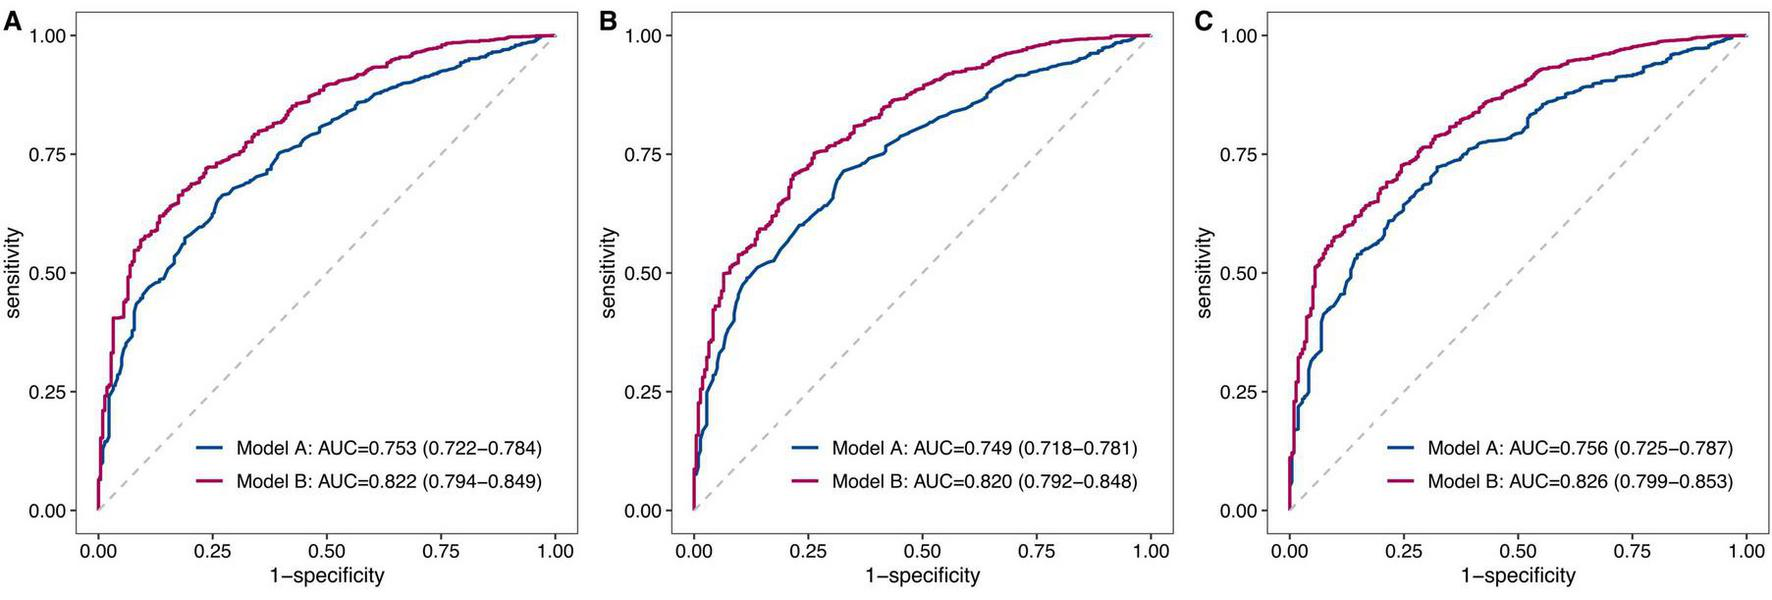
Comparative analysis of ROC curves between model A and model B. This figure presents a comparative analysis of the ROC curves for two predictive models: Model A, which includes only clinical indicators, and Model B, which incorporates both clinical and blood indicators. The analysis was conducted using three feature selection methods: stepwise logistic regression (A), the Boruta algorithm (B), and Lasso regression (C). In each figure, the red curve represents Model B, while the blue curve represents Model A. The AUC values were provided for each model, illustrating the discriminative ability of each model in predicting 90-day mortality.
4 Discussion
Hip fractures in the older adults are associated with high mortality rates, and numerous risk factors for short-term mortality have been reported in previous studies (4). This study systematically analyzed blood indicators available at the time of admission, and revealed significant associations between 25 blood indicators and 90-day mortality. Among these, eight blood indicators were consistently identified by stepwise logistic regression, the Boruta algorithm and Lasso regression, including lymphocyte, albumin, BUN, glucose, PT, β2-MG, ADA, and D-BIL. Four indicators were selected by two of the three methods: WBC, RDW-CV, prealbumin, and creatinine. By utilizing these blood indicators, clinicians can comprehensively and objectively evaluate the physiological status of hip fracture patients, including inflammation and immune function (WBC, lymphocyte, ADA), liver function (albumin, prealbumin, D-BIL), kidney function (BUN, creatinine, β2-MG), glucose metabolism (glucose), and coagulation function (PT).
Hip fracture trauma induces an acute inflammatory response, and age-related immune senescence may contribute to immune dysfunction and dysregulated inflammation in older patients (31, 32). Elevated WBC counts indicate a systemic inflammatory response that can lead to tissue damage and complications, whereas low lymphocyte counts suggest immunosuppression, which impairs the body’s ability to fight infections and promote healing. Previous studies have reported that WBC counts above the normal range were associated with a 1.139-fold increased risk of 30-day mortality in hip fracture patients (33), and a lymphocyte count < 1 × 10⁹/L was associated with a 1.728-fold increased risk of in-hospital mortality (16). ADA is a key enzyme in purine nucleoside metabolism, catalyzing the deamination of adenosine and deoxyadenosine, thereby attenuating the immunosuppressive effects of adenosine and playing a critical role in maintaining immune homeostasis (34). As shown in Table 2, each 1.0 U/L increment in serum ADA activity was associated with a 3.5% increase in the risk of 90-day mortality. To date, no studies have reported an association between ADA levels and mortality risk in hip fracture patients. However, ADA has been identified as a prognostic biomarker for severe fever with thrombocytopenia syndrome (35). Moreover, our previous studies have revealed that immune-inflammatory indicators, including the platelet-to-lymphocyte ratio (PLR) (20), systemic immune-inflammation index (SII) (21), systemic inflammation response index (SIRI) (22), and hemoglobin, albumin, lymphocyte and platelet (HALP) (23), were significantly associated with both short- and long-term mortality in hip fracture patients. It should be noted that our database did not include information regarding the presence of infections at the time of admission. Therefore, additional studies are needed to confirm the relationship between inflammatory markers and increased mortality risk in hip fracture patients.
Malnutrition is highly prevalent among older patients with hip fracture, with a systematic review reporting incidence rates of up to 39.4% (36). Serum ALB and prealbumin are widely used biomarkers for nutritional assessment, reflecting both nutritional status and hepatic protein synthesis capacity. Hypoalbuminemia is frequently associated with malnutrition, chronic inflammation, and liver dysfunction, all of which can adversely affect wound healing, immune function, and overall recovery, thereby increasing the risk of complications and poor outcomes in hip fracture patients. This study showed that each 1.0 g/L increase in ALB was associated with a 10.5% reduction in the risk of 90-day mortality. When ALB levels were dichotomized at a threshold of 35.0 g/L, patients with hypoalbuminemia exhibited a 1.78-fold higher mortality risk (37). Prealbumin, with its shorter half-life, more rapidly reflects short-term changes in nutritional status than other proteins such as albumin. Chen et al. (38) reported that prealbumin levels were independently associated with long-term mortality risk in 2,387 hip fracture patients with a mean follow-up of 37.6 months. In addition, D-BIL is a well-established biomarker for evaluating hepatic function, reflecting the liver’s ability for bilirubin metabolism. Elevated D-BIL levels typically signify impaired bilirubin conjugation and excretion, which are hallmarks of substantial liver dysfunction. In this study, we observed that each 1.0 μmol/L increase in D-BIL was associated with a 4.6% increase in the risk of 90-day mortality. Although no previous studies have specifically investigated the relationship between D-BIL levels and mortality risk in hip fracture patients, elevated D-BIL levels have been significantly associated with poor prognosis in other diseases, such as heart failure (39), and ischemic stroke (40).
In older adults, chronic kidney disease (CKD) disrupts bone and mineral metabolism and alters vitamin D metabolism, thereby exacerbating osteoporosis and increasing the risk of hip fractures (41). Meanwhile, impaired kidney function can lead to electrolyte imbalances and metabolic complications, which can further complicate recovery and increase mortality risk. Patients with CKD who experience a hip fracture faced a 2.17-fold higher mortality risk compared to those without CKD. This risk further increased to 6.21-fold in patients receiving peritoneal dialysis and 3.62-fold in those on hemodialysis (42). In clinical practice, BUN and creatinine are widely used biomarkers for assessing renal function. When BUN levels were ≥ 7.5 mmol/L, the risk of in-hospital mortality in hip fracture patients increased by 2.2-fold (43). Similarly, elevated creatinine levels (> 100 μmol/L) were associated with increased 30-day and 1-year mortality rates, with hazard ratios of 2.49 and 1.54, respectively (44). Moreover, β2-MG is a low-molecular-weight protein primarily produced by lymphocytes and other nucleated cells. Its clearance depends largely on the glomerular filtration rate, making it a sensitive marker of renal function. In this study, we found that each 1.0 mg/L increase in β2-MG levels was associated with a 4.2% increase in mortality risk, which has not been previously reported in the literature. In other diseases, elevated β2-MG levels have been shown to be associated with increased mortality risk, including cardiovascular and cerebrovascular diseases (coronary heart disease, stroke) (45), as well as chronic obstructive pulmonary disease (46).
Diabetes is highly prevalent among older adults, with a prevalence of 21.4% in our study. Hyperglycemia can induce osteoporosis and increase the risk of fragility fractures, while also lead to neuropathy and retinopathy, which may impair balance and gait, and thereby increase the risk of falls and hip fractures (47). Moreover, hyperglycemia can exacerbate inflammation, impair wound healing, and increase the risk of infections, all of which contribute to higher mortality rates. This study showed that for every 1.0 mmol/L increment in glucose, the risk of mortality increased by 3.7%. Consistent with this finding, previous studies have demonstrated that hip fracture patients with diabetes had a higher mortality risk compared to those without diabetes, regardless of the type of glycemic control therapy received (48).
Hip fracture patients often experience coagulation dysfunction due to traumatic stress, inflammatory response, and limited mobility (49). Coagulation abnormalities can manifest as hypercoagulable or hypocoagulable states. A hypercoagulable state increases the risk of thromboembolic events, such as deep vein thrombosis and pulmonary embolism, which contribute to morbidity and mortality. Conversely, a hypocoagulable state can lead to excessive bleeding, complicating surgical interventions and prolonging recovery. Both scenarios impair the body’s ability to manage the physiological stress of hip fracture and subsequent treatment, thereby increasing the risk of adverse outcomes. PT is a key indicator for assessing coagulation function. In the present study, each 1.0-second increase in PT was associated with a 15.1% elevation in the risk of short-term mortality. Asrian et al. (50) similarly reported that PT was a significant predictor of 1-year mortality in hip fracture patients. Additionally, other coagulation indicators, such as INR (17) and APTT (50), have been shown to be independently associated with mortality risk in these patients. It should be noted that our database lacked data on pre-admission anticoagulant therapy. Thus, future studies should explore the impact of pre-admission anticoagulant therapy on coagulation parameters among hip fracture patients to provide more conclusive evidences.
Based on clinical indicators such as age and CCI, this study further incorporated various blood indicators into the predictive models. The results showed significant enhancements in the models’ AUC, NRI and IDI, indicating that these blood indicators substantially improve the predictive performance of existing clinical models for assessing short-term mortality risk in hip fracture patients. As depicted in Figure 5, Model B achieved an AUC ranging from 0.820 to 0.826 after the inclusion of blood indicators selected by stepwise logistic regression, the Boruta algorithm, and Lasso regression. Similar findings were reported by Lu et al. (17), who developed a mortality prediction model for hip fracture patients using the Medical Information Mart for Intensive Care IV (MIMIC-IV) database. Their model incorporated one clinical feature (sepsis) and seven blood indicators (BUN, creatinine, MCH, MCV, INR, monocyte, neutrophil), attaining an AUC of 0.824 for predicting 30-day mortality. Another study constructed a nomogram model to predict postoperative mortality in hip fracture patients, integrating three blood indicators (albumin, sodium, hemoglobin) with age and CCI, and reported AUCs of 0.83, 0.79, and 0.77 for predicting mortality at 6 months, 1 year, and 3 years, respectively (37). Wang et al. (51) developed a predictive model for mortality following total hip arthroplasty in patients with femoral neck fracture. Their model incorporated three blood indicators (hemoglobin, creatinine, albumin) along with age, preoperative nutritional risk score, and ASA score, and obtained an AUC of 0.814.
This study has several strengths that contribute to its robustness and reliability. First, the continuous enrollment of patients over a period of more than 10 years minimizes selection bias and ensures a comprehensive representation of the patient population. This long-term enrollment period allows for a more accurate assessment of predictors of mortality in hip fracture patients. Second, we employed three distinct feature selection methods: stepwise logistic regression, the Boruta algorithm, and Lasso regression. This multi-method approach ensures a comprehensive and robust identification of predictors associated with 90-day mortality in hip fracture patients. Third, we included numerous clinical and blood indicators. This comprehensive approach allows for a thorough evaluation of the patients’ overall health status and mortality risk. By incorporating both clinical and biochemical data, we provide a more detailed understanding of the factors contributing to mortality in hip fracture patients.
However, this study also has certain limitations that should be acknowledged. First, the retrospective single-center design of this study inevitably restricts the external validity of the findings. Although cases were included consecutively, the potential for selection bias remains. Moreover, the data were derived from a single center in a predominantly Chinese population, which may limit the representativeness of the patient selection and the generalizability of the findings to other populations. Future multi-center prospective studies with more diverse and representative patient cohorts are needed to further validate our findings. Second, due to the limitations in data collection, some important variables were not available for analysis, such as the Abbreviated Mental Test Score (AMTS) in the NHFS, the Park Mobility Score in the AHFS. As a result, this study was unable to assess the added predictive value of blood indicators for these commonly used clinical models. Furthermore, potential missing data bias may have affected the results, as some important variables could not be obtained for all patients. Third, although the study encompassed a period of over 10 years, the sample size was relatively small, potentially limiting the statistical power of the analysis. Fourth, this study identified various blood indicators associated with 90-day mortality. However, the absence of a final predictive model limits the comprehensive evaluation of their predictive performance. Future studies should determine the optimal set of predictors to construct predictive models, incorporating calibration plot and the Hosmer-Lemeshow test to assess model fit. Additionally, the large number of variables identified may restrict their immediate applicability in clinical settings. Future studies should consider developing simplified models using fewer routinely available parameters to enhance their usability in daily practice.
5 Conclusion
This study identified various blood indicators associated with 90-day mortality in older patients with hip fracture. These indicators significantly enhanced the predictive ability of existing clinical models for short-term mortality risk. By utilizing these blood indicators, clinicians can comprehensively and objectively assess the physiological status of hip fracture patients at the time of admission, thereby facilitating the early identification of high-risk patients and guiding personalized treatment strategies.
Statements
Data availability statement
The raw data supporting the conclusions of this article will be made available by the authors, without undue reservation.
Ethics statement
The studies involving humans were approved by the Institutional Ethics Committee of Deyang People’s Hospital (No. 2022-04-040-K01). The studies were conducted in accordance with the local legislation and institutional requirements. The participants provided their written informed consent to participate in this study.
Author contributions
QZ: Data curation, Formal analysis, Writing – original draft. DZ: Data curation, Formal analysis, Writing – original draft. YW: Funding acquisition, Supervision, Writing – review & editing. XC: Conceptualization, Methodology, Writing – review & editing. ZW: Conceptualization, Funding acquisition, Methodology, Writing – review & editing.
Funding
The author(s) declare financial support was received for the research and/or publication of this article. This study has received funding by Scientific Research Project of Sichuan Health Information Association (2023024), Orthopedics (Shang Antong) Special Research Project of Sichuan Medical Association (2022SAT06 and 2024SAT20), and Deyang Science and Technology Bureau Project (2024SZY052).
Acknowledgments
We sincerely thank Yuhang Cai (Deyang People’s Hospital) for his assistance with data acquisition, curation, and follow-up of our institutional hip fracture database.
Conflict of interest
The authors declare that the research was conducted in the absence of any commercial or financial relationships that could be construed as a potential conflict of interest.
Generative AI statement
The author(s) declare that no Generative AI was used in the creation of this manuscript.
Any alternative text (alt text) provided alongside figures in this article has been generated by Frontiers with the support of artificial intelligence and reasonable efforts have been made to ensure accuracy, including review by the authors wherever possible. If you identify any issues, please contact us.
Publisher’s note
All claims expressed in this article are solely those of the authors and do not necessarily represent those of their affiliated organizations, or those of the publisher, the editors and the reviewers. Any product that may be evaluated in this article, or claim that may be made by its manufacturer, is not guaranteed or endorsed by the publisher.
References
1.
Feng J Zhang C Li B Zhan S Wang S Song C . Global burden of hip fracture: the Global Burden of Disease Study.Osteoporos Int. (2023) 35:41–52. 10.1007/s00198-023-06907-3
2.
Sing C Lin T Bartholomew S Bell J Bennett C Beyene K et al Global Epidemiology of Hip fractures: secular trends in incidence rate, post-fracture treatment, and all-cause mortality. J Bone Miner Res. (2023) 38:1064–75. 10.1002/jbmr.4821
3.
Harvey L Payne N Tan A Zhang J Lai Y Taylor M et al Variation in mortality following hip fracture across the Asia Pacific region: systematic review and proportional meta-analysis. Arch Gerontol Geriatr. (2024) 126:105519. 10.1016/j.archger.2024.105519
4.
Bui M Nijmeijer W Hegeman J Witteveen A Groothuis-Oudshoorn C . Systematic review and meta-analysis of preoperative predictors for early mortality following hip fracture surgery.Osteoporos Int. (2024) 35:561–74. 10.1007/s00198-023-06942-0
5.
Maxwell M Moran C Moppett I . Development and validation of a preoperative scoring system to predict 30 day mortality in patients undergoing hip fracture surgery.Br J Anaesth. (2008) 101:511–7. 10.1093/bja/aen236
6.
Nijmeijer W Folbert E Vermeer M Slaets J Hegeman J . Prediction of early mortality following hip fracture surgery in frail elderly: the Almelo hip fracture score (AHFS).Injury. (2016) 47:2138–43. 10.1016/j.injury.2016.07.022
7.
Jiang H Majumdar S Dick D Moreau M Raso J Otto D et al Development and initial validation of a risk score for predicting in-hospital and 1-year mortality in patients with hip fractures. J Bone Miner Res. (2005) 20:494–500. 10.1359/JBMR.041133
8.
Holt G Smith R Duncan K Finlayson D Gregori A . Early mortality after surgical fixation of hip fractures in the elderly: an analysis of data from the scottish hip fracture audit.J Bone Joint Surg Br. (2008) 90:1357–63. 10.1302/0301-620X.90B10.21328
9.
Charlson M Pompei P Ales K MacKenzie CR . A new method of classifying prognostic comorbidity in longitudinal studies: development and validation.J Chronic Dis. (1987) 40:373–83. 10.1016/0021-9681(87)90171-8
10.
Haugan K Klaksvik J Foss O . 30-day mortality in patients after hip fracture surgery: a comparison of the Charlson Comorbidity Index score and ASA score used in two prediction models.Injury. (2021) 52:2379–83. 10.1016/j.injury.2021.02.004
11.
Bilimoria K Liu Y Paruch J Zhou L Kmiecik T Ko C et al Development and evaluation of the universal ACS NSQIP surgical risk calculator: a decision aid and informed consent tool for patients and surgeons. J Am Coll Surg. (2013) 217:833–42.e1-3. 10.1016/j.jamcollsurg.2013.07.385
12.
Karres J Heesakkers N Ultee J Vrouenraets B . Predicting 30-day mortality following hip fracture surgery: evaluation of six risk prediction models.Injury. (2015) 46:371–7. 10.1016/j.injury.2014.11.004
13.
Marufu T Mannings A Moppett I . Risk scoring models for predicting peri-operative morbidity and mortality in people with fragility hip fractures: qualitative systematic review.Injury. (2015) 46:2325–34. 10.1016/j.injury.2015.10.025
14.
Yang G Cui G Liu Y Guo J Yue C . O-POSSUM and P-POSSUM as predictors of morbidity and mortality in older patients after hip fracture surgery: a meta-analysis.Arch Orthop Trauma Surg. (2023) 143:6837–47. 10.1007/s00402-023-04897-9
15.
Zhang B Wang J Wen P Wu Y Guo J Wang Y et al The association between hemoglobin at admission and mortality of older patients with hip fracture: a mean 3-year follow-up cohort study. Eur Geriatr Med. (2023) 14:275–84. 10.1007/s41999-023-00759-0
16.
Geleit R Bence M Samouel P Craik J . Biomarkers as predictors of inpatient mortality in fractured neck of femur patients.Arch Gerontol Geriatr. (2023) 111:105004. 10.1016/j.archger.2023.105004
17.
Lu Y Chen W Guo Y Wang Y Wang L Zhang Y . Risk factors for short-term mortality in elderly hip fracture patients with complicated heart failure in the ICU: a MIMIC-IV database analysis using nomogram.J Orthop Surg Res. (2023) 18:829. 10.1186/s13018-023-04258-7
18.
Thomas B Bajada S Williams R . Albumin is an independent predictor of up to 9-year mortality for intracapsular femoral neck fractures aiding in decision-making for total hip arthroplasty or hemiarthroplasty.J Arthroplasty. (2023) 38:135–40. 10.1016/j.arth.2022.08.015
19.
Stanley C Lennon D Moran C Vasireddy A Rowan F . Risk scoring models for patients with proximal femur fractures: qualitative systematic review assessing 30-day mortality and ease of use.Injury. (2023) 54:111017. 10.1016/j.injury.2023.111017
20.
Wang Z Wang H Yang L Jiang W Chen X Liu Y . High platelet-to-lymphocyte ratio predicts poor survival of elderly patients with hip fracture.Int Orthop. (2021) 45:13–21. 10.1007/s00264-020-04833-1
21.
Wang Z Jiang W Chen X Yang L Wang H Liu Y . Systemic immune-inflammation index independently predicts poor survival of older adults with hip fracture: a prospective cohort study.BMC Geriatr. (2021) 21:155. 10.1186/s12877-021-02102-3
22.
Fang Z Gao B Wang Z Chen X Liu M . Association of systemic inflammation response index with mortality risk in older patients with hip fracture: a 10-year retrospective cohort study.Front Med. (2024) 11:1401443. 10.3389/fmed.2024.1401443
23.
Wang Z Liu H Liu M . The hemoglobin, albumin, lymphocyte, and platelet score as a useful predictor for mortality in older patients with hip fracture.Front Med. (2025) 12:1450818. 10.3389/fmed.2025.1450818
24.
Mohd Pauzi N Wah Y Deni S Abdul Rahim A . Comparison of single and MICE imputation methods for missing values: a simulation study.Pertanika J Sci Technol. (2021) 29:979–98. 10.47836/pjst.29.2.15
25.
Zhang B Xu S Yang Z Xu P . Early admission is better-the time to admission (TTA) is associated with one-year mortality in hip fracture.Int J Surg. (2024) 110:7880–8. 10.1097/JS9.0000000000001835
26.
McHugh M Wilson J Schaffer N Olsen E Perdue A Ahn J et al Preoperative comorbidities associated with early mortality in hip fracture patients: a multicenter study. J Am Acad Orthop Surg. (2023) 31:81–6. 10.5435/JAAOS-D-21-01055
27.
Li J Guo S Ma R He J Zhang X Rui D et al Comparison of the effects of imputation methods for missing data in predictive modelling of cohort study datasets. BMC Med Res Methodol. (2024) 24:41. 10.1186/s12874-024-02173-x
28.
Acharjee A Larkman J Xu Y Cardoso V Gkoutos GV . A random forest based biomarker discovery and power analysis framework for diagnostics research.BMC Med Genomics. (2020) 13:178. 10.1186/s12920-020-00826-6
29.
Greenwood C Youssef G Letcher P Macdonald J Hagg L Sanson A et al A comparison of penalised regression methods for informing the selection of predictive markers. PLoS One. (2020) 15:e0242730. 10.1371/journal.pone.0242730
30.
Wang Z Cheng Y Seaberg E Becker J . Quantifying diagnostic accuracy improvement of new biomarkers for competing risk outcomes.Biostatistics. (2020) 23:666–82. 10.1093/biostatistics/kxaa048
31.
Lu Y Wang L Zhang Y . The promising roles of macrophages in geriatric hip fracture.Front Cell Dev Biol. (2022) 10:962990. 10.3389/fcell.2022.962990
32.
Lu Y Luo Y Zhang Q Chen W Zhang N Wang L et al Decoding the immune landscape following hip fracture in elderly patients: unveiling temporal dynamics through single-cell RNA sequencing. Immun Ageing. (2023) 20:54. 10.1186/s12979-023-00380-6
33.
Chen X Zhang J Lin Y Liu Z Sun T Wang X . Risk factors for postoperative mortality at 30 days in elderly Chinese patients with hip fractures.Osteoporos Int. (2022) 33:1109–16. 10.1007/s00198-021-06257-y
34.
Gao Z Wang X Zhang H Lin F Liu C Dong K . The roles of adenosine deaminase in autoimmune diseases.Autoimmun Rev. (2021) 20:102709. 10.1016/j.autrev.2020.102709
35.
Ye H Lin X Zhang Z Xu Z Huang T Cai S et al Adenosine deaminase as a potential diagnostic and prognostic biomarker for severe fever with thrombocytopenia syndrome. ACS Omega. (2024) 9:11005–11. 10.1021/acsomega.4c00281
36.
Foo M Wong G Lew CCH . A systematic review of the malnutrition prevalence in hospitalized hip fracture patients and its associated outcomes.JPEN J Parenter Enteral Nutr. (2021) 45:1141–52. 10.1002/jpen.2211
37.
Pan L Ning T Wu H Liu H Wang H Li X et al Prognostic nomogram for risk of mortality after hip fracture surgery in geriatrics. Injury. (2022) 53:1484–9. 10.1016/j.injury.2022.01.029
38.
Chen S Zhang B Zhang Y . The association between prealbumin concentration at admission and mortality in elderly patients with hip fractures: a cohort study.Arch Osteoporos. (2024) 19:27. 10.1007/s11657-024-01384-5
39.
Noda T Kamiya K Hamazaki N Nozaki K Ichikawa T Yamashita M et al Prognostic value of liver damage assessed through direct bilirubin levels and skeletal muscle weakness in patients with heart failure. Heart Lung. (2023) 60:87–94. 10.1016/j.hrtlng.2023.03.001
40.
Mahadevan A Krishnakumar M Pinnamaneni M Desai R . Serum direct bilirubin as a prognostic marker for short-term ischemic stroke morbidity and mortality: pooled analysis of cohort studies.J Neurol Sci. (2024) 463:123120. 10.1016/j.jns.2024.123120
41.
Kim S Yi S Yi J Kim Y Won Y . Chronic kidney disease increases the risk of hip fracture: a prospective cohort study in Korean adults.J Bone Miner Res. (2020) 35:1313–21. 10.1002/jbmr.3997
42.
Jang Y Kim H Kim S Park Y Yun I Park E et al Effect of chronic kidney disease on all-cause mortality after hip fracture surgery: a retrospective cohort study. Calcif Tissue Int. (2024) 115:150–9. 10.1007/s00223-024-01238-9
43.
Fisher A Srikusalanukul W Fisher L Smith P . Comparison of prognostic value of 10 biochemical indices at admission for prediction postoperative myocardial injury and hospital mortality in patients with osteoporotic hip fracture.J Clin Med. (2022) 11:6784. 10.3390/jcm11226784
44.
Frandsen C Glassou E Stilling M Hansen T . Malnutrition, poor function and comorbidities predict mortality up to one year after hip fracture: a cohort study of 2800 patients.Eur Geriatr Med. (2022) 13:433–43. 10.1007/s41999-021-00598-x
45.
Shi F Sun L Kaptoge S . Association of beta-2-microglobulin and cardiovascular events and mortality: a systematic review and meta-analysis.Atherosclerosis. (2021) 320:70–8. 10.1016/j.atherosclerosis.2021.01.018
46.
Mao W Wang J Zhang L Wang Y Wang W Zeng N et al Serum β2-microglobulin is associated with mortality in hospitalized patients with exacerbated chronic obstructive pulmonary disease. Int J Chron Obstruct Pulmon Dis. (2020) 15:723–32. 10.2147/COPD.S243905
47.
Emanuelsson F Afzal S Jørgensen N Nordestgaard B Benn M . Hyperglycaemia, diabetes and risk of fragility fractures: observational and Mendelian randomisation studies.Diabetologia. (2024) 67:301–11. 10.1007/s00125-023-06054-8
48.
Behanova M Haschka J Zwerina J Wascher T Reichardt B Klaushofer K et al The doubled burden of diabetic bone disease: hip fracture and post-hip fracture mortality. Eur J Endocrinol. (2021) 184:627–36. 10.1530/EJE-20-1155
49.
Tsantes A Trikoupis I Papadopoulos D Tsante K Mavrogenis A Koulouvaris P et al Higher coagulation activity in hip fracture patients: a case-control study using rotational thromboelastometry. Int J Lab Hematol. (2021) 43:477–84. 10.1111/ijlh.13409
50.
Asrian G Suri A Rajapakse C . Machine learning-based mortality prediction in hip fracture patients using biomarkers.J Orthop Res. (2024) 42:395–403. 10.1002/jor.25675
51.
Wang Z Zhang L Zeng X Nie P Wang M Xiong Y et al The nomogram model and factors for the postoperative mortality of elderly patients with femoral neck fracture undergoing artificial hip arthroplasty: a single-institution 6-year experience. Orthop Surg. (2024) 16:391–400. 10.1111/os.13944
Summary
Keywords
hip fracture, mortality, blood indicator, predictive value, older adult
Citation
Zhou Q, Zhang D, Wu Y, Chen X and Wang Z (2025) Blood indicators for short-term mortality risk in older patients with hip fracture: association and predictive value. Front. Med. 12:1684738. doi: 10.3389/fmed.2025.1684738
Received
13 August 2025
Revised
27 October 2025
Accepted
12 November 2025
Published
27 November 2025
Volume
12 - 2025
Edited by
Mario Salazar-Paramo, University of Guadalajara, Mexico
Reviewed by
Alparslan Yurtbay, Samsun University, Türkiye
Montserrat Barcelo, Autonomous University of Barcelona, Spain
Updates
Copyright
© 2025 Zhou, Zhang, Wu, Chen and Wang.
This is an open-access article distributed under the terms of the Creative Commons Attribution License (CC BY). The use, distribution or reproduction in other forums is permitted, provided the original author(s) and the copyright owner(s) are credited and that the original publication in this journal is cited, in accordance with accepted academic practice. No use, distribution or reproduction is permitted which does not comply with these terms.
*Correspondence: Xi Chen, chenxidoctor@163.comZhicong Wang, wangzcong@hotmail.com
†These authors have contributed equally to this work and share first authorship
Disclaimer
All claims expressed in this article are solely those of the authors and do not necessarily represent those of their affiliated organizations, or those of the publisher, the editors and the reviewers. Any product that may be evaluated in this article or claim that may be made by its manufacturer is not guaranteed or endorsed by the publisher.