Abstract
The assessment and treatment of chronic pain rely heavily on patient self-report, making linguistically and culturally appropriate tools essential. However, no well-validated Arabic language measures of pain-related disability are widely available. The objective of this study was to create and validate a Modern Standard Arabic (MSA) version of the Pain Disability Index (PDI). This prospective cross-sectional study was conducted in a pain management clinic in a tertiary care center in the United Arab Emirates (UAE). The MSA PDI was developed using a forward–backward translation protocol by a team of native Arabic speakers from diverse backgrounds, reviewed by a professional translation company, and pilot-tested with a small sample of patients. Participants completed the MSA PDI along with measures of depression (PHQ-8), anxiety (GAD-7), and current pain severity. A total of 423 Arabic-speaking adults participated (54.84%) women, mean age of 43.71 ± 13.53, most of whom were UAE nationals (88.41%). The mean PDI score was 31.29 (±17.64), indicating moderate pain-related disability. Over half of the sample met screening thresholds for moderate to severe pain (50.83%), depression (57.21%), or anxiety (38.77%). Factor analysis of the MSA PDI supported a unidimensional structure. The MSA PDI also demonstrated excellent internal consistency (α = .91). Construct validity was supported through a tiered multi-method approach (correlation, regression, and structural equation modeling), which showed moderate positive associations between pain severity, depression, anxiety, and pain-related disability. Overall, the MSA PDI showed strong psychometric properties and provides a reliable, standardized tool for assessing pain-related disability in Arabic-speaking populations.
Introduction
Chronic pain (CP) significantly affects individuals’ physical, psychological, and social wellbeing, and is a recognized global health concern (1). While data from the Arab world are limited, one large-scale study (n = 24,265) from Saudi Arabia found that 46.4% of respondents reported chronic pain (2).
The assessment and treatment of chronic pain rely heavily on patient self-report (3), underscoring the need for linguistically and culturally appropriate tools. In multilingual and multicultural settings, language barriers have been shown to negatively influence pain assessment, treatment outcomes, and patient satisfaction. In one study, native Swedish-speaking patients were asked to complete the McGill pain questionnaire (4) in a second language (Finnish), followed by Swedish (5). There were significant discrepancies between responses on the two versions of the McGill, in particular, the affective dimensions of pain. The severity of the mismatch was linked to the patients’ self-rated Finnish proficiency, with higher levels of discordance found in respondents less confident in their Finnish abilities (5). Similarly, another study found that Finnish-speaking patients not only rated their pain as more severe when treated by physicians with lower Finnish language proficiency (6), but also reported lower satisfaction and treatment adherence (6). In the United States, similar studies have focused on native Spanish speakers. One study of children hospitalized postoperatively showed that children with parents with limited English received fewer pain assessments and were less likely to be given opioids, even with similar pain severity ratings (7). Reducing language barriers has been shown to improve care. For example, Spanish-speaking patients provided with consistent access to professional medical interpreters reported better pain control and greater satisfaction with care (8).
Pain-related functional impairment is recommended by the Initiative on Methods, Measurement, and Pain Assessment in Clinical Trials (IMMPACT) as a domain for both research and clinical practice (3). Both patients (9, 10) and physicians (10) prioritize improvements in function as a treatment goal, with some evidence suggesting patients value improved functioning even more than pain relief (11). While pain severity is a reliable predictor of pain-related disability (12, 13), the relationship is modest (14), suggesting additional contributing factors. Psychological variables, such as depression and anxiety that are frequently comorbid with chronic pain, are associated with greater pain severity, increased disability, and lower quality of life (15). Psychological distress may even act as a mechanism through which pain becomes persistent and disabling. Hall et al. (16) found that depression and stress explained 30% of the link between subacute low back pain and later disability.
To date, no widely validated Arabic-language tools exist for assessing pain-related disability. This gap is notable, as Arabic is spoken by ~332 million people in 24 countries (17). In the United States alone, more than 1.4 million people speak Arabic at home (18). The Pain Disability Index (PDI) holds promise as a potential measure to bridge this gap. The PDI is a reliable and valid self-report tool that assesses the impact of chronic pain on daily functioning and quality of life (19). It is valued in clinical and research settings for its simplicity, ability to cover multiple domains of daily life, and patient-friendly format. The PDI has demonstrated strong internal reliability and validity across various populations. It has also been successfully translated into Japanese (20), French Canadian (21), Dutch (22, 23), Turkish (24), supporting the PDI’s conceptual robustness across cultures and languages and potential for Arabic translation.
Specific aims and hypotheses
This study had two primary aims: (1) to translate the PDI into Modern Standard Arabic (MSA) and (2) to evaluate the psychometric properties of the Arabic PDI, including internal consistency, factor structure, and construct validity.
Our translation process followed a rigorous cross-cultural adaptation process using established guidelines for translation of self-report measures (25, 26). MSA, the formal version of Arabic used in education, government, and healthcare settings across the Arab world, was selected due to its broad comprehension and utility (27). Unlike regional dialects, MSA is universally understood, making it a suitable choice for cross-national use.
Construct validity was explored by examining the relationships of the MSA PDI with other core outcomes recommended by IMMPACT, namely pain severity and emotional functioning (3). Pain severity was captured using a numeric rating scale, and emotional functioning was determined by using Arabic language measures of depression and anxiety. It was hypothesized that MSA PDI would be a reliable, valid measure, and that consistent with previous research, PDI scores would be at least moderately positively associated [r ≥ .30, per Cohen’s conventions (28)] with pain severity, depression, and anxiety.
Materials and methods
Study design and procedure
This was a prospective cross-sectional study conducted in an outpatient pain management clinic in a tertiary care facility in the United Arab Emirates (Cleveland Clinic Abu Dhabi) between February 2023 and June 2024. While English is the operational language of the hospital, the majority of patients are native Arabic speakers with varying degrees of English proficiency. Non-Arabic-speaking clinicians are supported on-site by professional medical translators.
Potentially eligible patients were identified via review of the electronic medical record (EMR) and were then approached by study staff before or after routine clinic visits. Participants completed informed consent procedures and then were asked to complete three paper-and-pencil measures in Arabic, including the MSA PDI, depression, and anxiety. Measurement of current pain severity was extracted from the EMR as it is a routine standard of care for all clinic visits. Demographic information was extracted either verbally from the patient or from the electronic health record.
Ethics
This study was approved by the Cleveland Clinic Abu Dhabi IRB. All participants provided written informed consent.
Participants
Patients were eligible to participate if they (a) were native Arabic speakers (b) ≥ 18 years of age, and (c) had chronic non-cancer pain lasting longer than 3 months. Patients who were not literate or not able to give informed consent were not eligible for participation in the study; our screening did not identify and exclude any such patients.
Study staff identified 455 potential participants; 26 did not provide informed consent, and six of those identified were determined not to meet the inclusion criteria (cancer pain or acute pain). A total of 423 were enrolled in the study. Participants were 54.84% female (n = 232), 62.64% (n = 265) married, with a mean age of 43.71(SD = 13.53). The majority (88.41%, n = 374) were nationals of the UAE. Tables 1, 2 provide detailed demographics.
Table 1
| Demographics | |
|---|---|
| Age | |
| Mean (SD) = 43.71 (13.53) | Range = 18, 84 |
| Gender %, (n) | |
| Female | 54.85 (232) |
| Male | 45.15 (191) |
| Marital Status %, (n) | |
| Married | 62.65 (265) |
| Single | 30.02 (127) |
| Divorced | 4.49 (19) |
| Unknown | 1.65 (7) |
| Widowed | 0.95 (4) |
| Separated | 0.24 (1) |
Participant demographics.
Table 2
| Region | Number of participants |
|---|---|
| GCC countries | 380 |
| United Arab Emirates | 374 |
| Kuwait & Oman | 2 ea |
| Kingdom of Saudi Arabia & Qatar | 1 ea |
| Other MENA | 39 |
| Jordan | 11 |
| Egypt | 7 |
| Palestine, Syria, & Yemen | 4 ea |
| Iran, Lebanon, & Morocco | 2 ea |
| Iraq, Somalia & Sudan | 1 ea |
| Outside MENA | 4 |
| United Kingdom | 2 |
| Canada & Pakistan | 1 ea |
Participant nationalities.
GCC, Gulf Corporation Council; MENA, Middle East North Africa; ea, each.
Measures
Pain-related functional impairment
The PDI is a self-report measure assessing pain’s interference with daily functioning across seven different domains: family responsibilities, recreation, social activity, occupation, sexual behavior, self-care, and life-support activities. Each item is rated on an 11-point scale of 0 (“no disability”) to 10 (“total disability”), with anchors at 3 (“mild disability”), 5 (“moderate disability”), and 8 (“severe disability”). Total scores range from 0 to 70; higher scores indicate greater impairment (19, 29). As there are no empirically driven established cut points for the PDI, we used a straightforward rubric commonly used by clinicians: 0–10 (minimal), 11–20 (mild), 21–30 (mild–moderate), 31–40 (moderate), 41–50 (moderate–severe), 51–60 (severe), and 61 + profound. The PDI is available in the public domain. The PDI has been demonstrated to be both a reliable and valid measure (19, 29, 30). Further, it has been successfully used to evaluate pain-related functional impairment across a wide range of painful conditions, such as acute low back pain (13), and chronic back pain (13, 31, 32), musculoskeletal pain disorders (22), widespread pain (13), breast cancer patients (23), and patients with painful rheumatological disease (24).
Translation protocol
Permission to translate the PDI (19) was sought and obtained from the original authors (personal correspondence). The PDI was translated using a forward and backward translation protocol (25, 26), consistent with the COSMIN (consensus-based standards for the selection of health measurement instruments) guidelines (33). Our translation team consisted of native Arabic speakers, with origins in Egypt, Syria, and the United Arab Emirates (UAE), including a physician, a professor, and administrative professionals. The team was selected to ensure linguistic and cultural diversity and to ensure the applicability of the measure across Arabic-speaking populations. The professor, who oversaw the team, has specialized expertise in Arabic psycholinguistics and professional experience in the translation of educational, medical, and therapeutic materials.
First, two independent translators translated the original PDI into Arabic. Discrepancies were reconciled to form a single forward translation. This version was then back-translated into English by two additional translators. The translation team reviewed and reconciled any inconsistencies. As a final step, the resulting Arabic translation was reviewed by an institution-approved professional translation company, in accordance with hospital policy. Minor grammatical revisions were proposed and were acceptable to the team. The edits simplified the reading level of the measure without altering its conceptual content. These edits are detailed in Appendix 1.
The measure was pilot-tested with a small sample (n = 30) of patients, following COSMIN recommendations to evaluate the resulting measure from the perspective of the target population (33). No concerns were raised, and no additional changes were made. Appendix 2 contains the resulting Modern Standard Arabic Pain Disability Index.
Pain severity
Participants verbally rated current pain intensity on an 11-point numeric rating scale ranging from 0 (“no pain”) to 10 (“worst imaginable pain”) (34). Clinical cutoffs of ≤5, 6–7, and 8 + were used to represent mild, moderate, and severe pain (35).
Depression
Depression was measured using a publicly available eight-item Arabic version of the nine-item Patient Health Questionnaire (PHQ-8) (36–38), developed by Pfizer.1 The PHQ-9 is a widely used self-report tool based on the DSM-IV criteria (39) for major depression (36–38). The sensitivity and specificity of the PHQ-8 are comparable to the original PHQ-9 (36, 40). Respondents are asked to rate the frequency of depressive symptoms over the past 2 weeks on a scale of 0 “not at all” to 3 “every day.” Cutoffs of 5, 10, 15, and 20 correspond to mild, moderate, moderately-severe, and severe depression, respectively. A score ≥ 10 is used as a screening threshold for depression (38).
Anxiety
Anxiety was measured using the Arabic version of the Generalized Anxiety Disorder scale (GAD-7) (41) developed by Pfizer and publicly available (see text footnote 1). The GAD-7 is based on DSM-IV criteria for generalized anxiety (39). Respondents are asked to rate the frequency of anxiety symptoms over the past 2 weeks on a scale of 0 “not at all” to 3 “nearly every day.” Total scores range from 0 to 21, with cut-offs of 5, 10, and 15 corresponding to mild, moderate, and severe anxiety, respectively. A score ≥10 has a sensitivity of 89% and a specificity of 82% for generalized anxiety disorder (41).
Results
Data analysis
Analyses were conducted in R (version 4.5.0) (42). Full code and output (Appendices 2–6) are available on the OSF platform.2
Factor structure
Assessment of structural validity was conducted using both exploratory and confirmatory factor analysis (EFA and CFA), in line with COSMIN guidelines (33). Due to sample size, EFA and CFA were both conducted using the entire dataset rather than using a split sample approach. The loss in statistical power outweighed the methodological benefit of the split-sample approach for several reasons. First, utilizing the entire dataset approach for both EFA and CFA allowed for ample power to detect misspecification and provide stable parameter estimates. This is essential given that MLR estimation requires larger samples for robust standard errors. Second, the use of FIML to handle missing data further reduces the effective sample size. Finally, we also conducted a split-sample analysis, which confirmed the 1-factor structure reported below. The original unsplit- and the split-sample analyses code and output are available, as in appendices on the OSF platform referenced above.
The suitability of the dataset for factor analysis was assessed using Bartlett’s Test of Sphericity and the Kaiser–Meyer–Olkin (KMO) Measure of Sampling Adequacy (43, 44). Both EFA and CFA were conducted using maximum likelihood (ML) extraction. Missing data were handled using full information maximum likelihood (FIML) estimation, which allows all available data to contribute to parameter estimation without imputation. Missing data were estimated using a saturated model fitted using the Lavaan package in R (45). A correlation matrix based on FIML was extracted and examined.
For EFA, model suitability was examined using the sum of squared loadings (SS loadings), which indicate the proportion of variance explained by each factor. EFA and CFA model fit was evaluated using chi-square (χ2), the Tucker–Lewis Index (TLI), root mean square error of approximation (RMSEA), and standardized root mean square residual (SRMR). Fit was interpreted using standard guidelines: RMSEA < 0.05 indicates close fit, 0.05–0.08 acceptable fit, 0.08–0.10 mediocre fit, and > 0.10 poor fit; TLI ≥ 0.95 indicates strong fit; SRMR < 0.08 indicates good fit; and χ2/df < 3 is acceptable (46, 47).
EFA was conducted for both one-factor and two-factor models, as prior research supports both structures (19, 30). As the two-factor solution showed poor fit, CFA was conducted with a one-factor model.
Reliability
Internal consistency reliability was assessed using Cronbach’s alpha and composite reliability (CR), post confirmation of factor structure (33). Cronbach’s alpha was used to evaluate internal consistency, with values ≥ 0.70 considered acceptable (33). CR was computed using standardized factor loadings from the confirmatory factor analysis (CFA) in order to provide a more precise reliability estimate accounting for item-level contributions.
Construct validity
Construct validity was evaluated by examining the relationships between pain disability and three theoretically related constructs (pain severity, depression, and anxiety) using a multi-method, three-step analytic approach. Our a priori hypotheses regarding these relationships [as per COSMIN guidelines (33)] were that pain-related disability would be at least moderately positively associated (r ≥ .30) with pain severity, depression, and anxiety.
Convergent validity. To test these hypotheses, we first assessed convergent validity by computing bivariate correlations between total MSA PDI scores and all three constructs. Next, three simple linear regression models were used to assess the predictive value of each construct for total PDI scores. Finally, structural equation modeling (SEM) was used to more rigorously assess these relationships while accounting for measurement error. SEM was conducted for depression and anxiety, as both were measured using multi-item scales (PHQ-8 and GAD-7) and therefore could be modeled as latent variables. Pain disability was modeled as a latent construct using all seven items as indicators. Pain severity was examined only using correlation and regression, as it was assessed with a single item.
For the linear regressions, assumptions of linearity, normality, and homoscedasticity were assessed via residual plots. SEM models were estimated using FIML to handle missing data and the robust maximum likelihood estimator (MLR) to account for non-normality. Model fit was evaluated using the same indices and interpretive criteria described in the factor structure analysis: χ2 , TLI, RMSEA, and SRMR. This tiered analytic strategy provided evidence for construct validity across progressively more complex statistical models.
Known groups analyses. Known-groups analyses (Appendix 3, Known Groups Contrasts) were used to examine the extent to which PDI scores corresponded with established clinical cutoffs for pain severity, depression, and anxiety using t-tests. The Shapiro–Wilk test was used to examine the assumption of normality, and Levene’s test was used to examine the assumption of equal variances.
Descriptive statistics
There were 361 cases (85.34%) with complete data across all seven PDI items. Missing values across items were as follows: 0.95% (items 1, 6) to 10.40% (n = 44, item 5). The PDI was scored if 6 of 7 values were present. Participants who did not answer item 5 were more likely to be female than other participants who completed the item (83.36% vs. 51.19%, p < .001) and less likely to be partnered (e.g., single, divorced, or widowed; 27.27% versus 66.75%, p < .001). There were no significant differences in median age or mean depression, anxiety, or pain disability index scores.
Scores reflected a wide range of pain-related disability, pain severity, and psychological distress. Mean total PDI score was 31.29 (± 17.64, n = 422), consistent with moderate pain-related disability. Mean pain severity was 6.29 (± 6.27); 50.83% (n = 215) of participants reported moderate–severe pain (scores ≥ 6). Mean PHQ score was 11.21 (± 6.21); 57.21% (n = 242) attained scores consistent with major depression. Mean total GAD score was 9.58 (± 6.01); 38.77% (n = 164) attained scores predicting generalized anxiety disorder. In total, 63.59% (n = 269) of participants scored above screening thresholds (≥ 10) for either construct. Descriptive statistics are available in Table 3.
Table 3
| Mean (SD) | Range | n | |
|---|---|---|---|
| Duration of pain (yrs) | 4.65 (5.19) | 0.25, 40 | 423 |
| Pain severity | 6.29 (2.31) | 0, 10 | 422 |
| Pain related disability | 31.29 (17.64) | 0, 70 | 419 |
| Depression | 11.21 (6.21) | 0, 24 | 419 |
| Anxiety | 9.58 (6.01) | 0, 21 | 420 |
| Pain related disability % (n) | 100 (423) | ||
| Minimal (0–10) | 14.89 (63) | ||
| Mild (11–20) | 14.42 (61) | ||
| Mild-moderate (21–30) | 17.73 (75) | ||
| Moderate (31–40) | 18.68 (79) | ||
| Moderate-severe (41–50) | 17.97 (76) | ||
| Severe (51–60) | 12.06 (51) | ||
| Profound (61–70) | 3.31 (14) | ||
| Missing | 0.95 (4) | ||
| Pain severity % (n) | 100 (423) | ||
| No pain (0) | 2.84 (12) | ||
| Mild pain (≤5) | 27.90 (118) | ||
| Moderate pain (6–7) | 38.06 (161) | ||
| Severe pain (8+) | 30.97 (131) | ||
| Missing | 0.23 (1) | ||
| Depression % (n) | 100 (423) | ||
| Minimal (0–4) | 15.84 (67) | ||
| Mild (5–9) | 26.00 (110) | ||
| Moderate (10–14) | 27.19 (115) | ||
| Moderately severe (15–19) | 18.20 (77) | ||
| Severe (20+) | 11.82 (50) | ||
| Missing | 0.95 (4) | ||
| Anxiety % (n) | 100 (423) | ||
| Minimal (0–4) | 29.08 (123) | ||
| Mild (5–9) | 24.82 (105) | ||
| Moderate (10–14) | 19.86 (84) | ||
| Severe (15+) | 25.53 (108) | ||
| Missing | 3 (0.71) |
Descriptive statistics.
Exploratory factor analysis
Bartlett’s test was highly significant (p < .001). The overall KMO value was excellent (0.91) (48). Item-level KMO values ranged between 0.89 and 0.95. The FIML estimated correlation matrix showed adequate correlations across items (Table 4). These findings support the suitability of the dataset for factor analysis.
Table 4
| PDI item | PDI_1 | PDI_2 | PDI_3 | PDI_4 | PDI_5 | PDI_6 | PDI_7 |
|---|---|---|---|---|---|---|---|
| PDI_1 | 1.00 | ||||||
| PDI_2 | 0.75 | 1.00 | |||||
| PDI_3 | 0.65 | 0.71 | 1.00 | ||||
| PDI_4 | 0.71 | 0.68 | 0.66 | 1.00 | |||
| PDI_5 | 0.61 | 0.61 | 0.62 | 0.63 | 1.00 | ||
| PDI_6 | 0.60 | 0.54 | 0.61 | 0.54 | 0.55 | 1.00 | |
| PDI_7 | 0.53 | 0.49 | 0.53 | 0.47 | 0.49 | 0.58 | 1.00 |
Correlation matrix for the seven pain disability index items.
EFA showed that all seven PDI items loaded strongly onto a single factor. The proportion of variance explained by this factor was 60%. SS loadings of 4.21 indicated a well-fitting model. Factor loadings ranged from 0.63 to 0.85, suggesting meaningful contributions from each item. χ2 was significant (p < .001), suggesting an imperfect model fit. χ2, however, is sensitive to sample size; as datasets become larger, even modest model misfit can yield significant p-values. Thus, additional model fit indices were examined (RMSR = 0.04, TLI = 0.95, RMSEA = 0.097, 90% CI [0.075, 0.12]). While TLI and RMSR indicated good fit, the RMSEA of 0.097 (with upper CI bound of 0.12) suggests mediocre fit according to conventional guidelines.
Next, a two-factor EFA was conducted. The second factor explained only 4% of the variance. Factor loadings for the second factor were weak and did not improve model fit (Table 5). SS loadings were small (0.30). This suggested that the second factor does not represent a meaningful construct. Although prior studies have occasionally proposed two-factor structures (19–24, 29), our findings support previous research demonstrating a one-factor solution (19, 20, 22, 23, 29) as the most appropriate representation.
Table 5
| PDI items | 1 factor | 2 factor | ||||
|---|---|---|---|---|---|---|
| Factor loadings | Factor communality | Factor 1 loadings | Factor 1 communality | Factor 2 loadings | Factor 2 communality | |
| PDI_1 | 0.85 | 0.72 | 0.84 | 0.72 | −0.11 | 0.72 |
| PDI_2 | 0.84 | 0.71 | 0.84 | 0.76 | −0.22 | 0.76 |
| PDI_3 | 0.82 | 0.66 | 0.81 | 0.66 | 0.66 | |
| PDI_4 | 0.81 | 0.66 | 0.80 | 0.66 | −0.13 | 0.66 |
| PDI_5 | 0.75 | 0.56 | 0.74 | 0.55 | 0.55 | |
| PDI_6 | 0.71 | 0.50 | 0.75 | 0.73 | 0.41 | 0.73 |
| PDI_7 | 0.63 | 0.40 | 0.65 | 0.47 | 0.24 | 0.47 |
Exploratory factor analysis: 1 and 2 factor model item loadings.
The communalities for the two-factor model are identical to those of the 1-factor model, given that the second factor’s loadings are either very small or do not exist (e.g., PDI_3), which means that the contribution from Factor 2 to explaining the variance is negligible.
Confirmatory factor analysis
Based on EFA results, CFA was conducted using a pre-specified single-factor model. The overall fit of the model was statistically significant (p < .001), suggesting that the model did not perfectly reproduce the observed covariance. Other indices indicated mixed results. CFI (0.97) and TLI (0.95) suggested a good fit, with robust versions showing slightly higher values (Robust CFI = 0.97, Robust TLI = 0.96). SRMR was 0.03, well below the recommended cutoff of 0.08, indicating excellent residual fit. However, the RMSEA of 0.08 (90% CI [0.06, 0.10]) indicates mediocre fit according to conventional guidelines (46), with the upper confidence interval bound (0.10) approaching the threshold for poor fit. This discrepancy between fit indices may reflect the scale’s brevity (7 items), as RMSEA can be inflated in models with few degrees of freedom (49).
This model explained 60% of the variance in the observed variables. All standardized factor loadings were statistically significant (p < .001), ranging from 0.63 (item 7) to 0.85 (item 1), indicating strong relationships between the latent factor and each PDI item (Table 6). Squared multiple correlations (R2) ranged from .40 to .72, indicating that the single-factor model explains a substantial amount of variance across the PDI items (see Table 6). Figure 1 provides a visual summary of the one-factor structure of PDI, as per the reported CFA. These findings provide further empirical support for the single-factor model as the most robust and parsimonious representation of the data.
Table 6
| PDI items | λ | SE | R2 |
|---|---|---|---|
| PDI_1 | .85 | 0.02 | .72 |
| PDI_2 | .84 | 0.02 | .71 |
| PDI_3 | .82 | 0.03 | .67 |
| PDI_4 | .81 | 0.02 | .66 |
| PDI_5 | .75 | 0.03 | .56 |
| PDI_6 | .71 | 0.03 | .50 |
| PDI_7 | .63 | 0.04 | .40 |
Standardized item loadings (λ) and standard error on the factor in the model, along with squared multiple correlations (R2).
Figure 1

Confirmatory factor analysis: PDI factor structure and item loadings. The dashed line between PDI_1 and the latent factor does not reflect a weaker relationship but rather that PDI_1 is being used as the reference indicator with a fixed loading, and is thus not standardized. The model scaling intercepts (triangles) are all set to the value = I as is customary.
Reliability
Cronbach’s alpha indicated excellent internal consistency (0.91; 95% CI: 0.90–0.92). Removing any individual item, including item 5, sexual behavior, did not affect reliability, as α remained above 0.89 in all cases. The average inter-item correlation was 0.60, further supporting internal consistency. Composite reliability (CR) for the single latent factor was 0.91, indicating that one latent construct accounted for a substantial proportion of variance in the observed variables.
Construct validity
Assumptions were met (linearity, normality, and homoscedasticity) for all three regressions. For both SEMs, the χ2 test was significant (p < .001), indicating some discrepancies in model fit. This is common in large samples, as discussed, and other model fit indices were acceptable (Appendix 4, EFA-CFA). Detailed regression and SEMS are available in Table 7 and Figures 2, 3.
Table 7
| B | 95% CI | SE | β | t | p | |
|---|---|---|---|---|---|---|
| Pain severity | ||||||
| Intercept | 11.16 | 6.58, 15.74 | 2.33 | NA | 4.79 | < .001 |
| Pain severity | 3.17 | 2.49, 3.85 | 0.35 | 0.41 | 9.12 | < .001 |
| Depression | ||||||
| Intercept | 15.27 | 12.24, 18.30 | 1.54 | NA | 9.90 | < .001 |
| Depression | 1.42 | 1.18, 1.65 | 0.12 | 0.50 | 11.79 | < .001 |
| Anxiety | ||||||
| Intercept | 21.52 | 18.50, 24.53 | 1.53 | NA | 14.03 | < .001 |
| Anxiety | 1.02 | 0.76, 1.29 | 0.14 | 0.35 | 7.55 | < .001 |
Simple linear regressions: pain severity, depression, and anxiety as predictors of pain-related disability.
Pain severity: F(1, 416) = 83.18, p < .001, R2 = .17, Adj R2 = .17; Depression: F(1, 413) = 139.10, p < .001, R2 = .25, Adj R2 = .25, Anxiety: F(1, 415) = 57.00, p < .001; R2 = .12, Adj R2 = .12.
Figure 2
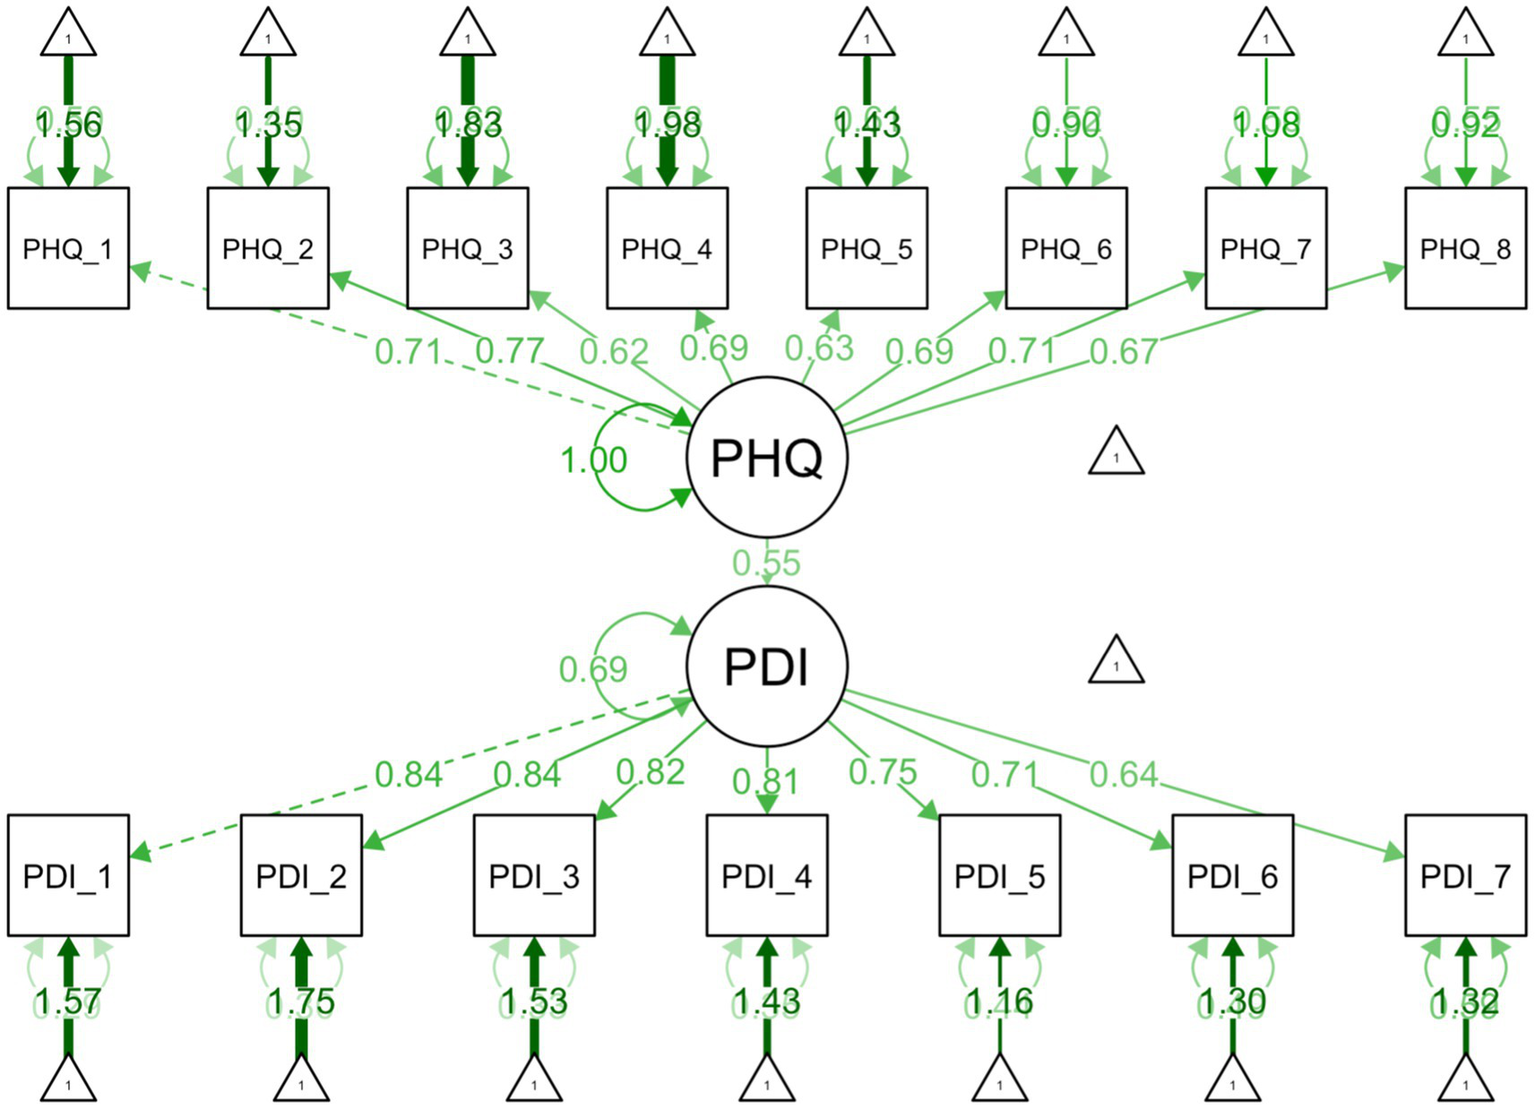
Structural equation model illustrating the relationships between depression and pain related disability. Depression as measured by PHQ-8 and pain related disability as measured by the Arabic PDI.
Figure 3

Structural equation model illustrating the relationships between anxiety and pain related disability. Anxiety as measured by GAD-7 and pain related disability as measured by the Arabic PDI.
Assumption checks for known-groups contrasts demonstrated significant deviations from normality for mild pain severity (VAS ≤ 5) and non-clinical depression/anxiety subgroups (scores >10, p < .001). Assumption of equal variance was violated for the anxiety (p = .03) and pain severity (p = .01) group comparisons only. Given the robustness of Welch’s t-tests to such violations, parametric test statistics were retained in the following analyses.
Pain severity
Pain severity was moderately correlated with PDI (r = .41). Regression results suggested a significant moderate positive association (β = .41), with higher pain intensity predicting higher PDI scores (p < .001). Approximately 17% of the variance in PDI was explained by pain severity. Each one-point increase in pain was associated with a 3.17-point increase in PDI score.
Known groups contrasts showed that participants reporting moderate–severe pain levels (VAS > 5) had significantly higher PDI scores (M = 35.7, SD = 15.5) than those with mild pain (VAS ≤ 5; M = 21.0, SD = 17.9). This difference was statistically significant, Welch’s t(211) = 8.00, p < .001. The effect size was large, d = 0.90, 95% CI [0.69, 1.12].
Depression
Depression was moderately correlated with pain-related disability (r = .50) In regression, depression emerged as a strong predictor (p < .001), explaining approximately 25% of the variance in PDI, with a moderate effect size (β = .50). Each one-point increase in depression was associated with a 1.42-point increase in PDI. In SEM, this relationship remained robust. The structural path from between depression and PDI was significant (p < .001), with a moderate–strong effect (β = .55). All items significantly loaded on their respective constructs (PHQ = 0.62–0.77; PDI = 0.64–0.84, all ps < .001), indicating all items are moderate to strong indicators of their respective latent constructs.
Known group contrasts showed that participants with scores indicative of clinically significant depression (≥10) reported higher pain-related disability (M = 37.1, SD = 15.6) than those scoring below the threshold (M = 23.0, SD = 16.8). Welch’s t-test showed that this difference was statistically significant, Welch’s t(352) = −8.64, p < .001. The effect size was large, d = 0.87, 95% CI [0.67, 1.08] (see Appendix 5).
Anxiety
Anxiety was moderately correlated with disability (r = .35). Anxiety accounted for 12% of the variance in pain-related disability (p < .001). Effect size was moderate (β = .35). Each one-point increase in anxiety was associated with a 1.02-point increase in PDI. In the SEM, the standardized path coefficient (β = .38) confirmed a moderate effect (p < .001). All items loaded strongly on their respective factors (GAD 0.71–0.86; PDI 0.64–0.85, all ps < .001), indicating items are moderate to strong indicators of their respective latent constructs.
Known group contrasts showed that participants with scoring above the clinical threshold for anxiety (GAD-7 scores ≥ 10) reported higher PDI scores (M = 36.5, SD = 15.9) than those below the threshold (M = 26.7, SD = 17.7). Welch’s t-test confirmed this difference was statistically significant, Welch’s t(409) = −5.95, p < .001. The effect size was moderate, d = 0.58, 95% CI [0.38, 0.78] (see Appendix 6).
Discussion
The goal of this study was to translate the PDI into MSA and evaluate its psychometric properties. Pilot testing and patient feedback demonstrated the acceptability and cultural appropriateness of the translated measure. Our data provided strong support for the psychometric properties of the resulting measure, meeting the COSMIN criteria, including structural validity, internal consistency, and construct validity (33).
Psychometric properties were examined using data from 423 individuals. Factor analysis showed all items loaded strongly on a single latent factor, accounting for 60% of the variance. The MSA PDI demonstrated excellent internal consistency and reliability, providing strong evidence that the MSA PDI captures a coherent, single unified construct of pain-related disability. This one-factor model is consistent with two of the three validation studies (19, 29), examining the original English version and prior translations in Dutch and Japanese (20, 22, 23). We did not find support for a two-factor model as found in one previous English language validation study (30) and prior translations in French-Canadian (21) and Turkish (24).
The construct validity of the measure was evaluated using a tiered multi-method analytic approach, including correlational analysis, linear regression, and SEM. All relationships were directionally consistent with expected theoretical relationships, with moderate positive associations between pain disability and related constructs (pain, depression, anxiety), demonstrating that increasing levels of pain, depression, and anxiety are associated with increasing levels of pain-related disability. This is consistent with previous research, which also found significant associations between pain-related functional impairment and both pain severity (20–22, 24, 29, 30) and depression (21, 24, 29–31). In our study, depression was the strongest predictor of pain-related functional impairment, with depression accounting for approximately 25% of the variance in pain-related disability. Pain severity and anxiety also demonstrated significant predictive value, explaining 17 and 12% of the variance, respectively. These findings are in line with established theoretical models of chronic pain that emphasize the interplay of biological, psychological, and social factors.
Clinical and research implications
The availability of a psychometrically sound MSA PDI holds important implications for improving pain treatment. As language barriers have been shown to influence the accuracy of pain assessment (5) and reduce the quality of care (6), the MSA PDI will be a valuable tool to provide optimal treatment to Arabic-speaking patients, including enhancing diagnostic accuracy, treatment planning, and outcome monitoring. Its excellent reliability suggests it can be used confidently across settings to track treatment response over time. Since MSA is used in healthcare, education, and government across the Arab world, this translation has the potential for cross-national clinical and research applications. The MSA PDI may also facilitate interdisciplinary care by providing a standardized measure that can be used across medical, psychological, and rehabilitative specialties.
Our findings also contribute to the ongoing body of literature examining the interrelationships of psychological distress, pain severity, and pain-related functional impairment. A substantial portion of participants (63.59%) in this study scored above screening thresholds for depression and/or anxiety. This is in line with previous clinical research indicating that persons with chronic pain are more likely to experience depression or anxiety than the general population. The consistent moderately positive associations of these variables with pain-related disability underscore the need for a comprehensive, interdisciplinary approach to pain management. In addition, our work provides additional support for previous research, suggesting that psychological distress may be a more important predictor of disability than pain severity itself. While all three constructs—pain severity, depression, and anxiety—were meaningfully associated with functional impairment, depression was the strongest predictor of pain-related disability. This suggests that psychological interventions play a critical role in improving functional outcomes. Optimal treatment outcomes are likely dependent on addressing co-occurring psychological concerns, whether or not they are a consequence of the pain condition itself.
Strengths and limitations
A major strength of this study lies in its methodological rigor. The translation process followed established guidelines and included input from linguistically and culturally diverse Arabic-speaking professionals, enhancing its potential generalizability beyond the UAE. Additionally, the use of multiple analytic strategies, including exploratory and confirmatory factor analyses, reliability indices, and structural equation modeling, added depth and robustness to our findings.
Several limitations should be noted. First, EFA and CFA were conducted on the same dataset due to sample size constraints; COSMIN guidelines recommend using independent datasets to minimize bias and confirm structural validity (33). Future studies should aim to replicate these findings in separate samples. Second, it was not feasible to assess test–retest reliability in this study. For pain disability measures, test–retest is typically completed within 7 days, as the score may fluctuate over longer periods due to the natural course of chronic pain and treatment effects. In our setting, participants could only provide data during routine clinical visits, scheduled 1–6 months apart, making it impractical to obtain test–retest data within the recommended timeframe. Future studies are needed to examine the measure’s temporal stability. Third, while most fit indices (CFI, TLI, SRMR) indicated good to excellent model fit, the RMSEA values (0.08–0.097) suggest mediocre fit according to conventional standards (49). This may reflect the scale’s brevity. Future validation studies with larger samples would be of value in further confirming the factor structure of the MSA PDI. Fourth, participants were recruited from a single tertiary care center in the UAE, limiting generalizability. As noted by Turk et al. (14) patients seen in pain clinics differ from those in primary care or the community. It is well documented in the literature that pain clinic populations typically report higher levels of disability, longer pain duration, and greater psychological distress compared to patients in community or primary care samples (50, 51).
Fourth, while the inclusion of depression and anxiety strengthens the evaluation of construct validity, other relevant psychosocial variables [pain catastrophizing (52), self-efficacy (53), and pain coping (54)] were not included. Finally, a significant number of patients did not respond to PDI item 5, which queries sexual behavior. Participants omitting this item were more likely to be women and not formally partnered (e.g., legally married.). The missing data for this item likely reflects cultural and religious beliefs that prohibit any type of sexual behavior outside of marriage. This fact is underscored by the qualitative data provided by participants omitting item 5 (e.g., verbal reports that they did not engage in sexual activity at all, followed by writing NA on the questionnaire itself). Although this has the potential to introduce non-response bias, this pattern has been noted in other studies (22, 55). Importantly, here, inclusion of (or lack thereof) this item did not influence the overall reliability of the measure.
Future directions
Future studies should replicate these findings in diverse Arabic-speaking populations, including community and primary care samples. Longitudinal research should evaluate the PDI’s sensitivity to clinical change to establish its value as a treatment outcome measure. In addition, future work may explore multivariate models incorporating psychosocial and demographic predictors to clarify the mechanisms linking pain, mood, and disability. Such models could help resolve ongoing debates about the relative contributions of pain intensity and psychological distress and illuminate potential cross-cultural differences in these associations.
Conclusion
Results demonstrated that the MSA PDI is a reliable and valid measure of pain-related disability, with strong potential for use in clinical and research settings serving Arabic-speaking populations. It addresses a critical gap in pain assessment and supports more inclusive and effective care.
Statements
Data availability statement
The datasets presented in this article are not readily available because the data supporting the findings of this study are not publicly available due to institutional and local policy restrictions on patient-level data sharing. De-identified analysis code and output are available via the Open Science Framework repository: https://doi.org/10.17605/OSF.IO/MT9U7. Requests to access the datasets should be directed to kellynnh@gmail.com, Kelly Huffman.
Ethics statement
The studies involving humans were approved by the Cleveland Clinic Abu Dhabi Research Ethics Committee. The studies were conducted in accordance with the local legislation and institutional requirements. The participants provided their written informed consent to participate in this study.
Author contributions
LC: Conceptualization, Data curation, Formal analysis, Investigation, Methodology, Project administration, Resources, Supervision, Validation, Visualization, Writing – original draft, Writing – review & editing. EH: Conceptualization, Data curation, Formal analysis, Investigation, Methodology, Resources, Software, Validation, Visualization, Writing – original draft, Writing – review & editing. EF: Conceptualization, Data curation, Investigation, Project administration, Resources, Supervision, Writing – original draft, Writing – review & editing. AV: Data curation, Investigation, Project administration, Writing – original draft, Writing – review & editing. JB: Data curation, Investigation, Project administration, Resources, Writing – original draft, Writing – review & editing. OK: Data curation, Investigation, Project administration, Resources, Writing – review & editing. DM: Data curation, Investigation, Project administration, Resources, Writing – review & editing. KA: Funding acquisition, Investigation, Methodology, Resources, Validation, Writing – review & editing. WJA: Investigation, Validation, Writing – review & editing. WSA: Investigation, Validation, Writing – review & editing. KH: Conceptualization, Data curation, Formal analysis, Funding acquisition, Investigation, Methodology, Project administration, Resources, Supervision, Validation, Visualization, Writing – original draft, Writing – review & editing.
Funding
The author(s) declare that financial support was received for the research and/or publication of this article. Cleveland Clinic Abu Dhabi provided internal funding for this study, including publication fees and staff time.
Acknowledgments
We would like to thank Dr. Florian Roser (Chief Medical Officer) and Dr. Syed Hussein (Institute Chair) for the institutional resources provided for this study. We would also like to thank Cleveland Clinic research nurse coordinators Allison Hanley and Christos Leftheriotis for their assistance in data collection and study management. Finally, we would like to acknowledge Dr. Somer Chehab (Staff Physician, Neurosurgery) for his work as part of the translation team, and Dr. Reda Tolba (Department Chair, Pain Management) for his final review of the completed measure.
Conflict of interest
The authors declare that the research was conducted in the absence of any commercial or financial relationships that could be construed as a potential conflict of interest.
Generative AI statement
The authors declare that Gen AI was used in the creation of this manuscript. Generative AI was used to (1) conduct literature searches, (2) check for grammatical and typographical errors, (3) suggestions of edits in style, organization, conciseness and brevity, including word choice and reductions to meet word count specifications. All suggestions were reviewed and either accepted or rejected by a member of the study team. All identified literature was reviewed to ensure authenticity of references and accuracy of summarized text.
Any alternative text (alt text) provided alongside figures in this article has been generated by Frontiers with the support of artificial intelligence and reasonable efforts have been made to ensure accuracy, including review by the authors wherever possible. If you identify any issues, please contact us.
Publisher’s note
All claims expressed in this article are solely those of the authors and do not necessarily represent those of their affiliated organizations, or those of the publisher, the editors and the reviewers. Any product that may be evaluated in this article, or claim that may be made by its manufacturer, is not guaranteed or endorsed by the publisher.
Supplementary material
All appendices are available on Open Science Framework (OSF): https://doi.org/10.17605/OSF.IO/MT9U7.
References
1.
Goldberg DS McGee SJ . Pain as a global public health priority. BMC Public Health. (2011) 11:770. doi: 10.1186/1471-2458-11-770,
2.
Almalki MT BinBaz SS Alamri SS Alghamdi HH El-Kabbani AO Al Mulhem AA et al . Prevalence of chronic pain and high-impact chronic pain in Saudi Arabia. Saudi Med J. (2019) 40:1256–66. doi: 10.15537/smj.2019.12.24690,
3.
Dworkin RH Turk DC Farrar JT Haythornthwaite JA Jensen MP Katz NP et al . Core outcome measures for chronic pain clinical trials: IMMPACT recommendations. Pain. (2005) 113:9–19. doi: 10.1016/j.pain.2004.09.012,
4.
Melzack R . The McGill pain questionnaire: major properties and scoring methods. Pain. (1975) 1:277–99. doi: 10.1016/0304-3959(75)90044-5
5.
Mustajoki M Forsén T Kauppila T . Pain assessment in native and non-native language: difficulties in reporting the affective dimensions of pain. Scand J Pain. (2018) 18:575–80. doi: 10.1515/sjpain-2018-0043,
6.
Mustajoki M Forsén T Kauppila T . The association between patient-reported pain and doctors’ language proficiency in clinical practice. Pain Res Treat. (2015) 2015:263904. doi: 10.1155/2015/263904,
7.
Jimenez N Jackson DL Zhou C Ayala NC Ebel BE . Postoperative pain management in children, parental english proficiency, and access to interpretation. Hosp Pediatr. (2014) 4:23–30. doi: 10.1542/hpeds.2013-0031,
8.
Jimenez N Moreno G Leng M Buchwald D Morales LS . Patient-reported quality of pain treatment and use of interpreters in Spanish-speaking patients hospitalized for obstetric and gynecological care. J Gen Intern Med. (2012) 27:1602–8. doi: 10.1007/s11606-012-2154-x,
9.
Wilson L Zheng P Ionova Y Denham A Yoo C Ma Y et al . CAPER: patient preferences to inform nonsurgical treatment of chronic low back pain: a discrete-choice experiment. Pain Med. (2023) 24:963–73. doi: 10.1093/pm/pnad038,
10.
Henry SG Bell RA Fenton JJ Kravitz RL . Goals of chronic pain management: do patients and primary care physicians agree and does it matter?Clin J Pain. (2017) 33:955–61. doi: 10.1097/AJP.0000000000000488,
11.
Shanahan ML Rand KL Galloway A Matthias MS . Treatment goals and preferences of black veterans with chronic musculoskeletal pain. J Pain. (2024) 25:104487. doi: 10.1016/j.jpain.2024.02.001,
12.
Landmark L Sunde HF Fors EA Kennair LEO Sayadian A Backelin C et al . Associations between pain intensity, psychosocial factors, and pain-related disability in 4285 patients with chronic pain. Sci Rep. (2024) 14:13477. doi: 10.1038/s41598-024-64059-8,
13.
Gronblad M Hupli M Wennerstrand P Järvinen E Lukinmaa A Kouri JP et al . Intercorrelation and test-retest reliability of the pain disability index (PDI) and the Oswestry disability questionnaire (ODQ) and their correlation with pain intensity in low back pain patients. Clin J Pain. (1993) 9:189–95. doi: 10.1097/00002508-199309000-00006,
14.
Turk DC . Clinical effectiveness and cost-effectiveness of treatments for patients with chronic pain. Clin J Pain. (2002) 18:355–65. doi: 10.1097/00002508-200211000-00003,
15.
Bair MJ Wu J Damush TM Sutherland JM Kroenke K . Association of depression and anxiety alone and in combination with chronic musculoskeletal pain in primary care patients. Psychosom Med. (2008) 70:890–7. doi: 10.1097/PSY.0b013e318185c510,
16.
Hall AM Kamper SJ Maher CG Latimer J Ferreira ML Nicholas MK . Symptoms of depression and stress mediate the effect of pain on disability. Pain. (2011) 152:1044–51. doi: 10.1016/j.pain.2011.01.014,
17.
Eberhard DM Simons GF Fennig CD (eds). Ethnologue: languages of the world, 27th ed. Dallas, TX: SIL International. (2024). Available online at: http://www.ethnologue.com (Accessed June 1, 2025).
18.
Pew Research Center . (2023). 5 facts about Arabic speakers in the U.S. Available online at: https://www.pewresearch.org/short-reads/2023/05/18/5-facts-about-arabic-speakers-in-the-us/#:~:text=The%20number%20of%20people%20ages,those%20born%20in%20the%20U.S (Accessed June 1, 2025).
19.
Chibnall JT Tait RC . The pain disability index: factor structure and normative data. Arch Phys Med Rehabil. (1994) 75:1082–6. doi: 10.1016/0003-9993(94)90082-5,
20.
Yamada K Mibu A Kogo S Sullivan M Nishigami T . Reliability and validity of the Japanese version of pain disability index. PLoS One. (2022) 17:e0274445. doi: 10.1371/journal.pone.0274445,
21.
Gauthier N Thibault P Andams H Sullivan MJL . Validation of a French-Canadian version of the pain disability index. Pain Res Manag. (2008) 13:327–33. doi: 10.1155/2008/461436
22.
Soer R Köke AJA Vroomen PCAJ Stegeman P Smeets RJEM Coppes MH et al . Extensive validation of the pain disability index in 3 groups of patients with musculoskeletal pain. Spine. (2013) 38:E562–8. doi: 10.1097/BRS.0b013e31828af21f,
23.
Van der Gucht E Dams L Bernar K De Vrieze T Haenen V De Groef A et al . The Dutch language version of the pain disability index (PDI-DLV): psychometric properties in breast cancer patients. Physiother Theory Pract. (2023) 39:2000–14. doi: 10.1080/09593985.2022.2059036,
24.
Uğurlu M Uğurlu GK Erten Ş Ulusoy Kaymak S Çayköylü A . Reliability and factorial validity of the Turkish version of the pain disability index in rheumatic patients with chronic pain. Arch Rheumatol. (2016) 31:265–71. doi: 10.5606/ArchRheumatol.2016.5750,
25.
Guillemin F Bombardier C Beaton D . Cross-cultural adaptation of health-related quality of life measures: literature review and proposed guidelines. J Clin Epidemiol. (1993) 46:1417–32. doi: 10.1016/0895-4356(93)90142-N,
26.
Tsang S Royse CF Terkawi AS . Guidelines for developing, translating, and validating a questionnaire in perioperative and pain medicine. Saudi J Anaesth. (2017) 11:80–S89. doi: 10.4103/sja.SJA_203_17,
27.
Versteegh K . The Arabic language. 2nd ed. Edinburgh: Edinburgh University Press (2014).
28.
Cohen J . Statistical power analysis for the behavioural sciences. 2nd ed. Hillsdale, NJ: Lawrence Erlbaum Associate (1988).
29.
Tait RC Chibnall JT Krause S . The pain disability index: psychometric properties. Pain. (1990) 40:171–82. doi: 10.1016/0304-3959(90)90068-O,
30.
Tait RC Pollard CA Margolis RB . The pain disability index: psychometric and validity data. Arch Phys Med Rehabil. (1987) 68:438–41.
31.
Soer R Reneman MF Vroomen PCAJ Stegeman P Coppes MH . Responsiveness and minimal clinically important change of the pain disability index in patients with chronic back pain. Spine. (2012) 37:711–5. doi: 10.1097/BRS.0b013e31822c8a7a,
32.
Soer R Köke AJA Speijer BLGN Köke AJ Speijer BL Vroomen PC et al . Reference values of the pain disability index in patients with painful musculoskeletal and spinal disorders: a cross-national study. Spine (Phila Pa 1976). (2015) 40:E545–51. doi: 10.1097/BRS.0000000000000827,
33.
Mokkink LB Terwee CB Patrick DL Alonso J Stratford PW Knol DL et al . The COSMIN checklist for assessing the methodological quality of studies on measurement properties of health status measurement instruments: an international Delphi study. Qual Life Res. (2010) 19:539–49. doi: 10.1007/s11136-010-9606-8,
34.
Hartrick CT Kovan JP Shapiro S . The numeric rating scale for clinical pain measurement: a ratio measure?Pain Pract. (2003) 3:310–6. doi: 10.1111/j.1530-7085.2003.03034.x,
35.
Boonstra AM Stewart RE Albère AJ Köke AJA Oosterwijk RFA Swaan JL et al . Cut-off points for mild, moderate, and severe pain on the numeric rating scale for pain in patients with chronic musculoskeletal pain: variability and influence of sex and catastrophizing. Front Psychol. (2016) 7:1466. doi: 10.3389/fpsyg.2016.01466
36.
Kroenke K Spitzer RL . The PHQ-9: a new depression diagnostic and severity measure. Psychiatr Ann. (2002) 32:509–15. doi: 10.3928/0048-5713-20020901-06,
37.
Kroenke K Spitzer RL Williams JBW . The PHQ-9: validity of a brief depression severity measure. J Gen Intern Med. (2001) 16:606–13. doi: 10.1046/j.1525-1497.2001.016009606.x,
38.
Kroenke K Strine TW Spitzer RL Williams JBW Berry JT Mokdad AH . The PHQ-8 as a measure of current depression in the general population. J Affect Disord. (2009) 114:163–73. doi: 10.1016/j.jad.2008.06.026,
39.
American Psychiatric Association . Diagnostic and statistical manual of mental disorders. 4th ed. Washington DC: American Psychiatric Association. (2000).
40.
Corson K Gerrity MS Dobscha SK . Screening for depression and suicidality in a VA primary care setting: 2 items are better than 1 item. Am J Manag Care. (2004) 10:839–45.
41.
Spitzer RL Kroenke K Williams JBW Löwe B . A brief measure for assessing generalized anxiety disorder: the GAD-7. Arch Intern Med. (2006) 166:1092–7. doi: 10.1001/archinte.166.10.1092,
42.
R Core Team . A language and environment for statistical computing [computer program]. Version 4.5.0. Vienna Austria: R foundation for statistical computing. (2023). Available online at: https://www.R-project.org/ (Accessed June 1, 2025).
43.
Hair JF Babin BJ Anderson RE Black WC . Multivariate data analysis, 8th ed. Boston, MA: Cengage (2018).
44.
Field AP . Discovering statistics using IBM SPSS Statistics. 5th ed. London: SAGE Publications. (2018).
45.
Rosseel Y . Lavaan: an R package for structural equation modeling. J Stat Softw. (2012) 48:1–36. doi: 10.18637/jss.v048.i02
46.
Hu LT Bentler PM . Cutoff criteria for fit indexes in covariance structure analysis: conventional criteria versus new alternatives. Struct Equ Modeling. (1999) 6:1–55. doi: 10.1080/10705519909540118
47.
Kline RB . Principles and practice of structural equation modeling. 4th ed. London: The Guilford Press (2016).
48.
Kaiser HF . An index of factorial simplicity. Psychometrika. (1974) 39:31–6. doi: 10.1007/BF02291575
49.
Browne MW Cudeck R . Alternative ways of assessing model fit. Sociol Methods Res. (1992) 21:230–58. doi: 10.1177/0049124192021002005
50.
Crook J Weir R Tunks E . An epidemiological follow-up survey of persistent pain sufferers in a group family practice and specialty pain clinic. Pain. (1989) 36:49–61. doi: 10.1016/0304-3959(89)90111-5,
51.
Crook J Tunks E Rideout E Browne G . Epidemiologic comparison of persistent pain sufferers in a specialty pain clinic and in the community. Arch Phys Med Rehabil. (1986) 67:451–455.
52.
Severeijns R Vlaeyen JW van den Hout MA Weber WE . Pain catastrophizing predicts pain intensity, disability, and psychological distress independent of the level of physical impairment. Clin J Pain. (2001) 17:165–72. doi: 10.1097/00002508-200106000-00009,
53.
Turner JA Ersek M Kemp C . Self-efficacy for managing pain is associated with disability, depression, and pain coping among retirement community residents with chronic pain. J Pain. (2005) 6:471–9. doi: 10.1016/j.jpain.2005.02.011,
54.
Turner JA Clancy S . Strategies for coping with chronic low back pain: relationship to pain and disability. Pain. (1986) 24:355–64. doi: 10.1016/0304-3959(86)90121-1,
55.
Gross DP Knupp H Esmail S . The utility of measuring sexual disability for predicting 1-year return to work. Arch Phys Med Rehabil. (2011) 92:1870–4. doi: 10.1016/j.apmr.2011.06.020,
Summary
Keywords
pain disability index, Modern Standard Arabic, chronic pain, psychometric validation, cross-cultural adaptation and validation, patient reported clinical outcomes, health disparities, United Arab Emirates
Citation
Cassidy L, Hermena EW, Francois E, Verma A, Batra J, Krishnan OS, De Marco D, Almenhali KM, Alobeidli WJ, Almuntheri WS and Huffman KL (2026) Development of a Modern Standard Arabic version of the pain disability index: translation, cross-cultural adaptation, psychometric, and validity data. Front. Med. 12:1688744. doi: 10.3389/fmed.2025.1688744
Received
19 August 2025
Revised
31 October 2025
Accepted
05 November 2025
Published
08 January 2026
Volume
12 - 2025
Edited by
Maisa Ziadni, Stanford University, United States
Reviewed by
Hamid Sharif-Nia, Mazandaran University of Medical Sciences, Iran
Yousef Albahrani, Prince Mohammed bin Abdulaziz Hospital, Saudi Arabia
Updates
Copyright
© 2026 Cassidy, Hermena, Francois, Verma, Batra, Krishnan, De Marco, Almenhali, Alobeidli, Almuntheri and Huffman.
This is an open-access article distributed under the terms of the Creative Commons Attribution License (CC BY). The use, distribution or reproduction in other forums is permitted, provided the original author(s) and the copyright owner(s) are credited and that the original publication in this journal is cited, in accordance with accepted academic practice. No use, distribution or reproduction is permitted which does not comply with these terms.
*Correspondence: Kelly L. Huffman, kellynnh@gmail.com
ORCID: Leanne Cassidy, orcid.org/0009-0008-0559-0173; Kelly L. Huffman, orcid.org/0000-0002-2090-1987; Ehab W. Hermena, orcid.org/0000-0002-3338-7980; Amit Verma, orcid.org/0000-0002-5581-9414; Jaya Batra, orcid.org/0000-0002-5514-9983; Wadhha J. Alobeidli, orcid.org/0009-0008-1989-4194; Omeesha S. Krishnan, orcid.org/0009-0003-9465-4522
Disclaimer
All claims expressed in this article are solely those of the authors and do not necessarily represent those of their affiliated organizations, or those of the publisher, the editors and the reviewers. Any product that may be evaluated in this article or claim that may be made by its manufacturer is not guaranteed or endorsed by the publisher.