Abstract
Background:
COVID-19 patients frequently present with abnormal liver function tests (LFTs) and elevated non-invasive liver fibrosis scores, such as the fibrosis-4 index (FIB-4), the non-alcoholic fatty liver disease fibrosis score (NFS), and the aspartate aminotransferase (AST) to platelet ratio index (APRI). While elevated LFTs and non-invasive liver fibrosis scores in COVID-19 patients have been associated with poor COVID-19 outcome, most of those data were collected before the dominance of the Omicron variant and shift in disease presentation to a milder respiratory presentation.
Methods:
This was a retrospective cohort study of 4,565 non-pregnant adults admitted with COVID-19 from 03/01/2020 to 12/31/2024. We examined the association of LFT and non-invasive liver fibrosis score derangements near admission with relative risk of severe COVID-19, a composite outcome defined as death and/or requirement of organ support. Subgroup analyses included: a “non-liver disease subgroup” (patients without known prior liver disease, viral hepatitis, or prior remdesivir use), a “room air subgroup” (patients who remained on room air during the first 24 h of admission), and viral variant subgroups defined by date. Multivariable regression models were compared via area under the receiver operating characteristic (ROC) curve and Akaike Information Criterion (AIC).
Results:
Elevations in FIB-4, NFS, and APRI were associated with increased risk of severe COVID-19 in the total cohort and across various subgroups. High FIB-4 (>2.67) and intermediate APRI (0.5–1.0) were associated with increased risk of severe COVID-19 in the total cohort (FIB-4 RR: 2.25, 95% CI 1.81–2.79; APRI RR: 1.53, 95% CI 1.32–1.79), with similar results in the non-liver disease subgroup and across the Pre-Delta, Delta, and Omicron subgroups. High NFS (>0.675) was associated with increased risk of severe COVID-19 in the total cohort (RR: 2.33, 95% CI 1.83–2.97), with similar results in the room air, Pre-Delta, and Delta subgroups. Overall, the models had similar outcome discrimination based on area under the ROCs, but the FIB-4 models had the best fit based on AICs.
Conclusion:
Elevated non-invasive liver fibrosis scores at admission were associated with risk of severe COVID-19 across variants regardless of the baseline respiratory status or liver health of COVID-19 patients in this cohort.
1 Introduction
Coronavirus disease 2019 (COVID-19) emerged as a predominantly respiratory illness, with mortality often attributed to complications such as acute respiratory distress (1). As new data became available, extrapulmonary manifestations of COVID-19, including effects on the hepatobiliary system were documented (2–5).
Liver function test (LFT) abnormalities, especially elevated transaminases, are frequently reported among COVID-19 patients (5–7). Prior studies have linked LFT abnormalities with poor COVID-19 outcomes such as severe disease, intensive care unit (ICU) admission, mechanical ventilation, and mortality (5, 8).
Certain metrics calculated based on LFTs as well as other laboratory values and/or characteristics will be referred to as composite liver scores for the purposes of this study. Composite liver scores discussed here include the De Ritis ratio, liver pattern as determined by the R index (i.e., hepatocellular, cholestatic, or mixed), and three non-invasive liver fibrosis scores: the fibrosis-4 index (FIB-4), the non-alcoholic fatty liver disease fibrosis score (NFS), and the aspartate aminotransferase (AST) to platelet ratio index (APRI)(9–13). The non-invasive liver fibrosis scores (FIB-4, NFS, and APRI) are a subset of composite liver scores originally developed to estimate the likelihood and degree of fibrosis in patients with liver disease (11–13). The aforementioned composite liver scores have been shown to be associated with COVID-19 disease progression and poor outcome, with FIB-4 being the most widely studied in the context of COVID-19 (14–26). However, much of the available data are from early pandemic cohorts prior to the development and dominance of the Omicron variant and its subvariants (14, 16–18, 21–25).
Clinical presentations and disease severity have evolved with emerging variants (26–33). Some studies have investigated individual LFT abnormalities (i.e., abnormal AST, abnormal alanine aminotransferase (ALT), abnormal alkaline phosphatase (AP), abnormal bilirubin, etc.) across SARS-CoV-2 variants (19, 20, 34–38). However, few studies have examined the association of composite liver scores with COVID-19 outcome throughout the different SARS-CoV-2 variant-predominant periods (19, 20, 26). Of the aforementioned studies examining LFTs and/or composite liver scores across the evolution of COVID-19, only two were conducted in the United States (19, 26).
Given the widespread availability of LFTs and ease of calculating various composite liver scores in clinical settings, it is important to evaluate their association with patient outcomes throughout the evolution of COVID-19. Despite lower COVID-19 mortality rates compared to early pandemic levels, severe COVID-19 leading to hospitalization and death still persist (31, 32). In this retrospective cohort study, we examined the association between abnormal LFTs or composite liver scores at admission with severe COVID-19 in a safety-net hospital system in Dallas, Texas. This study aims to evaluate the use of LFTs and composite liver scores to prospectively predict severe COVID outcomes across patients with different variants and disease presentations. Our results can aid clinical practice by informing risk-stratification for patients who may require a higher level of care early on, even in the current COVID-19 era.
2 Materials and methods
2.1 Study population
This retrospective cohort study was performed with electronic medical record data from Parkland Memorial Hospital in Dallas, Texas from March 1, 2020, to December 31, 2024. Adults ≥ 18 years old admitted with COVID-19 were included in this study. COVID-19 was defined as a positive SARS-CoV-2 reverse transcriptase polymerase chain reaction (PCR) or antigen test within 2 weeks prior to and through the first 24 h of admission. Pregnant women, outpatients, and those discharged from the emergency department were not included in this study. We analyzed the first COVID-19 admission available per patient.
The primary outcome was severe COVID-19 defined by end-organ failure (indicated by requirement of organ support) and/or mortality associated with the COVID-19 admission. For the purposes of this study, end-organ failure was defined as the use of mechanical ventilation, intravenous vasopressors or inotropes, extracorporeal membrane oxygenation (ECMO) or continuous renal replacement therapy (CRRT; not including routine dialysis) during the COVID-19 admission. Mortality associated with the COVID-19 admission was defined by a date of death in the electronic medical record from any time during the admission through 7 days after the discharge date. Patients were considered to have severe COVID-19 at the time of admission and thus were excluded from the study if they met one or more of the following criteria: (1) required invasive mechanical ventilation within the first 24 h of admission; (2) required intravenous vasopressors (dopamine, vasopressin, phenylephrine, norepinephrine, or epinephrine) or inotropes (milrinone, dobutamine) on the day of or prior to admission. ECMO and CRRT start dates and times were not available.
2.2 Ethics and approvals
This study was approved, with a waiver of consent, by the University of Texas Southwestern Medical Center Institutional Review Board. This study met the STROBE statement criteria for cohort studies (Supplementary STROBE statement file) (39).
2.3 Data collection
Demographic information comprising age, sex, race, and ethnicity were collected alongside pre-existing comorbidities defined by ICD-10 codes, including hypertension, cardiovascular complications, respiratory disease, liver disease, viral hepatitis, chronic kidney disease (CKD), diabetes mellitus (DM), rheumatological disease, HIV infection, malignancy, paralytic syndromes, and dementia (Supplementary Table S1). Laboratory results before admission through the date of admission were used to identify additional cases of HIV, viral hepatitis, and DM.
Additional variables utilized in our analysis included body mass index (BMI), the highest oxygen requirement within the first 24 h of admission (hereafter referred to as baseline level of respiratory support), and remdesivir administration at least 1 day prior to laboratory sampling (hereafter referred to as prior remdesivir use; remdesivir start times to the hour were not available). BMI < 10 (kg/m2) or >100 (kg/m2) were assumed to be improperly entered into the medical record and considered missing (N = 42).
Baseline laboratory results were analyzed and defined as the first available results from the time of admission +/− 24 h, allowing for the inclusion of laboratory tests collected in the emergency department for patients who would then become admitted. Baseline aspartate aminotransferase (AST; U/L), alanine aminotransferase (ALT; U/L), alkaline phosphatase (AP; U/L), total bilirubin (mg/dL), direct bilirubin (mg/dL), gamma-glutamyl transferase (GGT, U/L), creatinine (mg/dL), C-reactive protein (CRP, mg/dL), D-dimer (mcg/mL), albumin (g/dL), hemoglobin (g/dL), lactate dehydrogenase (LDH; U/L), international normalized ratio (INR), prothrombin time (PT; seconds), platelet count (x109/L), and blood urea nitrogen (BUN; mg/dL) results were analyzed. Some patients had multiple results at the same timepoint for the same laboratory metric; therefore, the mean value at that timepoint was used for analysis. Definitions of normal LFTs were as follows: AST ≤ 40 U/L, ALT ≤40 U/L, AP ≤ 130 U/L, total bilirubin ≤ 1.2 mg/dL, direct bilirubin ≤0.3 mg/dL, and GGT ≤ 61 U/L for males or ≤36 U/L for females. AP, total bilirubin, direct bilirubin, and GGT were classified as either normal or elevated. Definitions of the severity of transaminase elevations vary among the COVID-19 literature (29, 38, 40), and often differ from the American College of Gastroenterology (ACG) severity definitions (10). We considered these various definitions, along with known clinical information about our local population to define transaminase elevations as mild (>40 U/L and ≤ 120 U/L; >1x-3x upper limit of normal (ULN)), moderate (>120 U/L and ≤ 400 U/L; >3x-10x ULN) or severe (>400 U/L; >10x ULN).
Among composite liver scores, we included the De Ritis ratio, liver pattern based on the R index, and three non-invasive liver fibrosis scores: FIB-4, APRI, and NFS. These were calculated with the following formulas:
De Ritis ratio = . Cutoffs for the De Ritis ratio were defined as: <1 (low), 1–2 (intermediate), and >2 (high) (9).
FIB-4 = . FIB-4 cutoffs were <1.3 (low), 1.3–2.67 (indeterminate), and >2.67 (high) (11, 41).
R index = . Low R index (<2) indicates a cholestatic pattern, intermediate R index (2–5) indicates a mixed pattern, and a high R index (>5) indicates a hepatocellular pattern (10).
. APRI cutoffs were <0.5 (low), 0.5–1 (intermediate), and >1 (high) (13, 22, 42).
(12). NFS cutoffs were <−1.455 (low), −1.455 to +0.675 (indeterminate), and > + 0.675 (high) (41).
All above formulas were calculated using the following units: age (years), BMI (kg/m2), and other laboratory test units listed above.
2.4 Subgroup analyses
The study cohort was divided into various subgroups:
-
(1) As those with pre-existing liver disease are expected to have abnormal LFTs at baseline, we divided the patients into two subgroups: the “liver disease subgroup” and “non-liver disease subgroup” (Figure 1B). The liver disease subgroup included patients with known history of liver disease and viral hepatitis. Patients who received remdesivir at least 1 day prior to baseline lab collection were also included in this subgroup due to previous reports of remdesivir-induced transaminitis (5, 43). Patients with no prior history of liver disease, viral hepatitis, or remdesivir use were included in the non-liver disease subgroup.
-
(2) As oxygen saturation and respiratory support requirement at admission are known risk factors for poor COVID-19 outcomes (44–46) and COVID-19 patients with Omicron are requiring less respiratory support compared to previous variants (47–49), we also divided the study cohort into subgroups based on baseline level of respiratory support (Figure 1C). Those who remained on room air for the first 24 h of admission were in the “room air subgroup,” and those who required any type of respiratory support (from low-flow nasal cannula (LFNC) up to non-invasive ventilation (NIV)) were in the “oxygen support subgroup.”
-
(3) Using county- and state-level epidemiologic data (50–53), patients were divided into Pre-Delta, Delta, or Omicron subgroups according to the predominant SARS-CoV-2 variant at the time of admission: Pre-Delta (before July 17, 2021), Delta (July 17, 2021 to November 23, 2021), or Omicron (November 24, 2021 to December 31, 2024) (Figure 1D).
2.5 Statistical analysis
Groups were compared by Mann–Whitney-U tests or Kruskal-Wallis tests for continuous variables. Groups were compared by Pearson Chi-squared tests for categorical variables.
To identify factors associated with risk of severe COVID-19, we calculated relative risks via Poisson regression with robust error variance (54). Exposures included demographic characteristics, comorbidities, baseline laboratory values, initial respiratory support, prior remdesivir use, and composite liver scores. To determine whether elevations in LFTs or composite liver scores were independently associated with risk of severe COVID-19, multivariable regression models were adjusted for the aforementioned exposures. Collinearity was defined as a variance inflation factor (VIF) > 10 or Pearson correlation coefficient ≥0.7 or ≤ − 0.7. Collinear variables were excluded from the multivariable models. Covariates with a VIF > 10 included age, BMI, hemoglobin, and albumin. As age and obesity/BMI have been frequently associated with COVID-19 outcome in prior literature (55–58), and are basic demographic information, we included age and BMI in the multivariable models. Albumin level has frequently been reported as associated with poor COVID-19 outcome (5, 57, 59, 60) and had a stronger effect size than hemoglobin level in our preliminary analysis (data not shown); therefore, albumin was included in the multivariable models whereas hemoglobin was excluded. While BUN and CKD data were collected in this cohort, we chose to adjust for creatinine in the multivariable models for the following reasons: (1) creatinine is used to define CKD, (2) creatinine captures both acute and chronic kidney injury/dysfunction, (3) creatinine was collinear with BUN (Pearson correlation coefficient = 0.75).
All LFT elevation categories had VIFs below 10 when included in the same regression model indicating that these LFT categories were not collinear with each other (data not shown). For composite liver scores (De Ritis ratio, FIB-4, NFS, APRI, or R index (i.e., liver pattern)), individual laboratory components of those scores (AST, ALT, AP, platelets, and/or albumin depending on the score of interest) are determined by disease pathology: their production and release from tissues are due to the underlying disease which the score is designed to measure. However other patient factors such as age, BMI, and DM act as effect modifiers, and modify the magnitude of the score. Therefore, for models with composite liver score variables, individual laboratory components of the composite liver scores were not included in the models separately, whereas modifying components were adjusted for separately. For example, the models with the categorical NFS variable (i.e., high, indeterminate or low NFS) were also adjusted for age, BMI, and comorbid DM, but were not adjusted for AST elevations, ALT elevations, platelets, or albumin. Using this strategy, VIFs of the covariates and mean model VIFs were similar across the individual LFT model and the composite liver score models, and VIFs of the composite liver score variables remained below 10. See each figure legend for details regarding covariates included in each multivariable model.
Variables with over 30% missingness (LDH, direct bilirubin, PT/INR, and GGT) were excluded from all multivariable models. CRP and d-dimer also had over 30% missingness in our cohort, and only 41 and 30% of Omicron patients had available CRP and d-dimer data, respectively; therefore, CRP and d-dimer were also excluded from the main multivariable models. However, CRP and d-dimer have been reported in the literature as associated with poor COVID-19 outcomes (8, 57, 60–62). Therefore, we performed a sensitivity analysis in which the multivariable models described above were also adjusted for CRP and d-dimer; thus, the multivariable models in the sensitivity analysis (Supplementary Figure S1) only included patients with available data for CRP, d-dimer, and the other covariates described above.
The fit and discriminatory ability of the multivariable regression models were compared via the area under the receiver operating characteristic (ROC) curve and Akaike Information Criterion (AIC).
Statistical significance was set at p < 0.05 for all analyses. Analyses were performed using STATA SE (StataCorp LLC, College Station, TX, USA).
3 Results
3.1 Baseline characteristics
Of the 58,534 non-pregnant adult patients admitted during the study period, 4,565 were admitted with non-severe laboratory-confirmed COVID-19 diagnosed within the first 24 h of admission or earlier (Figure 1A).
Figure 1

Flowchart of study cohort and subgroups. (A) Flow chart of patients excluded and included in the total cohort. (B) Separation of cohort into subgroups based on history of liver disease, viral hepatitis, or receipt of remdesivir. (C) Separation of cohort into subgroups based on the maximum level of respiratory support within the first 24 h of admission. (D) Definition of variant-predominant periods based on dates. PCR, polymerase chain reaction; LFNC, low-flow nasal cannula; HFNC, high-flow nasal cannula; NIV, non-invasive ventilation.
Baseline characteristics of the cohort, including demographics and baseline level of respiratory support at admission are shown in Table 1. The study cohort had a median age of 55 years, was predominantly male, and the majority identified as White race and Hispanic ethnicity. The most common comorbidities were DM and hypertension. 1764 patients (38.6%) did not require oxygen support within the first 24 h of admission. Among those requiring supplemental oxygen at admission, LFNC was the modality most frequently used. Only 1.0% received remdesivir prior to laboratory testing. During the study period, 2,293 patients (50.2%), 820 patients (18.0%), and 1,452 patients (31.8%) were admitted during the Pre-Delta, Delta, and Omicron variant-predominant periods, respectively (Figure 1D and Table 1). Overall, 16.8% of patients (N = 766) developed severe COVID-19 and 11.5% (N = 525) died (Table 1). Among the surviving patients who met the definition of severe COVID-19 based on receiving organ support at some point during their admission (N = 241), 68.9% (N = 166) met the mechanical ventilation criterion, 3.7% (N = 9) met the ECMO criterion, 12.9% (N = 31) met the CRRT criterion, and 84.6% (N = 204) met the intravenous vasopressors or inotropes criterion. Since CRRT and ECMO start dates and times were not available, we explored which other severe COVID-19 criteria were met (if any) for patients requiring CRRT and/or ECMO. All patients who required ECMO also required mechanical ventilation and vasopressors starting at least 1 day after admission. However, 3 patients were defined as developing severe COVID-19 based solely on the CRRT criterion, as they required CRRT but did not meet any other severe COVID-19 criteria during their admission (data not shown).
Table 1
| Total 4,565 (100.0%) |
Non-severe COVID-19 3,799 (83.2%) |
Severe COVID-19766 (16.8%) | p-valuea | |
|---|---|---|---|---|
| Age | 55 (43–65) (N = 4,565) | 54 (42–64) | 61 (49–70) | <0.001* |
| Sex Female Male | 1,894 (41.5%)2,671 (58.5%) | 1,607 (42.3%)2,192 (57.7%) | 287 (37.5%)479 (62.5%) | 0.013* |
| Race White Black Asian Native American/Alaska Native Other Pacific Islander Unknown | 3,280 (71.9%)1,111 (24.3%)88 (1.9%)11 (0.2%)14 (0.3%)61 (1.3%) | 2,673 (70.4%)983 (25.9%)70 (1.8%)8 (0.2%)13 (0.3%)52 (1.4%) | 607 (79.2%)128 (16.7%)18 (2.3%)3 (0.4%)1 (0.1%)9 (1.2%) | <0.001* |
| Ethnicity Not Hispanic Hispanic Unknown | 1,749 (38.3%)2,748 (60.2%)68 (1.5%) | 1,521 (40.0%)2,215 (58.3%)63 (1.7%) | 228 (29.8%)533 (69.6%)5 (0.7%) | <0.001* |
| BMI | 29 (25–35) (N = 4,523) | 29 (25–34) | 30 (26–37) | <0.001* |
| Previous CV complications | 1,122 (24.6%) | 877 (23.1%) | 245 (32.0%) | <0.001* |
| HTN | 1,857 (40.7%) | 1,541 (40.6%) | 316 (41.3%) | 0.723 |
| Respiratory disease | 928 (20.3%) | 708 (18.6%) | 220 (28.7%) | <0.001* |
| DM | 2,201 (48.2%) | 1,783 (46.9%) | 418 (54.6%) | <0.001* |
| CKD | 1,142 (25.0%) | 912 (24.0%) | 230 (30.0%) | <0.001* |
| Cancer | 405 (8.9%) | 310 (8.2%) | 95 (12.4%) | <0.001* |
| Liver disease | 768 (16.8%) | 551 (14.5%) | 217 (28.3%) | <0.001* |
| History of viral hepatitis | 248 (5.4%) | 206 (5.4%) | 42 (5.5%) | 0.946 |
| HIV | 165 (3.6%) | 142 (3.7%) | 23 (3.0%) | 0.320 |
| Rheumatologic disease | 128 (2.8%) | 105 (2.8%) | 23 (3.0%) | 0.715 |
| Dementia | 230 (5.0%) | 176 (4.6%) | 54 (7.0%) | 0.005* |
| Paralysis | 118 (2.6%) | 93 (2.4%) | 25 (3.3%) | 0.194 |
| Maximum level of respiratory support (within first 24 h of admission) Room Air LFNC HFNC NIV | 1,764 (38.6%)2,117 (46.4%)523 (11.5%)161 (3.5%) | 1,635 (43.0%)1,775 (46.7%)264 (6.9%)125 (3.3%) | 129 (16.8%)342 (44.6%)259 (33.8%)36 (4.7%) | <0.001* |
| Remdesivir at least 1 day prior to lab collection | 46 (1.0%) | 38 (1.0%) | 8 (1.0%) | 0.911 |
| Variant-predominant period Pre-Delta Delta Omicron | 2,293 (50.2%)820 (18.0%)1,452 (31.8%) | 1,865 (49.1%)644 (17.0%)1,290 (34.0%) | 428 (55.9%)176 (23.0%)162 (21.1%) | <0.001* |
| COVID-19 progression | ||||
| Died | 525 (11.5%) | 0 (0.0%) | 575 (75.1%) | N/Ab |
| ICU | 743 (16.3%) | 168 (4.4%) | 525 (68.5%) | <0.001* |
| LOS | 7 (4–13) (N = 4,565) | 6 (4–10) | 23 (12–43) | <0.001* |
Study cohort baseline characteristics and COVID-19 outcome.
Mann-Whitney U test for continuous variables; Chi2 test for categorical variables.
Part of severe COVID-19 definition.
Percentages may not add up to 100% due to rounding. Continuous variables are reported as median (interquartile range). Categorical variables are reported as N (%). An asterisk (*) indicates statistical significance (p < 0.05). BMI, body mass index; CV, cardiovascular; HTN, hypertension; DM, diabetes mellitus; CKD, chronic kidney disease; HIV, human immunodeficiency virus; LFNC, low-flow nasal cannula; HFNC, high-flow nasal cannula; NIV, non-invasive ventilation; ICU, intensive care unit; LOS, length of stay.
Baseline laboratory results and composite liver scores are shown in Tables 2, 3, respectively. Among patients with LFTs collected, elevations in AST, ALT, AP, and total bilirubin occurred in 52.8, 36.0, 20.4, and 10.7% of the cohort, respectively (Table 2). Less than 10% of the cohort had available direct bilirubin results and less than 1% had available GGT results. Of those who had direct bilirubin or GGT results, the majority had elevated values. FIB-4, APRI, NFS, and the De Ritis ratio were categorized as high in more than 20% of our cohort (Table 3). Per the R index, LFTs were of cholestatic pattern in more than 75% of patients. In general, elevated LFTs and composite liver scores were more frequent in severe COVID-19 compared to non-severe COVID-19 patients, respectively (Tables 2, 3).
Table 2
| Total 4,565 (100.0%) |
Non-severe COVID-193,799 (83.2%) | Severe COVID-19766 (16.8%) | p-valuea | |
|---|---|---|---|---|
| AST (U/L) | 42 (28–68) (N = 4,286) | 40 (27–64) | 55 (36–87) | <0.001* |
| AST Elevations Normal Mild Moderate Severe | 2,024 (47.2%)1,898 (44.3%)321 (7.5%)43 (1.0%) | 1,792 (50.6%)1,481 (41.8%)235 (6.6%)31 (0.9%) | 232 (31.1%)417 (55.8%)86 (11.5%)12 (1.6%) | <0.001* |
| ALT (U/L) | 30 (19–52) (N = 4,297) | 29 (18–51) | 35 (22–56) | <0.001* |
| ALT Elevations Normal Mild Moderate Severe | 2,750 (64.0%)1,289 (30.0%)235 (5.5%)23 (0.5%) | 2,315 (65.2%)1,031 (29.0%)186 (5.2%)18 (0.5%) | 435 (58.2%)258 (34.5%)49 (6.6%)5 (0.7%) | 0.004* |
| AP (U/L) | 91 (71–120) (N = 4,296) | 90 (71–119) | 93 (71–129) | 0.076 |
| AP Elevation Normal Elevated | 3,420 (79.6%)876 (20.4%) | 2,853 (80.4%)696 (19.6%) | 567 (75.9%)180 (24.1%) | 0.006* |
| Total Bilirubin (mg/dL) | 0.5 (0.3–0.7) (N = 4,297) | 0.5 (0.3–0.7) | 0.5 (0.4–0.8) | <0.001* |
| Total Bilirubin Elevation Normal Elevated | 3,838 (89.3%)459 (10.7%) | 3,184 (89.7%)366 (10.3%) | 654 (87.6%)93 (12.4%) | 0.085 |
| Direct Bilirubin (mg/dL) | 0.8 (0.5–1.3) (N = 447) | 0.7 (0.4–1.2) | 1.0 (0.6–1.5) | <0.001* |
| Direct Bilirubin Elevation Normal Elevated | 34 (7.6%)413 (92.4%) | 31 (8.8%)322 (91.2%) | 3 (3.2%)91 (96.8%) | 0.069 |
| GGT (U/L) | 138 (37–254) (N = 42) | 157 (36–322) | 65 (53–227) | 0.592 |
| GGT Elevation Normal Elevated | 13 (31.0%)29 (69.0%) | 10 (30.3%)23 (69.7%) | 3 (33.3%)6 (66.7%) | 0.862 |
| Creatinine (mg/dL) | 0.94 (0.72–1.38) (N = 4,556) | 0.93 (0.72–1.35) | 1.03 (0.77–1.57) | <0.001* |
| CRP (mg/dL) | 9 (4–16) (N = 3,144) | 8 (4–15) | 13 (8–21) | <0.001* |
| D-dimer (mcg/mL) | 0.85 (0.53–1.54) (N = 2,749) | 0.84 (0.52–1.50) | 0.95 (0.59–1.69) | <0.001* |
| Albumin (g/dL) | 3.7 (3.4–4.0) (N = 4,299) | 3.8 (3.4–4.1) | 3.5 (3.2–3.8) | <0.001* |
| Hemoglobin (g/dL) | 13.2 (11.2–14.7) (N = 4,552) | 13.1 (11.2–14.6) | 13.4 (11.3–15.0) | 0.018* |
| Platelets (x10^9/L) | 225 (170–293) (N = 4,552) | 229 (173–301) | 208 (155–268) | <0.001* |
| BUN (mg/dL) | 16 (11–26) (N = 4,554) | 15 (10–24) | 20 (13–35) | <0.001* |
| LDH (U/L) | 361 (262–469) (N = 554) | 344 (255–441) | 455 (336–617) | <0.001* |
| INR | 1.2 (1.1–1.4) (N = 1,084) | 1.2 (1.1–1.4) | 1.2 (1.1–1.4) | 0.014* |
| PT (seconds) | 13.7 (12.4–15.7) (N = 1,084) | 13.6 (12.3–15.5) | 13.8 (12.8–16.6) | 0.020* |
Baseline laboratory results (within 24 h of admission).
Mann-Whitney U test for continuous variables; Chi2 test for categorical variables.
Percentages may not add up to 100% due to rounding. Continuous variables are reported as median (interquartile range). Categorical variables are reported as N (%). An asterisk (*) indicates statistical significance (p < 0.05). AST, aspartate aminotransferase; ALT, alanine aminotransferase; AP, alkaline phosphatase; GGT, gamma-glutamyl transferase; CRP=C-reactive protein; BUN, blood urea nitrogen; LDH, lactate dehydrogenase; INR, international normalized ratio; PT, prothrombin time.
Table 3
| Total 4,565 (100.0%) |
Non-severe COVID-19 3,799 (83.2%) |
Severe COVID-19766 (16.8%) | p-valuea | |
|---|---|---|---|---|
| FIB-4 | 1.87 (1.11–3.22) (N = 4,282) | 1.72 (1.02–2.95) | 2.71 (1.71–4.45) | <0.001* |
| FIB-4 risk categories Low Indeterminate High | 1,323 (30.9%)1,555 (36.3%)1,404 (32.8%) | 1,216 (34.4%)1,295 (36.6%)1,024 (29.0%) | 107 (14.3%)260 (34.8%)380 (50.9%) | <0.001* |
| NFS | −0.09 (−1.58–1.35) (N = 4,238) | −0.28 (−1.82–1.13) | 0.84 (−0.56–2.15) | <0.001* |
| NFS risk categories Low Indeterminate High | 1,133 (26.7%)1,595 (37.6%)1,510 (35.6%) | 1,038 (29.7%)1,345 (38.5%)1,112 (31.8%) | 95 (12.8%)250 (33.6%)398 (53.6%) | <0.001* |
| APRI | 0.49 (0.28–0.88) (N = 4,282) | 0.46 (0.27–0.80) | 0.70 (0.39–1.16) | <0.001* |
| APRI risk categories Low Intermediate High | 2,174 (50.8%)1,200 (28.0%)908 (21.2%) | 1,918 (54.3%)946 (26.8%)671 (19.0%) | 256 (34.3%)254 (34.0%)237 (31.7%) | <0.001* |
| De Ritis Ratio | 1.40 (1.03–1.92) (N = 4,286) | 1.35 (1.00–1.87) | 1.61 (1.20–2.18) | <0.001* |
| De Ritis ratio cutoff categories <1 1–2 >2 | 939 (21.9%)2,431 (56.7%)916 (21.4%) | 834 (23.6%)2,015 (56.9%)690 (19.5%) | 105 (14.1%)416 (55.7%)226 (30.3%) | <0.001* |
| LFT pattern Mixed Hepatocellular Cholestatic | 852 (19.8%)164 (3.8%)3,279 (76.3%) | 690 (19.4%)130 (3.7%)2,728 (76.9%) | 162 (21.7%)34 (4.6%)551 (73.8%) | 0.163 |
Composite liver scores within 24 h of admission.
Mann-Whitney U test for continuous variables; Chi2 test for categorical variables.
Percentages may not add up to 100% due to rounding. Continuous variables are reported as median (interquartile range). Categorical variables are reported as N (%). An asterisk (*) indicates statistical significance (p < 0.05). FIB-4, fibrosis-4 index; NFS, non-alcoholic fatty liver disease fibrosis score; APRI, AST to platelet ratio index; LFT, liver function test.
3.2 Association of elevated LFTs and liver scores with risk of severe COVID-19
3.2.1 Total cohort: univariable regression
Univariable regression showed that age, male sex, Hispanic ethnicity, BMI, history of cardiovascular complications, pre-existing respiratory disease, DM, CKD, cancer, liver disease, dementia, higher level of baseline respiratory support, decreases in albumin, decreases in platelets, and increases in CRP, d-dimer, hemoglobin, INR, BUN, and LDH at admission were associated with increased risk of severe disease in our cohort (Supplementary Table S2). Among LFTs, AST elevations were associated with severe COVID-19 in a dose-dependent manner (RRs of 1.92, 2.34, and 2.43 for mild, moderate, and severe AST elevations, respectively). Mildly and moderately elevated ALT as well as elevated AP were also associated with severe COVID-19, although to a lesser degree (RRs < 1.4). Among liver scores, elevations in the De Ritis ratio, FIB-4, APRI, and NFS were associated with dose-dependent increases in risk of severe COVID-19, with high FIB-4 and high NFS having the greatest effect size (high FIB-4 RR: 3.35, 95% CI 2.74–4.09; high NFS RR: 3.14, 95% CI 2.55–3.88).
3.2.2 Total cohort: adjusted relative risks of severe COVID-19
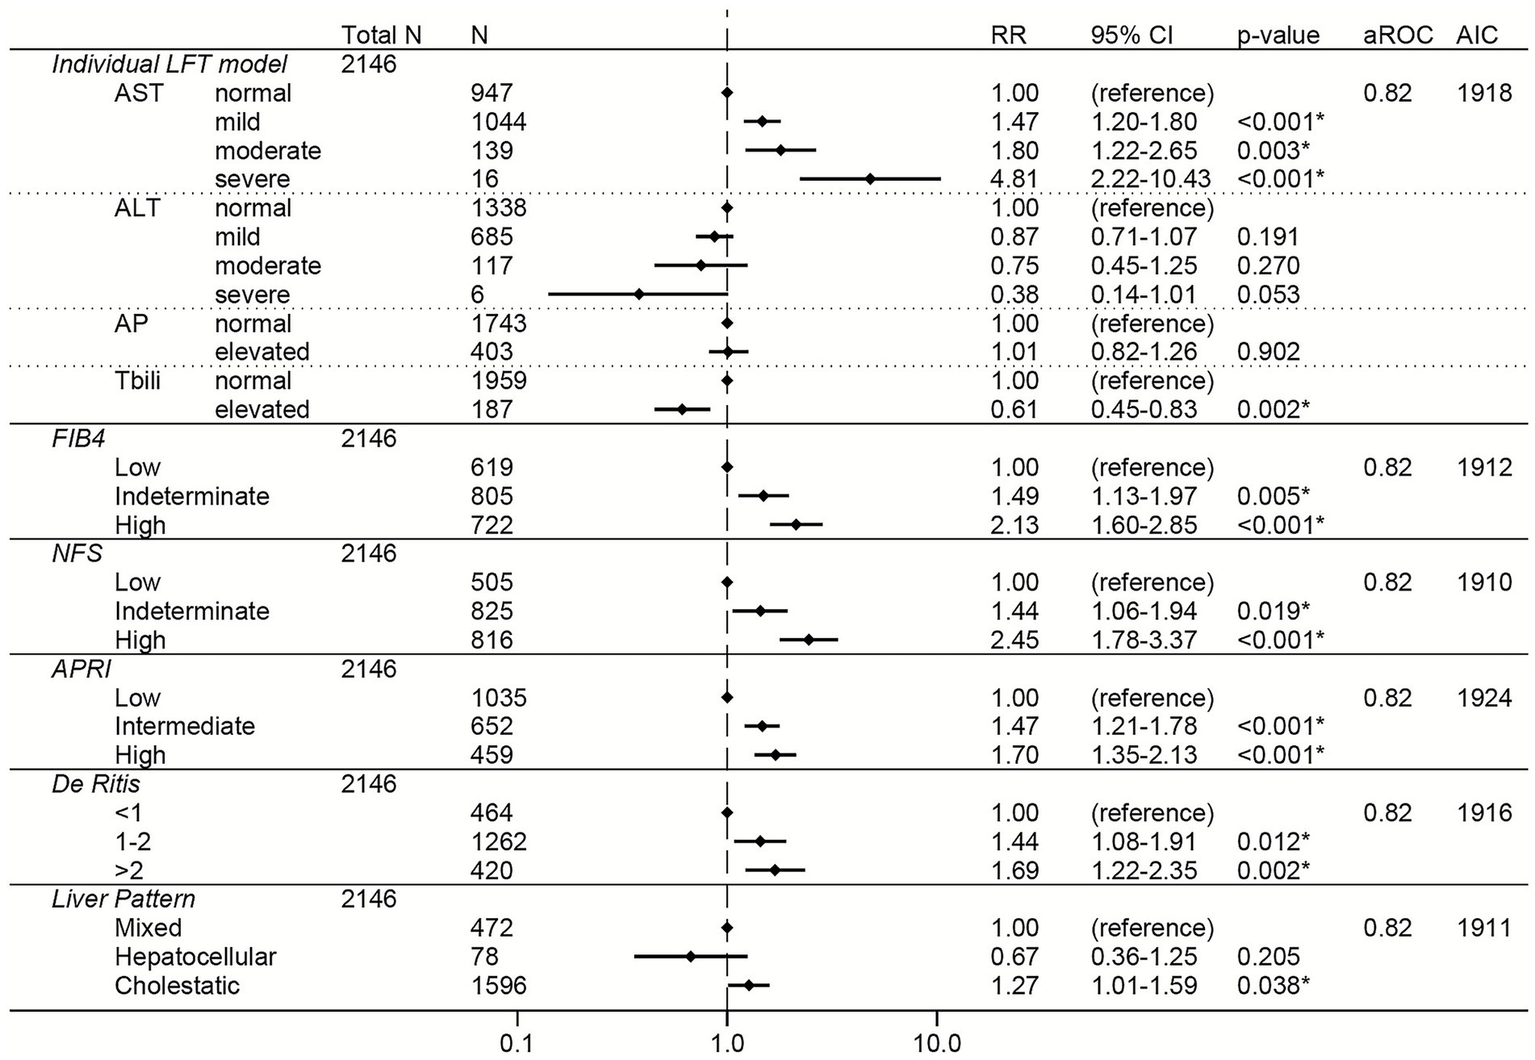
Among the total cohort, elevations in AST were associated with dose-dependent increased risk of severe COVID-19 (RRs of 1.43, 1.78, and 3.27 for mild, moderate, and severe AST elevations, respectively; Figure 2). Elevations in the non-invasive liver fibrosis scores (FIB-4, NFS, and APRI) were all independently associated with dose-dependent increases in risk of severe COVID-19 (Figure 2), with high FIB4 (RR 2.25, 95% CI 1.81–2.79) and high NFS (RR 2.33, 95% CI 1.83–2.97) having the greatest effect sizes. De Ritis ratio >2 was also associated with increased risk of severe COVID-19, although with a smaller effect size (RR 1.38, 95% CI 1.11–1.71). AP elevations, ALT elevations, total bilirubin elevations, and LFT pattern were not associated with risk of severe COVID-19 (Figure 2).
Figure 2

Forest plots of relative risks of severe COVID-19 in the total cohort. All models are adjusted for age, sex, race, ethnicity, body mass index, comorbidities (hypertension, cardiovascular complications, respiratory disease, diabetes mellitus, cancer, liver disease, viral hepatitis, HIV, rheumatologic disease, dementia, paralysis), baseline level of respiratory support, remdesivir prior to lab collection, and creatinine. The individual LFT model was also adjusted for albumin and platelets. The FIB-4 model was also adjusted for albumin, AP elevations, and total bilirubin elevations. The NFS model was also adjusted for AP elevations and total bilirubin elevations. The APRI model was also adjusted for ALT elevations, AP elevations, total bilirubin elevations, and albumin. The De Ritis model was also adjusted for AP elevations, total bilirubin elevations, albumin, and platelets. The liver pattern model was also adjusted for AST elevations, total bilirubin elevations, albumin, and platelets. An asterisk (*) indicates statistical significance (p < 0.05). AST, aspartate aminotransferase, ALT, alanine aminotransferase, AP, alkaline phosphatase, Tbili, total bilirubin; FIB4, fibrosis-4 index; NFS, non-alcoholic fatty liver disease fibrosis score; APRI, AST to platelet ratio index; RR, relative risk; aROC, area under the receiver operating characteristic curve; AIC, Akaike Information Criterion; CI, confidence interval.
The sensitivity analysis adjusting for CRP and d-dimer in addition to the other covariates had fewer observations (N = 2,500) but showed similar relationships between LFTs or composite liver scores and risk of severe COVID-19 (Supplementary Figure S1). High FIB-4 had the greatest effect size in this sensitivity analysis (RR 2.50, 95% CI 1.93–3.25).
3.2.3 Non-liver disease subgroup
History of liver disease and viral hepatitis were present in 16.8 and 5.4% of the patients, respectively (Table 1). Elevated levels of AST, ALT, AP, total bilirubin, direct bilirubin, FIB-4, NFS, APRI, and the De Ritis ratio at admission were significantly more frequent in the liver disease subgroup compared to the non-liver disease subgroup (Supplementary Table S3). Among the composite liver scores, NFS was the most frequently elevated in the liver disease subgroup (N = 725, 80.2%) and the De Ritis ratio was the most frequently elevated in the non-liver disease subgroup (N = 2,613; 77.6%).
Similar to the total cohort, elevations in AST, FIB-4, NFS, APRI, and the De Ritis ratio were associated with increased risk of severe COVID-19 in the non-liver disease subgroup in both the unadjusted (Supplementary Table S4) and adjusted (Figure 3) models. The greatest adjusted effect sizes were observed for high FIB-4 (RR 2.85, 95% CI 2.18–3.72) and high NFS (RR 2.50, 95% CI 1.85–3.39) (Figure 3).
Figure 3

Forest plots of relative risks of severe COVID-19 in the non-liver disease subgroup (i.e., excluding patients with a history of liver disease, viral hepatitis, or receipt of remdesivir prior to lab collection). All models are adjusted for age, sex, race, ethnicity, body mass index, comorbidities (hypertension, cardiovascular complications, respiratory disease, diabetes mellitus, cancer, HIV, rheumatologic disease, dementia, paralysis), baseline level of respiratory support, and creatinine. The individual LFT model was also adjusted for albumin and platelets. The FIB-4 model was also adjusted for albumin, AP elevations, and total bilirubin elevations. The NFS model was also adjusted for AP elevations and total bilirubin elevations. The APRI model was also adjusted for ALT elevations, AP elevations, total bilirubin elevations, and albumin. The De Ritis model was also adjusted for AP elevations, total bilirubin elevations, albumin, and platelets. The liver pattern model was also adjusted for AST elevations, total bilirubin elevations, albumin, and platelets. An asterisk (*) indicates statistical significance (p < 0.05). AST, aspartate aminotransferase, ALT, alanine aminotransferase, AP, alkaline phosphatase, Tbili, total bilirubin; FIB4, fibrosis-4 index; NFS, non-alcoholic fatty liver disease fibrosis score; APRI, AST to platelet ratio index; RR, relative risk; aROC, area under the receiver operating characteristic curve; AIC, Akaike Information Criterion; CI, confidence interval.
3.2.4 Room air subgroup
Elevations in AST and ALT were more frequent in the oxygen support subgroup (61.4 and 42.2%, respectively) compared to the room air subgroup (38.2 and 25.6%, respectively) (Supplementary Table S5). Conversely, elevations in AP and total bilirubin were more frequent in the room air subgroup (26.0 and 15.5%, respectively) compared to the oxygen support subgroup (17.0 and 7.8%, respectively) (Supplementary Table S5). FIB-4, NFS, and APRI elevations were more frequent in the oxygen support subgroup (75.0, 78.3, and 55.7%, respectively) compared to the room air subgroup (59.1, 64.6, and 38.3%, respectively).
The room air subgroup showed similar unadjusted results as observed in the unadjusted models for the total cohort and non-liver disease subgroups (Supplementary Table S6). However, in the adjusted models, only high NFS (RR 2.28, 95% CI 1.20–4.33) remained independently associated with increased risk of severe COVID-19 in the room air subgroup (Figure 4).
Figure 4

Forest plots of relative risks of severe COVID-19 in the room air subgroup (i.e., after excluding those patients who required respiratory support within the first 24 h of admission). All models are adjusted for age, sex, race, ethnicity, body mass index, comorbidities (hypertension, cardiovascular complications, respiratory disease, diabetes mellitus, cancer, liver disease, viral hepatitis, HIV, rheumatologic disease, dementia, paralysis), remdesivir prior to lab collection, and creatinine. The individual LFT model was also adjusted for albumin and platelets. The FIB-4 model was also adjusted for albumin, AP elevations, and total bilirubin elevations. The NFS model was also adjusted for AP elevations and total bilirubin elevations. The APRI model was also adjusted for ALT elevations, AP elevations, total bilirubin elevations, and albumin. The De Ritis model was also adjusted for AP elevations, total bilirubin elevations, albumin, and platelets. The liver pattern model was also adjusted for AST elevations, total bilirubin elevations, albumin, and platelets. An asterisk (*) indicates statistical significance (p < 0.05). AST, aspartate aminotransferase, ALT, alanine aminotransferase, AP, alkaline phosphatase, Tbili, total bilirubin; FIB4, fibrosis-4 index; NFS, non-alcoholic fatty liver disease fibrosis score; APRI, AST to platelet ratio index; RR, relative risk; aROC, area under the receiver operating characteristic curve; AIC, Akaike Information Criterion; CI, confidence interval.
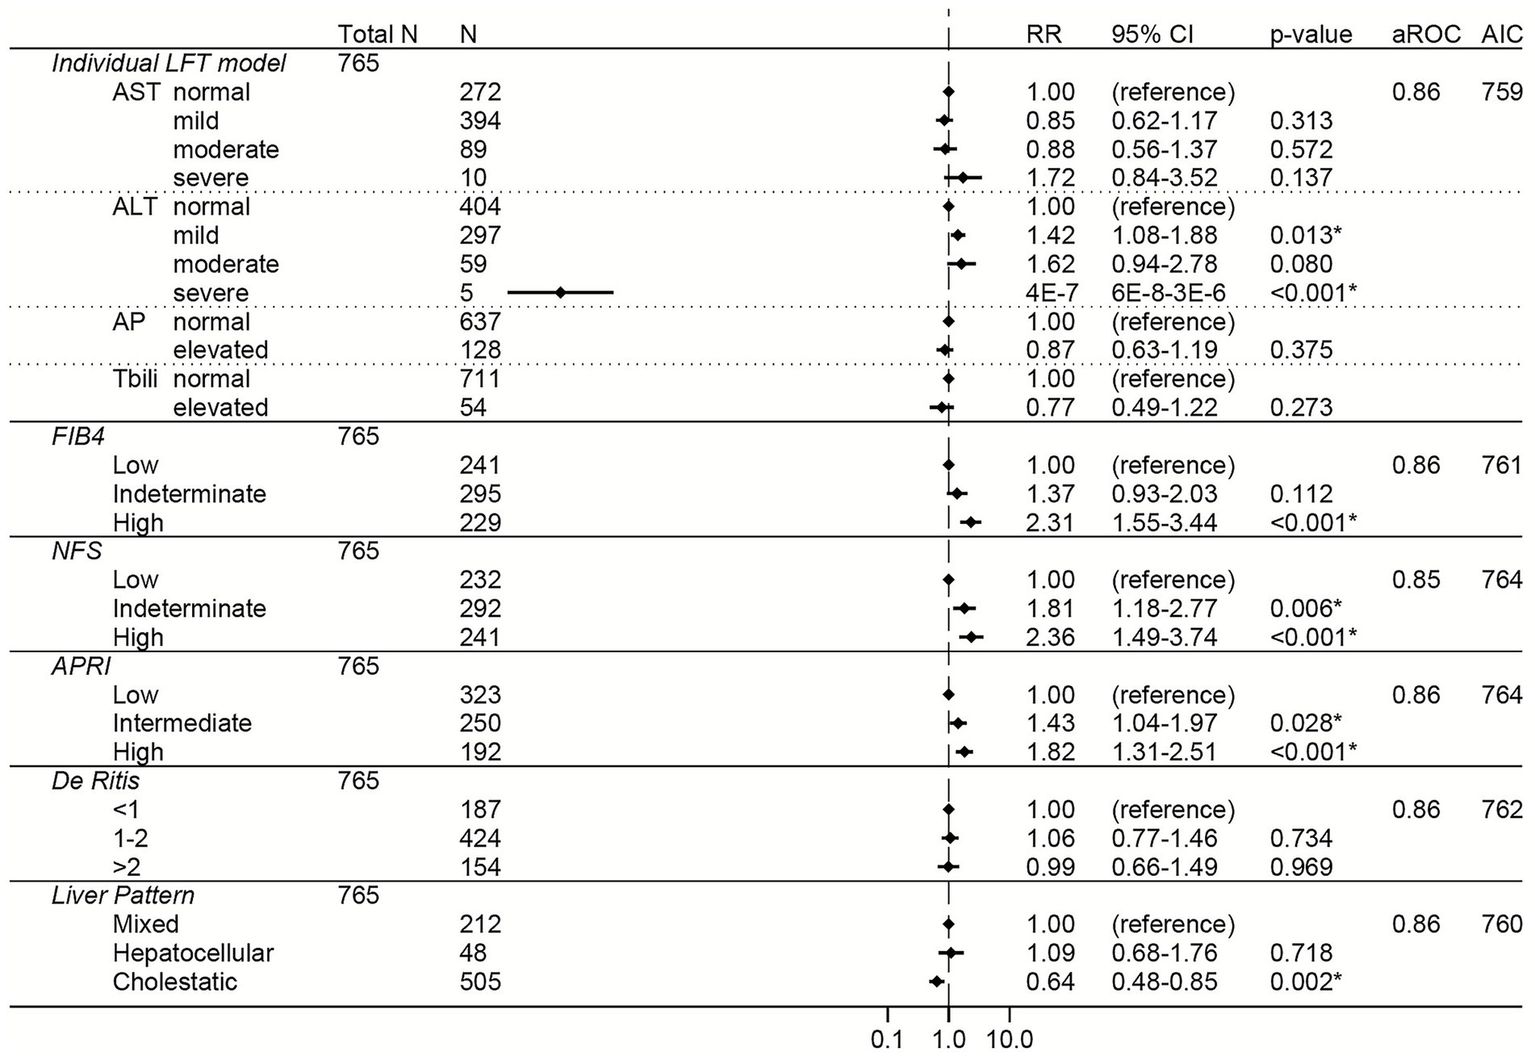
3.2.5 Variant-predominant subgroups
Among the COVID-19 variant-predominant periods, AST and ALT elevations were most frequent in the Delta period (64.6 and 47.2%, respectively) whereas AP and total bilirubin elevations were most frequent in the Omicron period (25.3 and 15.5%, respectively) (Supplementary Table S7). FIB-4, the De Ritis ratio, APRI, and NFS were frequently elevated across the variant subgroups: each of these scores were elevated in at least 40% of patients in each variant subgroup. All three variants showed a predominantly cholestatic pattern of LFTs (over 65% of patients in each variant subgroup).
Elevations in AST, FIB-4, APRI, NFS, and the De Ritis ratio were associated with increased risk of severe COVID-19 across all three variant-predominant periods in the unadjusted models (Supplementary Table S8). The results from the adjusted models are shown for the Pre-Delta period in Figure 5, the Delta period in Figure 6, and the Omicron period in Figure 7. In the adjusted models, mild and moderate elevations in AST were associated with increased risk of severe COVID-19 during the Pre-Delta and Omicron periods (Figures 5, 7) (RRs ≥ 1.47, 95% CI lower bounds ≥1.06), but not during the Delta period (Figure 6). During the Delta period, mildly elevated ALT was associated with increased risk of severe COVID-19 (N = 297, RR 1.42, 95% CI 1.08–1.88) but severely elevated ALT was associated with reduced risk of severe COVID-19 (N = 5, RR 4E−7, 95% CI 6E−8 – 3E−6). Elevated total bilirubin was associated with reduced risk of severe COVID-19 during the Pre-Delta period (RR 0.61, 95% 0.45–0.83), but not during the Delta or Omicron periods.
Figure 5
Forest plots of relative risks of severe COVID-19 during the Pre-Delta period. All models are adjusted for age, sex, race, ethnicity, body mass index, comorbidities (hypertension, cardiovascular complications, respiratory disease, diabetes mellitus, cancer, liver disease, viral hepatitis, HIV, rheumatologic disease, dementia, paralysis), baseline level of respiratory support, remdesivir prior to lab collection, and creatinine. The individual LFT model was also adjusted for albumin and platelets. The FIB-4 model was also adjusted for albumin, AP elevations, and total bilirubin elevations. The NFS model was also adjusted for AP elevations and total bilirubin elevations. The APRI model was also adjusted for ALT elevations, AP elevations, total bilirubin elevations, and albumin. The De Ritis model was also adjusted for AP elevations, total bilirubin elevations, albumin, and platelets. The liver pattern model was also adjusted for AST elevations, total bilirubin elevations, albumin, and platelets. An asterisk (*) indicates statistical significance (p < 0.05). AST, aspartate aminotransferase, ALT, alanine aminotransferase, AP, alkaline phosphatase, Tbili, total bilirubin; FIB4, fibrosis-4 index; NFS, non-alcoholic fatty liver disease fibrosis score; APRI, AST to platelet ratio index; RR, relative risk; aROC, area under the receiver operating characteristic curve; AIC, Akaike Information Criterion; CI, confidence interval.
Figure 6
Forest plots of relative risks of severe COVID-19 during the Delta period. All models are adjusted for age, sex, race, ethnicity, body mass index, comorbidities (hypertension, cardiovascular complications, respiratory disease, diabetes mellitus, cancer, liver disease, viral hepatitis, HIV, rheumatologic disease, dementia, paralysis), baseline level of respiratory support, remdesivir prior to lab collection, and creatinine. The individual LFT model was also adjusted for albumin and platelets. The FIB-4 model was also adjusted for albumin, AP elevations, and total bilirubin elevations. The NFS model was also adjusted for AP elevations and total bilirubin elevations. The APRI model was also adjusted for ALT elevations, AP elevations, total bilirubin elevations, and albumin. The De Ritis model was also adjusted for AP elevations, total bilirubin elevations, albumin, and platelets. The liver pattern model was also adjusted for AST elevations, total bilirubin elevations, albumin, and platelets. An asterisk (*) indicates statistical significance (p < 0.05). AST, aspartate aminotransferase, ALT, alanine aminotransferase, AP, alkaline phosphatase, Tbili, total bilirubin; FIB4, fibrosis-4 index; NFS, non-alcoholic fatty liver disease fibrosis score; APRI, AST to platelet ratio index; RR, relative risk; aROC, area under the receiver operating characteristic curve; AIC, Akaike Information Criterion; CI, confidence interval.
Figure 7

Forest plots of relative risks of severe COVID-19 during the Omicron period. All models are adjusted for age, sex, race, ethnicity, body mass index, comorbidities (hypertension, cardiovascular complications, respiratory disease, diabetes mellitus, cancer, liver disease, viral hepatitis, HIV, rheumatologic disease, dementia, paralysis), baseline level of respiratory support, remdesivir prior to lab collection, and creatinine. The individual LFT model was also adjusted for albumin and platelets. The FIB-4 model was also adjusted for albumin, AP elevations, and total bilirubin elevations. The NFS model was also adjusted for AP elevations and total bilirubin elevations. The APRI model was also adjusted for ALT elevations, AP elevations, total bilirubin elevations, and albumin. The De Ritis model was also adjusted for AP elevations, total bilirubin elevations, albumin, and platelets. The liver pattern model was also adjusted for AST elevations, total bilirubin elevations, albumin, and platelets. An asterisk (*) indicates statistical significance (p < 0.05). AST, aspartate aminotransferase, ALT, alanine aminotransferase, AP, alkaline phosphatase, Tbili, total bilirubin; FIB4, fibrosis-4 index; NFS, non-alcoholic fatty liver disease fibrosis score; APRI, AST to platelet ratio index; RR, relative risk; aROC, area under the receiver operating characteristic curve; AIC, Akaike Information Criterion; CI, confidence interval.
Among the liver scores, high FIB-4 and intermediate APRI were independently associated with increased risk of severe COVID-19 across all periods, with high FIB-4 having the strongest association (high FIB-4 RRs ≥ 1.68 and 95% CI lower bounds ≥ 1.02 for all variants) (Figures 5–7).
3.3 Comparison of model performance
To directly compare the performance of the LFT and liver score models to each other, the area under the ROC and the AIC were calculated for each model (Figures 2–7; Supplementary Figure S1). In general, the models had similar outcome discrimination as assessed by area under ROCs, although NFS tended to have slightly lower area under ROCs compared to the other models. The FIB-4 models tended to have better (lower) AICs compared to the individual LFT, APRI, De Ritis ratio, and liver pattern models.
4 Discussion
Among our cohort, LFT and composite liver score elevations within 24 h of admission were common, with elevations in AST and the non-invasive liver fibrosis scores (FIB-4, NFS, and APRI) showing consistent and independent associations with severe COVID-19 in the total cohort and even in the non-liver disease subgroup (i.e., patients without pre-existing liver disease, a history of viral hepatitis, or receipt of remdesivir before baseline labs were collected). This is consistent with previous data from early studies in the pandemic (5, 14, 19–23, 25, 42, 63–71).
However, COVID-19 has changed over time with the emergence of new variants and changes in clinical practice, with poor outcomes becoming less common than early in the pandemic (26–29, 31–33, 47–49, 72, 73). Instead, it is becoming increasingly more common for COVID-19 patients to present without hypoxia and to not require oxygen at admission (28, 47, 48, 73). Ours is one of a handful of studies that investigated the association of composite liver scores with COVID-19 outcome across the different COVID-19 waves or variant-predominant periods (19, 20, 26). Furthermore, ours is one of a few studies to investigate the associations of composite liver scores with COVID-19 outcome with a focus on patients who did not require respiratory support or who did not have hypoxia at admission (15). As our cohort includes data collected as recently as December 31, 2024, our study is ideal to assess whether admission LFTs and/or composite liver scores can identify patients at increased risk of severe COVID-19 during the current COVID-19 era.
Here, we show that even in the face of these changes in COVID-19 variants and presentation over time, elevated non-invasive liver fibrosis scores at admission are associated with increased risk of severe COVID-19. It is possible that these associations may in part be due to undiagnosed liver fibrosis. However, we used a broad set of ICD-10 codes to define those with pre-existing liver disease, which included fatty liver, fibrosis, and cirrhosis, among other diagnoses (Supplementary Table S1). Even after excluding those who met a broad definition of pre-existing liver disease and/or had a history of viral hepatitis, non-invasive liver fibrosis scores remained associated with severe COVID-19 in the non-liver disease subgroup. Furthermore, the strength of the associations across all analyses, large proportion of patients in the cohort with elevated non-invasive liver fibrosis scores (over 45%), and aforementioned studies suggest that non-invasive liver fibrosis scores (FIB-4, NFS, and APRI) are independently associated with increased risk of severe COVID-19 regardless of pre-existing liver fibrosis (14, 19–23, 25, 26, 42, 63–71).
The FIB-4 models generally had the best combination of discriminatory power, effect size, and fit; however, the differences between the effect size and discriminatory power of the NFS and APRI models compared to the FIB-4 models were slight. This suggests that the differences between the FIB-4, NFS, and APRI models compared to each other are mainly statistical due to the slightly better fit of the FIB-4 models to the data analyzed here. Therefore, non-invasive liver fibrosis scores measured at admission may be useful tools for clinicians in the current COVID-19 era to identify COVID-19 patients at high risk of progressing to severe disease who may benefit from a higher level of care early during their admission.
As our data show, liver dysfunction in COVID-19 continues to be associated with risk of COVID-19 severity even as the virus evolves. However, the underlying mechanism of COVID-19-associated liver injury is complex and still not fully understood. It has been suggested that SARS-CoV-2 can directly infect liver progenitor cells, cholangiocytes, and hepatocytes, partially mediated by the presence of angiotensin-converting enzyme 2 expression, which may lead to cholestasis and hepatic dysfunction (5, 74). Indirect mechanisms of COVID-19-associated liver dysfunction are hypothesized to include cytokine storm, endothelial dysfunction/hypercoagulable state, ischemia/hypoxia, and drug-induced liver injury (5, 74).
Elevated ALT is widely recognized as a specific marker for liver damage due to its high activity in the liver relative to other organs (10, 75). Many studies have shown an association of ALT elevations with poor COVID-19 outcome (5). In our study, ALT elevations had variable associations with severe COVID-19, particularly during the Delta period. A handful of studies have shown lower ALT levels to be associated with poor COVID-19 outcome (76–78), and low ALT is suggested to be a marker of frailty and sarcopenia in non-COVID settings (79–81). Perhaps, the variability in association between ALT levels and COVID-19 outcome is due to levels of ALT being indicative of overall reserve and liver dysfunction. AST is less specific for liver dysfunction than ALT because AST is produced in other tissues such as the heart and muscles in addition to the liver (10, 75). Thus, increased AST can be a marker of direct liver injury as well as a marker of other organ dysfunction (5, 10, 74, 75). Among baseline LFTs, AST had the greatest and most consistent effect on risk of poor COVID-19 outcome, with AST elevations being consistently associated with increased risk of severe COVID-19 in our cohort and across the subgroups, consistent with many previous studies (5, 8, 78). Surprisingly, elevated total bilirubin was associated with reduced risk of severe COVID-19 during the Pre-Delta period. While non-specific, bilirubin is frequently elevated in cholestasis (10, 75). Bilirubin has antioxidant properties, with some evidence of association of increases in bilirubin with reduced mortality in chronic obstructive pulmonary disease (COPD), reduced development of cardiovascular and metabolic diseases, and other potential benefits (82, 83). Bilirubin may have a similar effect in COVID-19, as bilirubin elevations were actually more frequent in the room air subgroup compared to the oxygen support subgroup. Taken together, these results may indicate that in our cohort, abnormal LFTs were predominantly a result of indirect liver injury and/or systemic dysfunction. However, investigation of these mechanisms was beyond the scope of this study.
In this single-center study conducted at a safety-net hospital, non-liver-related variables including age, sex, BMI, various comorbidities, respiratory support requirement at admission, increases in creatinine, decreases in platelets, and decreases in albumin were associated with severe COVID-19 in our cohort, consistent with previous studies (8, 27, 33, 44–46, 55–59, 61). Furthermore, the liver-related results were largely consistent across different variant periods and baseline patient presentations in the subgroup analyses. However, given that baseline LFTs as well as the dominant variant or sub-variant can vary across populations, validation studies in other current COVID-19 cohorts in different settings are warranted.
Our study has several limitations. We did not correct for multiple comparisons, which could have led to spurious statistically significant results. Reassuringly, the results of this study are consistent with previous literature as described above. The retrospective design relied on information documented in medical records which may contain errors or incomplete data; thus, misclassifications of exposures and/or outcome are possible. For instance, we lacked data on home medications, vaccination status, and pre-COVID LFTs, making it challenging to determine if the reported abnormalities were solely due to acute COVID-19. Similarly, ECMO and CRRT start times were not available. Therefore, it is possible that the 3 patients who received CRRT but did not meet any other severe COVID-19 criteria may have received CRRT within 24 h of admission and mistakenly been included in the cohort. Since we excluded patients who received vasopressors or required mechanical ventilation within the first day of admission, and all patients requiring ECMO also received vasopressors or were mechanically ventilated at some point, it is unlikely that initiation of ECMO was a source of misclassification bias. Additionally, just as SARS-CoV-2 evolved over time during the study period (2020–2024), there were also changes in standard treatment and vaccination availability and uptake that could have potentially confounded our results. However, the consistency of the results across the variant-predominant subgroups and the room air subgroup are reassuring against this possible source of confounding. Our study was not designed to investigate the mechanism of liver pathology during COVID-19; additional prospective and/or basic science studies are necessary to clarify the mechanism(s). We did not have viral sequence data available to directly identify the circulating viral variants in our cohort, although previous studies have used similar dating methods to categorize variants (33, 72, 73). Future prospective studies should be performed to validate the prognostic role of non-invasive liver fibrosis scores across SARS-CoV-2 variants and baseline presentations of COVID-19 patients among other populations during the current Omicron period.
Regardless of the limitations, our study has several strengths. The study period was one of the longest to our knowledge in the COVID-19 literature (from March 2020 through the end of 2024) with a relatively high N for a single center study. This allowed for a robust and comprehensive analysis of abnormal LFTs and composite liver scores during the COVID-19 era as a whole. This also allowed us to compare and contrast these associations during different variant-predominant periods and across different types of patients (i.e., those who present without requiring respiratory support, those without pre-existing liver disease, etc.). We also assessed model discriminatory ability and data fit via area under the ROCs and AICs, respectively to aid in the comparison of the various models presented here.
5 Conclusion
COVID-19 continues to present as a systemic disease with extrapulmonary signs and symptoms. Measuring LFTs and calculating non-invasive liver fibrosis scores at admission, particularly FIB-4, can help identify COVID-19 patients who do not present “classically,” but are nonetheless at increased risk of severe disease, and may benefit from a higher level of care and monitoring early in their admission.
Statements
Data availability statement
The datasets presented in this article are not readily available because this is patient-level data with PHI which cannot be made publicly available. Requests for a limited de-identified dataset can be made to the corresponding author (Nicole Naiman, nicole.naiman@utsouthwestern.edu).
Ethics statement
The studies involving humans were approved by University of Texas Southwestern Medical Center Institutional Review Board. The studies were conducted in accordance with the local legislation and institutional requirements. The ethics committee/institutional review board waived the requirement of written informed consent for participation from the participants or the participants’ legal guardians/next of kin because this was a retrospective chart review study.
Author contributions
LCH: Data curation, Formal analysis, Methodology, Writing – original draft, Writing – review & editing. NN: Data curation, Formal analysis, Methodology, Writing – original draft, Writing – review & editing. AM: Methodology, Supervision, Writing – review & editing. MJ: Conceptualization, Methodology, Supervision, Writing – review & editing.
Funding
The author(s) declare that financial support was received for the research and/or publication of this article. This work was supported with funds from INSIGHT UO1/UM1-AI068641 and in-kind by MJ. INSIGHT provided financial support for effort only and was not involved in the study design or analysis.
Acknowledgments
The authors would like to thank Parkland Health and Hospital system for allowing us access to their medical record data and specifically would like to thank Christopher Clark for providing us with the extracted data.
Conflict of interest
MJ has received funding from Gilead Sciences, Abbott, and Laurent that was given to her institution. MJ is a registered associate editor for Frontiers in Bacteriology –One Health in Bacteriology. NN has recently been awarded a grant from Gilead Sciences, which will be given to her institution. AM worked as a consultant for Analysis Group, Inc from 2022-2024.
The remaining author declares that the research was conducted in the absence of any commercial or financial relationships that could be construed as a potential conflict of interest.
The author(s) declared that they were an editorial board member of Frontiers, at the time of submission. This had no impact on the peer review process and the final decision.
Generative AI statement
The authors declare that Gen AI was used in the creation of this manuscript. The authors utilized ChatGPT (https://openai.com/chatgpt) and Microsoft Copilot as a search engines along with Google to help identify appropriate coding commands; the authors did not feed data directly into ChatGPT or Copilot. Neither ChatGPT nor Copilot were used to write text, generate tables/figures, or directly analyze data.
Any alternative text (alt text) provided alongside figures in this article has been generated by Frontiers with the support of artificial intelligence and reasonable efforts have been made to ensure accuracy, including review by the authors wherever possible. If you identify any issues, please contact us.
Publisher’s note
All claims expressed in this article are solely those of the authors and do not necessarily represent those of their affiliated organizations, or those of the publisher, the editors and the reviewers. Any product that may be evaluated in this article, or claim that may be made by its manufacturer, is not guaranteed or endorsed by the publisher.
Supplementary material
The Supplementary material for this article can be found online at: https://www.frontiersin.org/articles/10.3389/fmed.2025.1727318/full#supplementary-material
References
1.
Chams N Chams S Badran R Shams A Araji A Raad M et al . COVID-19: a multidisciplinary review. Front Public Health. (2020) 8:383. doi: 10.3389/fpubh.2020.00383,
2.
Cho J Lee J Sia CH Koo CS Tan BYQ Hong W et al . Extrapulmonary manifestations and complications of severe acute respiratory syndrome coronavirus-2 infection: a systematic review. Singapore Med J. (2023) 64:349–65. doi: 10.11622/smedj.2021100,
3.
Shaffer A Meyerowitz EA . Clinical manifestations of SARS-CoV-2 infection in immunocompetent adults in the era of widespread population immunity and omicron sublineage viruses. Infect Dis Clin N Am. (2025) 39:233–51. doi: 10.1016/j.idc.2025.02.002,
4.
Jensen TO Harper K Gupta S Liu ST Dharan NJ Baker JV et al . Impact of baseline SARS-CoV-2 load in plasma and upper airways on the incidence of acute extrapulmonary complications of COVID-19: a multicentric, prospective, cohort study. Clin Infect Dis. (2024) 79:1394–403. doi: 10.1093/cid/ciae469,
5.
Liatsos GD . SARS-CoV-2 induced liver injury: incidence, risk factors, impact on COVID-19 severity and prognosis in different population groups. World J Gastroenterol. (2023) 29:2397–432. doi: 10.3748/wjg.v29.i16.2397,
6.
Wu Y Li H Guo X Yoshida EM Mendez-Sanchez N Levi Sandri GB et al . Incidence, risk factors, and prognosis of abnormal liver biochemical tests in COVID-19 patients: a systematic review and meta-analysis. Hepatol Int. (2020) 14:621–37. doi: 10.1007/s12072-020-10074-6,
7.
Cao X Xie YL Yi JY Liu ZL Han M Duan JH et al . Altered liver enzyme markers in patients with asymptomatic, and mild omicron infection: a retrospective study. J Inflamm Res. (2024) 17:6875–85. doi: 10.2147/JIR.S478812,
8.
Alsayed AR Ahmed SI Al Shweiki AO Al-Shajlawi M Hakooz N . The laboratory parameters in predicting the severity and death of COVID-19 patients: future pandemic readiness strategies. Biomol Biomed. (2024) 24:238–55. doi: 10.17305/bb.2023.9540,
9.
Shaikh SM Varma A Kumar S Acharya S Patil R . Navigating disease management: a comprehensive review of the de ritis ratio in clinical medicine. Cureus. (2024) 16:e64447. doi: 10.7759/cureus.64447,
10.
Kwo PY Cohen SM Lim JK . ACG clinical guideline: evaluation of abnormal liver chemistries. Am J Gastroenterol. (2017) 112:18–35. doi: 10.1038/ajg.2016.517,
11.
Sterling RK Lissen E Clumeck N Sola R Correa MC Montaner J et al . Development of a simple noninvasive index to predict significant fibrosis in patients with HIV/HCV coinfection. Hepatology. (2006) 43:1317–25. doi: 10.1002/hep.21178,
12.
Angulo P Hui JM Marchesini G Bugianesi E George J Farrell GC et al . The NAFLD fibrosis score: a noninvasive system that identifies liver fibrosis in patients with NAFLD. Hepatology. (2007) 45:846–54. doi: 10.1002/hep.21496,
13.
Wai CT Greenson JK Fontana RJ Kalbfleisch JD Marrero JA Conjeevaram HS et al . A simple noninvasive index can predict both significant fibrosis and cirrhosis in patients with chronic hepatitis C. Hepatology. (2003) 38:518–26. doi: 10.1053/jhep.2003.50346,
14.
Liu M Mei K Tan Z Huang S Liu F Deng C et al . Liver fibrosis scores and hospitalization, mechanical ventilation, severity, and death in patients with COVID-19: a systematic review and dose-response Meta-analysis. Can J Gastroenterol Hepatol. (2022) 2022:1–11. doi: 10.1155/2022/7235860,
15.
De Vito A Saderi L Colpani A Puci MV Zauli B Fiore V et al . New score to predict COVID-19 progression in vaccine and early treatment era: the COVID-19 Sardinian progression score (CSPS). Eur J Med Res. (2024) 29:123. doi: 10.1186/s40001-024-01718-6,
16.
Mangoni AA Zinellu A . An updated systematic review and Meta-analysis of the association between the De Ritis ratio and disease severity and mortality in patients with COVID-19. Life. (2023) 13:1324. doi: 10.3390/life13061324,
17.
Khemchandani AK Shaikh H Khemchandani M . Probing liver function test patterns in COVID-19 pneumonia: implications for disease severity assessment. J Pak Med Assoc. (2024) 74:1423–7. doi: 10.47391/JPMA.10178,
18.
Chu H Bai T Chen L Hu L Xiao L Yao L et al . Multicenter analysis of liver injury patterns and mortality in COVID-19. Front Med. (2020) 7:584342. doi: 10.3389/fmed.2020.584342,
19.
Parajuli P Sabo R Alsaadawi R Robinson A French E Sterling RK . Fibrosis-4 (FIB-4) index as a predictor for mechanical ventilation and 30-day mortality across COVID-19 variants. J Clin Transl Sci. (2023) 7:e213. doi: 10.1017/cts.2023.594,
20.
Miele L Dajko M Savino MC Capocchiano ND Calvez V Liguori A et al . Fib-4 score is able to predict intra-hospital mortality in 4 different SARS-COV2 waves. Intern Emerg Med. (2023) 18:1415–27. doi: 10.1007/s11739-023-03310-y,
21.
Ao G Li A Li J Du X Wang Y Tran C et al . The association between the Fibrosis-4 index and COVID-19: a systematic review and meta-analysis. Ann Clin Lab Sci. (2022) 52:781–7.
22.
Zhang J Liu F Song T Li Z Xia P Tang X et al . Liver fibrosis scores and clinical outcomes in patients with COVID-19. Front Med. (2022) 9:829423. doi: 10.3389/fmed.2022.829423,
23.
Pranata R Yonas E Huang I Lim MA Nasution SA Kuswardhani RAT . Fibrosis-4 index and mortality in coronavirus disease 2019: a meta-analysis. Eur J Gastroenterol Hepatol. (2021) 33:e368–74. doi: 10.1097/MEG.0000000000002091,
24.
Pranata R Huang I Lim MA Yonas E Vania R Lukito AA et al . Elevated De Ritis ratio is associated with poor prognosis in COVID-19: a systematic review and Meta-analysis. Front Med. (2021) 8:8. doi: 10.3389/fmed.2021.676581,
25.
Tripon S Bilbault P Fabacher T Lefebvre N Lescuyer S Andres E et al . Abnormal liver tests and non-alcoholic fatty liver disease predict disease progression and outcome of patients with COVID-19. Clin Res Hepatol Gastroenterol. (2022) 46:101894. doi: 10.1016/j.clinre.2022.101894,
26.
Parajuli P Phipps LAC Sabo R Alsaadawi R Robinson A French E et al . The changing demographics and severity in hospitalized patients across COVID-19 variants: a national cohort study. J Clin Transl Sci. (2025) 9:e22. doi: 10.1017/cts.2024.1166,
27.
Zsichla L Mueller V . Risk factors of severe COVID-19: a review of host, viral and environmental factors. Viruses. (2023) 15:175. doi: 10.3390/v15010175
28.
Chatterjee S Bhattacharya M Nag S Dhama K Chakraborty C . A detailed overview of SARS-CoV-2 omicron: its sub-variants, mutations and pathophysiology, clinical characteristics, immunological landscape, immune escape, and therapies. Viruses. (2023) 15:167. doi: 10.3390/v15010167,
29.
Lu JY Buczek A Fleysher R Musheyev B Henninger EM Jabbery K et al . Characteristics of COVID-19 patients with multiorgan injury across the pandemic in a large academic health system in the Bronx, New York. Heliyon. (2023) 9:e15277. doi: 10.1016/j.heliyon.2023.e15277,
30.
Robinson ML Morris CP Betz JF Zhang Y Bollinger R Wang N et al . Impact of severe acute respiratory syndrome coronavirus 2 variants on inpatient clinical outcome. Clin Infect Dis. (2023) 76:1539–49. doi: 10.1093/cid/ciac957,
31.
World Health Organization (2023) WHO Coronavirus (COVID-19). Available online at: https://data.who.int/dashboards/covid19/more-resources (Accessed September 9, 2025).
32.
Centers for Disease Control and Prevention . (2024) COVID-NET Interactive Dashboard. Available online at: https://www.cdc.gov/covid/php/covid-net/index.html (Accessed September 9, 2025).
33.
Chen YE Gawel SH Desai P Rojas J Barbian HJ Tippireddy N et al . COVID-19 waves in an urban setting 2020-2022: an electronic medical record analysis. Front Public Health. (2024) 12:1323481. doi: 10.3389/fpubh.2024.1323481,
34.
Li J Zhang Q Xu C Zhang Y Lu Y Ai M et al . Differences in clinical characteristics and liver injury between patients diagnosed with the omicron subvariant BA.5.2 and the prototype of SARS-CoV-2: a single center retrospective study. BMC Gastroenterol. (2023) 23:271. doi: 10.1186/s12876-023-02907-z,
35.
Zhang J Zhao D Hu J Huang X Gu Q Tao Z . Hepatic dysfunctions in COVID-19 patients infected by the omicron variant of SARS-CoV-2. Front Public Health. (2022) 10:1049006. doi: 10.3389/fpubh.2022.1049006,
36.
Deng H Lin H Mai Y Liu H Chen W . Clinical features and predictive factors related to liver injury in SARS-CoV-2 Delta and omicron variant-infected patients. Eur J Gastroenterol Hepatol. (2022) 34:933–9. doi: 10.1097/MEG.0000000000002381,
37.
Jang TY . Liver injury caused by SARS-CoV-2 Delta and omicron-variant in Taiwan. J Formos Med Assoc. (2022) 121:2367–8. doi: 10.1016/j.jfma.2022.06.004,
38.
Muntean M Briciu V Lupse M Colcear D Macicasan RV Csiszer A et al . Effects of COVID-19 on the liver and mortality in patients with SARS-CoV-2 pneumonia caused by Delta and non-Delta variants: an analysis in a single Centre. Pharmaceuticals. (2023) 17:3. doi: 10.3390/ph17010003,
39.
von Elm E Altman DG Egger M Pocock SJ Gotzsche PC Vandenbroucke JP et al . The Strengthening the Reporting of Observational Studies in Epidemiology (STROBE) statement: guidelines for reporting observational studies. PLoS Med. (2007) 4:e296.,
40.
Deng H Mai Y Liu H Guan J . Clinical characteristics of liver injury in SARS-CoV-2 omicron variant- and omicron subvariant-infected patients. Ann Hepatol. (2023) 28:100763. doi: 10.1016/j.aohep.2022.100763,
41.
Younossi ZM Noureddin M Bernstein D Kwo P Russo M Shiffman ML et al . Role of noninvasive tests in clinical gastroenterology practices to identify patients with nonalcoholic steatohepatitis at high risk of adverse outcomes: expert panel recommendations. Am J Gastroenterol. (2021) 116:254–62. doi: 10.14309/ajg.0000000000001054,
42.
Copur B Surme S Tuncer G Bayramlar OF . The role of APRI, FIB-4, and SAD-60 scores as predictors of mortality in COVID-19 patients. Infect Dis Clin Microbiol. (2023) 5:144–52. doi: 10.36519/idcm.2023.233,
43.
Badary HA Hashem MB El-Kassas M . Drug-induced liver injury during the era of COVID-19 polypharmacy: a statement of account, lessons learned, and a proposed approach. Egypt Liver J. (2024) 14:381. doi: 10.1186/s43066-024-00381-0
44.
Mejía F Medina C Cornejo E Morello E Vásquez S Alave J et al . Oxygen saturation as a predictor of mortality in hospitalized adult patients with COVID-19 in a public hospital in Lima, Peru. PLoS One. (2020) 15:e0244171. doi: 10.1371/journal.pone.0244171,
45.
Aggarwal NR Nordwall J Braun DL Chung LCY Coslet J Der T et al . Viral and host factors are associated with mortality in hospitalized patients with COVID-19. Clin Infect Dis. (2024) 78:1490–503. doi: 10.1093/cid/ciad780,
46.
Fernandes E da Silva BM Goulart CD Valente J Rezende AG Vissoci JRN et al . Assistance time and peripheral oxygen saturation in prehospital emergency data as predictors of COVID19 hospital outcomes. Sci Rep-Uk. (2024) 14:20775. doi: 10.1038/s41598-024-71290-w
47.
Ellis LP Hess O Huynh KLA Bearman G Kang L Doern CD . A comparison of severity of illness between the SARS-CoV-2 omicron variant and Delta variant. Antimicrob Steward Healthc Epidemiol. (2023) 3:e188. doi: 10.1017/ash.2023.453,
48.
Esper FP Adhikari TM Tu ZJ Cheng YW El-Haddad K Farkas DH et al . Alpha to omicron: disease severity and clinical outcomes of major SARS-CoV-2 variants. J Infect Dis. (2023) 227:344–52. doi: 10.1093/infdis/jiac411,
49.
O'Driscoll R Bakerly ND . Automated audit of hospital oxygen use devised during the COVID-19 pandemic. BMJ Open Respir Res. (2023) 10:1866. doi: 10.1136/bmjresp-2023-001866,
50.
Hodcroft EB . (2021) CoVariants: SARS-CoV-2 Mutations and Variants of Interest. Available online at: https://covariants.org/ (Accessed August 7, 2024).
51.
Dallas County Coronavirus (COVID-19) (2021) Updates and information. Available online at: https://www.dallascounty.org/covid-19/ (Accessed August 7, 2024).
52.
Hadfield J Megill C Bell SM Huddleston J Potter B Callender C et al . Nextstrain: real-time tracking of pathogen evolution. Bioinformatics. (2018) 34:4121–3. doi: 10.1093/bioinformatics/bty407,
53.
Nextstrain . (2025) Genomic epidemiology of SARS-CoV-2 with subsampling focused on North America since pandemic start. Available online at: https://nextstrain.org/ncov/gisaid/north-america/all-time?f_division=Texas&tl=region&treeZoom=selected (Accessed August 7, 2024).
54.
Zou GY . A modified Poisson regression approach to prospective studies with binary data. Am J Epidemiol. (2004) 159:702–6. doi: 10.1093/aje/kwh090,
55.
Haber R Ghezzawi M Puzantian H Haber M Saad S Ghandour Y et al . Mortality risk in patients with obesity and COVID-19 infection: a systematic review and meta-analysis. Metabolism. (2024) 155:155812. doi: 10.1016/j.metabol.2024.155812,
56.
Li X Zhong X Wang Y Zeng X Luo T Liu Q . Clinical determinants of the severity of COVID-19: a systematic review and meta-analysis. PLoS One. (2021) 16:e0250602. doi: 10.1371/journal.pone.0250602,
57.
Wu Y Li H Zhang Z Liang W Zhang T Tong Z et al . Risk factors for mortality of coronavirus disease 2019 (COVID-19) patients during the early outbreak of COVID-19: a systematic review and meta-analysis. Ann Palliat Med. (2021) 10:5069–83. doi: 10.21037/apm-20-2557,
58.
Booth A Reed AB Ponzo S Yassaee A Aral M Plans D et al . Population risk factors for severe disease and mortality in COVID-19: a global systematic review and meta-analysis. PLoS One. (2021) 16:e0247461. doi: 10.1371/journal.pone.0247461,
59.
Park JO Cho HK Jeon CH Kim SH Park IH Kim KM et al . Characteristics and biomarkers associated with mortality in COVID-19 patients presenting to the emergency department. Epidemiol Infect. (2024) 152:e76. doi: 10.1017/S0950268824000633,
60.
Zace D Cekrezi A Jones C Ferrari L De Simone G Teti E et al . The evolving landscape of COVID-19: factors associated with in-hospital COVID-19 related mortality during the 2023-2024 phase of JN.1 subvariant dominance. BMC Infect Dis. (2025) 25:130. doi: 10.1186/s12879-025-10480-x,
61.
Ngiam JN Ng OT Toh MPHS Gao Q Soong AJ Teo JHW et al . Predictors of disease severity in SARS-CoV-2 omicron variant XBB sublineages and variants of interest. J Med Virol. (2023) 95:e29204. doi: 10.1002/jmv.29204,
62.
Snopkowska Lesniak SW Maschio D Henriquez-Camacho C Moreno Cuerda V . Biomarkers for SARS-CoV-2 infection. A narrative review. Front Med. (2025) 12:1563998. doi: 10.3389/fmed.2025.1563998,
63.
Abosamak MF Szergyuk I De Oliveira MHS Lippi G Al-Jabbary AS Al-Najjar AH et al . Liver fibrosis-4 score predicts mortality in critically ill patients with coronavirus disease 2019. Indian Anaesth Forum. (2021) 22:149–56. doi: 10.4103/TheIAForum.TheIAForum_49_21
64.
Aminzadeh A Azmi-Naei N Teimouri M Rohani-Rasaf M . FIB-4, APRI, and ALRI as predictors of COVID-19 outcomes: insights from a large-scale study. Diagnostics. (2025) 15:1984. doi: 10.3390/diagnostics15161984,
65.
Bucci T Galardo G Gandini O Vicario T Paganelli C Cerretti S et al . Fibrosis-4 (FIB-4) index and mortality in COVID-19 patients admitted to the emergency department. Intern Emerg Med. (2022) 17:1777–84. doi: 10.1007/s11739-022-02997-9,
66.
Cholongitas E Bali T Georgakopoulou VE Kamiliou A Vergos I Makrodimitri S et al . Comparison of liver function test- and inflammation-based prognostic scores for coronavirus disease 2019: a single center study. Eur J Gastroenterol Hepatol. (2022) 34:1165–71. doi: 10.1097/MEG.0000000000002446,
67.
Gambichler T Konig D Schuleit N Susok L Schmidt W Abu Rached N . Liver scores in the prognostication of COVID-19 patients. Viruses. (2025) 17:444. doi: 10.3390/v17030444,
68.
Grigoras ML Citu IM Citu C Chiriac VD Gorun F Levai MC et al . Evaluation of FIB-4, NFS, APRI and liver function tests as predictors for SARS-CoV-2 infection in the elderly population: a matched case-control analysis. J Clin Med. (2022) 11:149. doi: 10.3390/jcm11175149,
69.
Kamal AM Dumitrescu F Mita A Sabiescu DM Alexandru DO Gheorghe CE et al . Liver function tests and FIB-4 score as predictors of severity in COVID-19 patients from the south-west of Romania. Life. (2022) 12:934. doi: 10.3390/life12070934,
70.
Kamiya Y Shinoda M Ishii N Yamamoto S Sekine T Morikawa M et al . Comparison of liver fibrosis scores and fatty liver on computed tomography as risk factors for severity of COVID-19. JGH Open. (2024) 8:e70004. doi: 10.1002/jgh3.70004,
71.
Liu CY Chou SF Chiang PY Sun JT Tsai KC Jaw FS et al . The FIB-4 scores in the emergency department to predict the outcomes of COVID-19 patients in Taiwan. Heliyon. (2024) 10:e25649. doi: 10.1016/j.heliyon.2024.e25649,
72.
Karageorgou V Papaioannou AI Kallieri M Blizou M Lampadakis S Sfika M et al . Patients hospitalized for COVID-19 in the periods of Delta and omicron variant dominance in Greece: determinants of severity and mortality. J Clin Med. (2023) 12:5904. doi: 10.3390/jcm12185904,
73.
Flisiak R Zarebska-Michaluk D Dobrowolska K Rorat M Rogalska M Krynska JA et al . Change in the clinical picture of hospitalized patients with COVID-19 between the early and late period of dominance of the omicron SARS-CoV-2 variant. J Clin Med. (2023) 12:5572. doi: 10.3390/jcm12175572,
74.
Singh L Kumar A Rai M Basnet B Rai N Khanal P et al . Spectrum of COVID-19 induced liver injury: a review report. World J Hepatol. (2024) 16:517–36. doi: 10.4254/wjh.v16.i4.517,
75.
Kalas MA Chavez L Leon M Taweesedt PT Surani S . Abnormal liver enzymes: a review for clinicians. World J Hepatol. (2021) 13:1688–98. doi: 10.4254/wjh.v13.i11.1688,
76.
Genzel D Katz LH Safadi R Rozenberg A Milgrom Y Jacobs JM et al . Patients with low ALT levels are at increased risk for severe COVID-19. Front Med. (2023) 10:10. doi: 10.3389/fmed.2023.1231440,
77.
Gatt ER Zilber E Perelman M Landau N Yakir M Glick N et al . Do low levels of alanine aminotransferase, a baseline marker of sarcopenia and frailty, associate with worse clinical outcomes among hospitalized COVID-19 patients? A retrospective cohort study. J Frailty Sarcopenia Falls. (2023) 8:148–54. doi: 10.22540/JFSF-08-148,
78.
Goel H Harmouch F Garg K Saraiya P Daly T Kumar A et al . The liver in COVID-19: prevalence, patterns, predictors, and impact on outcomes of liver test abnormalities. Eur J Gastroenterol Hepatol. (2021) 33:E274–81. doi: 10.1097/MEG.0000000000002021,
79.
Vespasiani-Gentilucci U De Vincentis A Ferrucci L Bandinelli S Incalzi RA Picardi A . Low alanine aminotransferase levels in the elderly population: frailty, disability, sarcopenia, and reduced survival. J Gerontol A Biol Sci Med Sci. (2018) 73:925–30. doi: 10.1093/gerona/glx126,
80.
Laufer M Perelman M Sarfaty M Itelman E Segal G . Low alanine aminotransferase, as a marker of sarcopenia and frailty, is associated with shorter survival among prostate Cancer patients and survivors. A retrospective cohort analysis of 4064 patients. Eur Urol Open Sci. (2023) 55:38–44. doi: 10.1016/j.euros.2023.07.007,
81.
Saito Y Okumura Y Nagashima K Fukamachi D Yokoyama K Matsumoto N et al . Low alanine aminotransferase levels are independently associated with mortality risk in patients with atrial fibrillation. Sci Rep. (2022) 12:12183. doi: 10.1038/s41598-022-16435-5,
82.
Vitek L Hinds TD Jr Stec DE Tiribelli C . The physiology of bilirubin: health and disease equilibrium. Trends Mol Med. (2023) 29:315–28. doi: 10.1016/j.molmed.2023.01.007,
83.
MacDonald DM Kunisaki KM Wilt TJ Baldomero AK . Serum bilirubin and chronic obstructive pulmonary disease (COPD): a systematic review. BMC Pulm Med. (2021) 21:33. doi: 10.1186/s12890-021-01395-9,
Summary
Keywords
SARS-CoV-2, COVID-19, aspartate aminotransferase to platelet ratio index, fibrosis-4 index, non-alcoholic fatty liver disease fibrosis score, non-invasive liver fibrosis score
Citation
Cabrejos Hirashima L, Naiman NE, Malik AA and Jain MK (2026) Elevated non-invasive liver fibrosis scores at admission are independent risk factors for severe COVID-19: a retrospective cohort study from 2020 to 2024. Front. Med. 12:1727318. doi: 10.3389/fmed.2025.1727318
Received
17 October 2025
Revised
22 November 2025
Accepted
24 November 2025
Published
05 January 2026
Volume
12 - 2025
Edited by
Sadiq Hussain, Dibrugarh University, India
Reviewed by
Mahnaz Hosseini-Bensenjan, University of California, San Diego, United States
Romina Roshanshad, Johns Hopkins University, United States
Updates
Copyright
© 2026 Cabrejos Hirashima, Naiman, Malik and Jain.
This is an open-access article distributed under the terms of the Creative Commons Attribution License (CC BY). The use, distribution or reproduction in other forums is permitted, provided the original author(s) and the copyright owner(s) are credited and that the original publication in this journal is cited, in accordance with accepted academic practice. No use, distribution or reproduction is permitted which does not comply with these terms.
*Correspondence: Nicole E. Naiman, nicole.naiman@utsouthwestern.edu
†These authors share first authorship
Disclaimer
All claims expressed in this article are solely those of the authors and do not necessarily represent those of their affiliated organizations, or those of the publisher, the editors and the reviewers. Any product that may be evaluated in this article or claim that may be made by its manufacturer is not guaranteed or endorsed by the publisher.