Abstract
Introduction:
Tuberous sclerosis complex (TSC) is a genetic disorder caused by mutations in either the TSC1 or TSC2 genes. These mutations prevent the TSC1/TSC2 protein complex from forming, resulting in hyperactivation of the mechanistic target of rapamycin (mTOR) cell growth and protein synthesis pathway. Epilepsy is one of the most common neurological symptoms in TSC patients, often associated with focal cortical lesions. However, it is not fully established whether such focal abnormalities are sufficient on their own to generate seizures and associated behavioral deficits. Here, we created a novel mouse model to test the hypothesis that a focal, postnatal deletion of Tsc2 from cortical neurons is sufficient to induce an epileptogenic network and produce behavioral changes relevant to TSC.
Methods:
Tsc2 was deleted from neurons in a focal area of the frontal cortex in Tsc2fl/fl (fTSC2 KO) mice following neonatal bilateral AAV9-CaMKII-Cre-mCherry injections on postnatal day 2. One group of adult fTSC2 KO and Tsc2wt/wt (control) mice was implanted with cortical electrodes for combined video-EEG monitoring. A separate group of control and fTSC2 KO mice, injected with a lower viral titer, underwent video recording and behavioral exploration analysis in a novel environment. Tissue was collected for histology.
Results:
All adult fTSC2 KO mice implanted with cortical electrodes had seizures, whereas no control mice did. Histological analyses showed that virally infected cells in fTSC2 KO mice had enlarged somas and increased mTOR activation (pS6 expression). These fTSC2 KO mice also had decreased parvalbumin and somatostatin interneuron densities in the surrounding cortex. fTSC2 KO mice displayed increased anxiety-like behaviors, spending significantly less time in the center of the novel environment compared to controls.
Conclusion:
A focal, postnatal deletion of Tsc2 from cortical neurons is sufficient to cause both epilepsy and behavioral deficits in mice. This model recapitulates key phenotypes of TSC, including abnormal cell growth, reduced inhibitory cell density, and increased microglia activation. This fTSC2 KO model is advantageous for delineating the cortical changes that support epilepsy and behavioral deficits in TSC, and for investigating possible targets for therapeutic intervention.
1 Introduction
Tuberous sclerosis complex (TSC) is a rare genetic condition associated with abnormal neuron development, intellectual disabilities, and epilepsy. Approximately 1 in 6,000 children born annually are diagnosed with TSC (Kingswood et al., 2017), and most cases are sporadic (Rout and Thomas, 2025). Classified as a “mTORopathy,” TSC is associated with dysfunction of the mechanistic target of rapamycin (mTOR) pathway due to mutations in the TSC1 (hamartin) or TSC2 (tuberin) genes. The mTOR pathway is essential for neuronal proliferation, cell growth and development, protein synthesis, and cell survival (for review see Lasarge and Danzer, 2014). Thus, when TSC1 and TSC2 proteins cannot bind to form the negative regulator required for the inactivation of Ras homolog enriched in brain (Rheb), mTOR becomes hyperactivated and causes cell hypertrophy, increased synaptogenesis, and hyperexcitable neural circuits (Fingar and Blenis, 2004; Lasarge and Danzer, 2014; Litwa, 2022). In the central nervous system, the manifestations include seizures, cognitive dysfunction, and autism (Zaroff et al., 2006).
There is no cure for TSC, and epilepsy is one of the most common comorbidities, occurring in 90% of patients (Curatolo et al., 2018). These children have non-cancerous growths in the brain and body, including cortical tubers, subependymal nodules, and subependymal giant cell astrocytomas (Marcotte and Crino, 2006; Rosser et al., 2006; Napolioni et al., 2009). Cortical tubers are commonly the cause of epilepsy; removal of abnormal cells at the lesion site can provide immediate seizure freedom in 70% of patients (Jobst and Cascino, 2015; Liu et al., 2017). However, at ten years post-surgery, about half of patients exhibit seizure recurrence (Specchio et al., 2022). Current pharmacological treatments include Rapalogs; these drugs that dampen mTOR activity have been used to treat TSC with some success (French et al., 2016; Bissler et al., 2017; Franz et al., 2018; Wataya-Kaneda et al., 2018). However, problems with rapalogs include adverse effects, rebound growths, and variable efficacy (for review see Sasongko et al., 2023). Animal models of this disorder are necessary for the development of novel treatment options.
Animal models have been essential for understanding the link between hyperactivated mTOR and epilepsy in patients with TSC. Seizures have been directly linked to mutations in the mTOR pathway (Marsan and Baulac, 2018; Tarkowski et al., 2019), beginning as early as postnatal day 21 in mouse models with Tsc1 or Tsc2 deletion and postnatal day 20 with Rheb gain-of-function mutation (Lasarge and Danzer, 2014; Hsieh et al., 2016; Reijnders et al., 2017; Onori et al., 2020). In heterozygous Tsc1 mice, adult loss of the second allele is sufficient to cause seizures within 9 days, even without overt brain pathology (Abs et al., 2013). Hyperactivation of mTOR, especially in layer II/III neurons of the prefrontal cortex, also caused abnormal cell development with elongated dendrites, enlarged somas, increased axonal projections, and abnormal synapses with enlarged presynaptic terminals (Kwon et al., 2006b; Choi et al., 2008; Chow et al., 2009; Zhou et al., 2009; Tsai et al., 2014).
Many TSC animal models have a severe phenotype with early mortality preventing further investigation (Wilson et al., 2005; Meikle et al., 2007; Way et al., 2009; Zeng et al., 2011; Prabhakar et al., 2013; Koene et al., 2019). mTOR is necessary for regulated cell growth and function, and homozygous knockout of either Tsc1 or Tsc2 is embryonic lethal (Onda et al., 1999; Kobayashi et al., 2001). Cre-lox technology has allowed for more specific promoters, developmentally timed gene deletion, or inducible deletion (Kwon et al., 2001, 2006a,b; Marino et al., 2002; Fraser et al., 2004; Yue et al., 2005; Meikle et al., 2007, 2008; Wang et al., 2007; Choi et al., 2008; Zhou et al., 2009; Magri et al., 2011). In utero electroporation (IUE) models have been used to target specific developing neurons, through removal of Tsc1 or Tsc2 or gain-of-function mutations in Rheb (Feliciano et al., 2011; Tsai et al., 2014; Hsieh et al., 2016; Lin et al., 2016; Lim et al., 2017; Nguyen et al., 2019; Onori et al., 2020; Zhang et al., 2020). However, IUE technology can lead to inconsistent expression due to the diffuse electric field surrounding the targeted region (Yamashiro et al., 2022). It may also affect both neurons and astrocytes derived from the radial glial lineage (Nguyen and Bordey, 2021), and depending on the timing of electroporation, can result in large areas of abnormal neurons (Lim et al., 2015; Hsieh et al., 2016). Such factors can make it challenging to attribute experimental outcomes specifically to the targeted genetic change, rather than to confounding effects on multiple cell types or broader developmental abnormalities.
To achieve more precise spatial and temporal control, we employed a viral-mediated approach to test the hypothesis that deletion of Tsc2 from a localized region of cortical neurons at postnatal day 2 was sufficient to cause the formation of an epileptogenic network. Indeed, this manipulation led to mTOR upregulation, hypertrophic neurons, epilepsy, and anxiety-like behavior. Moreover, most focal Tsc2 knockout (fTSC2 KO) mice survived until adulthood, when EEG monitoring (68% survival) and behavioral testing (100% survival) could occur. This fTSC2 KO model is advantageous for investigating TSC-associated epileptogenesis and accompanying behavioral deficits.
2 Materials and methods
2.1 Mice
All animal studies were in accordance with the NIH Guide for the Care and Use of Laboratory Animals (National Research Council (US) Committee for the Update of the Guide for the Care and Use of Laboratory Animals, 2011) and in agreement with CCHMC Institutional Animal Care and Use Committee (IACUC) guidelines and approval. Tsc2fl/wt mice (RRID:IMSR_JAX STRAIN#027458; Tsc2 < tm1.1Mjg > /J) containing loxP sites flanking exons 2, 3, and 4 of the Tsc2 gene (Hernandez et al., 2007) were outbred for at least 7 generations with C57BL/6 mice. EEG study animals were generated by crossing Tsc2fl/wt mice to produce Tsc2fl/fl (Tsc2 “floxed”) and littermate Tsc2wt/wt (Tsc2 “wildtype”) mice. Behavioral study mice were made by breeding Tsc2fl/wt, TdTomatofl/fl (RRID:IMSR_JAX:007914; B6.Cg-Gt(ROSA)26Sortm14(CAG–tdTomato)Hze/J) mice with Tsc2fl/wt mice to produce Tsc2 wildtype and floxed mice with one allele of TdTomato (TdTom +). Previous Tsc2± mouse models did not show a seizure phenotype (Kobayashi et al., 1999, 2001; Onda et al., 1999; Ehninger et al., 2008); in line with our hypothesis, Tsc2fl/wt mice were not tested. All mice were maintained on a C57BL/6 background, and littermate controls were used when possible. All data collection and analyses were conducted with investigators blind to animal genotype and treatment.
2.2 Postnatal day two viral injections
AAV9-CaMKIIa-mCherry-T2A-Cre (Figure 1A; Vector builder, Chicago, IL) was injected bilaterally into focal (f) areas of the cortex of Tsc2 wildtype (control; males, n = 6; females, n = 4) and Tsc2 floxed (fTSC2 KO; males, n = 15; females, n = 10) pups at postnatal day 2 for the excision of the loxP-flanked Tsc2 gene and expression of mCherry. The stereotaxic frame was maintained at 2–4 degrees Celsius using chilled 100% EtOH and dry ice in the frame well [modified from Kim et al. (2014)]. Pups were placed on a Kimwipe covered, chilled (0°) aluminum block until unresponsive. Pups were head fixed, and a Neuros Syringe (0.5 μl, 32G, beveled; Cat# 65457-02) was inserted through the skull into the cortex (A/P: −0.5 mm; M/L: ± 0.5 mm; D/V −0.35 mm and A/P: −1.0 mm; M/L: ± 0.65 mm; D/V −0.35 mm) for 4 injections (50 nl at 100 nl/min; virus of 3.55 × 10⁹ gc/μl with 0.05% Trypan Blue) using an automated syringe pump. Pups were then warmed before they returned to the mother. Half of the litter was removed for injections, then swapped. Pups were tailed and genotyped on days 10–14 and weaned on day 28. Of 22 fTSC2 KO mice generated for EEG recording, 7 (32%) died before implant, between 7 and 11.86 weeks of age (9.633 ± 0.700 weeks; five males and two females). Ten fTSC2 KO mice (six males and four females chosen randomly) received EEG implants, and 5 fTSC2 KO mice (two males and three females) weren’t used for the study. There was no mortality among the 10 control mice assigned for implant.
FIGURE 1

mCherry expression indicates a focal area of Tsc2 KO cells. (A) CamkIIa-mCherry-T2A-Cre was packaged into an AAV9 for injection into the cortex of Tsc2fl/fl and Tsc2wt wt mice. Viral map created using BioRender. (B) Tile scan image showing the location of mCherry expression cells in a Tsc2fl/fl mouse injected with CamkIIa-mCherry-T2A-Cre at postnatal day 2. Images of the right hemisphere were traced using contours in Neurolucida (MBF Bioscience) with the pink lines highlighting mCherry expression. Scale bars = 1,000 μm. (C) Control and focal Tsc2 knockout (fTSC2 KO) tissue was stained with NeuroTrace. Images demonstrate a normal cortical lamination in fTSC2 KO mice. (D) The number of mCherry+ cells in cortex of control and fTSC2 KO tissue was comparable; however, there was a regional difference in both groups p < 0.001, with fewer mCherry + cells in region 10 near the cortical edge when compared to regions 1–8 (p ≤ 0.01) and in region 9 compared to regions 5 and 6 (p ≤ 0.028). (E) Tissue from control and fTSC2 KO mice was immunostained for Cre and mCherry; coincidence of the mCherry in cells that express Cre suggested mCherry could be used to identify TSC2 KO cells. Scale Bar = 20 μm. (F) Tissue from control and fTSC2 KO mice were immunostained for mCherry and pS6. Scale bar = 100 μm. (G) pS6 was highly expressed in fTSC2 KO tissue compared to controls, with an average of over 90% of mCherry+ cells in the fTSC2 expressing pS6 compared to 53% of control mCherry + expressing pS6. (H) The soma area of pS6 expressing mCherry– and mCherry+ neurons in the lesion area were measured in control and fTSC2 KO tissue; mCherry+ cells in the Tsc2 floxed mice were significantly larger than mCherry– cells in the same tissue and larger than mCherry+ cells in control tissue. ***, p < 0.001; ****, p < 0.0001.
2.3 EEG analysis
Control (males, n = 6; females, n = 4) and fTSC2 KO mice (males, n = 6; females, n = 4) balanced for sex and age were implanted with cortical surface electrodes connected to wireless EEG transmitters (1 channel, TA11ETA-F10, Data Sciences International, St. Paul, MN). EEG recorded mice ranged in age from 8.43 to 18.00 weeks at implantation (controls: 10.19 ± 1.00; fTSC2 KO: 10.73 ± 0.96 weeks; t(18) = 0.390, p = 0.702). Cortical electrodes were placed under the skull above the dura, bilaterally (two electrodes, ± 1.5 mm lateral, 0.5 mm posterior to bregma). Mice were provided with Carprofen (40 mg/kg) for pain post-surgery and 24 h later, and antibacterial ointment was applied to the wound for 3 days. Video-EEG data was collected 24 h per day, 7 days per week, and reviewed using NeuroScore software (Version 2.1.0, Data Sciences International) to identify seizures. EEG events scored as seizures were characterized by the sudden onset of high amplitude (> 2x background) activity, signal progression (a change in amplitude and frequency over the course of the event) and a duration greater than 10 s (LaSarge et al., 2021). Mice were recorded from for at least 7 days (controls: 11.20 ± 0.854 days; fTSC2 KO: 8.00 ± 0.300 days); any bias from controls recording longer would have been toward seizure detection. At the end of recording, mice were overdosed with pentobarbital (100 mg/kg) and perfused with phosphate buffered saline (PBS) + 1 U/ml heparin, followed by 2.5% paraformaldehyde with 4% sucrose in PBS (pH 7.4). Brains were post-fixed overnight, cryoprotected, frozen, and stored at −80 °C. Frozen brains were sectioned in the sagittal plane on a cryostat at 30 μm. Four sections, spaced 540 μm apart, were mounted to each gelatin-coated slide and stored at −80 ° until use.
2.4 Immunohistochemistry and histological analysis
2.4.1 Immunolabeling
Immunolabeling was performed on slide mounted tissue from EEG recorded control and fTSC2 KO mice. For visualization of Cre and mCherry co-expression in cells, as well as inhibitory cell counts, tissue was permeabilized overnight in 3% Triton-100 and 0.75% glycine in PBS, washed, and blocked with 1.5% Triton-100, 0.75% glycine, and 5% normal goat serum (NGS) or normal donkey serum in PBS, respectively. Slides to be assessed for pS6, as well as those assessed for inflammatory markers glial fibrillary acidic protein (GFAP) and ionized calcium-binding adaptor molecule 1 (IBA1), were treated overnight with 0.5% Igepal, 3% Tween 20, and 0.75% glycine in PBS, washed, and blocked in 5% NGS, 0.5% Igepal, and 0.75% glycine in PBS.
Following block, all tissue was incubated overnight with antibodies (see Table 1); a 4-h incubation with corresponding AlexaFluor secondary antibodies (Table 1) was followed by cover-slipping with ProLong Glass containing NucBlue (Thermo Fisher Scientific Cat #P36981).
TABLE 1
| Primary antibodies | Secondary antibodies/stains |
| Mouse anti-NeuN (1:200 Millipore Cat#MAB377, RRID:AB_2298772) | AlexaFluor 488 goat anti-mouse (1:750; Thermo Fisher Scientific Cat# A28175, RRID:AB_2536161) |
| Chicken anti-mCherry (1:750 Sigma Cat#ab356481, RRID:AB_2861426) | AlexaFluor 568 goat anti-chicken (1:750; Thermo Fisher Scientific Cat# A-11041, RRID:AB_2534098) |
| Rabbit anti-CRE (1:750 Cell Signaling Cat#15036, RRID:AB_2798694) | AlexaFluor 647-plus goat anti-rabbit (1:750; Thermo Fisher Scientific Cat# A-21244, RRID:AB_2535812) |
| Rabbit anti-phospho-240/244-S6 (pS6 antibody, 1:500 dilution, Cat# 9468 RRID:AB_2716873) | Alexa Fluor 647 goat anti-rabbit (Thermo Fisher Scientific Cat# A32733TR, RRID:AB_2866492) |
| Chicken anti-mCherry (1:750 Sigma Cat#ab356481, RRID:AB_2861426) | AlexaFluor 568 goat anti-chicken (1:750; Thermo Fisher Scientific Cat# A-11041, RRID:AB_2534098) |
| NeuroTrace 500/525 (1:300, Thermo Fisher Scientific Cat# N21480) | |
| Rabbit anti-SST (1:500; Thermo Fisher Scientific Cat# PA5-82678, RRID:AB_2789834) | Alexa Fluor 488 donkey anti-rabbit (1:750, Thermo Fisher Scientific Cat# A32790, RRID:AB_2762833) |
| Chicken anti-mCherry (1:750, Sigma Cat# ab356481, RRID:AB_2861426) | Alexa Fluor 568 donkey anti-chicken (1:750, Thermo Fisher Scientific Cat# A78950, RRID:AB_2921072) |
| Guinea pig anti-PV (1:1000; Synaptic Systems Cat# 195 004 RRID:AB_2156476) | Alexa Fluor 647 donkey anti-guinea pig (1:750, (Jackson Labs Cat# 706-605-148, RRID:AB_2340476) |
| Chicken anti-GFAP (1:500 Millipore Cat#AB5541, RRID:AB_177521) | Alexa Fluor 488 goat anti-chicken (Thermo Fisher Scientific Cat# A32931, RRID:AB_2762843) |
| Rabbit anti-IBA1 (1:500 Synaptic Systems Cat#234 008, RRID:AB_2891296) | Alexa Fluor 647-plus goat anti-rabbit (Thermo Fisher Scientific Cat# A-21244, RRID:AB_2535812) |
Primary and secondary antibodies used for histological analyses.
Primary and secondary antibodies used during immunohistochemistry experiments at the dilutions indicated.
2.4.2 Imaging and analysis
All imaging was conducted at the Bio-Imaging and Analysis Facility at Cincinnati Children’s Hospital Medical Center (RRID:SCR_022628) using a Nikon Eclipse Ni-E upright microscope with a 4X (NA 0.20) and 10X (NA 0.45) air objectives or a Nikon A1R confocal microscope equipped with 10X air (NA 0.45), 20X water-immersion (NA 0.95, resolution 0.62 μm/px), and 40X water-immersion (NA 1.15, resolution 0.31 μm/px) objectives (Nikon Instruments Inc.; RRID:SCR_020317). For 3D lesion reconstruction, at least three slides per animal, with at least three sections of tissue (9 ≤ sections total), were imaged at 4 × magnification spanning from lateral ± 0.12 to 3.00 mm. Cortex size and lesion area were traced by hand, to include cell bodies of mCherry + cells, using NIS-Elements AR imaging software (version 5.24.03; NIS-Elements, RRID:SCR_014329). The cortex and lesion were reconstructed using section number and thickness, and volumes were estimated.
For confocal images, scanning began 3 μm below the tissue surface to exclude damaged areas. Cre immunostaining was imaged using a 2 μm step for 4 μm through the z-axis. pS6, mCherry, NeuroTrace, SST, and PV immunostaining images were acquired using a 1 μm step for 18–23 μm through the z-axis; large images extended out at least 800 μm from the center of the viral-labeled cells. GFAP and IBA1 immunostaining images were acquired using a 0.5 μm step for 6 μm through the z-axis. A single optical image of NeuroTrace was also collected at the site of the lesion to assess cortical layering. Large images included the area of the lesion and at least 500 μm of tissue from the lesion.
For analysis, image stacks were loaded into Nikon NIS-Elements, except for mCherry and inhibitory cell counts that were completed using Neurolucida 360 (Version 2023.1.1, MBF Bioscience, VT; RRID:SCR_001775). All analyses were performed by investigators blinded to genotypes. Cellular hypertrophy driven by the hyperactivation of mTOR is a characteristic of TSC-associated lesions. To calculate cell size, a 100 μm square grid was placed over the image and 20 random squares in the lesion were selected between cortical layers II-IV; the circumference of a randomly selected neuron expressing pS6 and mCherry and a neuron with only pS6 expression (mCherry negative) were traced using the area measurement tool. pS6, mCherry, SST, and PV cell markers were counted in each section of cortex, spanning from the outer cortical edge to the corpus collosum. Absolute cell counts were performed; cells with intensity levels at twice the background were considered positive for the marker. Contours were used to distinguish the corpus callosum from the edge of the cortex, and cortex was divided into 10 equal areas between the contours to account for any changes in the cortical thickness or organization of cortical layers, similar to previously described methods (Zhong et al., 2021). Cell count and location data were exported into Microsoft Excel (Microsoft 365 version 2401, Microsoft Corp., RRID:SCR_016137), where cell densities were calculated for each individual animal. For each GFAP and IBA1 image, the percentage of the image with signal from cell labeling was calculated for each animal.
2.5 Behavioral exploration analysis
Behavioral analyses were conducted on a separate cohort of mice from EEG studies at a comparable age [range (11.71–16.43 weeks); mean control: 14.80 ± 0.55; mean fTSC2 KO: 14.75 ± 0.25]. Due to the severity of seizures in the cohort of mice that underwent EEG recording, mice for behavioral studies were injected with a reduced viral titer. TdTom + Tsc2 wildtype (control males, n = 6; females, n = 2) and TdTom + Tsc2 floxed (fTSC2 KO males, n = 3; females, n = 6) pups were injected with a combined 1:10 dilution of AAV9-CaMKIIa-mCherry-T2A-Cre (3.55 × 10⁸ gc/μl with 0.05% Trypan Blue) and AAV9-CaMKIIa-eGFP (3.55 × 10⁹ gc/μl with 0.05% Trypan Blue; Addgene cat# 50469-AAV9) in the same manner as described for EEG recorded mice. This fTSC2 KO cohort had no mortality, and 2 mice had behavioral seizures in the presence of the investigator.
Control and fTSC2 KO mice were placed alone in a new circular cage (10 in diameter and 8 in wall height) with a top-mounted camera in a new room to test their exploration of a novel environment. Mice were tested in a room with mice of the same sex, in randomized groups of four that contained both control and fTSC2 KO mice. Animals were tracked for the first 30 min in this cage using EthoVision XT (v17.5, Noldus Information Technology, Leesberg, VA, RRID:SCR_000441). The center zone was defined as the middle 4 inches of the field. The distance moved and center zone duration for each mouse was split into 5-min time bins and compared over time. Mice were perfused and tissue collected after all behavioral testing was complete (control: 16.64 ± 0.03 weeks; KO: 16.83 ± 0.04 weeks). Tissue was processed, cut, and analyzed for lesion size in the same manner as the tissue from the EEG analysis.
2.6 Statistics
Sex differences were analyzed for each measure using either a t-test or a two-way ANOVA (with genotype), although none were significant. Since no sex differences were detected, males and females were binned for analyses. Due to low n’s, however, the lack of a sex effect should be interpreted cautiously. All results are presented as mean ± SEM or medians (range). The number of animals are reported as “n,” unless otherwise noted. Statistical tests were performed using Sigma Plot software (version 14.0, Systat Software, Inc., RRID:SCR_003210) or Prism (version 10.1.2, GraphPad Software, LLC., RRID:SCR_002798). Graphs were made in Prism. Parametric tests were used for data that met assumptions of normality (Shapiro-Wilk test) and equal variance (Brown-Forsythe test), and non-parametric equivalents were used for data that did not meet these assumptions. Specific tests were used as noted in the results. Results are considered as significantly different if p < 0.05, unless otherwise noted.
2.7 Figure preparation
Microscopy images are either single confocal optical sections or confocal maximum projections. Some images were adjusted using Nikon NIS-Elements (NIS-Elements, RRID:SCR_014329) with a median filter (radius = 3) to reduce background artifacts. Brightness and contrast of digital images were adjusted to optimize cellular detail. Identical adjustments were made to all images meant for comparison. Figures were prepared using Adobe Photoshop (version 25.5.1, Adobe Photoshop, RRID:SCR_014199). Figures created using BioRender are specified in the legend.
3 Results
3.1 Viral deletion of Tsc2 in cortical cells
EEG recorded Tsc2 wildtype (control) and Tsc2 floxed (fTSC2 KO) mice injected on postnatal day 2 with an AAV9-CamKII-mCherry-T2A-Cre virus (Figure 1A) expressed mCherry in cortical neurons. mCherry expressing (+) neurons were found in a focal area of the frontal cortex, spanning from layer VI at the edge of the corpus callosum to layer I at the cortical edge (Figures 1B, E). A comparison of the cortical volume between the control mice and fTSC2 KO mice revealed no difference between groups (control, n = 10: 24.251 ± 0.744 mm3 mean ± SEM); fTSC2 KO, n = 10: 28.384 ± 2.019 mm3; t-test [t(18) = 1.920, p = 0.071]. Next, the volume of the cortex with mCherry expressing cells was calculated and normalized to the volume of the cortex. The percentage of the cortex with infected cells (lesion size) was also comparable in control and fTSC2 KO mice control: 32.623 ± 3.498; fTSC2 KO: 39.165 ± 1.810; t-test [t(18) = 1.661, p = 0.114]. Lastly, fTSC2 KO mice had no apparent changes in cortical lamination when compared to controls, including a distinct layer I at the cortical edge (Figure 1C).
The distribution of mCherry + cells across cortical layers was examined to determine which regions contained virally infected cells. This analysis aimed to characterize the spatial pattern of infection and assess whether specific cortical layers were preferentially targeted by the viral manipulation. To account for potential structural changes in cortical layering due to Tsc2 deletion, the cortex was divided into 10 equal regions, similar to Zhong et al. (2021). Within each region, the number of mCherry+ cells was counted and normalized by the region’s volume to calculate cell density. The overall density of mCherry+ cells was comparable between control (n = 10) and fTSC2 KO (n = 9) mice Figure 1E; Two-way ANOVA [Fgeno(1,17) = 0.0002, p = 0.988; Fregion(9,153) = 6.309, p < 0.001], indicating that the viral infection produced a similar lesion in both groups. However, cell distribution varied significantly across cortical regions. Both groups had fewer mCherry + cells near the cortical edge (region 10) compared to deeper regions of the cortex (region 1–8; p ≤ 0.01, Tukey correction for multiple comparisons), and fewer cells in superficial regions (region 9) when compared to middle regions (regions 5 and 6; p ≤ 0.028). Estimates of mCherry + cells per lesion were calculated by multiplying the estimated lesion volume by the estimated mCherry + cell density. These calculations revealed no significant difference in total mCherry + cells between control and fTSC2 KO mice control: 75,188 ± 28,587; fTSC2 KO: 98,173 ± 31,606; t-test [t(17) = 0.5408, p = 0.882].
Cre expression, pS6 expression, and cell size were used to indicate that Tsc2 activity was disrupted in mCherry + cells in the fTSC2 KO mice. The viral plasmid contained genes for both mCherry and Cre; however, the T2A would allow them to be expressed separately (Figure 1A). mCherry expression was visually compared to Cre expression in cortical neurons at the injection site in control and fTSC2 KO tissue using immunohistochemistry; indeed, mCherry expression overlapped with Cre expression, suggesting that mCherry could be used to identify TSC2 KO cells in the Tsc2 floxed mice (Figure 1D). Next, pS6 expression, the product and readout used to assess mTOR activation (Ma and Blenis, 2009), was compared in control and fTSC2 KO tissue. Early data collected from this model showed mCherry + cells in the fTSC2 KO animal were negative for TSC2 expression (Dusing et al., 2023). Since only a part of the Tsc2 gene was deleted, pS6 expression was used here to show a loss of functionality, which would present as an upregulation of mTOR activity. As seen in Figure 1F, pS6 was highly expressed in fTSC2 KO tissue compared to the control. Specifically, 93.36 ± 1.643% of mCherry + cells expressed pS6 in the fTSC2 KO tissue (n = 8), while only 52.60 ± 6.390% of neurons in the mCherry + cells control tissue (n = 8) expressed pS6 Figure 1G; t-test [t(14) = 6.177, p < 0.001].
mTOR hyperactivation in neurons can lead to increased soma sizes, and the impact of Tsc2 deletion was assessed. Since almost all mCherry cells in the fTSC2 KO tissue expressed pS6, and mTOR is associated with growth and protein synthesis, only neurons expressing pS6 in all conditions were measured to prevent bias. Unfortunately, due to the small population of mCherry + cells lacking pS6 activation in the Tsc2 floxed mice, we were unable to reliably quantify the soma size of mCherry + /pS6 negative cells. As demonstrated in Figure 1F, the pS6 and mCherry labeling were both localized to the cytoplasm and spatially overlapped within the same cells, enabling accurate soma size measurements in mCherry+ and mCherry− cells. The soma area of pS6 positive neurons with and without mCherry expression were measured and compared between the control (n = 8) and fTSC2 KO (n = 8) tissue Figure 1H; 2way RM ANOVA [F-inxmCherryxgeno(1,14) = 15.99, p = 0.0013; Fgeno(1,14) = 9.512, p = 0.008; FmCherry(1,14) = 30.58, p < 0.0001]. As shown by the interaction, mCherry + cells in the fTSC2 KO mice were significantly larger than mCherry + cells from control mice [controlmCherry+: 224.52 ± 20.37; fTSC2 KOmCherry+: 370.64 ± 25.61; Fisher’s LSD(mCherry+:controlvfTSC2KO): p = 0.0001], but not mCherry negative cells [controlmCherry−: 204.71 ± 24.03; fTSC2 KOmCherry−: 247.41 ± 23.66; Fisher’s LSD(mCherry–:controlvfTSC2KO): p = 0.209]. Moreover, mCherry + cells in the Tsc2 floxed mice were significantly larger than mCherry negative cells in the same tissue [Fisher’s LSD(fTSC2KO:mCherry+vmCherry–): p < 0.0001]. In the control tissue, the soma size of neurons with and without mCherry were comparable [Fisher’s LSD(Control:mCherry+vmCherry): p = 0.297]. Altogether, mCherry + cells in Tsc2 floxed tissue that expressed Cre, largely expressed pS6, and had increased soma area were TSC2 KO cells.
3.2 Focal deletion of Tsc2 from cortical neurons causes seizures
Control and fTSC2 KO mice were implanted with EEG electrodes for 24/7 (hours per day/days per week) seizure detection and video monitoring. The number and duration of EEG events classified as seizures were recorded for each animal for at least 7 days. No control animals had any seizures (characteristic control EEG shown in Figure 2A). However, every fTSC2 KO mouse, including mice implanted at 8 weeks of age, had seizures (average 3.950 ± 0.490 seizures per day; representative EEG seizure, Figure 2B) accompanied by behavioral symptoms (i.e., myoclonic jerking, forelimb clonus, rearing, and falling). Analysis of the seizures per day over the recording period showed only a significant difference between control (n = 10) and fTSC2 KO mice (n = 10); seizures did not vary by day Figure 2C; Two-way ANOVA [Fgeno(1,18) = 37.46, p < 0.0001; Fday(7,119) = 0.878, p = 0.526]. Seizure duration was also consistent over all recording days Figure 2D; Two-way ANOVA [Fgeno(1,18) = 106.500, p < 0.0001; Fday(7,119) = 0.569, p = 0.780]. Seizures also did not correlate with the age of the fTSC2 KO mouse [Pearson r correlation: (rage = 0.124, p = 0.733)]. Altogether, fTSC2 KO mice had a consistent seizure phenotype over the recording period.
FIGURE 2

Focal Tsc2 knockout (fTSC2 KO) mice have seizures. (A) Control and (B) fTSC2 KO mice were implanted with cortical EEG electrodes and monitored 24/7 for 7–12 days. Seizures were quantified using NeuroScore software, characterized by the sudden onset of high amplitude (> 2X background) synchronized activity, signal progression (a change in amplitude or frequency over the course of the event), and a duration greater than ten seconds. All fTSC2 KO mice had consistent class 5 seizures. (C) fTSC2 KO mice consistently had an average of 5.26 ± 0.69 (mean ± SEM) seizures per day. No control mice had seizures. (D) fTSC2 KO mice had seizures that lasted on average 42.17 ± 2.12 s each and were consistent during the recording period. **, p < 0.01.
3.3 Loss of PV and SST inhibitory cells in the cortex of fTSC2 KO mice
Tuberous sclerosis complex is frequently associated with dysfunctional inhibition (Valencia et al., 2006; Delia et al., 2012; Bateup et al., 2013b; Zhong et al., 2021; Aronica et al., 2023; Scheper et al., 2024), which can further disrupt the excitatory-inhibitory balance and contribute to a more severe seizure phenotype. Tissue from control (n = 10) and fTSC2 KO (n = 9) mice was immunostained for parvalbumin (PV) and somatostatin (SST) to determine whether the fTSC2 KO mice had disrupted inhibitory circuit architecture that could contribute to an altered excitatory-inhibitory balance. PV and SST inhibitory cells, as shown in Figure 3A, were detected throughout the cortical layers, as typically seen in mice (Wall et al., 2016). Analyses across combined cortical layers revealed a reduction in interneuron cell density in fTSC2 KO tissue compared to controls (Figure 3B). Specifically, PV + control: 7347 ± 570; fTSC2 KO: 4609 ± 625; t-test [tPV(17) = 3.242, p = 0.005]) and SST (control: 6706 ± 503; fTSC2 KO: 4988 ± 550; t-test [tSST(17) = 2.309, p = 0.034] interneurons were decreased in the lesion and the surrounding 500 μm region. These findings suggested a disruption in the local inhibitory network in the fTSC2 KO mice.
FIGURE 3

Focal Tsc2 knockout (fTSC2 KO) mice have decreased somatostatin and parvalbumin cells in the cortex. (A) Tissue from control and fTSC2 KO mice were labeled with antibodies for somatostatin (SST), mCherry, and parvalbumin (PV). Scale bars = 100 (left, 10X) and 50 μm (40X). (B) Parvalbumin (PV) and Somatostatin (SST) interneuron densities were decreased in fTSC2 KO mice compared to controls (p < 0.05). (C) PV cell densities were decreased in the fTSC2 KO mice compared to controls, particularly in regions 3–8 (p < 0.05 or p < 0.01, as indicated). (D) Inhibitory cell densities were not correlated with seizures. (E) SST cell densities were decreased in the fTSC2 KO mice compared to controls, particularly in regions 4–6, and 8 (p < 0.05 or p < 0.01, as indicated). *, p < 0.05; **, p < 0.01.
To assess whether interneurons in specific cortical regions exhibited heightened vulnerability in this model, the cortex was subdivided into 10 equal regions spanning the cortical layers to remove bias from potential laminar organization (Zhong et al., 2021). Regional analysis revealed differential changes in both PV and SST interneuron populations in fTSC2 KO tissue, suggesting that inhibitory circuits may be impacted differently across cortical depths. While PV cells were significantly decreased in fTSC2 KO mice overall compared to controls Figure 3C; Two-way RM ANOVA [Fgeno(1,17) = 10.51, p = 0.005; Fregion(9,153) = 9.479, p < 0.0001], they were particularly decreased in the middle subdivisions of the cortex (regions 3 and 4, p ≤ 0.019; 5–8, p < 0.01). SST cell densities were also decreased overall in fTSC2 KO mice Figure 3E; [Fgeno(1,17) = 5.330, p = 0.034; Fregion(9,153) = 8.299, p < 0.0001] but were particularly decreased in middle subdivisions (regions 4–6 and 8; p’s ≤ 0.041). Interestingly, the density of PV or SST interneurons did not correlate with seizure severity in epileptic mice, measured by seizures per day [Figure 3D, Pearson r correlation: (r-PV = 0.3721, p = 0.324; r-SST = -0.054, p = 0.890)]. This suggests that interneurons alone may not account for the seizure burden in this model.
During the inhibitory cell analyses, mCherry + PV and mCherry + SST cells were found in control and fTSC2 KO tissue. Although CaMKII is typically associated with excitatory neurons, previous reports indicate that some cortical inhibitory cells do express CaMKII (Keaveney et al., 2020), and viral expression in some inhibitory cells could be expected. Notably, mCherry + inhibitory cells in fTSC2 KO tissue had visibly larger somas, suggesting they are TSC2 deficient (example SST TSC2 KO cell in Figure 3A). In our samples, 5.754 ± 2.900% (control, n = 9) and 11.380 ± 2.963% (fTSC2 KO, n = 9) of all mCherry + cells were co-labeled with either PV or SST. The proportions did not differ between control and fTSC2 KO groups [tPV(16) = 0.724, p = 0.480; tSST(16) = 1.545, p = 0.142; tPVSST(16) = 1.358, p = 0.193].
Despite a reduction in overall PV and SST cell densities in the fTSC2 KO tissue, the percentage of PV cells that expressed mCherry in control (5.119 ± 2.973, n = 10) and fTSC2 KO tissue (10.74 ± 4.158, n = 9) were comparable [t(17) = 1.116, p = 0.280]. In contrast, the percentage of SST cells that expressed mCherry was increased in fTSC2 KO tissue (11.34 ± 3.935) compared to the controls [3.022 ± 0.955; t(17) = 2.157, p = 0.046]. These data raise the possibility that Tsc2 loss in inhibitory cells, particularly in SST cells, could render them less vulnerable to phenotypic loss or cell death than their wildtype counterparts.
3.4 Increased inflammatory response in the cortex of fTSC2 KO mice
Inflammation has long been correlated with epilepsy (Ravizza et al., 2024). Activation of microglia and astrocytes is a hallmark of neuroinflammation and often precedes the onset of neuropathological symptoms (for review Sanz and Garcia-Gimeno, 2020). Upon activation, microglia can either promote resolution of the inflammatory response or contribute to chronic inflammation (Heneka et al., 2014). Similarly, astrocytes modulate neuroinflammation by secreting cytokines and chemokines that fine-tune the immune response (Rossi, 2015). Careful examination of ionized calcium-binding adapter molecule 1 (IBA1), expressed by microglia, and glial fibrillary acidic protein (GFAP), expressed by astrocytes, revealed no overlap with mCherry fluorescence (Figure 4A). This suggests that these non-neuronal cell types did not express Cre recombinase and remained unaffected by the virus in this model. To evaluate whether fTSC2 KO mice exhibited an inflammatory response, immunohistochemical markers of microglial (IBA1) and astrocytic (GFAP) activation were analyzed.
FIGURE 4

Microglia, but not astrocytes, were increased in focal Tsc2 (fTSC2) knockout mice. (A) Tissue from control and focal Tsc2 knockout (fTSC2 KO) mice was labeled with antibodies for glial fibrillary acidic protein (GFAP) and Iba1. Scale bars = 100 μm (60X). (B) At the lesion and up to 500 μm away from the center, ionized calcium-binding adapter molecule 1 (IBA1) expression was increased in fTSC2 KO tissue compared to control tissue (p = 0.03). (C) GFAP expression had a comparable level throughout control and fTSC2 KO tissue. (D) Average seizures per day was negatively correlated with both IBA1 (r = 0.638; p = 0.047) and GFAP expression (r = –0.742, p = 0.014) in fTSC2 KO mice. *, p < 0.05.
IBA1 expression was assessed both at the lesion site surrounding mCherry + cells and at a distance of 500 μm from the lesion to determine whether an inflammatory response occurred, and if so, whether it was localized to the lesion or more broadly distributed throughout the surrounding tissue. A more generalized pattern of inflammation could reflect the seizure phenotype rather than being driven by changes at the lesion site. In control tissue (Figure 4A), microglia exhibited a ramified morphology, characterized by long, thin branching processes and a small cell body, features consistent with an inactive state (Lier et al., 2021). Following an injury or other stimulation, microglia typically transition to a reactive phenotype, with shorter, thicker processes, an enlarged cell body, and increased branching. To quantify changes, an object-based area analysis was used to measure the total area of IBA1 + cells and their processes and to calculate the percentage of tissue occupied IBA1 expression. This method captured changes in microglial density and morphology, rather than changes in expression intensity per cell. Analyses revealed that the percentage of tissue occupied by IBA1 immunoreactive structures was increased in fTSC2 KO mice (n = 10) compared to controls (n = 9) at both the lesion core and 500 μm away Figure 4B; Two-way RM ANOVA, IBA1 [Fgeno(1,17) = 5.603, p = 0.030; Fdistance(1,17) = 0.577, p = 0.458], indicating enhanced microglial activation. Thus, this activation may be caused or exacerbated by seizure activity rather than being solely attributable to the targeted cellular manipulation.
Astrocytes become hypertrophic and upregulate GFAP expression when activated (Yang and Wang, 2015). To assess astrocytic activation, GFAP levels were measured in both control (n = 9) and fTSC2 KO tissue (n = 10). As shown in Figure 4A, average GFAP expression was comparable across genotypes and distances from the lesion Figure 4C; Two-way RM ANOVA, [Fgeno(1,17) = 1.569, p = 0.2273; Fdistance(1,17) = 2.719, p = 0.1175], indicating no significant astrocyte response. These findings suggest that, unlike microglia, astrocytes may not be broadly activated in fTSC2 KO mice.
A Pearson r correlation was used to investigate if either inflammation marker was related to seizures in individual mice. Indeed, average seizures per day was negatively correlated with both IBA1 (Figure 4D; r = −0.638; p = 0.047) and GFAP expression (r = −0.742, p = 0.014) in fTSC2 KO mice, such that higher seizures numbers were correlated with decreased IBA1 and GFAP activation. fTSC2 KO mice with higher seizure numbers had IBA1 and GFAP expression in the range of control mice, suggesting that mice with more severe epilepsy had less inflammation compared to those with fewer seizures per day.
3.5 fTSC2 KO mice display thigmotaxic behavior
Control/Td + and fTSC2 KO/Td + mice (injected with 1:10 AAV-mCherry-T2A-Cre/AAV-eGFP) were placed alone in novel circular cages, in a new room, and recorded through a top-mounted camera for 30 min to investigate their exploratory behavior. Of note, no animals had seizures during testing, although 2 fTSC2 KO/Td + mice had behavioral seizures within one day of testing (noted by the investigator). A volumetric analysis of the cortex showed no change in these fTSC2 KO/Td + mice compared to controls/Td + control/Td + , n = 7: 26.765 ± 1.781 mm3; fTSC2 KO/Td + , n = 9: 30.344 ± 1.549 mm3; t-test [t(14) = 1.519, p = 0.151]. Of note, the percentage of the cortex with infected cells (lesion size) was consistent between fTSC2 KO mice that underwent EEG or behavioral testing EEG, n = 10: 39.165 ± 1.810%; behavior, n = 9: 30.899 ± 5.207%; t-test [t(17) = 1.565, p = 0.136], even though less Cre + viral particles were injected.
Control/Td + (n = 8) and fTSC2 KO/Td + (n = 9) mice moved similar distances in the cage during the 30 min period Figure 5B; Two-way RM ANOVA [Fgroup(1,15) = 3.055, p = 0.101; Fdistance(5,75) = 12.661, p < 0.001]. As expected, mice from both groups traveled further in the first five minutes compared to all other time bins (Bonferroni t-tests, all p’s < 0.001), after which distances traveled during bins were comparable. These data show that both groups spent a comparable amount of time exploring the new environment, traveling the most when first placed in the new cage, and that neither group had a mobility or motivational issue.
FIGURE 5
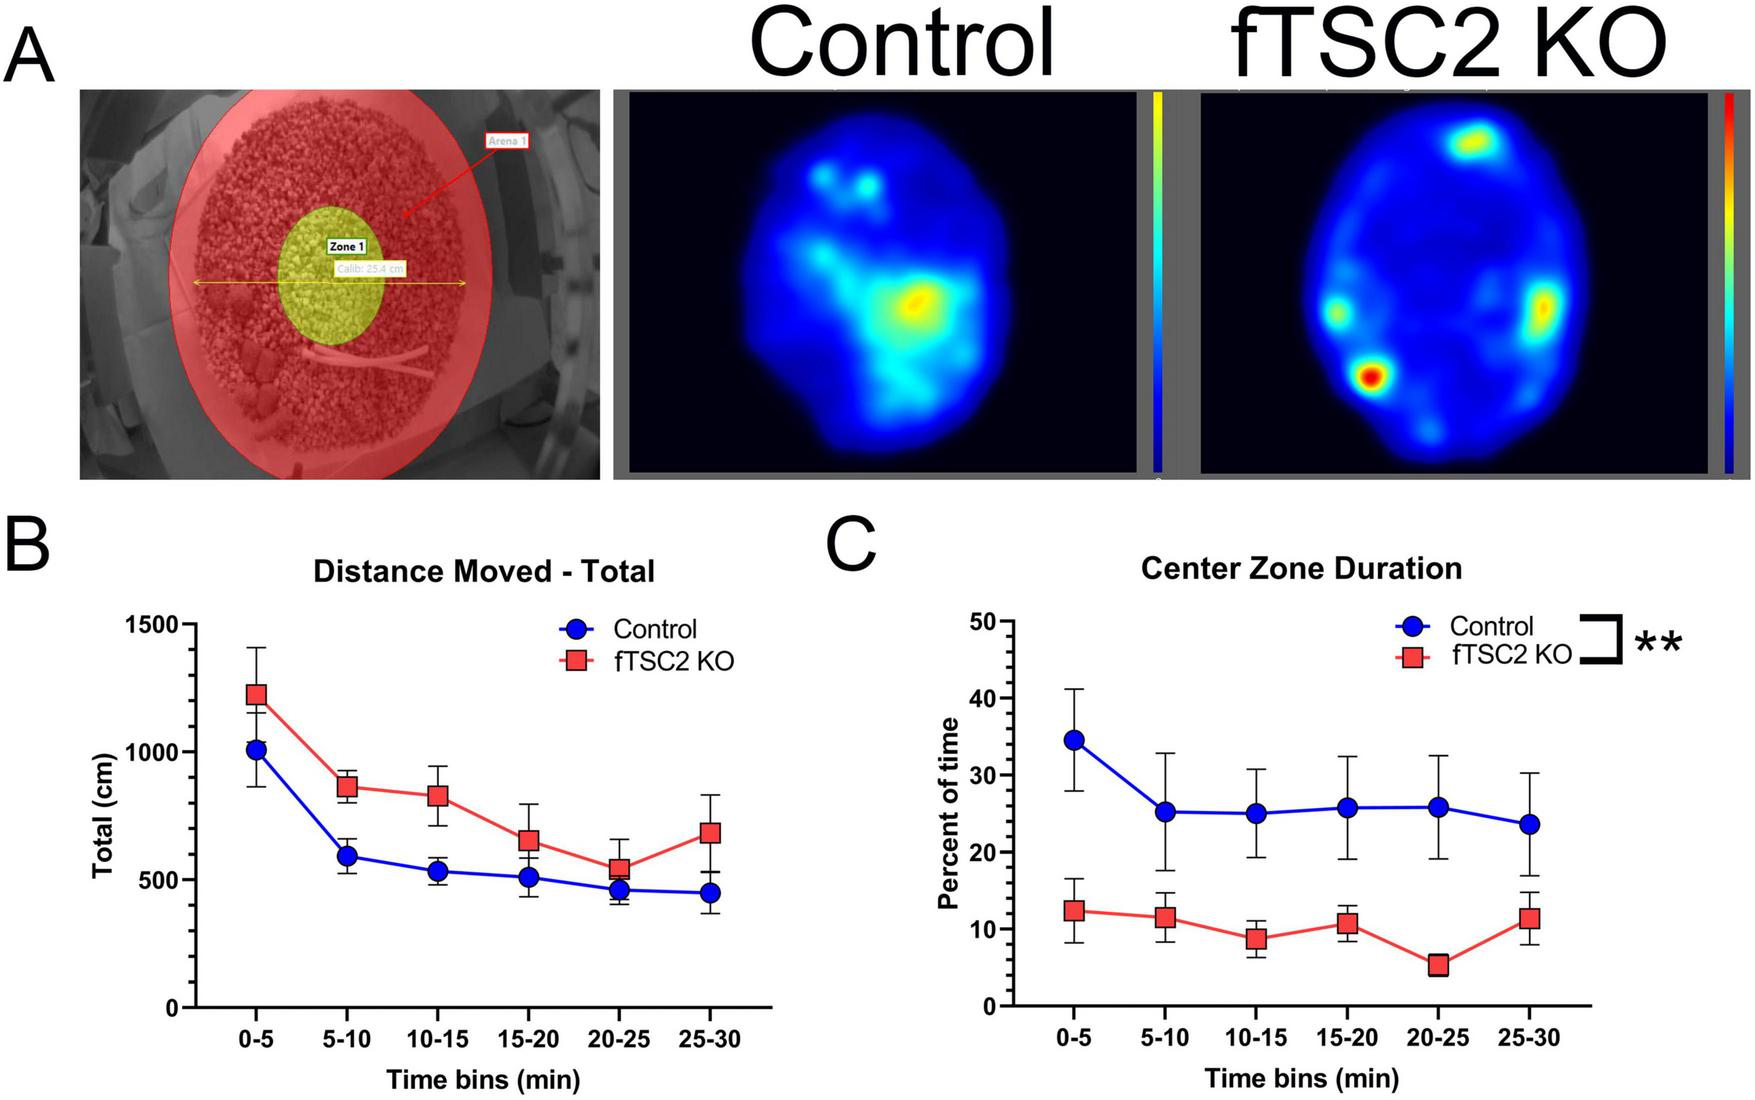
Focal Tsc2 knockout (fTSC2 KO) mice display thigmotaxic behavior. (A) Control and fTSC2 KO mice spent 30 min in an open field, consisting of a circular cage with a 10-inch diameter and 8-inch wall height. The center zone (left image, yellow area) was defined as the middle 4-inch of the field. Animals were tracked and analyzed using EthoVision XT (Noldus Information Technology). Group heat maps show the average locations where control and fTSC2 KO mice spent their time. (B) The distance traveled in the open field was split into 5 min bins. Control and fTSC2 KO mice spent more time exploring the open field in the first 5 min, but their distance traveled was comparable. (C) fTSC2 KO mice spent less time in the center zone when compared with control mice. **, p < 0.01.
Of interest, the location where control/Td + and fTSC2 KO/Td + mice spent their time differed between groups. fTSC2 KO/Td + mice spent less time in the center zone compared to controls during all time bins Figure 5C; Two-way RM ANOVA [Fgroup(1,15) = 9.158, p = 0.009; Ftime(5,75) = 1.293, p = 0.276]. In a visual representation, group heat maps illustrate the propensity of fTSC2 KO/Td + mice to remain along the walls, whereas the control mice had more activity in the center zone (Figure 5A, generated by EthoVision XT software). The fTSC2 KO/Td + mice barely explored the center zones (9.985% ± 3.779% time in center), mostly moving around the outer edge, while the controls/Td + explored the center area of the novel cage approximately a quarter of the time (26.657% ± 4.008%).
4 Discussion
TSC2 mutations have been associated with abnormal cell growth, intellectual disabilities, and neuropsychological disorders in patients, with 80%–90% having epilepsy (Holmes and Stafstrom, 2007). Here we show that focal lesions containing TSC2 KO cells are sufficient to cause epilepsy. In addition to recapitulating the seizure phenotype seen in TSC patients, histological changes in our fTSC2 KO mice largely model the disorder. TSC2 KO cells in this model are enlarged and have increased pS6 expression, while the lesions exhibit decreased inhibitory cell density and have increased microglia activation that extends outside of the lesion. Further, analysis of exploratory behavior indicated that TSC2 KO cells are sufficient to cause behavioral changes in the mice, namely anxiety-associated thigmotaxic behavior. This novel fTSC2 KO model allows for future studies to investigate the underlying mechanisms of epileptogenesis and behavioral deficits associated with TSC, as well as characterize how the lesion size and location can impact seizure severity and cognitive consequences.
4.1 Model comparison
In comparison to other TSC mouse models, our fTSC2 KO mice had smaller, focal cortical lesions, likely from a combination of both timing and injection target. Excitatory cells reach their final position during their first week of life (Kast and Levitt, 2019). In our postnatal day 2 injection model, knockout cells were likely near their final location before loss of the targeted protein; future experiments will focus on characterizing how cortical network development proceeds following viral infection in this model. In contrast, IUE models target cells undergoing development and migration, leading to a larger spread of abnormal neurons. Second, our injections targeted the frontal cortex, where the virus would affect a focal area with a heterogenous population of excitatory and inhibitory neurons. The Tsc1 KO model by Prabhakar et al. (2013) also used a neonatal viral injection to initiate gene deletion at the same developmental time, but their intraventricular injections produced a scattering of abnormal cells. IUE manipulations, which target radial glial cells, can impact both neurons and glial cells and often cause large numbers of abnormal cells to span a cortical layer (Nguyen and Bordey, 2021). Altogether, our model targeted a small area of neurons, after most cortical development occurred, to create a focal lesion capable of generating seizures.
Our fTSC2 KO mice have a comparable phenotype to some IUE models of TSC but with fewer technical challenges. IUE models have been effective at manipulating specific neural populations by targeting neurons on specific embryonic days. Manipulations on embryonic day 14–15 impacted layer II/III principal cells, the same neurons thought to be severely affected during malformation of cortical development (Blümcke et al., 2009; D’Gama and Walsh, 2018). In each of these cases, animals went on to develop abnormal cells, with seizures beginning at 3–7 weeks (Hsieh et al., 2016; Lim et al., 2017; Reijnders et al., 2017); these mice typically have a normal lifespan (Nguyen and Bordey, 2022). Interestingly, a model of RhebCA-electroporated mice had a similar seizure phenotype (approximately 5.7 seizures per day with mean duration of 39.4 s) (Hsieh et al., 2016) compared to our fTSC2 KO mice (5.3 seizures per day with mean duration of 42.2 s). Of note, our model did not have any evidence of mislamination associated with TSC, and abnormal cells spanned more cortical layers than the timed IUE models. However, IUE is challenging and can face low transfection efficiency, variability issues, and low pup survival rates (Nguyen and Bordey, 2022). Viral neonatal injections can be quick (a litter can take less than an hour to inject) and few to no mice are lost from the injection (Kim et al., 2014).
4.2 Epilepsy phenotype
Our fTSC2 KO model recapitulated the seizure phenotype of TSC patients, with less severe epilepsy and mortality than some other mouse models. Mice with a neonatal, intraventricular viral knockout of Tsc1 displayed seizures within 2–3 weeks of age and had a mean survival age of only 66.5 days (Prabhakar et al., 2013). Other TSC models also have a severe phenotype, with seizures starting as young as 10 days post-gene deletion and early mortality spanning from 20 days post-gene deletion to under 8 weeks old (Wilson et al., 2005; Meikle et al., 2007; Way et al., 2009; Zeng et al., 2011; Prabhakar et al., 2013; Lim et al., 2017; Koene et al., 2019). In comparison, our fTSC2 KO mice exhibited robust seizures at 8 weeks of age when EEG recording started, suggesting seizures began at younger ages. Although we only recorded from mice for 7 days, we recorded from mice from ages 8 to 18 weeks old, and all fTSC2 KO mice had seizures. This data suggests that seizures would continue after the recording period, although future studies will be needed to assess longer-term seizure dynamics to determine if they would change in frequency or intensity. Importantly, over two-thirds of fTSC2 KO EEG mice survived until tissue harvest at up to 20 weeks old. This increased life span of fTSC2 KO mice would allow time to delineate mechanisms underlying epileptogenesis and allow for manipulations to investigate possible treatments.
4.3 Inhibitory neuron loss
Loss of or weakened inhibition has been detected in both patients and animal models of TSC and mTOR hyperactivation (Valencia et al., 2006; Talos et al., 2012; Bateup et al., 2013a; Zhong et al., 2021; Scheper et al., 2024). Here, we focused our investigation on PV and SST interneurons, two populations that are essential for cortical circuits and are known to be impacted in patients (Valencia et al., 2006; Scheper et al., 2024). PV and SST are found throughout layers II through IV, with both synapsing onto excitatory pyramidal cells (Xu et al., 2010; Naka and Adesnik, 2016). Our model showed significant PV loss in layers II/III to IV and SST loss primarily in deeper regions resembling layer V, consistent with previously described laminar distributions (Wall et al., 2016; Zhong et al., 2021). While our model results in less viral infection near the cortical edge, the loss of PV and SST was not proportional to the density of mCherry + cells; SST cell density reductions were most prominent in the mid-to-deeper cortical layers. These results are consistent with many other animal models of mTOR hyperactivation and spontaneous seizures that have also reported interneuron loss, including IUE of PIK3CA with hyperactive mTOR in the cortex (Zhong et al., 2021) and PTEN loss in dentate granule cells (LaSarge et al., 2021), although not all report this finding (Hsieh et al., 2016).
Our data lead us to question if interneuron loss is (1) a step in the epileptogenic process of our model, (2) a consequence of seizure activity, occurring once a threshold number of inhibitory cells are lost, or (3) due to failed migration of inhibitory cells to their appropriate cortical locations. Interestingly, interneuron loss preceded seizure activity in the IUE of PIK3CA model (Zhong et al., 2021). If inhibitory cell loss has a threshold, then the lack of correlation between seizure number and inhibitory density in our mice may indicate that they are past the threshold. Unfortunately, our study cannot disentangle the cause or timing of the interneuron loss. To determine whether interneuron loss contributes to seizures or is caused by them, future studies will investigate fTSC2 KO mice at the time of their first seizure. This would allow us to assess whether inhibitory cells are already absent, incorrectly localized, or expressing cell death markers. Additional experiments will also investigate TSC2 KO cells localized to a single hemisphere to better discriminate between the effects of epileptogenesis and seizure activity.
Of note, a small population of inhibitory cells were infected by our CaMKIIa virus. Previously, CaMKIIa was thought to be a specific promoter for excitatory cells (Liu and Jones, 1996). However, labeling via a miRNA-based viral gene targeting strategy recently showed that a small population of PV and SST interneurons in the cortex express CaMKIIa (Keaveney et al., 2020). Our model confirms this expression pattern, in which an average of 3% of SST and 5% of PV cells expressed mCherry in the control mice.
Our data suggests that Tsc2 deletion may enhance the survivability of SST interneurons, as evidenced by the increased proportion of SST-mCherry + cells in our fTSC2 KO mice. There were no apparent changes in the phenotypic marker expression between the SST and PV cells, as the proportion of mCherry + SST and PV cells remained comparable between control and KO mice. Previous investigation from Malik et al. (2019) found that a subset of Tsc1 deficient SSTs cells expressed PV and adopted the fast-spiking properties that are characteristic of that cell type, suggesting that mTOR signaling influences interneuron identity. A key distinction between the models is the timing of gene deletion. In our study, interneurons were post-mitotic and maturing at the time of Tsc2 loss, whereas in the Tsc1-deficient SST model, deletion occurred during embryonic development. Our later timing likely limited the impact of Tsc2 deletion on cell phenotypic expression, instead influencing cell size and survival. These findings highlight the importance of developmental timing and gene expression in shaping the interneuron population and the importance of further investigation into the distinct roles of Tsc1 and Tsc2 in interneuron development in TSC.
4.4 Inflammatory response
Gliosis and microglia reactivity were previously observed in patients and mouse models with mTOR hyperactivity, although our model only showed increased microglia activation. TSC patients have increased density and activation of microglia (Zimmer et al., 2020), especially in the lesion area and close to dysmorphic cells (Boer et al., 2008). Cortical tubers typically have an increased expression of GFAP and higher numbers of astrocytes in patients (Binder and Steinhäuser, 2021). Our fTSC2 KO mice recapitulate the patient lesion phenotype, showing increased microglia activation without GFAP labeling, highlighting a selective inflammatory response.
Inflammation has been closely linked to seizure activity in mouse models (Feliciano et al., 2011; Nguyen et al., 2019). Here, fTSC2 KO mice with lower seizure frequency had increased inflammation, outside the range of controls and at higher levels than mice with a higher seizure burden. This correlation leads to multiple possibilities. One is that a low number of seizures may trigger inflammation, while chronic epilepsy with high seizure burden could lead to dysregulation. Previous research has suggested that sustained brain inflammation becomes dysregulated in chronic epilepsy (Ravizza et al., 2024). Additionally, inflammation may be influenced or triggered by external factors such as our surgical intervention. Post-surgical inflammation could confound our interpretations of seizure-related inflammatory changes, although both the controls and fTSC2 KO mice underwent similar surgeries. Another possibility is that epileptogenic changes, like cell loss, occurred leading up to the chronic seizure phenotype, after which the inflammatory system could have reached a new homeostatic state. Our fTSC2 KO model lacked a correlation between inhibitory cell loss and seizure number. As discussed, inhibitory cell loss could have happened during epileptogenesis or during the initiation of seizures. In either possibility, gliosis and microglia activation could be triggered in connection with secondary changes accompanying epileptogenesis, to include cell death, and then decrease when vulnerable cells are gone. Future investigation into the timing of inflammation, cell loss, and epileptogenesis may shed insight into the cascade of events that occurs during epileptogenesis through to the chronic stage, potentially informing therapeutic strategies for early intervention.
4.5 Thigmotaxic, anxiety-like behavior
TSC patients often have co-morbid neurological and psychological disorders; known as tuberous sclerosis-associated neuropsychiatric disorders [TAND, (for review see Marcinkowska et al., 2023)], these disorders include autism spectrum disorders, intellectual disability, depression, and anxiety (Kingswood et al., 2017; for review, Santos et al., 2025). The multidisciplinary study of TSC, the TuberOus SClerosis registry to increase disease Awareness (TOSCA), reported 9.7% of TSC patients were diagnosed with an anxiety disorder (Kingswood et al., 2017; Marcinkowska et al., 2023). Like the patients, mouse models of TSC have shown varying anxiety phenotypes along a spectrum that corresponds to the Tsc2 genotype. Here, the fTSC2 KO lesions in frontal cortex led to anxiety-related thigmotaxic behavior, or wall hugging, in the mice without any gross motor dysfunction or motivation deficits. Thigmotaxis is widely considered an indicator of anxiety or predator avoidance (Hall and Ballachey, 1932; Seibenhener and Wooten, 2015; Zhang et al., 2023). In addition, the tendency to show thigmotaxic behavior gradually decreases over time (Simon et al., 1994).
Anxious behaviors have been observed in multiple rodent models of TSC. Tsc2 dominant negative (Tsc2-DN) mice, which have a mutation in the c-terminus that leads to Rheb activation, have exhibited an increase in anxiety-related behaviors (Ehninger and Silva, 2011; Chévere-Torres et al., 2012). Our mice behaved similarly to Tsc2-DN mice, which had decreased center exploration and traveled a similar distance in an open field; Tsc2-DN mice also spent less time in the open arms of an elevated plus maze (EPM), revealing anxiety-like behavior (Ehninger and Silva, 2011). Additionally, Tsc2 haploinsufficient rats showed similar motor activity to controls in an open field but had less exploration (Waltereit et al., 2011). On the other side of the continuum, Tsc2 ± mice performed comparably to controls in both open field and elevated plus maze mice in Ehninger et al. (2008); yet, removal of both copies of Tsc2 was associated with anxiety-like behavior. Graded loss of tuberin in a mouse model of TSC corresponded to an anxiety phenotype that corresponded to the TSC2 protein level (Yuan et al., 2012). Data supports a mechanism for mTOR in TANDs that is separate from epilepsy. Further delineation of behavioral and cognitive deficits, and their relationship to lesion size and placement, could aid in understanding and treating neuropsychological disorders in TSC patients. Future experiments with our fTSC2 KO mouse model are designed to target brain regions with varying size lesions to accomplish this task.
5 Conclusion
In conclusion, deletion of Tsc2 from neurons in a focal region of the cortex is sufficient to cause epilepsy. This model recapitulates the seizure phenotype that impacts most TSC patients, allowing for investigation into the epileptogenic process caused by this mutation. fTSC2 KO mice had abnormal cell growth, decreased inhibitory cell density, and increased microglia activation. Moreover, fTSC2 KO mice displayed an anxiety-like phenotype. Altogether, this model provides a means to investigate the link between TSC, seizures, neuropsychiatric disorders, and possible targets for therapeutic interventions.
Statements
Data availability statement
The raw data supporting the conclusions of this article will be made available by the authors, without undue reservation.
Ethics statement
The animal study was approved by CCHMC Institutional Animal Care and Use Committee (IACUC). The study was conducted in accordance with the local legislation and institutional requirements.
Author contributions
CM: Methodology, Project administration, Investigation, Writing – review & editing, Data curation, Writing – original draft. MD: Data curation, Methodology, Investigation, Writing – review & editing. LJ: Investigation, Formal analysis, Writing – original draft, Writing – review & editing, Data curation, Methodology. GW: Writing – review & editing, Writing – original draft, Methodology, Data curation. FZ: Investigation, Writing – review & editing, Methodology, Software. JR: Investigation, Writing – original draft, Resources, Software, Formal analysis, Writing – review & editing. MW: Investigation, Writing – review & editing. JO: Writing – review & editing, Investigation. SD: Conceptualization, Writing – review & editing, Resources. CL: Funding acquisition, Writing – original draft, Formal analysis, Visualization, Project administration, Resources, Methodology, Supervision, Writing – review & editing, Investigation, Conceptualization, Data curation, Validation.
Funding
The author(s) declare financial support was received for the research and/or publication of this article. This work was supported by the Department of Anesthesia at Cincinnati Children’s Hospital and the National Institute of Neurological Disorders and Stroke (SCD, Award Numbers R01NS065020, R01NS062806, and R01NS121042).
Acknowledgments
We thank Matt Kofron and Sarah McLeod of the Bio-Imaging and Analysis Facility at Cincinnati Children’s Hospital Medical Center for their microscopy assistance.
Conflict of interest
JR was employed by Noldus Information Technology Inc., the company that develops and commercializes EthoVision XT.
The remaining authors declare that the research was conducted in the absence of any commercial or financial relationships that could be construed as a potential conflict of interest.
Generative AI statement
The authors declare that no Generative AI was used in the creation of this manuscript.
Any alternative text (alt text) provided alongside figures in this article has been generated by Frontiers with the support of artificial intelligence and reasonable efforts have been made to ensure accuracy, including review by the authors wherever possible. If you identify any issues, please contact us.
Publisher’s note
All claims expressed in this article are solely those of the authors and do not necessarily represent those of their affiliated organizations, or those of the publisher, the editors and the reviewers. Any product that may be evaluated in this article, or claim that may be made by its manufacturer, is not guaranteed or endorsed by the publisher.
References
1
Abs E. Goorden S. M. Schreiber J. Overwater I. E. Hoogeveen-Westerveld M. Bruinsma C. F. et al (2013). TORC1-dependent epilepsy caused by acute biallelic Tsc1 deletion in adult mice.Ann. Neurol.74569–579. 10.1002/ana.23943
2
Aronica E. Specchio N. Luinenburg M. J. Curatolo P. (2023). Epileptogenesis in tuberous sclerosis complex-related developmental and epileptic encephalopathy.Brain1462694–2710. 10.1093/brain/awad048
3
Bateup H. S. Denefrio C. L. Johnson C. A. Saulnier J. L. Sabatini B. L. (2013a). Temporal dynamics of a homeostatic pathway controlling neural network activity.Front. Mol. Neurosci.6:28. 10.3389/fnmol.2013.00028
4
Bateup H. S. Johnson C. A. Denefrio C. L. Saulnier J. L. Kornacker K. Sabatini B. L. (2013b). Excitatory/inhibitory synaptic imbalance leads to hippocampal hyperexcitability in mouse models of tuberous sclerosis.Neuron78510–522. 10.1016/j.neuron.2013.03.017
5
Binder D. K. Steinhäuser C. (2021). Astrocytes and epilepsy.Neurochem. Res.462687–2695. 10.1007/s11064-021-03236-x
6
Bissler J. J. Kingswood J. C. Radzikowska E. Zonnenberg B. A. Belousova E. Frost M. D. et al (2017). Everolimus long-term use in patients with tuberous sclerosis complex: Four-year update of the EXIST-2 study.PLoS One12:e0180939. 10.1371/journal.pone.0180939
7
Blümcke I. Vinters H. V. Armstrong D. Aronica E. Thom M. Spreafico R. (2009). Malformations of cortical development and epilepsies: Neuropathological findings with emphasis on focal cortical dysplasia.Epileptic Disord.11181–193. 10.1684/epd.2009.0261
8
Boer K. Jansen F. Nellist M. Redeker S. van den Ouweland A. M. Spliet W. G. et al (2008). Inflammatory processes in cortical tubers and subependymal giant cell tumors of tuberous sclerosis complex.Epilepsy Res.787–21. 10.1016/j.eplepsyres.2007.10.002
9
Chévere-Torres I. Maki J. M. Santini E. Klann E. (2012). Impaired social interactions and motor learning skills in tuberous sclerosis complex model mice expressing a dominant/negative form of tuberin.Neurobiol. Dis.45156–164. 10.1016/j.nbd.2011.07.018
10
Choi Y. J. Di Nardo A. Kramvis I. Meikle L. Kwiatkowski D. J. Sahin M. et al (2008). Tuberous sclerosis complex proteins control axon formation.Genes Dev.222485–2495. 10.1101/gad.1685008
11
Chow D. K. Groszer M. Pribadi M. Machniki M. Carmichael S. T. Liu X. et al (2009). Laminar and compartmental regulation of dendritic growth in mature cortex.Nat. Neurosci.12116–118. 10.1038/nn.2255
12
Curatolo P. Nabbout R. Lagae L. Aronica E. Ferreira J. C. Feucht M. et al (2018). Management of epilepsy associated with tuberous sclerosis complex: Updated clinical recommendations.Eur. J. Paediatr. Neurol.22738–748. 10.1016/j.ejpn.2018.05.006
13
Delia M. T. Delia M. T. Hongyu S. Béla K. Hongyu S. Bela K. et al (2012). Altered inhibition in tuberous sclerosis and type IIb cortical dysplasia.Ann. Neurol.71539–551. 10.1002/ana.22696
14
D’Gama A. M. Walsh C. A. (2018). Somatic mosaicism and neurodevelopmental disease.Nat. Neurosci.211504–1514. 10.1038/s41593-018-0257-3
15
Dusing M. LaSarge C. L. White A. Jerow L. G. Gross C. Danzer S. C. (2023). Neurovascular development in Pten and Tsc2 mouse mutants.eNeuro10:ENEURO.0340-22.2023. 10.1523/ENEURO.0340-22.2023
16
Ehninger D. Silva A. J. (2011). Increased levels of anxiety-related behaviors in a Tsc2 dominant negative transgenic mouse model of tuberous sclerosis.Behav. Genet.41357–363. 10.1007/s10519-010-9398-1
17
Ehninger D. Han S. Shilyansky C. Zhou Y. Li W. Kwiatkowski D. J. et al (2008). Reversal of learning deficits in a Tsc2+/- mouse model of tuberous sclerosis.Nat. Med.14843–848. 10.1038/nm1788
18
Feliciano D. M. Su T. Lopez J. Platel J.-C. Bordey A. (2011). Single-cell Tsc1 knockout during corticogenesis generates tuber-like lesions and reduces seizure threshold in mice.J. Clin. Invest.1211596–1607. 10.1172/jci44909
19
Fingar D. C. Blenis J. (2004). Target of rapamycin (TOR): An integrator of nutrient and growth factor signals and coordinator of cell growth and cell cycle progression.Oncogene233151–3171. 10.1038/sj.onc.1207542
20
Franz D. N. Budde K. Kingswood J. C. Belousova E. Sparagana S. De Vries P. J. et al (2018). Effect of everolimus on skin lesions in patients treated for subependymal giant cell astrocytoma and renal angiomyolipoma: Final 4-year results from the randomized EXIST-1 and EXIST-2 studies.J. Eur. Acad. Dermatol. Venereol.321796–1803. 10.1111/jdv.14964
21
Fraser M. M. Zhu X. Kwon C.-H. Uhlmann E. J. Gutmann D. H. Baker S. J. (2004). Pten loss causes hypertrophy and increased proliferation of astrocytes in vivo.Cancer Res.647773–7779. 10.1158/0008-5472.can-04-2487
22
French J. A. Lawson J. A. Yapici Z. Ikeda H. Polster T. Nabbout R. et al (2016). Adjunctive everolimus therapy for treatment-resistant focal-onset seizures associated with tuberous sclerosis (EXIST-3): A phase 3, randomised, double-blind, placebo-controlled study.Lancet3882153–2163. 10.1016/s0140-6736(16)31419-2
23
Hall C. Ballachey E. L. (1932). A study of the rat’s behavior in a field. A contribution to method in comparative psychology. University of California Publications Psychol.6, 1–12.
24
Heneka M. T. Kummer M. P. Latz E. (2014). Innate immune activation in neurodegenerative disease.Nat. Rev. Immunol.14463–477. 10.1038/nri3705
25
Hernandez O. Way S. McKenna J. Gambello M. J. (2007). Generation of a conditional disruption of the Tsc2 gene.Genesis45101–106. 10.1002/dvg.20271
26
Holmes G. L. Stafstrom C. E. (2007). Tuberous sclerosis complex and epilepsy: Recent developments and future challenges.Epilepsia48617–630. 10.1111/j.1528-1167.2007.01035.x
27
Hsieh L. S. Wen J. H. Claycomb K. Huang Y. Harrsch F. A. Naegele J. R. et al (2016). Convulsive seizures from experimental focal cortical dysplasia occur independently of cell misplacement.Nat. Commun.7:11753. 10.1038/ncomms11753
28
Jobst B. C. Cascino G. D. (2015). Resective epilepsy surgery for drug-resistant focal epilepsy: A review.JAMA313285–293. 10.1001/jama.2014.17426
29
Kast R. J. Levitt P. (2019). Precision in the development of neocortical architecture: From progenitors to cortical networks.Progr. Neurobiol.17577–95. 10.1016/j.pneurobio.2019.01.003
30
Keaveney M. K. Rahsepar B. Tseng H. A. Fernandez F. R. Mount R. A. Ta T. et al (2020). CaMKIIalpha-positive interneurons identified via a microRNA-based viral gene targeting strategy.J. Neurosci.409576–9588. 10.1523/JNEUROSCI.2570-19.2020
31
Kim J. Y. Grunke S. D. Levites Y. Golde T. E. Jankowsky J. L. (2014). Intracerebroventricular viral injection of the neonatal mouse brain for persistent and widespread neuronal transduction.J. Vis. Exp.91:51863. 10.3791/51863
32
Kingswood J. C. D’Augères G. B. Belousova E. Ferreira J. C. Carter T. Castellana R. et al (2017). TuberOus SClerosis registry to increase disease Awareness (TOSCA) – baseline data on 2093 patients.Orphanet J. Rare Dis.12:2. 10.1186/s13023-016-0553-5
33
Kobayashi T. Minowa O. Kuno J. Mitani H. Hino O. Noda T. (1999). Renal carcinogenesis, hepatic hemangiomatosis, and embryonic lethality caused by a germ-line Tsc2 mutation in mice.Cancer Res.591206–1211.
34
Kobayashi T. Minowa O. Sugitani Y. Takai S. Mitani H. Kobayashi E. et al (2001). A germ-line Tsc1 mutation causes tumor development and embryonic lethality that are similar, but not identical to, those caused by Tsc2 mutation in mice.Proc. Natl. Acad. Sci. U S A.988762–8767. 10.1073/pnas.151033798
35
Koene L. M. C. Van Grondelle S. E. Proietti Onori M. Wallaard I. Kooijman N. H. R. M. Van Oort A. et al (2019). Effects of antiepileptic drugs in a new TSC/mTOR-dependent epilepsy mouse model.Ann. Clin. Transl. Neurol.61273–1291. 10.1002/acn3.50829
36
Kwon C. H. Luikart B. W. Powell C. M. Zhou J. Matheny S. A. Zhang W. et al (2006b). Pten regulates neuronal arborization and social interaction in mice.Neuron50377–388. 10.1016/j.neuron.2006.03.023
37
Kwon C. H. Zhu X. Zhang J. Knoop L. L. Tharp R. Smeyne R. J. et al (2001). Pten regulates neuronal soma size: A mouse model of Lhermitte-Duclos disease.Nat. Genet.29404–411. 10.1038/ng781
38
Kwon C.-H. Zhou J. Li Y. Kim K. W. Hensley L. L. Baker S. J. et al (2006a). Neuron-specific enolase-cre mouse line with cre activity in specific neuronal populations.Genesis44130–135. 10.1002/gene.20197
39
Lasarge C. L. Danzer S. C. (2014). Mechanisms regulating neuronal excitability and seizure development following mTOR pathway hyperactivation.Front. Mol. Neurosci.7:18. 10.3389/fnmol.2014.00018
40
LaSarge C. L. Pun R. Y. K. Gu Z. Riccetti M. R. Namboodiri D. V. Tiwari D. et al (2021). mTOR-driven neural circuit changes initiate an epileptogenic cascade.Progr. Neurobiol.200:101974. 10.1016/j.pneurobio.2020.101974
41
Lier J. Streit W. J. Bechmann I. (2021). Beyond activation: Characterizing microglial functional phenotypes.Cells10:2236. 10.3390/cells10092236
42
Lim J. S. Gopalappa R. Kim S. H. Ramakrishna S. Lee M. Kim W.-I. et al (2017). Somatic mutations in TSC1 and TSC2 cause focal cortical dysplasia.Am. J. Hum. Genet.100454–472. 10.1016/j.ajhg.2017.01.030
43
Lim J. S. Kim W.-I. Kang H.-C. Kim S. H. Park A. H. Park E. K. et al (2015). Brain somatic mutations in MTOR cause focal cortical dysplasia type II leading to intractable epilepsy.Nat. Med.21:395. 10.1038/nm.3824
44
Lin T. V. Hsieh L. Kimura T. Malone T. J. Bordey A. (2016). Normalizing translation through 4E-BP prevents mTOR-driven cortical mislamination and ameliorates aberrant neuron integration.Proc. Natl. Acad. Sci. U S A.11311330–11335. 10.1073/pnas.1605740113
45
Litwa K. (2022). Shared mechanisms of neural circuit disruption in tuberous sclerosis across lifespan: Bridging neurodevelopmental and neurodegenerative pathology.Front. Genet.13:997461. 10.3389/fgene.2022.997461
46
Liu G. Slater N. Perkins A. (2017). Epilepsy: Treatment options.Am. Fam. Physician9687–96.
47
Liu X. B. Jones E. G. (1996). Localization of alpha type II calcium calmodulin-dependent protein kinase at glutamatergic but not gamma-aminobutyric acid (GABAergic) synapses in thalamus and cerebral cortex.Proc. Natl. Acad. Sci.937332–7336. 10.1073/pnas.93.14.7332
48
Ma X. M. Blenis J. (2009). Molecular mechanisms of mTOR-mediated translational control.Nat. Rev. Mol. Cell Biol.10307–318. 10.1038/nrm2672
49
Magri L. Cambiaghi M. Cominelli M. Alfaro-Cervello C. Cursi M. Pala M. et al (2011). Sustained activation of mTOR pathway in embryonic neural stem cells leads to development of tuberous sclerosis complex-associated lesions.Cell. Stem Cell.9447–462. 10.1016/j.stem.2011.09.008
50
Malik R. Pai E. L.-L. Rubin A. N. Stafford A. M. Angara K. Minasi P. et al (2019). Tsc1 represses parvalbumin expression and fast-spiking properties in somatostatin lineage cortical interneurons.Nat. Commun.10:4994. 10.1038/s41467-019-12962-4
51
Marcinkowska A. B. Tarasewicz A. Jóźwiak S. Dębska-Ślizień A. Szurowska E. (2023). Tuberous sclerosis complex-associated neuropsychiatric disorders.Psychiatria Polska57823–842. 10.12740/pp/onlinefirst/146265
52
Marcotte L. Crino P. B. (2006). The neurobiology of the tuberous sclerosis complex.NeuroMolecular Med.8531–546. 10.1385/NMM:8:4:531
53
Marino S. Krimpenfort P. Leung C. van der Korput H. A. G. M. Trapman J. Camenisch I. et al (2002). PTEN is essential for cell migration but not for fate determination and tumourigenesis in the cerebellum.Development1293513–3522. 10.1242/dev.129.14.3513
54
Marsan E. Baulac S. (2018). Review: Mechanistic target of rapamycin (mTOR) pathway, focal cortical dysplasia and epilepsy.Neuropathol. Appl. Neurobiol.446–17. 10.1111/nan.12463
55
Meikle L. Pollizzi K. Egnor A. Kramvis I. Lane H. Sahin M. et al (2008). Response of a neuronal model of tuberous sclerosis to mammalian target of rapamycin (mTOR) inhibitors: Effects on mTORC1 and Akt signaling lead to improved survival and function.J. Neurosci.285422–5432. 10.1523/jneurosci.0955-08.2008
56
Meikle L. Talos D. M. Onda H. Pollizzi K. Rotenberg A. Sahin M. et al (2007). A mouse model of tuberous sclerosis: Neuronal loss of Tsc1 causes dysplastic and ectopic neurons, reduced myelination, seizure activity, and limited survival.J. Neurosci.275546–5558. 10.1523/jneurosci.5540-06.2007
57
Naka A. Adesnik H. (2016). Inhibitory circuits in cortical layer 5.Front. Neural Circuits10:35. 10.3389/fncir.2016.00035
58
Napolioni V. Moavero R. Curatolo P. (2009). Recent advances in neurobiology of tuberous sclerosis complex.Brain Dev.31104–113. 10.1016/j.braindev.2008.09.013
59
National Research Council (US) Committee for the Update of the Guide for the Care and Use of Laboratory Animals. (2011). Guide for the Care and Use of Laboratory Animals, 8th Edn. Washington, DC: National Academies Press (US). 10.17226/12910
60
Nguyen L. H. Bordey A. (2021). Convergent and divergent mechanisms of epileptogenesis in mTORopathies.Front. Neuroanat.15:664695. 10.3389/fnana.2021.664695
61
Nguyen L. H. Bordey A. (2022). Current review in basic science: Animal models of focal cortical dysplasia and epilepsy.Epilepsy Curr.22234–240. 10.1177/15357597221098230
62
Nguyen L. H. Mahadeo T. Bordey A. (2019). mTOR hyperactivity levels influence the severity of epilepsy and associated neuropathology in an experimental model of tuberous sclerosis complex and focal cortical dysplasia.J. Neurosci.392762–2773. 10.1523/jneurosci.2260-18.2019
63
Onda H. Lueck A. Marks P. W. Warren H. B. Kwiatkowski D. J. (1999). Tsc2(+/-) mice develop tumors in multiple sites that express gelsolin and are influenced by genetic background.J. Clin. Invest.104687–695. 10.1172/jci7319
64
Onori M. Martina Proietti O. Koene L. Linda M. C. K. Schafer C. Mark N. et al (2020). RHEB/mTOR-hyperactivity causing cortical malformations drives seizures through increased axonal connectivity.bioRxiv [Preprint]10.1101/2020.07.08.189399
65
Prabhakar S. Goto J. Zuang X. Sena-Esteves M. Bronson R. Brockmann J. et al (2013). Stochastic model of Tsc1 lesions in mouse brain.PLoS One8:e64224. 10.1371/journal.pone.0064224
66
Ravizza T. Scheper M. Di Sapia R. Gorter J. Aronica E. Vezzani A. (2024). mTOR and neuroinflammation in epilepsy: Implications for disease progression and treatment.Nat. Rev. Neurosci.25334–350. 10.1038/s41583-024-00805-1
67
Reijnders M. R. F. Kousi M. Van Woerden G. M. Klein M. Bralten J. Mancini G. M. S. et al (2017). Variation in a range of mTOR-related genes associates with intracranial volume and intellectual disability.Nat. Commun.8:1052. 10.1038/s41467-017-00933-6
68
Rosser T. Panigrahy A. McClintock W. (2006). The diverse clinical manifestations of tuberous sclerosis complex: A review.Semin. Pediatr. Neurol.1327–36. 10.1016/j.spen.2006.01.008
69
Rossi D. (2015). Astrocyte physiopathology: At the crossroads of intercellular networking, inflammation and cell death.Prog. Neurobiol.13086–120. 10.1016/j.pneurobio.2015.04.003
70
Rout P. Thomas A. (2025). “Tuberous sclerosis [Updated 2025 Jun 2],” in StatPearls [Internet]. Treasure Island, FL: StatPearls Publishing. Available online at: https://www.ncbi.nlm.nih.gov/books/NBK538492/
71
Santos V. R. Jerow L. G. LaSarge C. L. (2025). Behavioral analyses in rodent models of tuberous sclerosis complex.Epilepsy Behav.165:110313. 10.1016/j.yebeh.2025.110313
72
Sanz P. Garcia-Gimeno M. A. (2020). Reactive glia inflammatory signaling pathways and epilepsy.Int. J. Mol. Sci.21:4096. 10.3390/ijms21114096
73
Sasongko T. H. Kademane K. Chai Soon, Hou S. Jocelyn T. X. Zabidi-Hussin Z. (2023). Rapamycin and rapalogs for tuberous sclerosis complex.Cochrane Database Syste. Rev.7:CD011272. 10.1002/14651858.CD011272.pub3
74
Scheper M. Sørensen F. N. F. Ruffolo G. Gaeta A. Lissner L. J. Anink J. J. et al (2024). Impaired GABAergic regulation and developmental immaturity in interneurons derived from the medial ganglionic eminence in the tuberous sclerosis complex.Acta Neuropathol.147:80. 10.1007/s00401-024-02737-7
75
Seibenhener M. L. Wooten M. C. (2015). Use of the open field maze to measure locomotor and anxiety-like behavior in mice.J. Vis. Exp.96:e52434. 10.3791/52434
76
Simon P. Dupuis R. Costentin J. (1994). Thigmotaxis as an index of anxiety in mice. Influence of dopaminergic transmissions.Behav. Brain Res.6159–64. 10.1016/0166-4328(94)90008-6
77
Specchio N. Pavia G. C. De Palma L. De Benedictis A. Pepi C. Conti M. et al (2022). Current role of surgery for tuberous sclerosis complex-associated epilepsy.Pediatr. Invest.616–22. 10.1002/ped4.12312
78
Talos D. M. Sun H. Zhou X. Fitzgerald E. C. Jackson M. C. Klein P. M. et al (2012). The interaction between early life epilepsy and autistic-like behavioral consequences: A role for the mammalian target of rapamycin (mTOR) pathway.PLoS One7:e35885. 10.1371/journal.pone.0035885
79
Tarkowski B. Kuchcinska K. Blazejczyk M. Jaworski J. (2019). Pathological mTOR mutopment.Hum. Mol. Genet.282107–2119. 10.1093/hmg/ddz042
80
Tsai V. Parker W. E. Orlova K. A. Baybis M. Chi A. W. Berg B. D. et al (2014). Fetal brain mTOR signaling activation in tuberous sclerosis complex.Cereb. Cortex24315–327. 10.1093/cercor/bhs310
81
Valencia I. Legido A. Yelin K. Khurana D. Kothare S. V. Katsetos C. D. (2006). Anomalous inhibitory circuits in cortical tubers of human tuberous sclerosis complex associated with refractory epilepsy: Aberrant expression of parvalbumin and calbindin-D28k in dysplastic cortex.J. Child Neurol.211058–1063. 10.1177/7010.2006.00242
82
Wall N. R. De La Parra M. Sorokin J. M. Taniguchi H. Huang Z. J. Callaway E. M. (2016). Brain-wide maps of synaptic input to cortical interneurons.J. Neurosci.364000–4009. 10.1523/jneurosci.3967-15.2016
83
Waltereit R. Japs B. Schneider M. de Vries P. J. Bartsch D. (2011). Epilepsy and Tsc2 haploinsufficiency lead to autistic-like social deficit behaviors in rats.Behav. Genet.41364–372. 10.1007/s10519-010-9399-0
84
Wang Y. Greenwood J. S. Calcagnotto M. E. Kirsch H. E. Barbaro N. M. Baraban S. C. (2007). Neocortical hyperexcitability in a human case of tuberous sclerosis complex and mice lacking neuronal expression of TSC1.Ann. Neurol.61139–152. 10.1002/ana.21058
85
Wataya-Kaneda M. Ohno Y. Fujita Y. Yokozeki H. Niizeki H. Ogai M. et al (2018). Sirolimus gel treatment vs placebo for facial angiofibromas in patients with tuberous sclerosis complex.JAMA Dermatol.154:781. 10.1001/jamadermatol.2018.1408
86
Way S. W. McKenna J. Mietzsch U. Reith R. M. Wu H. C. Gambello M. J. (2009). Loss of Tsc2 in radial glia models the brain pathology of tuberous sclerosis complex in the mouse.Hum. Mol. Genet.181252–1265. 10.1093/hmg/ddp025
87
Wilson C. Idziaszczyk S. Parry L. Guy C. Griffiths D. F. Lazda E. et al (2005). A mouse model of tuberous sclerosis 1 showing background specific early post-natal mortality and metastatic renal cell carcinoma.Hum. Mol. Genet.141839–1850. 10.1093/hmg/ddi190
88
Xu X. Roby K. D. Callaway E. M. (2010). Immunochemical characterization of inhibitory mouse cortical neurons: Three chemically distinct classes of inhibitory cells.J. Compar. Neurol.518389–404. 10.1002/cne.22229
89
Yamashiro K. Ikegaya Y. Matsumoto N. (2022). In utero electroporation for manipulation of specific neuronal populations.Membranes12:513. 10.3390/membranes12050513
90
Yang Z. Wang K. K. (2015). Glial fibrillary acidic protein: From intermediate filament assembly and gliosis to neurobiomarker.Trends Neurosci.38364–374. 10.1016/j.tins.2015.04.003
91
Yuan E. Tsai P. T. Greene-Colozzi E. Sahin M. Kwiatkowski D. J. Malinowska I. A. (2012). Graded loss of tuberin in an allelic series of brain models of TSC correlates with survival, and biochemical, histological and behavioral features.Hum. Mol. Genet.214286–4300. 10.1093/hmg/dds262
92
Yue Q. Groszer M. Gil J. S. Berk A. J. Messing A. Wu H. et al (2005). PTEN deletion in Bergmann glia leads to premature differentiation and affects laminar organization.Development1323281–3291. 10.1242/dev.01891
93
Zaroff C. M. Barr W. B. Carlson C. Lajoie J. Madhavan D. Miles D. K. et al (2006). Mental retardation and relation to seizure and tuber burden in tuberous sclerosis complex.Seizure15558–562. 10.1016/j.seizure.2006.06.010
94
Zeng L.-H. Rensing N. R. Zhang B. Gutmann D. H. Gambello M. J. Wong M. (2011). Tsc2 gene inactivation causes a more severe epilepsy phenotype than Tsc1 inactivation in a mouse model of tuberous sclerosis complex.Hum. Mol. Genet.20445–454. 10.1093/hmg/ddq491
95
Zhang L. Huang T. Teaw S. Nguyen L. H. Hsieh L. S. Gong X. et al (2020). Filamin A inhibition reduces seizure activity in a mouse model of focal cortical malformations.Sci. Transl. Med.12:eaay0289. 10.1126/scitranslmed.aay0289
96
Zhang X. Y. Diaz-delCastillo M. Kong L. Daniels N. MacIntosh-Smith W. Abdallah A. et al (2023). A systematic review and meta-analysis of thigmotactic behaviour in the open field test in rodent models associated with persistent pain.PLoS One18:e0290382. 10.1371/journal.pone.0290382
97
Zhong S. Zhao Z. Xie W. Cai Y. Zhang Y. Ding J. et al (2021). GABAergic interneuron and neurotransmission are mTOR-dependently disturbed in experimental focal cortical dysplasia.Mol. Neurobiol.58156–169. 10.1007/s12035-020-02086-y
98
Zhou J. Blundell J. Ogawa S. Kwon C.-H. Zhang W. Sinton C. et al (2009). Pharmacological inhibition of mTORC1 suppresses anatomical, cellular, and behavioral abnormalities in neural-specific Pten knock-out mice.J. Neurosci.291773–1783. 10.1523/JNEUROSCI.5685-08.2009
99
Zimmer T. S. Broekaart D. W. M. Gruber V. E. van Vliet E. A. Mühlebner A. Aronica E. (2020). Tuberous sclerosis complex as disease model for investigating mTOR-related gliopathy during epileptogenesis.Front. Neurol.11:1028. 10.3389/fneur.2020.01028
Summary
Keywords
mTOR, tuberous sclerosis complex, epileptogenesis, cortical development, parvalbumin, somatostatin
Citation
McCoy C, Dusing M, Jerow LG, Winstel GC, Zhan F, Rogers JL, Wesley M, Otten JB, Danzer SC and LaSarge CL (2025) Focal postnatal deletion of Tsc2 causes epilepsy. Front. Mol. Neurosci. 18:1686023. doi: 10.3389/fnmol.2025.1686023
Received
14 August 2025
Accepted
20 October 2025
Published
03 November 2025
Volume
18 - 2025
Edited by
Guomei Tang, Columbia University, United States
Reviewed by
David M. Feliciano, Clemson University, United States
Daniel Vogt, Michigan State University, United States
Updates
Copyright
© 2025 McCoy, Dusing, Jerow, Winstel, Zhan, Rogers, Wesley, Otten, Danzer and LaSarge.
This is an open-access article distributed under the terms of the Creative Commons Attribution License (CC BY). The use, distribution or reproduction in other forums is permitted, provided the original author(s) and the copyright owner(s) are credited and that the original publication in this journal is cited, in accordance with accepted academic practice. No use, distribution or reproduction is permitted which does not comply with these terms.
*Correspondence: Candi L. LaSarge, candi.lasarge@cchmc.org
Disclaimer
All claims expressed in this article are solely those of the authors and do not necessarily represent those of their affiliated organizations, or those of the publisher, the editors and the reviewers. Any product that may be evaluated in this article or claim that may be made by its manufacturer is not guaranteed or endorsed by the publisher.