Abstract
Introduction:
Plant decoctions are especially valued in ethnomedicine for their simplicity, accessibility, and effectiveness in delivering therapeutic compounds. Chemical analysis of such decoctions can be challenging due to their unique composition, predominantly consisting of polar compounds. In this context, an analytical workflow was developed using HILIC and reversed-phase chromatography. The decoction of Combretum micranthum, a medicinal plant widely used in African traditional medicine and particularly in Senegal for the treatment of hypertension, was used for a proof-of-concept.
Methods:
The chemical profile of the decoction was established using UHPLC-PDA-CAD-HRMS/MS with both HILIC and reversed-phase chromatographic techniques, and a molecular network was generated from HR-MS/MS data to establish comprehensive metabolite annotations and make connections between metabolites. Following a butanol/water liquid-liquid partition, compounds were isolated by semi-preparative HPLC-UV with dry load injection, separating polar compounds via HILIC and medium-polarity compounds via reversed-phase chromatography. Major polar constituents were quantified by 1H-NMR.
Results and discussion:
This approach enabled the annotation of 10 metabolites based on high-resolution MS/MS data, with their identities subsequently confirmed through isolation and de novo structural elucidation. In total, the isolation strategy yielded 13 compounds, which were characterized by NMR and HRMS analyses. The phytochemical analysis highlighted the predominance of very polar compounds (choline, stachydrine, betonicine, and quinic acid) alongside nine flavonoid derivatives from the less polar fraction, with triacetiflavan (13.6%) and betonicine (5.1%) as major constituents. Quantitative 1H-NMR analysis allowed choline to be quantified at 0.1%, stachydrine at 1.3%, and betonicine at 5.1% in the traditional water decoction. Notably, several compounds such as stachydrine, vitexin, and isovitexin possess known cardiovascular activities associated with hypotensive effects, which may underline the traditional use of C. micranthum decoction as a hypotensive agent. The workflow proposed here, particularly the complementary use of HILIC and reversed-phase chromatography for the analysis and isolation of polar compounds, offers a valuable approach for advancing knowledge of the chemical composition of traditional plant decoctions.
Introduction
Combretum micranthum G. Don (Q1245859) is a shrub of the Combretaceae family, widely distributed in West Africa and parts of India (Q44002). The genus Combretum (Q1777188) comprises about 370 species, many of which are used in traditional medicine (Fyhrquist et al., 2002; Eloff et al., 2008; Lima et al., 2012). In West Africa, Combretum micranthum is known as Kinkéliba, meaning “medicine,” reflecting its widespread use as a universal remedy (Welch, 2010). The plant is mainly consumed as a herbal tea prepared by decoction of dried leaves. Traditionally, the leaves are used for gastrointestinal disorders such as nausea and in the management of type I and II diabetes (Fyhrquist et al., 2002; Eloff et al., 2008; Chika and Bello, 2010; Lima et al., 2012; Tine et al., 2024).
In Senegal, leaf decoction is consumed daily, particularly at breakfast, and is reported to display diuretic, cholagogue, and hypotensive properties (Welch, 2010). The antihypertensive effect of C. micranthum extract was clinically demonstrated in cases of uncomplicated arterial hypertension (Seck et al., 2017). A recent randomized clinical trial compared C. micranthum decoction with captopril, showing that after 6 months, the decoction reduced blood pressure significantly and as effectively as the drug (Bourqui et al., 2021). However, the metabolites responsible for this antihypertensive activity remain poorly understood.
Phytochemical studies reveal that C. micranthum leaves contain flavonoids (Welch et al., 2018; Kpemissi et al., 2019), triterpenes (Welch, 2010), alkaloids (Bassene et al., 1986), and fatty acids (Bougma et al., 2021). Most investigations have focused on organic solvent extracts, particularly methanol and ethanol (Welch et al., 2018; Kpemissi et al., 2019). While these extracts are suitable for compound identification, they do not accurately represent the aqueous decoctions traditionally consumed in West Africa; consequently, the metabolite composition of such decoctions remains largely underexplored.
HILIC effectively separates polar compounds that are not well retained by reversed-phase (RP), making it ideal for profiling highly polar analytes. It uses a polar stationary phase and a mostly organic mobile phase, typically acetonitrile with some water or buffer, to retain polar analytes via partitioning and hydrogen bonding (Alpert, 1990; McCalley, 2017). RP and HILIC are widely employed in body fluid metabolomics due to their complementary retention mechanisms, which enable the analysis of both nonpolar and polar compounds (Tang et al., 2016). However, this dual approach is rarely applied in natural products metabolomics, where single-mode separations dominate and only a few studies employ polarity-extended or serial-coupling methods for plant or fungal extracts. HILIC is widely used for polar natural product analysis, especially with mass spectrometry (Tang et al., 2016; Gevrenova et al., 2018; Zhao et al., 2023; Gaudin et al., 2024), but its application to traditional aqueous decoctions remains limited (Xing et al., 2012; Lei et al., 2022).
In this study, we aimed to comprehensively characterize the metabolite profile of C. micranthum decoction prepared following traditional practices. To maximize coverage of both polar and non-polar metabolites, we adopted a dual chromatographic approach combining HILIC and RP chromatography. Metabolite annotation was performed using UHPLC-HRMS/MS, with the major polar constituents detected by charged aerosol detection or evaporative light scattering detector (CAD/ELSD) and quantified by quantitative 1H-NMR spectroscopy. In addition, HILIC was used for the purification of polar metabolites through a dry-loading strategy that allows introduction of poorly soluble compounds into solvent systems containing high levels of organic phase (Queiroz et al., 2019).
Results and discussion
UHPLC-PDA-CAD-HRMS/MS metabolite profiling of the traditional water decoction
To remain consistent with the plant’s traditional form of use, the present study was carried out exclusively with the aqueous decoction of C. micranthum leaves. To obtain a comprehensive overview of its chemical composition, the decoction was analyzed by RP ultra-high-pressure liquid chromatography combined with photodiode array detection, charged aerosol detection, and high-resolution mass spectrometry (UHPLC-PDA-CAD-HRMS/MS), under both RP and HILIC conditions (Figure 1A).
FIGURE 1
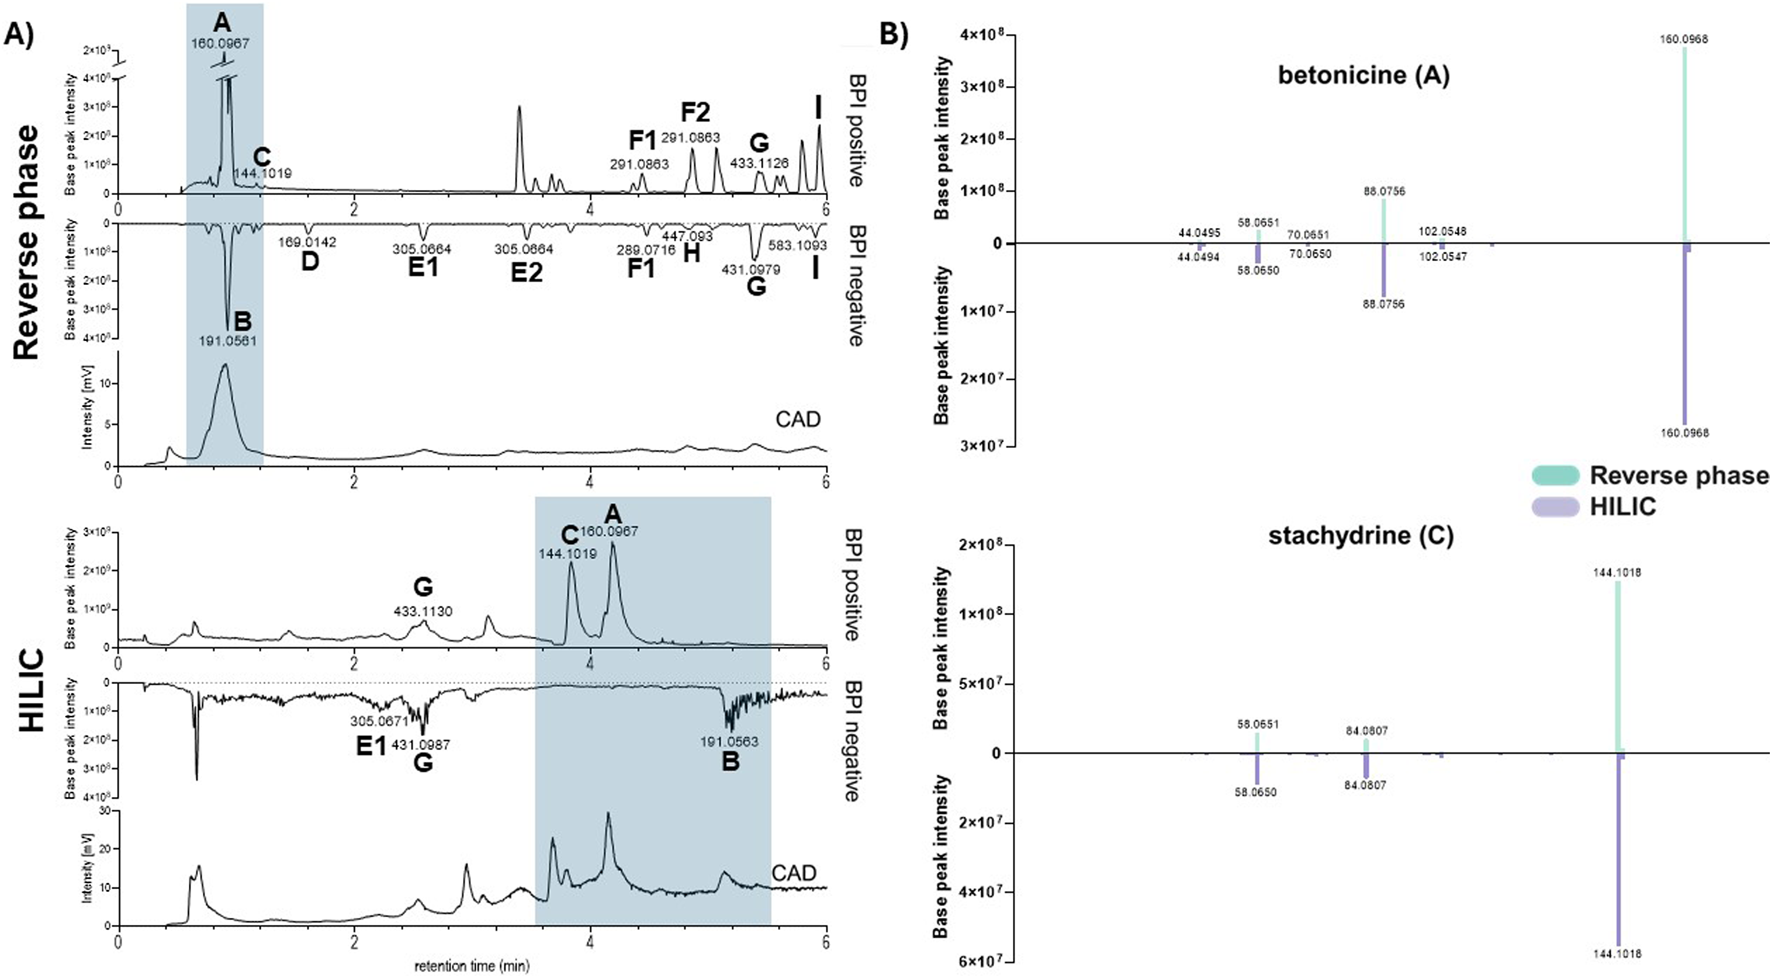
(A) UHPLC-CAD-HRMS/MS analysis of the water decoction of the leaves of Combretum micranthum in reverse phase (up) and HILIC (down). The peaks identified in the Base Peak Intensity (BPI) chromatogram correspond to: (A) betonicine, (B) quinic acid, (C) stachydrine, (D) gallic acid, (E1, E2) epigallocatechin or gallocatechin, (F1, F2) epicatechin or catechin, (G) isovitexin or vitexin, (H) luteolin-6-C-glucoside, (I) vitexin-O-gallate. CAD: Charged Aerosol Detector. (B) MS/MS data of betonicine (A) and stachydrine (C).
These analyses revealed that the decoction contains mainly polar compounds, as evidenced by the charged aerosol detector (CAD) semiquantitative trace, as they were poorly retained by the RP stationary column (Saldanha et al., 2021).
The MS/MS data obtained from this analysis was subjected to a Sirius-based dereplication process (Duhrkop et al., 2019) and submitted to the GNPS platform for Molecular Network (MN) generation (Wang et al., 2016; Duhrkop et al., 2019; Nothias et al., 2020). Results from both approaches were evaluated individually and compiled in Supplementary Table S1.
The putative annotations obtained from the RP profiling corresponded mainly to flavonoid derivatives already reported in the species (Tine et al., 2024) (see Figure 1A; Supplementary Table S1). This approach also highlighted the presence of a signal at m/z 144.1018 [M + H]+ (C7H14O2N), attributed to a polar betaine alkaloid stachydrine (C) (Bassene et al., 1986) not retained in the RP conditions (RT 0.66 min). This compound has been claimed to have diverse bioactivities, especially against cardiovascular diseases (Cheng et al., 2020; Liao et al., 2023).
The CAD trace of the RP profiling also showed stachydrine (C) eluting in the middle of a strong unretained CAD signal, which could still correspond to a mixture of constituents. It is well established that an intense CAD response combined with poor retention in RP chromatography generally indicates the presence of saccharides in natural extracts (Saldanha et al., 2021). It was therefore essential to ensure that such signals did not obscure the detection of other compounds of interest.
As shown in Figure 1A, however, the RP UHPLC-HRMS metabolite profiling conditions were not adequate to analyze the most polar components of the decoction. For this, the decoction was analyzed by HILIC (Alpert, 1990; Buszewski and Noga, 2012) (Figure 1A). This analysis achieved baseline separation of stachydrine (C) and betonicine (A) in the decoction, demonstrating that both compounds were distinctly retained under these chromatographic conditions.
The correlation between the RP and HILIC peaks was confirmed by comparing the exact HRMS and MS/MS spectra of all the dereplicated compounds (Figure 1B).
To confirm the putative MS/MS annotations, all the main constituents were isolated by HPLC semi-preparative in a single step via chromatographic gradient transfer from both RP and HILIC profiling conditions for structural confirmation by NMR.
Liquid-liquid partition of the water of the leaf decoction
Liquid–liquid extraction (LLE) was used to separate decoction constituents by partitioning polar compounds into the aqueous phase and less polar compounds into the butanol phase. The LLE fractions were subsequently analysed using UHPLC-PDA-ELSD-MS to evaluate their content. The aqueous fraction was analyzed by HILIC mode, and the butanolic fraction by RP mode (Figure 2). As expected, the predominant peak of the decoction (main ELSD peak) (Figure 2A) was exclusively detected in the aqueous fraction, whereas the remaining minor peaks were solely observed in the organic fraction.
FIGURE 2
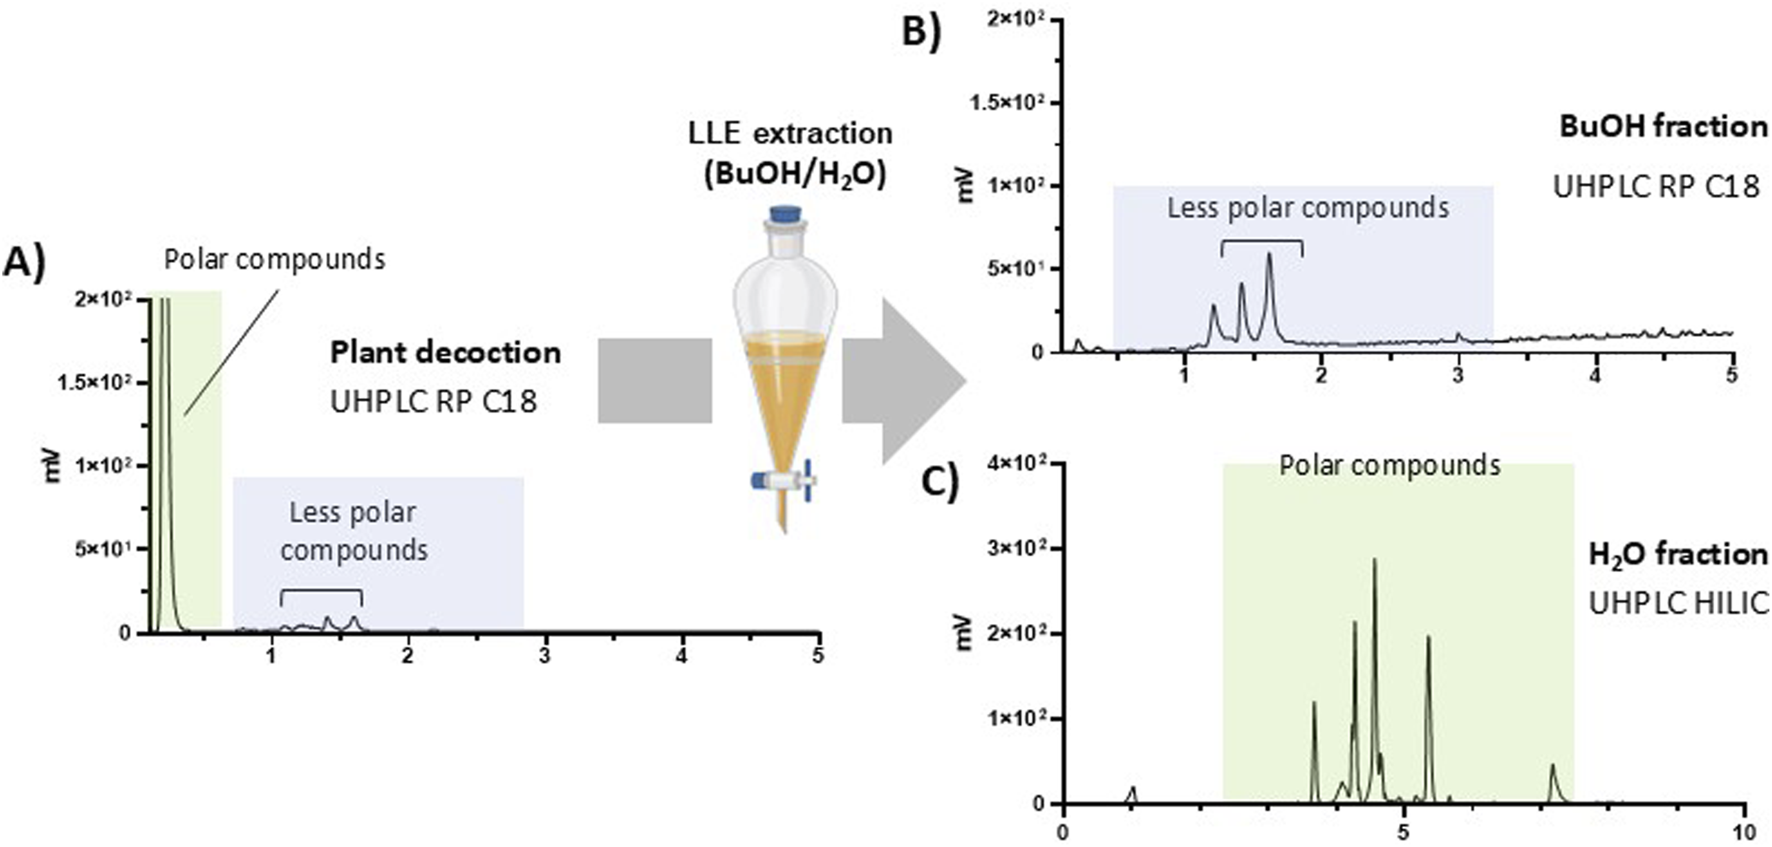
(A) Reverse phase UHPLC-ELSD analysis of the water decoction and liquid-liquid extraction (LLE) using butanol and water. (B) Reverse phase UHPLC-ELSD of the butanolic fraction. (C) HILIC-ELSD analysis of water fraction.
Purification of the major compounds from the LLE aqueous fraction
In order to achieve the isolation of the polar compounds, the conditions for semi-preparative HPLC fractions had to be established on HPLC with a similar HILIC phase chemistry.
To achieve this, the method was optimized to increase the selectivity of the separation (Figure 3A).
FIGURE 3
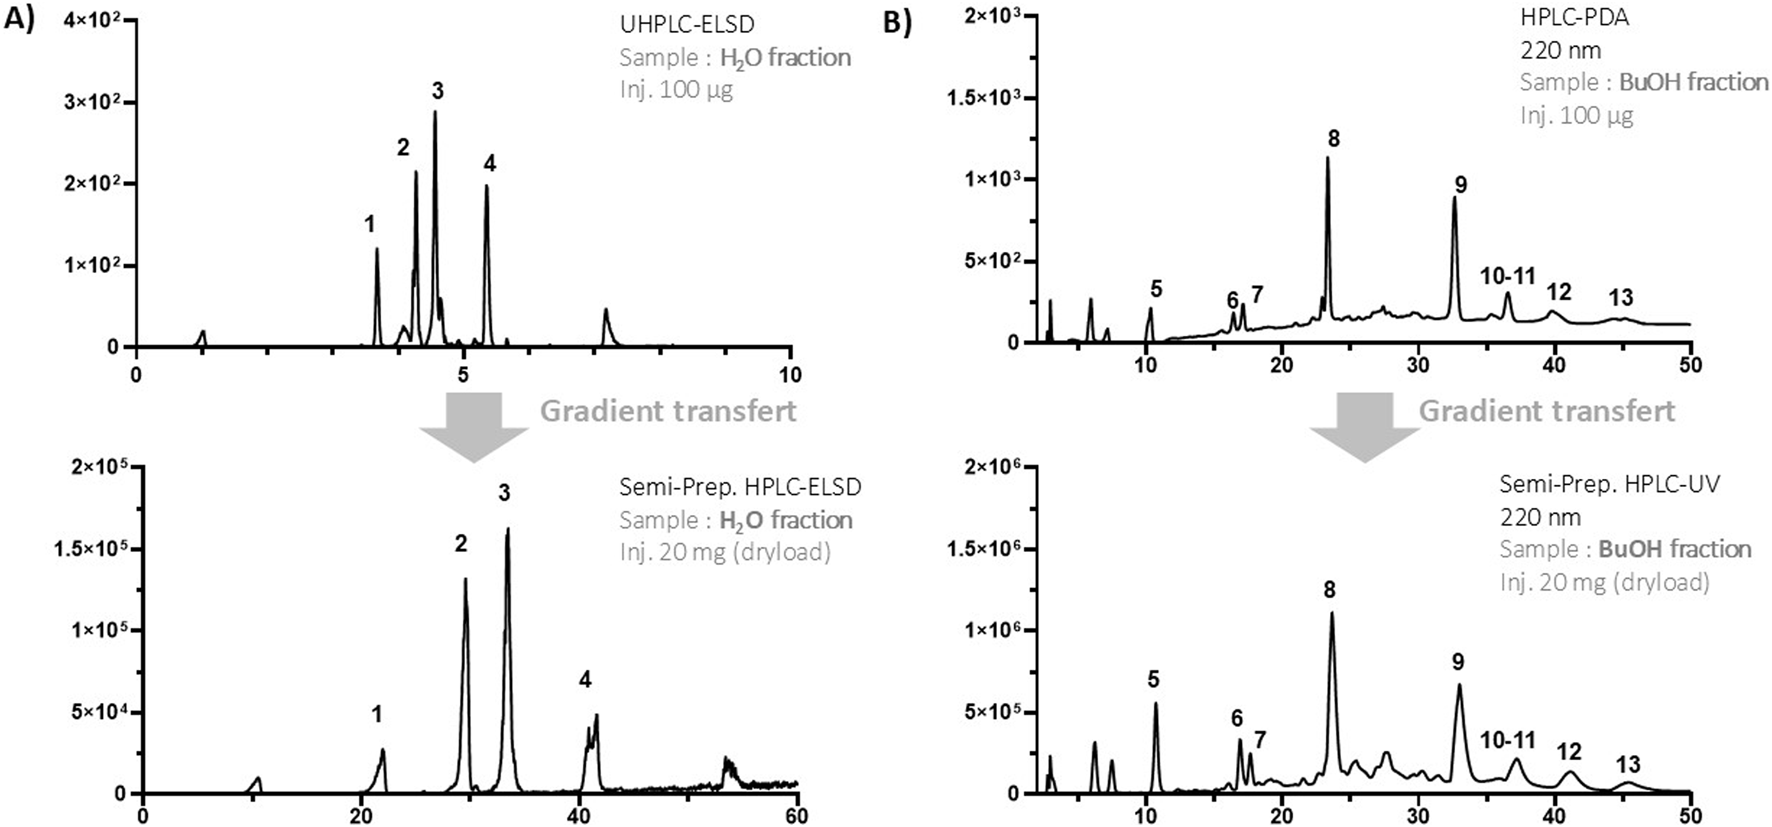
(A) UHPLC-ELSD analysis of the aqueous LLE fraction by HILIC chromatography at the analytical scale (top) and gradient transfer to the semi-preparative HPLC-UV-ELSD (bottom). (B) HPLC-PDA analysis of the butanolic LLE fraction by reversed-phase chromatography at the analytical scale (top) and gradient transfer to the semi-preparative HPLC-UV (bottom).
The purification of compounds on a semi-preparative scale was carried out by geometrically transferring the method optimized in analytical HPLC to a semi-preparative HPLC coupled to UV and ELSD detections (Guillarme et al., 2008) (Figure 3A).
To achieve high-resolution separation on a semi-preparative scale, 20 mg of sample were introduced by dry loading, following a protocol developed in our laboratory (Queiroz et al., 2019). This approach proved particularly advantageous, as the polar compounds of interest were not soluble in the initial HILIC mobile phase containing 95% acetonitrile. Using this method, compounds 1 to 4 were successfully isolated in single step and identified through NMR and HRMS, with their structures further confirmed by comparison with literature reports. The identified metabolites were choline (1) (Xiao et al., 2008) stachydrine (2) (Kuchta et al., 2014), betonicine (3) (Kim et al., 2007), and quinic acid (4) (Meier and Tamm, 1991) (Figure 4).
FIGURE 4
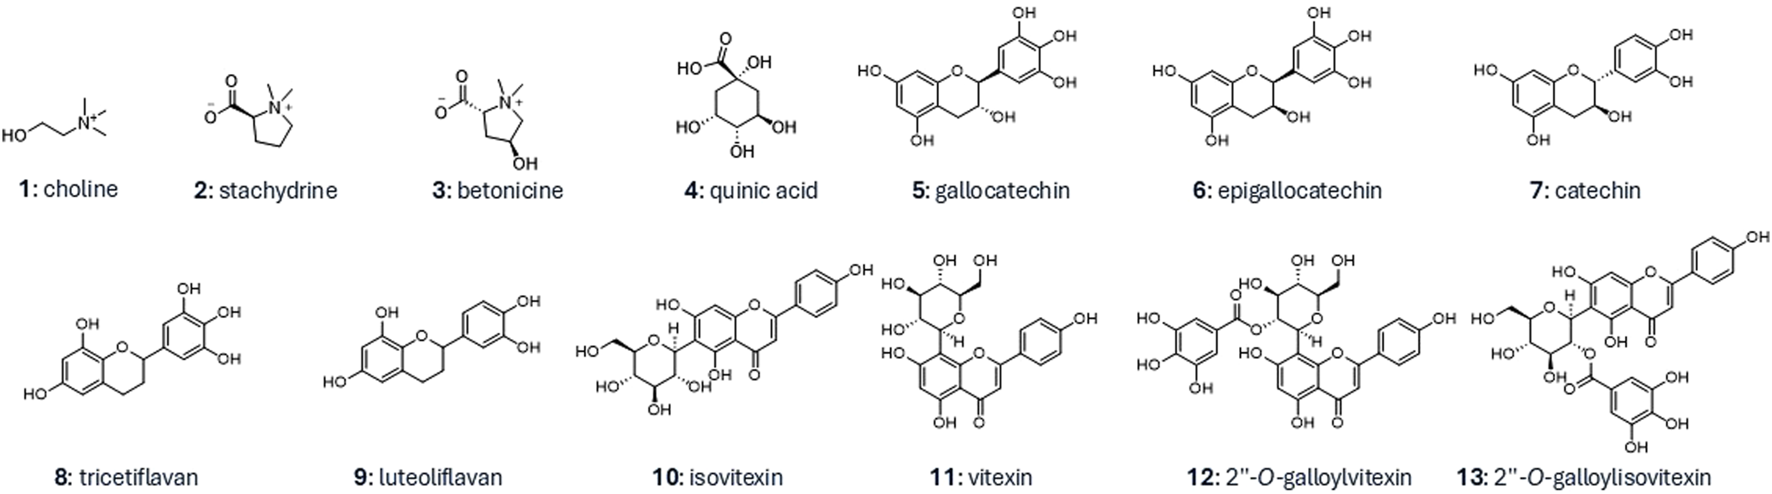
Structures of the isolated compounds from the aqueous and butanolic LLE fractions.
Although choline and stachydrine have already been described in this plant (Jentzsch et al., 1962), it is the first time that they have been detected as the major compounds in the water decoction extract. Interestingly, stachydrine has been extensively investigated for its cardiovascular effects (Cheng et al., 2020). This compound, isolated from Leonorus heterophyllus (Japanese motherwort) has been studied against Telmisartan (an angiotensin II receptor antagonist), showing an inhibitory effect on the conversion enzyme and the angiotensin II receptor (Liu et al., 2019). Stachydrine hydrochloride improves cardiac performance and regulates calcium handling via CaMKII-RyR2/PLN pathway (Chen et al., 2020) and can induce eNOS phosphorylation and vasorelaxation by regulating the interplay between AMPK and Akt pathways in vascular endothelial cells (Xie et al., 2019). Stachydrine has been shown to protect against endothelial dysfunction caused by hyperhomocysteinemia, a risk factor for cardiovascular diseases (Xie et al., 2018). On the other hand, choline (1) also possesses biological activity related to the cardiovascular system. This compound can increase and restore blood pressure in acutely hemorrhaged rats by increasing central cholinergic neurotransmission (Ulus et al., 1995). Interestingly, a recent study suggests that higher dietary intakes of choline (1), and betonicine (3) were associated with lower levels of blood pressure and LDL concentrations among obese individuals (Abbasi et al., 2023).
Purification of the compounds from the LLE butanolic fraction
The same strategy described for the aqueous fraction was used for the isolation of compounds from the butanolic fraction, and applied for RP conditions (Figure 3B).
Using this approach, nine compounds (5–13) were isolated in one step. They were identified as gallocatechin (5) (Davis et al., 1996), epigallocatechin (6) (Davis et al., 1996), catechin (7) (Davis et al., 1996), tricetiflavan (8) (Guo et al., 2007), luteoliflavan (9) (Roemmelt et al., 2003), isovitexin (10) (Jayasinghe et al., 2004), vitexin (11) (Jayasinghe et al., 2004), 2″-O-galloylvitexin (12) (Lin et al., 2000), and 2″-O-galloylisovitexin (13) (Lin et al., 2000) (Figure 4).
Compounds 5–13 are all polyphenols, specifically flavans (flavan-3-ol for 5, 6, and 7 and flavans for 8 and 9) and flavone C-glycosides (10, 11, 12, and 13). These compounds have also been the subject of several studies linked to cardiovascular activity. For example, flavan-3-ol (catechins) administered to spontaneously hypertensive rats showed a reduction in blood pressure with a maximum effect observed at 0.5–6 mg/kg, less than that of standard captopril (50 mg/kg) (Quiñones et al., 2015). Vitexin was described for its cardioprotective effect generated by blocking calcium channels (He et al., 2016), while isovitexin has been associated with vasodilatory effects (Tirloni et al., 2019).
NMR-based quantification of constituents from the water decoction
To better understand the traditional use of C. micranthum, especially the reported antihypertensive effects of its isolated compounds, their quantities were estimated in the traditional aqueous decoction.
The most abundant molecules were quantified by 1H-NMR using an internal standard (Figure 5). The mass percentage of compounds isolated from the dry plant decoction was also determined by gravimetric analysis based on the weight of the residues obtained. Using 1H-NMR, it was possible to quantify choline (1), stachydrine (2), and betonicine (3) as 0.1%, 1.3%, and 5.1%, respectively (see experimental section). This data was in good agreement with the % (w/w) of compounds calculated from the masses of isolated compounds compared to the decoction: 0.2% for choline (1), 2.1% for stachydrine (2), and 8.6% for betonicine (3). Quantification of quinic acid (4) by 1H-NMR was not possible due to overlapping signals, so its quantity was estimated at 3.6% (w/w) of the decoction by calculating mass ratios (isolated mass/injected mass x yield of water fraction x 100). The major compounds from the butanolic fraction of the leaf decoction were estimated to 13.6% for tricetiflavan (8), 3.4% for luteoliflavan (9), and 3.0% for isovitexin (10) by calculating mass ratios (isolated mass/injected mass x yield of butanolic fraction x 100). Compounds belonging to catechins (5, 6, 7) represent 4.6%. All this data showed that the compounds with cardiovascular activity already reported (1, 2, 7, 10, 11) represent around 8% of the traditional aqueous decoction.
FIGURE 5
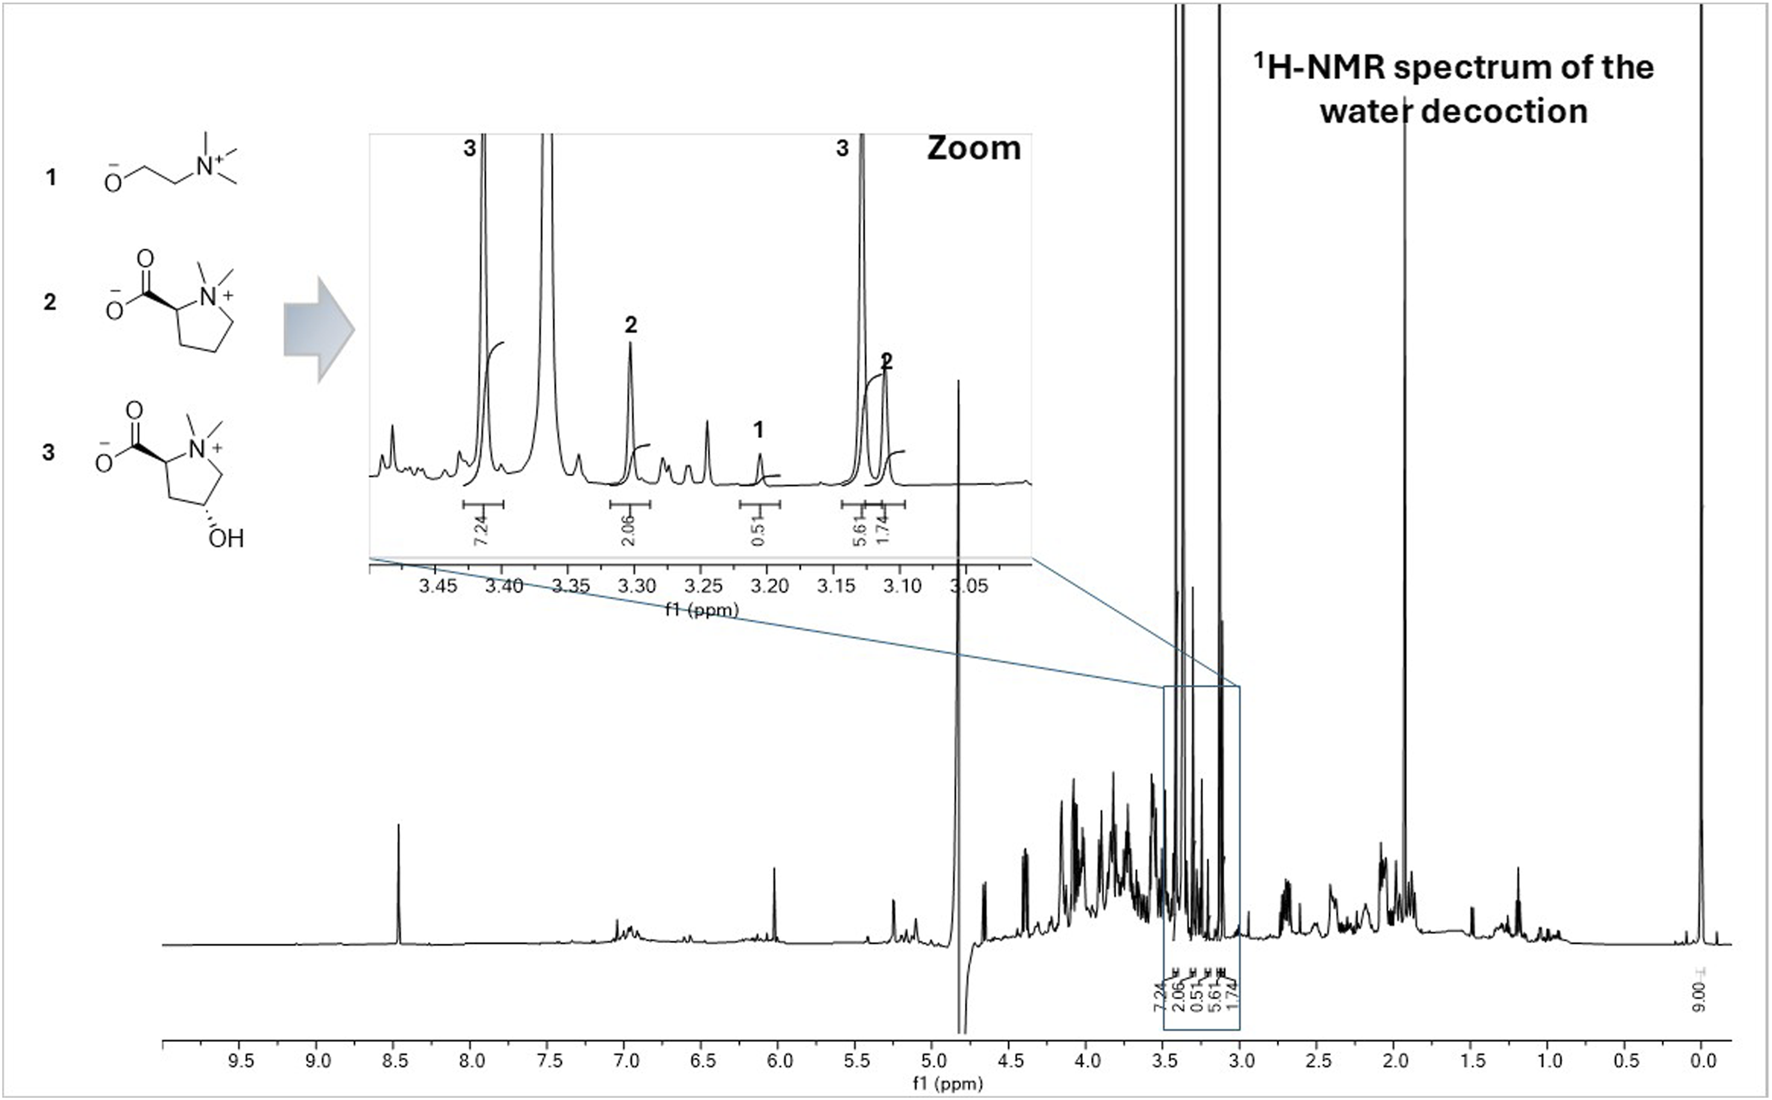
1H-NMR spectrum of the water decoction of the aerial parts of Combretum micranthum dissolved in 540 µL of a deuterated phosphate buffer solution (203 mM Na2HPO4, 44 mM NaH2PO4 (pH 7.4), 3 mM NaN3) containing 1 mM of TSP (3-(trimethylsilyl) propionic-2,2,3,3-d4 acid sodium) and 60 µL of D2O. Zoom area: The methyl signals at δH 3.21 were used for the quantification of choline (1), those at δH 3.30 and 3.11 for stachydrine (2) and those at δH 3.41 and 3.13 for betonicine (3). Using this method, the quantity of choline (1) was estimated to be 0.1% w/w in the water decoction, 1.3% for stachydrine (2), and 5.1% for betonicine (3).
Conclusion
The approach developed allowed for a comprehensive profiling of most compounds present in the water decoction of C. micranthum leaves, offering new insights into the metabolites ingested when used in traditional medicine.
Interestingly, the comprehensive qualitative and quantitative analysis of the decoction revealed that its five main constituents, representing 8% of the dry weight, have documented pharmacological activities related to cardiovascular health. This supports the traditional efficacy of the decoction and aligns with findings from clinical studies (Seck et al., 2017).
Furthermore, this work allowed us to establish an orthogonal HILIC–RP C18 strategy that was effective for both profiling and efficient isolation of the decoction constituents. The experimental conditions applied are highly generic, including liquid–liquid partitioning, broad linear gradients, gradient transfer from the analytical to the HPLC semi-preparative scale conditions, and dried sample introduction to maintain the resolution of the separation (Queiroz et al., 2024). In this context, and for such complex matrices, the use of direct 1H-NMR profiling proved to be an effective method for the rapid quantification of major metabolites once their identity had been confirmed.
We believe that this workflow may be highly valuable for the phytochemical investigation of other decoctions, which remain underexplored due to their complexity, but deserve greater attention due to their widespread use and the new opportunities they may offer for understanding their efficacy.
Materials and methods
General experimental procedures
The specific rotations were measured in MeCN on a JASCO P-1030 polarimeter (Loveland, CO, United States) in a 10 cm tube. The UV spectra was recorded on a JASCO J-815 spectrometer (Loveland, CO, USA) in MeOH, using a 1 cm cell. The scan speed was set at 200 nm/min continuous. NMR spectroscopic data were recorded on a Bruker Avance Neo 600 MHz NMR spectrometer equipped with a QCI 5 mm cryoprobe and a SampleJet automated sample changer (Bruker BioSpin, Rheinstetten, Germany). Chemical shifts are reported in parts per million (δ) using the residual deuterated solvent as internal standard for 1H and 13C-NMR (CD3OD at δH 3.31; δC 49.0 or DMSO-d6 at δH 2.50; δC 39.5) or TSP (3-(trimethylsilyl)propionic-2,2,3,3-d4 acid sodium) as internal standard for samples in D2O. Coupling constants (J) are reported in Hz. 1D and 2D NMR experiments (1H, COSY, ROESY, HMBC and HSQC) were recorded for complete structural elucidation. All solvents used are HPLC or MS grade. Chemicals were purchased from Sigma-Aldrich unless otherwise stated.
Plant material
The dried leaves of C. micranthum (Lot K010BIO, 250g, Aromanature, Geneva, Switzerland) were supplied by the Antenna Foundation.
Aqueous extraction of leaves of Combretum micranthum
The whole dried leaves (196 g, Lot K 010 BIO) of C. micranthum were coarsely ground by hand, then in an electric grinder with a 2 mm filter to obtain a fine powder (193 g). The plant powder (98 g) was mixed in a 2 L flask with 1,250 mL of distilled water. Everything was boiled in 24-h cycles in a heating mantle (Stuart Heating Mantle HM50C) under reflux at 100 °C until a clear extract was obtained. At the end of each decoction cycle, the powder was recovered to be reused for the next one, the same volume of water was added each time. The aqueous extract was first centrifuged (Eppendorf Centrifuge 5810 R, Hamburg, Germany) for 3 min at 2000 rpm in 50 mL falcon tubes to collect only the supernatant. The latter was then filtered through a Büchner to eliminate powder residues and obtain a clear extract. The extracts were distributed at a rate of 250 mL each in 500 mL flasks to be freeze-dried. The powder residue precipitated during centrifugation was used for the new decoction cycle of the same batch. The flasks half-filled with liquid extract were therefore frozen in a methanol bath at −40 °C then freeze-dried (Alpha two to four LSCbasic, Christ) to obtain a dry extract. At the end of the latter, the total quantity of aqueous extract of C. micranthum obtained was 22.3 g, translating to a yield of 23%.
Liquid-liquid extraction (LLE)
In a 2 L separatory funnel, 1 g of crude extract of C. micranthum was introduced withplaced in the presence of 200 mL of water and 200 mL of n-butanol. The flask was shaken so that the compounds moved into the phase for which they had the highest affinity, then the mixture was then decanted until a clear boundary between the two phases was observed. After the first separation, the aqueous fraction (water and very polar compounds) was washed with 3 times 200 mL of butanol, and the organic fraction (butanol and less polar compounds) was washed with 5 times 200 mL of water. This step makes it possible to carry the remains of very polar compounds from the organic phase towards water and the remains of less polar compounds from the aqueous phase towards butanol. Finally, all the aqueous fractions were combined and the same was done for the organic fractions. From 1 g of the water decoction, it was possible to obtain 602.6 mg of the water fraction and 354.7 mg of the butanolic fraction.
HPLC-PDA-ELSD analysis
The HPLC analyzes were carried out on an Agilent®1,260 system to which a photodiode array UV detector (PDA) and an evaporative light-scattering detector (ELSD) were coupled (Agilent Technologies®, Santa Clara, CA, USA). The general analysis parameters were as follows: sample chamber at 10 °C, mobile phase flow rate of 1 mL/min, sample injection volume of 10 μL (conc. 10 mg/mL), PDA acquisition at 220 and 254 nm. ELSD detector (Sedere®) was set at 45 °C with gain of 7. The analysis of the aqueous fraction was carried out on an XBridge BEH Amide column (250 × 4.6 mm i.d., 5 μm) with a mobile phase composed of H2O+ 50 mM ammonium formate (A) and ACN (B). The optimized conditions were as follows: 95% B for 5 min, 95% to 85% B for 15 min, isocratic at 85% B for 30 min, 85% to 60% B for 10 min, isocratic at 60% B for 5 min. The analysis of the organic fraction was carried out with an XBridge BEH C18 column (250 × 4.6 mm i.d., 5 μm) with a mobile phase composed of H2O (A) and MeOH (B) with 0.1% formic acid each. The optimized conditions were as follows: from five% to 32% B in 24 min, isocratic level at 32% B for 30 min, and from 32% to 50% B in 20 min.
UHPLC-PDA-CAD-HRMS analysis
Analyses were performed with a Waters Acquity UHPLC system hyphenated to a Q-Exactive Focus mass spectrometer (Thermo Scientific, Bremen, Germany), and a Corona Veo RS Charged Aerosol Detector (CAD, Thermo Scientific, Germany). The orbitrap was equipped with a heated electrospray ionization source (HESI-II). HESI-II conditions were as follows: source voltage, 3.5 kV; gas flow (N2), 42 units; auxiliary gases, 11 units; spare gas, 2 units; capillary temperature, 300 °C; S-LENS RF level, 55. The mass analyzer was calibrated with a mixture of caffeine, methionine-arginine-phenylalanine-alanine-acetate, sodium dodecyl sulfate, sodium taurocholate, and an Ultramark 1,621 in ACN solution/MeOH/H2O containing 1% formic acid by direct injection. Data-dependent MS/MS spectra were acquired on the three most intense ions detected in full MS scan (top three experiments). The MS/MS isolation window width was 2 Da and the normalized collision energy (NCE) was set to 35 units. In the data-dependent MS/MS experiment, full scans were acquired with a resolution of 35,000 fwhm (at 200 m/z) and MS/MS scans with 17,500 fwhm, both with a maximum time injection time of 50 m. After being acquired by an MS/MS scan, the parent ions were placed in a dynamic exclusion list for 3.0 s. UV data from the PDA was acquired between 190 and 500 nm. The software used to process data is Thermo Scientific Xcalibur 2.1 (Rutz et al., 2019).
The chromatographic separation in reverse phase was carried out on an Acquity UPLC BEH C18 column (150 × 2.1 mm i.d., 1.7 μm; Waters) at 0.4 mL/min, 40 °C with H2O (A) and MeCN (B) both containing 0.1% formic acid as solvents. The gradient was carried out as follows: 5%–5% B in 0.5 min, 5%–100% B in 19.5 min, 6 min at 100% B, and a reequilibration step at 5% B in 4 min.
The chromatographic separation in HILIC was carried out on an Acquity UPLC BEH Amide column (50 × 2.1 mm i.d., 1.7 μm; Waters) at 0.6 mL/min, 40 °C with H2O+ 50 mM Ammonium formate (A) and MeCN (B) as solvents. The gradient was carried out as follows: 95%–60% B in 7 min, 1 min at 60% B, and a re-equilibration step at 95% B in 2 min.
Data conversion and MZMine data processing
All raw data files were converted to mzML files using ThermoRawFileParser v.1.4.0.101 (https://github.com/compomics/ThermoRawFileParser) (Hulstaert et al., 2020). The converted files were processed using MZmine3 (Heuckeroth et al., 2024). For MS1 mass detection, the noise level was set at PI 1.0 E6 (NI 1.0 E5) and for MS2 detection, the noise level was set at 10.00 for PI and NI. The ADAP chromatogram builder parameters were configured as follows: minimum consecutive scans, 5; minimum intensity for consecutive scans, PI 1.0 E6 (NI 1.0 E5); minimum absolute height, PI 1.0 E6 (NI 1.0 E5); and m/z tolerance of 0.0020 or 10.0 ppm (PI and NI). The Local Minimum Feature Resolver algorithm was used for chromatogram deconvolution with these parameters: chromatographic threshold, 80; minimum search range RT/Mobility (absolute), 0.10; minimum relative height, 1%; minimum absolute height, PI 1.0 E6 (NI 1.0 E5); minimum ratio of peak top/edge, 1.0; peak duration range, 0.01–1.0 min; and minimum scans, 5. Isotopes were detected using the 13C isotope filter with an m/z tolerance of 0.0050 or 8.0 ppm, a retention time tolerance of 0.05 min (absolute), a maximum charge of 2, and the most intense representative isotope. Each file was filtered to remove duplicates using the Duplicate Peak Filter with an m/z tolerance of 0.005 or 10 ppm and an RT tolerance of 0.10 min. The Feature List Row Filter was used with these parameters: minimum features in an isotope pattern, 2; retention time, 0.50–9.00 min; feature duration range, 0.1–1.0 min; and only ions with an associated MS2 spectrum were retained. The resulting filtered list was subjected to Ion Identity Networking (Schmid et al., 2021) starting with the metaCorrelate module (RT tolerance, 0.10 min; minimum height, PI 1.0 E6 (NI 1.0 E5); intensity correlation threshold, PI 1.0 E6 (NI 1.0 E5)) and the Correlation Grouping with default parameters. This was followed by the Ion Identity Networking (m/z tolerance, 8.0 ppm; check: one feature; minimum height: 1.0 E3), with the Ion Identity Library (maximum charge, 2; maximum molecules/cluster, 2; adducts ([M + H]+, [M + Na]+, [M + K]+, [M + NH4]+, [M+2H]2+); modifications ([M-H2O], [M-2H2O], [M-CO2], [M + HFA], [M + ACN])), and Annotation Refinement (delete small networks without major ion, yes; delete networks without monomer, yes). The Add Ion Identities Networks (IIN) module was used with an m/z tolerance of 8 ppm; minimum height, PI 1.0 E6 (NI 1.0 E5); and Annotation Refinement (minimum size, 1; delete small networks without major ion, yes; delete small networks: link threshold, 4; delete networks without monomer, yes). Finally, the Check All Ion Identities by MS/MS module was used (m/z tolerance (MS2), 10 ppm; minimum height (in MS2), 1.0 E3; check for multimers, yes; check neutral losses (MS1 - > MS2), yes). The resulting aligned peak list was exported as a.mgf file (with the associated feature quantification table and edges annotations from the IIN process, both in the.csv format) for further analysis. Batch files can be found here for PI and NI.
Spectral organization
A feature based molecular network (FBMN) was constructed from the .mgf files exported from MZmine3 using the FBMN workflow on the GNPS platform (Wang et al., 2016; Nothias et al., 2020). The precursor ion mass tolerance was set at 0.02 Da, with an MS2 fragment ion tolerance of 0.02 Da. A network was generated where edges were filtered to have a cosine score above 0.7 and more than six matched peaks. The spectra within the network were then searched against GNPS’ spectral libraries. Matches between network and library spectra required a score above 0.6 and at least three matched peaks. Job links: PI (https://gnps.ucsd.edu/ProteoSAFe/status.jsp?task=0a774a700b9e4a009ba070fe6aca5557), NI (https://gnps.ucsd.edu/ProteoSAFe/status.jsp?task=3d4dba43d67145ba8999e7c1c6a1bb23).
Metabolite annotation with sirius
The SIRIUS .mgf file, exported from MZmine3 using the SIRIUS export module and containing both MS1 and MS2 information, was processed with SIRIUS (v5.8.6) (Duhrkop et al., 2019). The parameters were configured as follows: possible ionizations included [M + H]+, [M + NH4]+, [M-H2O + H]+, [M + K]+, [M + Na]+ (NI: [M-H]-, [M + Cl]-, [M + Br]-); the instrument profile was set to Orbitrap; mass accuracy was set to 5 ppm for MS1 and 7 ppm for MS2; the database for molecular formulas and structures was BIO; and the maximum m/z to compute was 1,000. ZODIAC was utilized to enhance molecular formula prediction using a threshold filter of 0.99 (Ludwig et al., 2020). Metabolite structure prediction was performed with CSI: FingerID (Dührkop et al., 2015), and significance was calculated using COSMIC (Hoffmann et al., 2022). Chemical class prediction was carried out with CANOPUS (Duhrkop et al., 2021) using the NPClassifier chemical taxonomy (Kim et al., 2021).
Semi-preparative HPLC-UV
The purification of the compounds from the aqueous and organic fractions was carried out on a semi-preparative scale on a Shimadzu® HPLC-PDA-ELSD composed of the following modules: an LC20A pump elution module, an SPD-20A UV-VIS detector, a Sedex-FP ELSD detector, a Rheodyne 7725I injection valve and an FRC-10A fraction collector (Shimadzu®, Kyoto, Japan). For the compounds in the aqueous fraction, an Amide XBridge BEH OBD column (250 × 19 mm i.d., 5 μm) and a mobile phase composed of H2O+ ammonium formate 50 mM (A) and ACN (B) were used. Samples were introduced using a dry-load method (Queiroz et al., 2019). The analysis method was established in HPLC at the analytical scale and transferred to the semi-preparative scale. The only parameter that varies was the column diameter, which only influences the mobile phase flow rate. UV detection was done at 220 and ELSD detection was done at 40 °C with a gain of 6. The mobile phase gradient used started at 95% B for 5 min, 95%–65% B in 20 min, an isocratic step of 65% at 50 min, and down to 60% B in 65 min. The sample (20 mg) was solubilized in water and injected using a loop injector (500 μL). The compounds were collected based on the ELSD detection. Using this approach Using this approach compounds 1-4 were isolated in the following yields: compound 1 (<0.5 mg), compound 2 (0.7 mg), compound 3 (2.9 mg), and compound 4 (1.2 mg).
For the compounds in the organic fraction (butanolic fraction), a C18 XBridge BEH OBD column (250 × 19 mm i.d., 5 μm) and a mobile phase composed of H2O (A) and MeOH (B) with 0.1% of formic acid each were used. The mobile phase gradient used started at 5% B for 5 min, 5% to 100% of B in 60 min. For this purification, only UV detection at 220 and 254 nm was used. Sample (40 mg) was injected using a dry-load method (Queiroz et al., 2019). Using this approach compounds 5–13 were isolated in the following yields: compound 5 (2.2 mg), compound 6 (1.7 mg), compound 7 (1.3 mg), compound 8 (15.3 mg), compound 9 (3.8 mg), compound 10 (3.4 mg), compound 11 (0.8 mg), compound 12 (2.9 mg), and compound 13 (2.0 mg).
Description of the isolated compounds
Compound 1 (choline): 1H-NMR (D2O, 600 MHz) δ 3.21 (9H, s, H3-3, H3-4, H3-5), 3.52 (2H, m, H2-2), 4.06 (2H, m, H2-1); 13C-NMR (D2O, 151 MHz) δ 56.7 (CH3-3, CH3-4, CH3-5), 58.5 (CH2-2), 70.3 (CH2-1); HRESIMS m/z 104.10694 [M]+ (calculated for C5H14NO, 104.10699, Δ = −0.5 ppm).
Compound 2 (S-(−)-stachydrine): [α]23D −45.2 (c 0.07, H2O); 1H-NMR (D2O, 600 MHz) δ 2.18 (2H, m, H2-3), 2.29 (1H, m, H-2″), 2.50 (1H, m, H-2′), 3.11 (3H, s, H3-7), 3.30 (3H, s, H3-6), 3.55 (1H, ddt, J = 11.6, 9.4, 8.3 Hz, H-4″), 3.72 (1H, m, H-4′), 4.08 (1H, dd, J = 10.3, 8.6 Hz, H-1); 13C-NMR (D2O, 151 MHz) δ 21.5 (CH2-3), 28.1 (CH2-2), 48.8 (CH3-7), 55.0 (CH3-6), 70.1 (CH2-4), 79.3 (CH-1), 174.2 (C-8); HRESIMS m/z 144.10204 [M]+ (calculated for C7H14NO2, 144.10191, Δ = 0.9 ppm).
Compound 3 (betonicine): [α]23D −26.4 (c 0.29, H2O); UV (H2O) λmax (log ε) 218 (1.86), 235 (sh) (1.58) nm, 288 (1.04) nm; 1H-NMR (D2O, 600 MHz) δ 2.39 (1H, ddt, J = 14.5, 6.4, 2.8 Hz, H-2β), 2.70 (1H, ddd, J = 15.0, 10.6, 7.1 Hz, H-2α), 3.13 (3H, s, H3-7), 3.41 (3H, s, H3-6), 3.55 (1H, dd, J = 12.9, 3.9 Hz, H-4β), 4.07 (1H, dd, J = 12.9, 6.4 Hz, H-4α), 4.39 (1H, dd, J = 10.6, 7.5 Hz, H-1), 4.72 (1H, tp, J = 6.2, 1.9 Hz, H-3); 13C-NMR (D2O, 151 MHz) δ 38.9 (CH2-2), 51.5 (CH3-7), 57.3 (CH3-6), 69.3 (CH-3), 76.8 (CH2-4), 79.2 (CH-1), 173.5 (C-8); HRESIMS m/z 160.09665 [M]+ (calculated for C7H14NO3, 160.09682, Δ = −1.1 ppm).
Compound 4 (D-(−)-quinic acid): [α]23D −38.5 (c 0.12, H2O); 1H-NMR (D2O, 600 MHz) δ 1.88 (1H, dd, J = 13.4, 10.8 Hz, H-2″), 1.96 (1H, dt, J = 14.8, 3.4 Hz, H-6″), 2.05 (1H, dd, J = 14.9, 3.2 Hz, H-6′), 2.07 (2H, ddd, J = 13.5, 4.8, 2.7 Hz, H-2′), 3.55 (1H, dd, J = 9.3, 3.4 Hz, H-4), 4.02 (1H, ddd, J = 10.9, 9.2, 4.8 Hz, H-3), 4.15 (1H, q, J = 3.5 Hz, H-5); HRESIMS m/z 191.05664 [M-H]- (calculated for C7H11O6, 191.05635, Δ = 1.5 ppm).
Compound 5 ((−)-gallocatechin): [α]23D −17.5 (c 0.11, MeOH); UV (MeOH) λmax (log ε) 288 (0.60), 235 (sh) (1.43) nm, 216 (1.84) nm; 1H-NMR (CD3OD, 600 MHz) δ 2.50 (1H, dd, J = 16.1, 7.5 Hz, H-4b), 2.81 (1H, dd, J = 16.1, 5.3 Hz, H-4a), 3.96 (1H, td, J = 7.5, 5.3 Hz, H-3), 4.52 (1H, d, J = 7.5 Hz, H-2), 6.40 (2H, s, H-2′, H-6′); 13C-NMR (CD3OD, 151 MHz) δ 28.1 (CH2-4), 68.8 (CH-3), 82.9 (CH-2), 100.7 (C-10), 107.2 (CH-2′, CH-6′), 131.6 (C-1′), 134.5 (C-4′), 146.9 (C-3′, C-5′), 156.8 (C-9), 157.5 (C-7), 157.8 (C-5); HRESIMS m/z 305.06815 [M-H]- (calculated for C15H13O7, 305.06558, Δ = 8.4 ppm).
Compound 6 ((±)-epigallocatechin): [α]23D +3.3 (c 0.09, MeOH); UV (MeOH) λmax (log ε) 288 (0.70), 235 (sh) (1.32) nm, 211 (1.79) nm; 1H-NMR (CD3OD, 600 MHz) δ 2.73 (1H, dd, J = 16.7, 3.2 Hz, H-4b), 2.85 (1H, dd, J = 16.7, 4.7 Hz, H-4a), 4.17 (1H, dd, J = 4.7, 3.2 Hz, H-3), 4.75 (1H, s, H-2), 6.51 (2H, s, H-2′, H-6′); 13C-NMR (CD3OD, 151 MHz) δ 29.1 (CH2-4), 67.5 (CH-3), 79.9 (CH -2), 100.0 (C-10), 107.0 (CH-2′, CH-6′), 131.4 (C-1′), 133.6 (C-4′), 146.7 (C-3′, C-5′). HRESIMS m/z 305.06642 [M-H]- (calculated for C15H13O7, 305.06558, Δ = 3.0 ppm).
Compound 7 ((+)-catechin): [α]23D +67.1 (c 0.02, MeOH); UV (MeOH) λmax (log ε) 289 (1.04), 235 (sh) (1.58), 218 (1.86) nm; 1H-NMR (DMSO-d6, 600 MHz) δ 2.34 (1H, dd, J = 16.0, 8.0 Hz, H-4b), 2.64 (1H, dd, J = 16.0, 5.4 Hz, H-4a), 3.81 (1H, td, J = 8.0, 7.4, 5.4 Hz, H-3), 4.47 (1H, d, J = 7.4 Hz, H-2), 5.68 (1H, d, J = 2.2 Hz, H-8), 5.87 (1H, d, J = 2.2 Hz, H-6), 6.58 (1H, dd, J = 8.1, 2.0 Hz, H-6′), 6.68 (1H, d, J = 8.1 Hz, H-5′), 6.71 (1H, d, J = 2.0 Hz, H-2′), 8.91 (2H, s), 9.04 (1H, s), 9.28 (1H, s, 5OH); 13C-NMR (DMSO-d6, 151 MHz) δ 28.0 (CH2-4), 66.5 (CH-3), 81.1 (CH-2), 94.1 (CH-8), 95.3 (CH-6), 99.3 (C-10), 114.7 (CH-2′), 115.3 (CH-5′), 118.6 (CH-6′), 130.8 (C-1′), 145.0 (C-3′, C-4′), 155.5 (C-9), 156.4 (C-5), 156.6 (C-7); HRESIMS m/z 289.07303 [M-H]- (calculated for C15H13O6, 289.07066, Δ = 8.2 ppm).
Compound 8 ((±)-tricetiflavan): [α]23D +4.7 (c 0.02, MeOH); UV (MeOH) λmax (log ε) 288 (0.56), 238 (sh) (1.20), 210 (1.79) nm; 1H-NMR (DMSO-d6, 600 MHz) δ 1.75 (1H, m, H-3b), 1.98 (1H, m, H-3a), 2.49 (2H, m, H2-4), 4.67 (1H, dd, J = 9.9, 2.2 Hz, H-2), 5.68 (1H, d, J = 2.2 Hz, H-8), 5.88 (1H, d, J = 2.3 Hz, H-6), 6.29 (2H, s, H-2′, H-6′); 13C-H-NMRNMR (DMSO-d6, 151 MHz) δ 18.9 (CH2-4), 29.1 (CH2-3), 76.6 (CH-2), 94.2 (CH-8), 94.9 (CH-6), 100.3 (C-10), 105.0 (CH-2′, CH-6′), 132.0 (C-1′), 132.3 (C-4′), 145.8 (C-3′, C-5′), 156.0 (C-9), 156.2 (C-7), 156.3 (C-5); HRESIMS m/z 289.07291 [M-H]- (calculated for C15H13O6, 289.07066, Δ = 7.8 ppm).
Compound 9 ((±)-luteoliflavan): [α]23D +6.4 (c 0.10, MeOH); UV (MeOH) λmax (log ε) 254 (0.82), 288 (1.07), 235 (sh) (1.50), 216 (1.89) nm; 1H-NMR (DMSO-d6, 600 MHz) δ 1.80 (1H, dtd, J = 13.4, 10.4, 6.1 Hz, H-3b), 2.00 (1H, m, H-3a), 2.46 (2H, m, H2-4), 4.74 (1H, dd, J = 10.1, 2.2 Hz, H-2), 5.68 (1H, d, J = 2.2 Hz, H-8), 5.88 (1H, d, J = 2.2 Hz, H-6), 6.62 (1H, dd, J = 8.1, 2.1 Hz, H-6′), 6.70 (1H, d, J = 8.1 Hz, H-5′), 6.76 (1H, d, J = 2.1 Hz, H-2′); 13C-NMR (DMSO-d6, 151 MHz) δ 19.0 (CH2-4), 29.0 (CH2-3), 76.5 (CH-2), 94.2 (CH-8), 94.9 (CH-6), 100.2 (C-10), 113.6 (CH-2′), 115.2 (CH-5′), 117.1 (CH-6′), 132.7 (C-1′), 144.8 (C-4′), 145.0 (C-3′), 156.0 (C-5), 156.2 (C-9), 156.3 (C-7); HRESIMS m/z 273.07770 [M-H]- (calculated for C15H13O5, 273.07575, Δ = 7.1 ppm).
Compound 10 (isovitexin): [α]23D −72.4 (c 0.02, MeOH); UV (MeOH) λmax (log ε) 254 (0.82), 288 (1.07), 235 (sh) (1.50), 216 (1.89) nm; 1H-NMR (DMSO-d6, 600 MHz) δ 3.12 (1H, t, J = 9.0 Hz, H-4″), 3.16 (1H, m, H-5″), 3.20 (1H, t, J = 9.0 Hz, H-3″), 3.40 (1H, dd, J = 11.8, 6.1 Hz, H-6″b), 3.68 (1H, dd, J = 11.8, 2.0 Hz, H-6″a), 4.04 (1H, t, J = 9.8, 8.7 Hz, H-2″), 4.58 (1H, d, J = 9.8 Hz, H-1″), 6.54 (1H, s, H-8), 6.78 (1H, s, H-3), 6.93 (2H, d, J = 8.6 Hz, H-3′, H-5′), 7.93 (2H, d, J = 8.6 Hz, H-2′, H-6′), 10.38 (1H, s, 4′-OH), 10.61 (1H, s, 7-OH), 13.55 (1H, s, 5-OH); 13C-NMR (DMSO-d6, 151 MHz) δ 61.5 (CH2-6″), 70.2 (CH-2″), 70.6 (CH-4″), 73.0 (CH-1″), 78.9 (CH-3″), 81.6 (CH-5″), 93.6 (CH-8), 102.8 (CH-3), 103.4 (C-10), 108.9 (C-6), 116.0 (CH-3′, CH-5′), 121.1 (C-1′), 128.5 (CH-2′, CH-6′), 156.2 (C-9), 160.6 (C-5), 161.2 (C-4′), 163.3 (C-7), 163.5 (C-2), 182.0 (C-4); HRESIMS m/z 431.09918 [M-H]- (calculated for C21H19O10, 431.09727, Δ = 4.4 ppm).
Compound 11 (vitexin): [α]23D +23.5 (c 0.02, MeOH); UV (MeOH) λmax (log ε) 343 (1.11), 275 (1.15), 216 (1.59) nm; 1H-NMR (DMSO-d6, 600 MHz) δ 3.24 (1H, m, H-5″), 3.25 (1H, t, J = 8.7 Hz, H-3″), 3.38 (1H, t, J = 9.7 Hz, H-4″), 3.52 (1H, dd, J = 11.9, 5.9 Hz, H-6″b), 3.76 (1H, dd, J = 11.9, 1.9 Hz, H-6″a), 3.83 (1H, t, J = 9.3 Hz, H-2″), 4.68 (1H, d, J = 9.8 Hz, H-1″), 6.27 (1H, s, H-6), 6.78 (1H, s, H-3), 6.89 (2H, d, J = 8.7 Hz, H-3′, H-5′), 8.03 (2H, d, J = 8.7 Hz, H-2′, H-6′), 10.34 (1H, s, 4′-OH), 10.83 (1H, s, 7-OH), 13.17 (1H, s, 5-OH); 13C-NMR (DMSO-d6, 151 MHz) δ 61.3 (CH2-6″), 70.5 (CH-4″), 70.8 (CH-2″), 73.4 (CH-1″), 78.6 (CH-3″), 81.8 (CH-5″), 98.1 (CH-6), 102.4 (CH-3), 104.0 (C-10), 104.6 (C-8), 115.8 (CH-3′, CH-5′), 121.6 (C-1′), 129.0 (CH2′, CH-6′), 156.0 (C-9), 160.7 (C-5), 161.1 (C-4′), 162.5 (C-7), 163.9 (C-2); HRESIMS m/z 431.09927 [M-H]- (calculated for C21H19O10, 431.09727, Δ = 4.6 ppm).
Compound 12 (2″-O-galloylvitexin): [α]23D −112.4 (c 0.01, MeOH); UV (MeOH) λmax (log ε) 346 (1.14), 279 (1.30), 216 (1.78) nm; 1H-NMR (DMSO-d6, 600 MHz) δ 3.36 (1H, ddd, J = 9.5, 5.6, 1.9 Hz, H-5″), 3.53 (1H, t, J = 9.2 Hz, H-4″), 3.59 (1H, t, J = 8.9 Hz, H-3″), 3.61 (1H, m, H-6″b), 3.81 (1H, m, H-6″a), 4.94 (1H, d, J = 10.1 Hz, H-1″), 5.48 (1H, dd, J = 10.1, 9.1 Hz, H-2″), 6.12 (1H, s, H-6), 6.73 (2H, s, H-3‴, H-7‴), 6.81 (1H, s, H-3), 6.94 (2H, d, J = 8.8 Hz, H-3′, H-5′), 8.11 (2H, d, J = 8.8 Hz, H-2′, H-6′), 9.12 (2H, s, 4‴-OH, 6‴-OH), 10.40 (1H, s, 4′-OH), 10.97 (1H, s, 7-OH), 13.12 (1H, s, 5-OH); 13C-NMR (DMSO-d6, 151 MHz) δ 61.0 (CH2-6″), 70.6 (CH-4″), 71.1 (CH-1″), 72.3 (CH-2″), 76.0 (CH-3″), 82.1 (CH-5″), 97.7 (CH-6), 102.4 (C-8), 102.5 (CH-3), 103.8 (C-10), 108.6 (CH-3‴, CH-7‴), 115.9 (CH-3′, CH-5′), 119.4 (C-2‴), 121.6 (C-1′), 129.0 (CH-2′, CH-6′), 138.2 (C-5‴), 145.3 (C-4‴, C-6‴), 156.4 (C-9), 160.5 (C-5), 161.2 (C-4′), 162.1 (C-7), 164.0 (C-2), 164.8 (C-1‴), 182.0 (C-4); HRESIMS m/z 583.11011 [M-H]- (calculated for C28H23O14, 583.10823, Δ = 3.2 ppm).
Compound 13 (2″-O-galloylisovitexin): [α]23D −88.5 (c 0.02, MeOH); UV (MeOH) λmax (log ε) 344 (1.09), 279 (1.24), 216 (1.65) nm 1H-NMR (DMSO-d6, 600 MHz, 333 K) δ 3.32 (2H, m, H-4″, H-5″), 3.52 (1H, dd, J = 11.7, 4.9 Hz, H-6″b), 3.54 (1H, t, J = 8.5 Hz, H-3″), 3.76 (1H, d, J = 10.8 Hz, H-6″a), 4.93 (1H, d, J = 10.0 Hz, H-1″), 5.68 (1H, t, J = 9.6 Hz, H-2″), 6.44 (1H, s, H-8), 6.65 (1H, s, H-3), 6.81 (2H, s, H-3‴, H-7‴), 6.91 (2H, d, J = 8.6 Hz, H-3′, H-5′), 7.85 (2H, d, J = 8.5 Hz, H-2′, H-6′), 8.57 (1H, s, 5‴-OH), 8.89 (2H, s, 4‴-OH, 6‴-OH), 10.18 (1H, s, 4′-OH), 13.49 (1H, s, 5-OH); 13C-NMR (DMSO-d6, 151 MHz, 333 K) δ 61.2 (CH2-6″), 70.5 (CH-4″), 70.6 (CH-1″), 71.9 (CH-2″), 76.3 (CH-3″), 81.4 (CH-5″), 93.3 (CH-8), 102.7 (CH-3), 106.9 (C-6), 108.5 (CH-3‴, CH-7‴), 115.7 (CH-3′, CH-5′), 120.6 (C-1′), 128.1 (CH-2′, CH-6′), 137.8 (C-5‴), 145.0 (C-4‴, C-6‴), 156.1 (C-9), 160.9 (C-4′), 162.9 (C-7), 163.1 (C-2), 164.4 (C-1‴), 181.5 (C-4); HRESIMS m/z 583.11188 [M-H]- (calculated for C28H23O14, 583.10823, Δ = 6.3 ppm).
General procedure for NMR quantification
The quantification by NMR was performed by proton nuclear magnetic resonance (1H-NMR) using TSP (3-(trimethylsilyl)propionic-2,2,3,3-d4 acid sodium) as internal standard. 1H-NMR were recorded at 300 K on a 600 MHz spectrometer (for equipment details see General experimental procedures section). A solvent suppression pulse sequence (noesygppr1d) was used with the following parameters: 64 scans, a pulse width calibrated for 90° flip angle, an automatic receiver gain adjustment, a relaxation delay of 60s, an acquisition time of 3.67s, and 64k data points collected with a sweep width of 17,857 Hz. Data processing was performed using the MNova 15.1 software. The raw fid was zero-filled to 128k data points before exponential multiplication with a line broadening factor of 0.3 and Fourier transformation. The spectrum phase was done manually, and a third order polynomial fit baseline correction was applied. Then the signals of interest were peak picking with the GSD (Global Spectral Deconvolution) method analysis and integrated.
1H-NMR quantification
The quantification was performed by 1H-NMR (Holzgrabe, 2010; Pauli et al., 2014) in triplicate. For this, 2.2, 2.3 and 3.6 mg of the water decoction of the aerial parts of C. micranthum were dissolved in 540 µL of a deuterated phosphate buffer solution (203 mM Na2HPO4, 44 mM NaH2PO4 (pH 7.4), 3 mM NaN3) containing 1 mM of TSP (3-(trimethylsilyl) propionic-2,2,3,3-d4 acid sodium) and 60 µL of D2O. The phosphate buffer was used to avoid variations of proton chemical shifts. The TSP was used as an internal reference standard for chemical shift calibration and quantification of the compounds in the water decoction. The methyl signals at δH 3.21 were used for the quantification of choline (1), those at δH 3.30 and 3.11 for stachydrine (2) and those at δH 3.41 and 3.13 for betonicine (3). Using this method, the quantity of choline (1) was estimated to be 0.1% (±0.03%) w/w in the water decoction, 1.3% (±0.4%) for stachydrine (2) and 5.1% (±1.5%) for betonicine (3).
Statements
Data availability statement
The .mzML and raw UHPLC-HMRMS2 data for the decoction and fraction can be accessed through MassIVE doi:10.25345/C5PK07C9R (https://massive.ucsd.edu/ProteoSAFe/dataset.jsp?task=b218d9b20d5248fa883d7d7aed92dde9). To access the molecular networks, follow the hyperlink: PI [https://gnps.ucsd.edu/ProteoSAFe/status.jsp?task=0a774a700b9e4a009ba070fe6aca5557], NI [https://gnps.ucsd.edu/ProteoSAFe/status.jsp?task=3d4dba43d67145ba8999e7c1c6a1bb23]. The Sirius annotations results (CSI:FingerID and CANOPUS) are accessible here. The NMR data of the isolated compound can be accessed here (https://doi.org/10.57992/nmrxiv.p154). Check the WikiData query and results about the reported chemistry for the species according to the LOTUS initiative (Rutz et al., 2022).
Author contributions
LV: Data curation, Formal Analysis, Investigation, Methodology, Validation, Writing – original draft, Writing – review and editing. RH: Data curation, Investigation, Methodology, Writing – original draft, Writing – review and editing. LM: Conceptualization, Data curation, Formal Analysis, Investigation, Methodology, Software, Supervision, Validation, Visualization, Writing – original draft, Writing – review and editing. L-MQ-G: Data curation, Investigation, Methodology, Validation, Visualization, Writing – original draft, Writing – review and editing. OK: Formal Analysis, Investigation, Methodology, Validation, Visualization, Writing – original draft, Writing – review and editing. AG: Data curation, Methodology, Validation, Writing – original draft, Writing – review and editing. RN: Data curation, Investigation, Methodology, Visualization, Writing – original draft, Writing – review and editing. ED: Data curation, Formal Analysis, Investigation, Methodology, Visualization, Writing – original draft, Writing – review and editing. SS: Data curation, Formal Analysis, Investigation, Methodology, Writing – original draft, Writing – review and editing. J-LW: Conceptualization, Data curation, Formal Analysis, Funding acquisition, Investigation, Methodology, Project administration, Resources, Software, Supervision, Validation, Visualization, Writing – original draft, Writing – review and editing. EFQ: Conceptualization, Data curation, Formal Analysis, Funding acquisition, Investigation, Methodology, Project administration, Resources, Software, Supervision, Validation, Visualization, Writing – original draft, Writing – review and editing.
Funding
The authors declare that no financial support was received for the research and/or publication of this article.
Acknowledgments
The authors would like to thank Biorender (https://app.biorender.com/) for the icons used in Figure 2.
Conflict of interest
The authors declare that the research was conducted in the absence of any commercial or financial relationships that could be construed as a potential conflict of interest.
The author(s) declared that they were an editorial board member of Frontiers, at the time of submission. This had no impact on the peer review process and the final decision.
Generative AI statement
The authors declare that no Generative AI was used in the creation of this manuscript.
Any alternative text (alt text) provided alongside figures in this article has been generated by Frontiers with the support of artificial intelligence and reasonable efforts have been made to ensure accuracy, including review by the authors wherever possible. If you identify any issues, please contact us.
Publisher’s note
All claims expressed in this article are solely those of the authors and do not necessarily represent those of their affiliated organizations, or those of the publisher, the editors and the reviewers. Any product that may be evaluated in this article, or claim that may be made by its manufacturer, is not guaranteed or endorsed by the publisher.
Supplementary material
The Supplementary Material for this article can be found online at: https://www.frontiersin.org/articles/10.3389/fntpr.2025.1717575/full#supplementary-material
References
1
Abbasi M. S. P. Tousi A. Z. Yazdani Y. Vahdat S. Gharebakhshi F. Nikrad N. et al (2023). Dietary choline and betaine intake, cardio-metabolic risk factors and prevalence of metabolic syndrome among overweight and Obese adults. Bmc Endocr. Disord.23, 67. 10.1186/s12902-023-01323-4
2
Alpert A. J. (1990). Hydrophilic-interaction chromatography for the separation of peptides, nucleic-acids and other polar compounds. J. Chromatogr. A499, 177–196. 10.1016/s0021-9673(00)96972-3
3
Bassene E. Olschwang D. Pousset J. L. (1986). African medicinal plants. Alkaloids of Combretum micranthum G. Don (Kinkeliba). Ann. Pharm. Françaises44, 191–196.
4
Bougma A. Sere A. Bazie B. S. R. Sangare H. Ouilly J. T. Bassole I. H. N. (2021). Composition and physicochemical properties of Combretum collinum, Combretum micranthum, Combretum nigricans, and combretum niorense seeds and seed oils from Burkina Faso. J. Am. Oil Chem. Soc.98, 1083–1092. 10.1002/aocs.12540
5
Bourqui A. Niang E. a.B. Graz B. Diop E. A. Dahaba M. Thiaw I. et al (2021). Hypertension treatment with Combretum micranthum or Hibiscus sabdariffa, as decoction or tablet: a randomized clinical trial. J. Hum. Hypertens.35, 800–808. 10.1038/s41371-020-00415-1
6
Buszewski B. Noga S. (2012). Hydrophilic interaction liquid chromatography (HILIC)-a powerful separation technique. Anal. Bioanal. Chem.402, 231–247. 10.1007/s00216-011-5308-5
7
Chen H. H. Wang S. N. Cao T. T. Zheng J. L. Tian J. Shang X. L. et al (2020). Stachydrine hydrochloride alleviates pressure overload-induced heart failure and calcium mishandling on mice. J. Ethnopharmacol.248, 112306. 10.1016/j.jep.2019.112306
8
Cheng F. Zhou Y. X. Wang M. Guo C. J. Cao Z. X. Zhang R. Q. et al (2020). A review of pharmacological and pharmacokinetic properties of stachydrine. Pharmacol. Res.155, 104755. 10.1016/j.phrs.2020.104755
9
Chika A. Bello S. O. (2010). Antihyperglycaemic activity of aqueous leaf extract of Combretum micranthum (Combretaceae) in normal and alloxan-induced diabetic rats. J. Ethnopharmacol.129, 34–37. 10.1016/j.jep.2010.02.008
10
Davis A. L. Cai Y. Davies A. P. Lewis J. R. (1996). 1H and13C NMR assignments of some green tea polyphenols. Magnetic Reson. Chem.34, 887–890. 10.1002/(sici)1097-458x(199611)34:11<887::aid-omr995>3.0.co;2-u
11
Dührkop K. Shen H. B. Meusel M. Rousu J. Böcker S. (2015). Searching molecular structure databases with tandem mass spectra using CSI:FingerID. Proc. Natl. Acad. Sci. U. S. A.112, 12580–12585. 10.1073/pnas.1509788112
12
Duhrkop K. Fleischauer M. Ludwig M. Aksenov A. A. Melnik A. V. Meusel M. et al (2019). SIRIUS 4: a rapid tool for turning tandem mass spectra into metabolite structure information. Nat. Methods16, 299–302. 10.1038/s41592-019-0344-8
13
Duhrkop K. Nothias L. F. Fleischauer M. Reher R. Ludwig M. Hoffmann M. A. et al (2021). Systematic classification of unknown metabolites using high-resolution fragmentation mass spectra. Nat. Biotechnol.39, 462–471. 10.1038/s41587-020-0740-8
14
Eloff J. N. Katerere D. R. Mcgaw L. J. (2008). The biological activity and chemistry of the southern African combretaceae. J. Ethnopharmacol.119, 686–699. 10.1016/j.jep.2008.07.051
15
Fyhrquist P. Mwasumbi L. Hæggström C. A. Vuorela H. Hiltunen R. Vuorela P. (2002). Ethnobotanical and antimicrobial investigation on some species of and (Combretaceae) growing in Tanzania. J. Ethnopharmacol.79, 169–177. 10.1016/S0378-8741(01)00375-0
16
Gaudin K. Valls-Fonayet J. Cordazzo R. Serafin W. Lafon E. Gaubert A. et al (2024). Separation of polyphenols by HILIC methods with diode array detection, charged aerosol detection and mass spectrometry: application to grapevine extracts rich in stilbenoids. J. Chromatogr. A1736, 465422. 10.1016/j.chroma.2024.465422
17
Gevrenova R. Bardarov V. Bardarov K. Voutquenne-Nazabadioko L. Henry M. (2018). Selective profiling of saponins from Gypsophila trichotoma wend. by HILIC separation and HRMS detection. Phytochem. Anal.29, 250–274. 10.1002/pca.2739
18
Guillarme D. Nguyen D. T. T. Rudaz S. Veuthey J. L. (2008). Method transfer for fast liquid chromatography in pharmaceutical analysis: application to short columns packed with small particle. Part II: gradient experiments. Eur. J. Pharm. Biopharm.68, 430–440. 10.1016/j.ejpb.2007.06.018
19
Guo X.-Y. Wang N.-L. Bo L. Li Y.-H. Xu Q. Yao X.-S. (2007). Chemical constituents from Pithecellobium clypearia and their effects on T lymphocytes proliferation. J. Chin. Pharm. Sci.16, 208–213.
20
He M. Min J. W. Kong W. L. He X. H. Li J. X. Peng B. W. (2016). A review on the pharmacological effects of vitexin and isovitexin. Fitoterapia115, 74–85. 10.1016/j.fitote.2016.09.011
21
Heuckeroth S. Damiani T. Smirnov A. Mokshyna O. Brungs C. Korf A. et al (2024). Reproducible mass spectrometry data processing and compound annotation in MZmine 3. Nat. Protoc.19, 2597–2641. 10.1038/s41596-024-00996-y
22
Hoffmann M. A. Nothias L. F. Ludwig M. Fleischauer M. Gentry E. C. Witting M. et al (2022). High-confidence structural annotation of metabolites absent from spectral libraries. Nat. Biotechnol.40, 411–421. 10.1038/s41587-021-01045-9
23
Holzgrabe U. (2010). Quantitative NMR spectroscopy in pharmaceutical applications. Prog. Nucl. Magnetic Reson. Spectrosc.57, 229–240. 10.1016/j.pnmrs.2010.05.001
24
Hulstaert N. Shofstahl J. Sachsenberg T. Walzer M. Barsnes H. Martens L. Perez-Riverol Y. (2020). Thermorawfileparser: modular, scalable, and cross-platform raw file conversion. J Proteome Res.19, 537–542. 10.1021/acs.jproteome.9b00328
25
Jayasinghe U. L. B. Balasooriya B. a.I. S. Bandara A. G. D. Fujimoto Y. (2004). Glycosides from Grewia damine and Filicium decipiens. Nat. Prod. Res.18, 499–502. 10.1080/14786410310001620538
26
Jentzsch K. Spiegl P. Fuchs L. (1962). Untersuchungen uber die inhaltsstoffe der blatter von Combretum micranthum G. Don. Planta Medica10, 1–8. 10.1055/s-0028-1100268
27
Kim J. S. Kim Y. H. Seo Y. W. Park S. (2007). Quorum sensing inhibitors from the red alga, Ahnfeltiopsis flabelliformis. Biotechnol. Bioprocess Eng.12, 308–311. 10.1007/bf02931109
28
Kim H. W. Wang M. X. Leber C. A. Nothias L. F. Reher R. Kang K. B. et al (2021). NPClassifier: a deep neural network-based structural classification tool for natural products. J. Nat. Prod.84, 2795–2807. 10.1021/acs.jnatprod.1c00399
29
Kpemissi M. Eklu-Gadegbeku K. Veerapur V. P. Potarniche A. V. Adi K. Vijayakumar S. et al (2019). Antioxidant and nephroprotection activities of Combretum micranthum: a phytochemical, in vitro and ex-vivo studies. Heliyon5, e01365. 10.1016/j.heliyon.2019.e01365
30
Kuchta K. Ortwein J. Hennig L. Wilhelm-Rauwald H. (2014). 1H-qNMR for direct quantification of stachydrine in Leonurus japonicus and L. cardiaca. Fitoterapia96, 8–17. 10.1016/j.fitote.2014.03.023
31
Lei D. M. Yao C. L. Chen X. B. Zhang J. Q. Li J. Y. Guo D. A. (2022). Analysis of chemical constituents in classical prescription danggui Buxue Decoction based on RP-Q-TOF-MS and HILIC-Q-TOF-MS. Zhongguo Zhong Yao Za Zhi47, 2109–2120. 10.19540/j.cnki.cjcmm.20210330.301
32
Liao L. Tang Y. Li B. Tang J. Xu H. Zhao K. et al (2023). Stachydrine, a potential drug for the treatment of cardiovascular system and central nervous system diseases. Biomed. and Pharmacother.161, 114489. 10.1016/j.biopha.2023.114489
33
Lima G. R. D. De Sales I. R. P. Caldas M. R. D. De Jesus N. Z. T. Falcao H. D. Barbosa J. M. et al (2012). Bioactivities of the genus Combretum (Combretaceae): a review. Molecules17, 9142–9206. 10.3390/molecules17089142
34
Lin Y. L. Kuo Y. H. Shiao M. S. Chen C. C. Ou J. C. (2000). Flavonoid glycosides from Terminalia catapp. J. Chin. Chem. Soc.47, 253–256. 10.1002/jccs.200000030
35
Liu X. Shan X. L. Chen H. H. Li Z. Zhao P. Zhang C. et al (2019). Stachydrine ameliorates cardiac fibrosis through inhibition of angiotensin II/transformation growth factor β1 fibrogenic axis. Front. Pharmacol.10, 538. 10.3389/fphar.2019.00538
36
Ludwig M. Nothias L. F. Dührkop K. Koester I. Fleischauer M. Hoffmann M. A. et al (2020). Database-independent molecular formula annotation using Gibbs sampling through ZODIAC (vol 2, pg 629, 2020). Nat. Mach. Intell.2, 727. 10.1038/s42256-020-00259-x
37
Mccalley D. V. (2017). Understanding and manipulating the separation in hydrophilic interaction liquid chromatography. J. Chromatogr. A1523, 49–71. 10.1016/j.chroma.2017.06.026
38
Meier R. M. Tamm C. (1991). Studies directed towards the biosynthesis of the C7n unit of rifamycin-B - a new synthesis of quinic acid from shikimic acid. Helvetica Chim. Acta74, 807–818. 10.1002/hlca.19910740415
39
Nothias L. F. Petras D. Schmid R. Duhrkop K. Rainer J. Sarvepalli A. et al (2020). Feature-based molecular networking in the GNPS analysis environment. Nat. Methods17, 905–908. 10.1038/s41592-020-0933-6
40
Pauli G. F. Chen S. N. Simmler C. Lankin D. C. Godecke T. Jaki B. U. et al (2014). Importance of purity evaluation and the potential of quantitative H1 NMR as a purity assay. J. Med. Chem.57, 9220–9231. 10.1021/jm500734a
41
Queiroz E. F. Alfattani A. Afzan A. Marcourt L. Guillarme D. Wolfender J. L. (2019). Utility of dry load injection for an efficient natural products isolation at the semi-preparative chromatographic scale. J. Chromatogr. A1598, 85–91. 10.1016/j.chroma.2019.03.042
42
Queiroz E. F. Guillarme D. Wolfender J. L. (2024). Advanced high-resolution chromatographic strategies for efficient isolation of natural products from complex biological matrices: from metabolite profiling to pure chemical entities. Phytochem. Rev.23, 1415–1442. 10.1007/s11101-024-09928-w
43
Quiñones M. Margalef M. Arola-Arnal A. Muguerza B. Miguel M. Aleixandre A. (2015). The blood pressure effect and related plasma levels of flavan-3-ols in spontaneously hypertensive rats. Food and Funct.6, 3479–3489. 10.1039/c5fo00547g
44
Roemmelt S. Zimmermann N. Rademacher W. Treutter D. (2003). Formation of novel flavonoids in apple (Malus×domestica) treated with the 2-oxoglutarate-dependent dioxygenase inhibitor prohexadione-Ca. Phytochemistry64, 709–716. 10.1016/s0031-9422(03)00389-3
45
Rutz A. Dounoue-Kubo M. Ollivier S. Bisson J. Bagheri M. Saesong T. et al (2019). Taxonomically informed scoring enhances confidence in natural products annotation. Front. Plant Sci.10, 1329. 10.3389/fpls.2019.01329
46
Rutz A. Sorokina M. Galgonek J. Mietchen D. Willighagen E. Gaudry A. et al (2022). The LOTUS initiative for open knowledge management in natural products research. Elife11, e70780. 10.7554/elife.70780
47
Saldanha L. L. Delgado A. Q. Marcourt L. Camaforte N. a.D. Vareda P. M. P. Ebrahimi S. N. et al (2021). Hypoglycemic active principles from the leaves of Bauhinia holophylla: comprehensive phytochemical characterization and in vivo activity profile. Plos One16, e0258016. 10.1371/journal.pone.0258016
48
Schmid R. Petras D. Nothias L. F. Wang M. Aron A. T. Jagels A. et al (2021). Ion identity molecular networking for mass spectrometry-based metabolomics in the GNPS environment. Nat. Commun.12, 3832. 10.1038/s41467-021-23953-9
49
Seck S. M. Doupa D. Dia D. G. Diop E. A. Ardiet D. L. Nogueira R. C. et al (2017). Clinical efficacy of African traditional medicines in hypertension: a randomized controlled trial with Combretum micranthum and Hibiscus sabdariffa Journal of Human Hypertension. J. Hum. Hypertens.32, 75–81. 10.1038/s41371-017-0001-6
50
Tang D. Q. Zou L. Yin X. X. Ong C. N. (2016). HILIC-MS for metabolomics: an attractive and complementary approach to RPLC-MS. Mass Spectrom. Rev.35, 574–600. 10.1002/mas.21445
51
Tine Y. Sene M. Gaye C. Diallo A. Ndiaye B. Ndoye I. et al (2024). Combretum micranthum G. Don (Combretaceae): a review on traditional uses, phytochemistry, pharmacology and toxicology. Chem. and Biodivers.21, e202301606. 10.1002/cbdv.202301606
52
Tirloni C. a.S. Palozi R. a.C. Schaedler M. I. Guarnier L. P. Silva A. O. Marques M. A. et al (2019). Influence of Luehea divaricata Mart. extracts on peripheral vascular resistance and the role of nitric oxide and both Ca+2-sensitive and Kir6.1 ATP-sensitive K+ channels in the vasodilatory effects of isovitexin on isolated perfused mesenteric beds. Phytomedicine56, 74–82. 10.1016/j.phymed.2018.08.014
53
Ulus I. H. Arslan B. Y. Savci V. Kiran B. K. (1995). Restoration of blood pressure by choline treatment in rats made hypotensive by haemorrhage. Br. J. Pharmacol.116, 1911–1917. 10.1111/j.1476-5381.1995.tb16682.x
54
Wang M. X. Carver J. J. Phelan V. V. Sanchez L. M. Garg N. Peng Y. et al (2016). Sharing and community curation of mass spectrometry data with global natural products social molecular networking. Nat. Biotechnol.34, 828–837. 10.1038/nbt.3597
55
Welch C. R. (2010). Chemistry and pharmacology of kinkéliba (Combretum micranthum), a West African medicinal plant. State Univ. N. J.
56
Welch C. Zhen J. Bassène E. Raskin I. Simon J. E. Wu Q. L. (2018). Bioactive polyphenols in kinkeliba tea (Combretum micranthum) and their glucose-lowering activities. J. Food Drug Analysis26, 487–496. 10.1016/j.jfda.2017.05.009
57
Xiao C. N. Dai H. Liu H. B. Wang Y. L. Tang H. (2008). Revealing the metabonomic variation of rosemary extracts using 1H NMR spectroscopy and multivariate data analysis 1H-NMR spectroscopy and multivariate data analysis. J. Agric. Food Chem.56, 10142–10153. 10.1021/jf8016833
58
Xie X. Zhang Z. Wang X. Luo Z. Lai B. Xiao L. et al (2018). Stachydrine protects eNOS uncoupling and ameliorates endothelial dysfunction induced by homocysteine. Mol. Med.24, 10. 10.1186/s10020-018-0010-0
59
Xie X. Y. Yang C. M. Cui Q. Ma W. Liu J. Yao Q. Y. et al (2019). Stachydrine mediates rapid vascular relaxation: activation of endothelial nitric oxide synthase involving AMP-activated protein kinase and Akt phosphorylation in vascular endothelial cells. J. Agric. Food Chem.67, 9805–9811. 10.1021/acs.jafc.9b03501
60
Xing Q. Q. Liang T. Shen G. B. Wang X. L. Jin Y. Liang X. M. (2012). Comprehensive HILIC × RPLC with mass spectrometry detection for the analysis of saponins in Panax notoginseng. Analyst137, 2239–2249. 10.1039/c2an16078a
61
Zhao H. Wang L. Yu Y. Yang J. Zhang X. Zhao Z. et al (2023). Comparison of Lycium barbarum fruits polysaccharide from different regions of China by acidic hydrolysate fingerprinting-based HILIC-ELSD-ESI-TOF-MS combined with chemometrics analysis. Phytochem. Anal.34, 186–197. 10.1002/pca.3192
Summary
Keywords
Combretum micranthum , plant decoction, UHPLC, HILIC, reverse phase chromatography, 1H-NMR quantification
Citation
Vuadens L, Huber R, Marcourt L, Quiros-Guerrero L-M, Kirchhoffer OA, Gaudry A, Nogueira RC, Diop EA, Seck SM, Wolfender J-L and Queiroz EF (2026) Development of a comprehensive approach for the characterization of polar plant decoctions by orthogonal LC-MS reversed phase, HILIC, and NMR metabolite profiling: the case of Combretum micranthum. Front. Nat. Prod. 4:1717575. doi: 10.3389/fntpr.2025.1717575
Received
02 October 2025
Revised
10 November 2025
Accepted
14 November 2025
Published
12 January 2026
Volume
4 - 2025
Edited by
Mostafa Rateb, University of the West of Scotland, United Kingdom
Reviewed by
Trung Huy Ngo, Hanoi University of Pharmacy, Vietnam
Ayesha Zahid, Minhaj University Lahore, Pakistan
Updates
Copyright
© 2026 Vuadens, Huber, Marcourt, Quiros-Guerrero, Kirchhoffer, Gaudry, Nogueira, Diop, Seck, Wolfender and Queiroz.
This is an open-access article distributed under the terms of the Creative Commons Attribution License (CC BY). The use, distribution or reproduction in other forums is permitted, provided the original author(s) and the copyright owner(s) are credited and that the original publication in this journal is cited, in accordance with accepted academic practice. No use, distribution or reproduction is permitted which does not comply with these terms.
*Correspondence: Emerson Ferreira Queiroz, emerson.ferreira@unige.ch; Jean-Luc Wolfender, jean-luc.wolfender@unige.ch
Disclaimer
All claims expressed in this article are solely those of the authors and do not necessarily represent those of their affiliated organizations, or those of the publisher, the editors and the reviewers. Any product that may be evaluated in this article or claim that may be made by its manufacturer is not guaranteed or endorsed by the publisher.