 Yu Qian
 Jiahui Cao1
 Jing Han
 Zhigang Zheng
- 1College of Physics and Optoelectronic Technology, Baoji University of Arts and Sciences, Baoji, China
- 2School of Systems Science, Beijing Normal University, Beijing, China
- 3Institute of Systems Science, Huaqiao University, Xiamen, China
- 4College of Information Science and Engineering, Huaqiao University, Xiamen, China
- 5School of Mathematical Sciences, Huaqiao University, Quanzhou, China
The study of specific physiological processes from the perspective of network physiology has gained recent attention. Modeling the global information integration among the separated functionalized modules in structural and functional brain networks is a central problem. In this article, the preferentially cutting–rewiring operation (PCRO) is introduced to approximatively describe the above physiological process, which consists of the cutting procedure and the rewiring procedure with specific preferential constraints. By applying the PCRO on the classical Erdös–Rényi random network (ERRN), three types of isolated nodes are generated, based on which the common leaves (CLs) are formed between the two hubs. This makes the initially homogeneous ERRN experience drastic changes and become heterogeneous. Importantly, a statistical analysis method is proposed to theoretically analyze the statistical properties of an ERRN with a PCRO. Specifically, the probability distributions of these three types of isolated nodes are derived, based on which the probability distribution of the CLs can be obtained easily. Furthermore, the validity and universality of our statistical analysis method have been confirmed in numerical experiments. Our contributions may shed light on a new perspective in the interdisciplinary field of complexity science and biological science and would be of great and general interest to network physiology.
1 Introduction
The collective behaviors that emerged on different kinds of complex systems have become the central topics under investigation since the seminal “small-world” and “scale-free” network models were successively proposed by Strogatz and Barabási (Watts and Strogatz, 1998; Barabási and Albert, 1999). Several typical types of spatiotemporal dynamical behaviors, such as synchronous phenomena (Wu et al., 2012; Walter et al., 2014; Zhang et al., 2015; Andrzejak et al., 2017; Rybalova et al., 2020; Ghosh et al., 2023), self-sustained oscillations (Roxin et al., 2004; Sinha et al., 2007; Qian et al., 2010a; Qian et al., 2010b; Isele and Schöll, 2015; Fretter et al., 2017), and chimera and chimeralike states (Hagerstrom et al., 2012; Omelchenko et al., 2013; Semenova et al., 2016; Kachhara and Ambika, 2021; Lei et al., 2022; Lei et al., 2023; Zhang H. et al., 2024), have been reported. For example, Rybalova et al. (2020) exposed the relay and complete synchronization in heterogeneous multiplex networks of chaotic maps. Sinha et al. (2007) discussed the emergence of self-sustained patterns in small-world excitable media. Kachhara and Ambika revealed the frequency chimera state induced by differing dynamical timescales (Kachhara and Ambika, 2021). Lei et al. (2023) and Zhang H. et al. (2024), respectively, uncovered the chimeralike oscillation modes on excitable scale-free networks and the alternate attractor chimeralike states on rings of chaotic Lorenz-type oscillators.
One of the most classical network models, the Erdös–Rényi random network (ERRN), was proposed by P. Erdös and A. Rényi (Erdös and Rényi, 1959; Erdös and Rényi, 1960) and is utilized to explore these issues. Many interesting phenomena were found, and great achievements were realized by this paradigmatic network model (Gong et al., 2005; Xu and Liu, 2008; Tattini et al., 2012; Ferrari et al., 2013; Schmeltzer et al., 2014; Almeira et al., 2020; Masoumi et al., 2022; Kartal and Kartal, 2023; Qian, 2014; Qian et al., 2017; Qian and Zhang, 2017). For example, Gong et al. discussed the synchronization of Erdös–Rényi networks (Gong et al., 2005). Tattini et al. investigated the coherent periodic activity on excitatory Erdös–Rényi neural networks and exposed the key role of network connectivity (Tattini et al., 2012). Almeira et al. (2020) discovered the scaling of percolation transitions on Erdös–Rényi networks under centrality-based attacks. Kartal et al. studied the complex dynamics of the COVID-19 mathematical model on the Erdös–Rényi network (Kartal and Kartal, 2023). Qian et al. first reported the emergence of the self-sustained oscillations on excitable Erdös–Rényi random networks and exposed the determinants (Qian, 2014; Qian et al., 2017) and then revealed the effects of time delay and connection probability on the corresponding oscillations and synchronization transitions (Qian and Zhang, 2017).
In addition to the collective behaviors that can self-organize to emerge on ERRNs consisting of different types of local units, the statistical properties of the ERRN are also an important issue. For example, Erdös and Rényi were the first to study the distribution of the maximum and minimum degree in a random graph (Erdös and Rényi, 1959), and the full degree distribution was derived later by Bollobás (1981). Chung and Lu discussed the diameter of sparse random graphs (Chung and Lu, 2001). Martin and S̆ulc (2010) investigated the return probabilities and hitting times of random walks on sparse Erdös–Rényi graphs. Bizhani et al. (2011) explored the random sequential renormalization and agglomerative percolation on Erdös–Rényi networks. Hartmann and Mézard (2018) first studied the distribution of diameters for Erdös–Rényi random graphs and then discussed the distribution of shortest path lengths of subcritical Erdös–Rényi networks (Katzav et al., 2018). However, whether the statistical properties of an ERRN with specific operation can be theoretically derived is still unknown.
Nowadays, investigating the physiological processes from the perspective of network physiology is an important topic in the interdisciplinary field of complexity science and biological science. Several excellent contributions were achieved in this field (Ivanov, 2021; Shi et al., 2022; Sinha et al., 2022; Goodfellow et al., 2022; Schöll et al., 2022; Venkadesh et al., 2024; Rosenblum, 2024; Zhang Z. et al., 2024; Qian et al., 2024a). For example, Ivanov (2021) summarized the new field of network physiology, that is, building the human physiolome. Sinha et al. (2022) discussed the perspectives on understanding aberrant brain networks in epilepsy. Schöll et al. (2022) reviewed the adaptive networks in functional modeling of physiological systems.
As we know, there exists a cost-efficiency trade-off between the physical cost of the network and the information integration among the whole system in organizing structural and functional brain networks. To save wiring costs, brain networks tend to build module structures to implement localized functions. To achieve global information integration among the separated functionalized modules, long-range synapses can be created via synaptic plasticity on these local structures. More importantly, the newly reshaped long-range synapses will preferentially connect to specific hub regions to fulfill special physiological functions among the whole brain systems. So we would ask whether the appropriate functional model can be proposed to describe this physiological process from the perspective of network physiology? We think this is an important issue of great and general interest to network physiology.
In this article, the preferentially cutting–rewiring operation (PCRO) is proposed to approximatively describe the above physiological process. We have found that, by applying the PCRO on the ERRN with certain preferential constraints, the topological feature of the given network will change dramatically. Then, the theoretical statistical properties of the operated ERRN are studied. The remainder of the article is organized as follows. Section 2 introduces the cutting and rewiring procedures of the PCRO. In Section 3, we apply the PCRO to the classical ERRN. The statistical analysis method proposed in Section 4 supports studying the theoretical statistical properties of an ERRN with a PCRO. The validity and the universality of our statistical analysis method are, respectively, confirmed in Sections 5, 6. Finally, we give the conclusion in the last section.
2 The cutting and rewiring procedures of a PCRO
In this part, we first introduce the PCRO, which is adopted to regulate the structure of a given network. The PCRO proposed in the present article contains two different stages: the cutting procedure and the rewiring procedure with specific preferential constraints, which are denoted by
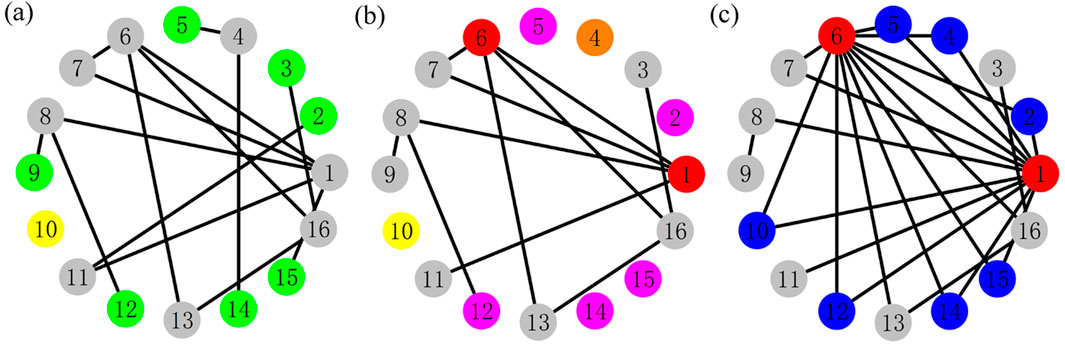
Figure 1. (Color online) The schematic diagram of the preferentially cutting–rewiring operation (PCRO) proposed in this article. Three indicators,
By applying the cutting procedure with a specific PCRO probability
As the cutting procedure is completed, the second stage of the PCRO starts, that is, the rewiring procedure. In this stage, the above three types of isolated nodes, that is, the yellow NIN, the pink ADIN, and the orange PDIN, will be rewired to the two red target nodes. In the following discussion, these rewired nodes are called the common leaves (CLs) and are colored blue. Figure 1C shows the network structure after the rewiring operation, in which many blue CLs are formed between the two red target nodes. This makes the two target nodes possess relatively large degrees, which are consequently called hubs. Based on the illustrations shown in Figure 1, we can conclude that the PCRO is an effective method of regulating the structure of the given network, by which many CLs can be formed between the two hubs. The initially homogeneous network will become heterogeneous by applying the PCRO.
3 The ERRNs with a PCRO
The classical ERRN is utilized to test the effects of the PCRO. A classical ERRN can be constructed only based on a simple rule, that is, the connections between every pair of nodes in the ERRN are linked with a specific connection probability. In the present article, the initially homogeneous ERRN without a PCRO is composed of
Figures 2A–D display the heterogeneous ERRNs constructed for four different parameters of the PCRO, that is, four different PCRO probabilities
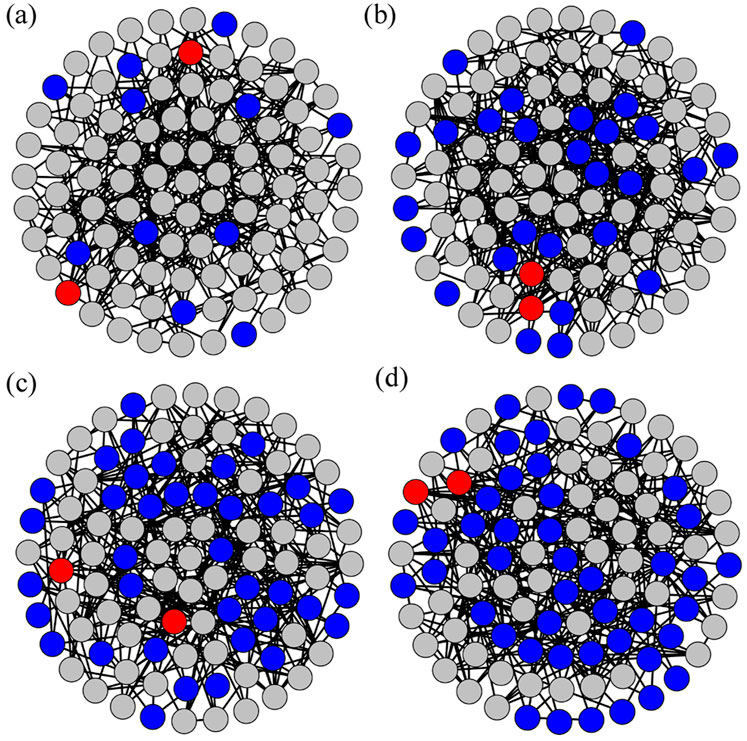
Figure 2. (Color online) The Erdös–Rényi random networks (ERRNs) obtained by the PCRO with the same preferential constraints utilized in Figure 1 (i.e.,
4 The statistical analysis method
Now, we would ask whether the statistical properties of the ERRN with a PCRO can be theoretically derived, especially the probability distribution of CL formed in the cutting and rewiring procedures. A statistical analysis method is proposed to explore this issue. As shown in Figure 1B, three types of isolated nodes exist in an ERRN with a PCRO: the yellow NIN, the pink ADIN, and the orange PDIN. The rewiring procedure of these isolated nodes with a certain preferential constraint changes them into the CLs between the two hubs. The probability distributions of NIN, ADIN, and PDIN (denoted by
4.1 The probability distribution of NSPCCPs
For an arbitrary ER random network with a specific system size and connection probability
By calculating the statistical average for all possible
The actual value of the average degree
Similarly, for the same ER random network with
By calculating the statistical average for all possible
This indicates that for a given ER random network with
We further introduce an approximation that, for a given ER random network with
With this approximation, one can conveniently obtain the relationship between the actual value of an edge
In this case,
Based on the above approximation, we can apply the equivalent connection probability
Now, we assume that there exist
By calculating the statistical average for all possible
4.2 The probability distribution of ADINs
The probability distribution of ADINs can be conveniently obtained based on the
By calculating the statistical average for all possible
4.3 The probability distribution of PDINs
We can further solve the probability distribution of PDINs with the aid of
Here,
Condition I:
The
By combining (i) and (ii),
Condition II:
The degrees of the neighbor nodes
Condition III:
All the neighbor nodes of the
By multiplying the above three conditional probabilities, we can obtain the conditional probability for the
As the
By further calculating the statistical average for all possible
Based on the above
4.4 The probability distribution of NINs
Here, we discuss the last type of isolated node, that is, the NINs colored in yellow in Figure 1B. For an arbitrary ER random network with a given
Here, we assume that
4.5 The probability distribution of CLs
Thus far, the probability distributions of NINs, ADINs, and PDINs have been derived analytically. Furthermore, these three types of isolated nodes are rewired in the rewiring procedure with a certain preferential constraint and become the CLs between the two hubs. As
5 The validity and applicability of the statistical analysis method
In this section, we try to apply the statistical analysis method on an ERRN with a PCRO to verify the correctness of the above conclusions. The preferential constraints
We first test the probability distributions of ADINs, PDINs, NINs, and CLs in the operated ERRNs with a specific PCRO probability. The corresponding results for
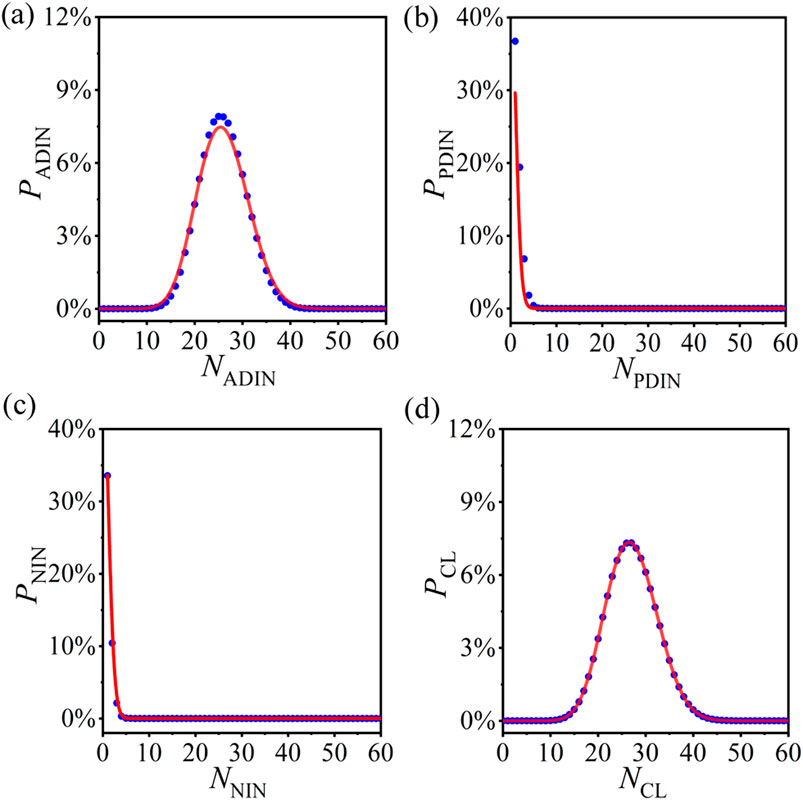
Figure 3. (Color online) The numerical results (blue circles) and theoretical predictions (red curves) of the probability distributions of actively deleted isolated nodes (ADINs) [(A)], passively deleted isolated nodes (PDINs) [(B)], naturally isolated nodes (NINs) [(C)], and CLs [(D)] in the operated ERRNs with PCRO probability
Now, we further verify the statistical analysis method for other PCRO probabilities. Here, we only utilize the probability distribution of CLs as the example, which is derived based on the probability distributions of ADINs, PDINs, and NINs. Figures 4A–C respectively, reveal the numerical results (blue circles) and theoretical predictions (red curves) of the probability distribution of CLs in the operated ERRNs for different PCRO probabilities
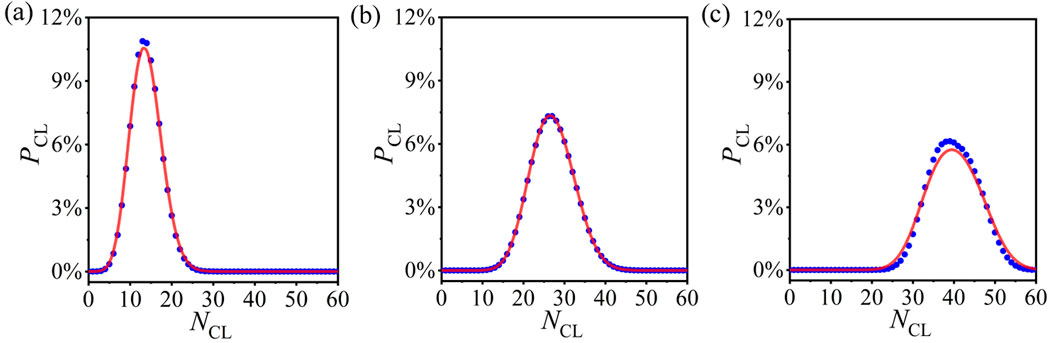
Figure 4. (Color online) The numerical results (blue circles) and theoretical predictions (red curves) of the probability distributions of CL in the operated ERRNs for different PCRO probabilities
Based on the above results, we can now apply the statistical analysis method to forecast the average number of CLs in the operated ERRN, which are formed in the cutting and rewiring procedures of the PCRO and largely determined by the PCRO probability condition. Figure 5 presents the numerical results (blue circles) and theoretical predictions (red curves) of the average number of CLs
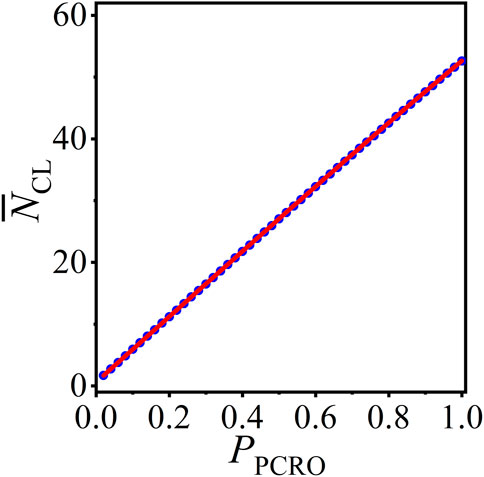
Figure 5. (Color online) The numerical results (blue circles) and theoretical predictions (red curves) of the average number of CLs
6 The universality of the statistical analysis method
It is necessary to inspect the universality of our statistical analysis method. The average number of CLs
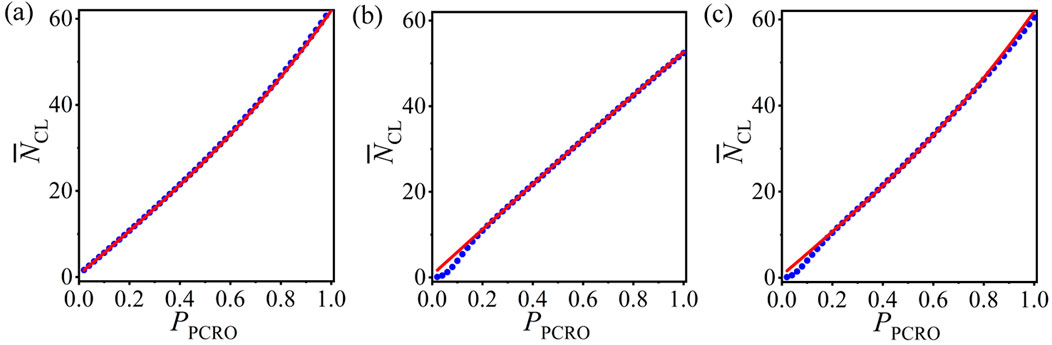
Figure 6. (Color online) The numerical results (blue circles) and theoretical predictions (red curves) of the average number of CLs
The statistical analysis method is applicable to general ERRN structures. The preferential constraints are the same as those in Figure 2, and the PCRO probability
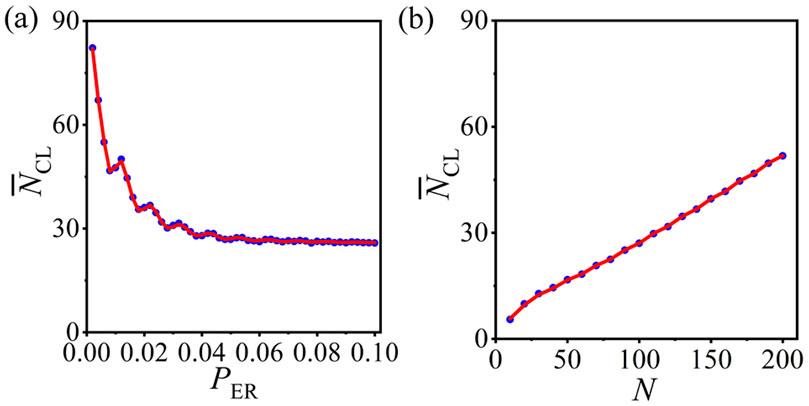
Figure 7. (Color online) The numerical results (blue circles) and theoretical predictions (red curves) of the average number of CLs
7 Mimicking epileptic-seizure-related synchronization phenomena in brain systems
Modeling specific physiological processes and physiological functions from the perspective of network physiology should be discussed. In this part, we use the PCRO method proposed in this article to mimic the epileptic-seizure-related synchronization phenomena in pathological brain systems. This issue was first studied from the perspective of network physiology by Gerster et al. (2020) and Schöll (2021). They revealed that, in addition to the empirical brain network, the small-world networks with intermediate rewiring probability can also reproduce the epileptic-seizure-related synchronization phenomena that closely resemble the ones seen during epileptic seizures in humans (see Figure 7 in Gerster et al. (2020) and Figure 3 in Schöll (2021)). In this case, the corresponding network structure properties are found to be
Based on the discussions presented in the above sections, we can conclude that the proposed PCRO method also has the effect of regulating the network structure. By applying the PCRO to the paradigmatic network models, the corresponding structures will undergo a transition from homogeneous to heterogeneous. So we would ask whether a similar balance of regularity and randomness can also be induced by the PCRO, by which the same epileptic-seizure-related synchronization phenomena can be mimicked by our scenario.
An ERRN consisting of FitzHugh–Nagumo (FHN) neurons with the rotational coupling scheme is utilized to address this issue. The system size
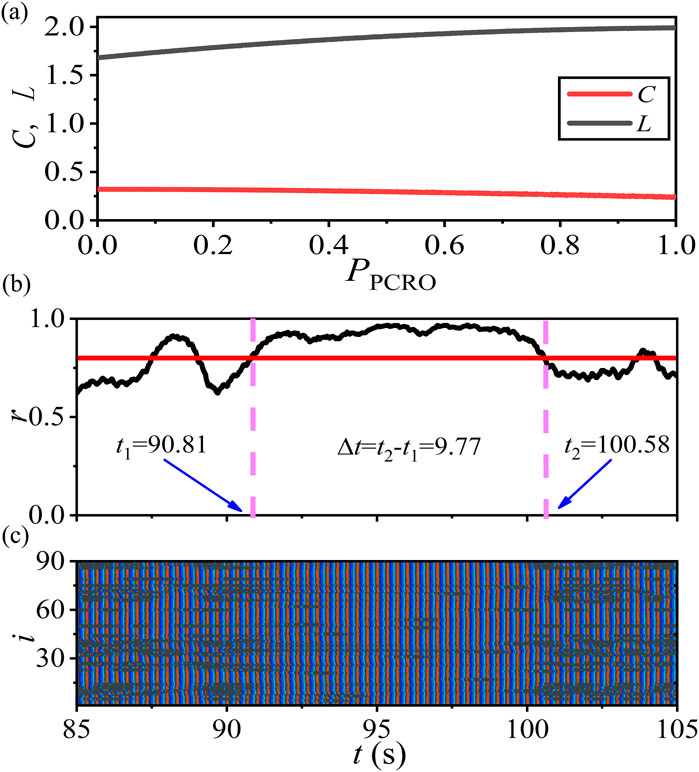
Figure 8. (Color online) Mimicking the epileptic-seizure-related synchronization phenomena in brain systems by the PCRO method proposed in this article. Here, an ERRN consisting of FitzHugh–Nagumo (FHN) neurons with the rotational coupling scheme is utilized to address this issue. The system size
The global Kuramoto order parameter
8 Conclusion
In conclusion, a preferentially cutting–rewiring operation is proposed in the present article to regulate the structure of the given network. It consists of two distinct stages: the cutting procedure and the rewiring procedure with specific preferential constraints. By applying the PCRO on the classical ERRN with specific constraints and a certain PCRO probability, the initially homogeneous structure changes drastically. Three types of isolated nodes are generated: the NINs, the ADINs, and the PDINs, based on which the CLs are formed between the two hubs in the operated network. Furthermore, as the PCRO probability increases, the number of CLs increases significantly, which makes the initially homogeneous ERRN become heterogeneous. This confirms that the PCRO introduced in this article has effects on regulating the network structure.
The statistical properties of the ERRN with a PCRO are theoretically studied using a statistical analysis method. We have analytically derived the statistical expressions of the probability distributions of NINs, ADINs, and PDINs, based on which the probability distribution of CLs is acquired easily. More importantly, the theoretical predictions obtained from these analytical formulas have been confirmed in numerical simulations and coincide with the experimental data very well. Furthermore, these analytical expressions are applied to forecast the average number of CLs in the operated ERRN. The coincidence of the numerical and theoretical results confirms the validity and applicability of the statistical analysis method proposed here. Finally, the universality of the statistical analysis method has also been verified. Our method is general and can be applied to ERRNs with arbitrary preferential constraints and topologies.
Modeling specific physiological processes and physiological functions from the perspective of network physiology is an important and central issue under investigation in the interdisciplinary field of complexity science and biological science. The PCRO method proposed in this article, which consists of the cutting procedure and the rewiring procedure, may give us a clue in understanding the physiological process of the global information integration among the localized functional modules in structural and functional brain networks to implement specific physiological functions. The reasons are as follows. In the PCRO cutting procedure, we discard the links of the nodes satisfying the preferential constraint with a certain PCRO probability condition, and isolated nodes are produced in the original network. As these isolated nodes originally satisfied the given preferential attribute, they can be roughly considered the localized functional modules in anatomical space, which are selected and will be integrated into achieving global information communication across the whole brain system for specific physiological functions. In the PCRO rewiring procedure, we reconnect these isolated nodes to the hubs satisfying the corresponding preferential constraint, which can be roughly regarded as the specialized regulatory centers (i.e., the hub regions) in brain networks to perform global physiological functions among the whole brain system. Furthermore, in a recent contribution (Qian et al., 2024b), the PCRO-induced oscillation mode transition from the originally single-mode oscillations to the newly multi-mode oscillations has been confirmed to emerge among the preferentially operated nodes (i.e., the integrated local modules), which we think is beneficial for understanding the complicated global multimodal physiological functions in integrated structural and functional brain networks. More importantly, the probability distributions of the three different types of isolated nodes formed in the PCRO are derived according to the statistical analysis method proposed in this article, based on which the probability distribution of the preferentially operated common leaves is acquired explicitly. We think the statistical analysis method and the precise theoretical formulas exposed in this article can shed light on a deep comprehension of these amazing physiological phenomena in highly complex and heterogeneous brain networks. We do hope our results will be of great interest to network physiology.
Data availability statement
The raw data supporting the conclusions of this article will be made available by the authors, without undue reservation.
Author contributions
YQ: conceptualization, data curation, formal analysis, funding acquisition, investigation, methodology, project administration, resources, software, supervision, validation, visualization, writing–original draft, and writing–review and editing. JC: formal analysis, investigation, software, and writing–original draft. JH: data curation, formal analysis, investigation, methodology, resources, and writing–review and editing. SZ: resources, software, and writing–review and editing. WC: data curation, formal analysis, and writing–review and editing. ZL: conceptualization, data curation, formal analysis, funding acquisition, investigation, methodology, project administration, resources, software, supervision, validation, visualization, writing–original draft, and writing–review and editing. XC: conceptualization, data curation, formal analysis, funding acquisition, investigation, methodology, project administration, resources, software, supervision, validation, visualization, writing–original draft, and writing–review and editing. ZZ: conceptualization, data curation, formal analysis, funding acquisition, investigation, methodology, project administration, resources, software, supervision, validation, visualization, writing–original draft, and writing–review and editing.
Funding
The author(s) declare financial support was received for the research, authorship, and/or publication of this article. This work is supported by the National Natural Science Foundation of China (Grant Nos. 12375033, 12375031, and 62402010), the Natural Science Basic Research Plan in Shaanxi Province of China (Grant Nos. 2022JZ-03, 2022GD-TSLD-27, and 2024SF-YBXM-134), the Shaanxi Fundamental Science Research Project for Mathematics and Physics (Grant Nos. 22JSY021 and 23JSQ051), the Baoji University of Arts and Sciences Innovative Research Project of Postgraduates (Grant No. YJSCX24YB42), the Youth Innovation Team of Shaanxi Universities, and the Key Science and Technology Innovation Team of Shaanxi Province (Grant No. 2024RSCXTD66).
Conflict of interest
The authors declare that the research was conducted in the absence of any commercial or financial relationships that could be construed as a potential conflict of interest.
Publisher’s note
All claims expressed in this article are solely those of the authors and do not necessarily represent those of their affiliated organizations, or those of the publisher, the editors, and the reviewers. Any product that may be evaluated in this article, or claim that may be made by its manufacturer, is not guaranteed or endorsed by the publisher.
References
Almeira, N., Billoni, O. V., and Perotti, J. I. (2020). Scaling of percolation transitions on Erdös-Rényi networks under centrality-based attacks. Phys. Rev. E 101, 012306. doi:10.1103/PhysRevE.101.012306
Andrzejak, R. G., Ruzzene, G., and Malvestio, I. (2017). Generalized synchronization between chimera states. Chaos 27, 053114. doi:10.1063/1.4983841
Barabási, A.-L., and Albert, R. (1999). Emergence of scaling in random networks. Science 286, 509–512. doi:10.1126/science.286.5439.509
Bizhani, G., Grassberger, P., and Paczuski, M. (2011). Random sequential renormalization and agglomerative percolation in networks: application to Erdös-Rényi and scale-free graphs. Phys. Rev. E 84, 066111. doi:10.1103/PhysRevE.84.066111
Bollobás, B. (1981). Degree sequences of random graphs. Discrete Math. 33, 1–19. doi:10.1016/0012-365x(81)90253-3
Chung, F., and Lu, L. (2001). The diameter of sparse random graphs. Adv. Appl. Math. 26, 257–279. doi:10.1006/aama.2001.0720
Erdös, P., and Rényi, A. (1959). On random graphs i. Publ. Math. Debr. 6, 290–297. doi:10.5486/pmd.1959.6.3-4.12
Erdös, P., and Rényi, A. (1960). On the evolution of random graphs. Publ. Math. Inst. Hung. Acad. Sci. 5, 17.
Ferrari, U., Lucibello, C., Morone, F., Parisi, G., Ricci-Tersenghi, F., and Rizzo, T. (2013). Finite-size corrections to disordered systems on Erdös-Rényi random graphs. Phys. Rev. B 88, 184201. doi:10.1103/physrevb.88.184201
Fretter, C., Lesne, A., Hilgetag, C. C., and Hütt, M. T. (2017). Topological determinants of self-sustained activity in a simple model of excitable dynamics on graphs. Sci. Rep. 7, 42340. doi:10.1038/srep42340
Gerster, M., Berner, R., Sawicki, J., Zakharova, A., S̆koch, A., Hlinka, J., et al. (2020). FitzHugh-Nagumo oscillators on complex networks mimic epileptic-seizure-related synchronization phenomena. Chaos 30, 123130. doi:10.1063/5.0021420
Ghosh, S., Sar, G. K., Majhi, S., and Ghosh, D. (2023). Antiphase synchronization in a population of swarmalators. Phys. Rev. E 108, 034217. doi:10.1103/physreve.108.034217
Gong, B., Yang, L., and Yang, K. (2005). Synchronization on erdös-rényi networks. Phys. Rev. E 72, 037101. doi:10.1103/PhysRevE.72.037101
Goodfellow, M., Andrzejak, R. G., Masoller, C., and Lehnertz, K. (2022). What models and tools can contribute to a better understanding of brain activity? Front. Netw. Physiology 2, 907995. doi:10.3389/fnetp.2022.907995
Hagerstrom, A. M., Murphy, T. E., Roy, R., Hövel, P., Omelchenko, I., and Schöll, E. (2012). Experimental observation of chimeras in coupled-map lattices. Nat. Phys. 8, 658–661. doi:10.1038/nphys2372
Hartmann, A. K., and Mézard, M. (2018). Distribution of diameters for Erdös-Rényi random graphs. Phys. Rev. E 97, 032128. doi:10.1103/PhysRevE.97.032128
Isele, T., and Schöll, E. (2015). Effect of small-world topology on wave propagation on networks of excitable elements. New J. Phys. 17, 023058. doi:10.1088/1367-2630/17/2/023058
Ivanov, P. C. (2021). The new field of network physiology: building the human physiolome. Front. Netw. Physiology 1, 711778. doi:10.3389/fnetp.2021.711778
Kachhara, S., and Ambika, G. (2021). Frequency chimera state induced by differing dynamical timescales. Phys. Rev. E 104, 064214. doi:10.1103/PhysRevE.104.064214
Kartal, N., and Kartal, S. (2023). Complex dynamics of COVID-19 mathematical model on Erdös-Rényi network. Int. J. Biomathematics 5, 2250110. doi:10.1142/s1793524522501108
Katzav, E., Biham, O., and Hartmann, A. K. (2018). Distribution of shortest path lengths in subcritical Erdös-Rényi networks. Phys. Rev. E 98, 012301. doi:10.1103/PhysRevE.98.012301
Lei, Z., Pu, S., Zhang, H., Yao, C., Qian, Y., and Zheng, Z. (2022). Bistability-induced chimeras in one-dimensional paced excitable rings with nonlocal couplings. Europhys. Lett. 139, 62001. doi:10.1209/0295-5075/ac8e92
Lei, Z., Zhang, C., Wang, Y., Wei, Z., Qian, Y., and Zheng, Z. (2023). Chimeralike oscillation modes in excitable scale-free networks. Phys. Rev. Res. 5, 013006. doi:10.1103/physrevresearch.5.013006
Martin, O. C., and S̆ulc, P. (2010). Return probabilities and hitting times of random walks on sparse Erdös-Rényi graphs. Phys. Rev. E 81, 031111. doi:10.1103/physreve.81.031111
Masoumi, R., Oloomi, F., Sajjadi, S., Shirazi, A. H., and Jafari, G. R. (2022). Modified heider balance on erdös-rényi networks. Phys. Rev. E 106, 034309. doi:10.1103/PhysRevE.106.034309
Omelchenko, I., Omel’chenko, O. E., Hövel, P., and Schöll, E. (2013). When nonlocal coupling between oscillators becomes stronger: patched synchrony or multichimera states. Phys. Rev. Lett. 110, 224101. doi:10.1103/PhysRevLett.110.224101
Qian, Y. (2014). Emergence of self-sustained oscillations in excitable Erdös-Rényi random networks. Phys. Rev. E 90, 032807. doi:10.1103/PhysRevE.90.032807
Qian, Y., Chen, Z., Yang, R., Gao, H., Lei, Z., and Zheng, Z. (2024a). Remote response modes on the paced excitable C. elegans network. Phys. Rev. Res. 6, 033014. doi:10.1103/physrevresearch.6.033014
Qian, Y., Cui, X., and Zheng, Z. (2017). Minimum Winfree loop determines self-sustained oscillations in excitable Erdös-Rényi random networks. Sci. Rep. 7, 5746. doi:10.1038/s41598-017-06066-6
Qian, Y., Han, J., Yang, R., Chen, W., Lei, Z., and Zheng, Z. (2024b). Emergence of chimeralike oscillation modes in excitable complex networks with preferentially cutting-rewiring operation. Chaos 34, 063143. doi:10.1063/5.0167251
Qian, Y., Huang, X., Hu, G., and Liao, X. (2010a). Structure and control of self-sustained target waves in excitable small-world networks. Phys. Rev. E 81, 036101. doi:10.1103/PhysRevE.81.036101
Qian, Y., Liao, X., Huang, X., Mi, Y., Zhang, L., and Hu, G. (2010b). Diverse self-sustained oscillatory patterns and their mechanisms in excitable small-world networks. Phys. Rev. E 82, 026107. doi:10.1103/PhysRevE.82.026107
Qian, Y., and Zhang, Z. (2017). Effects of time delay and connection probability on self-sustained oscillations and synchronization transitions in excitable Erdös-Rényi random networks. Commun. Nonlinear Sci. Numer. Simul. 47, 127–138. doi:10.1016/j.cnsns.2016.11.012
Rosenblum, M. (2024). Feedback control of collective dynamics in an oscillator population with time-dependent connectivity. Front. Netw. Physiology 4, 1358146. doi:10.3389/fnetp.2024.1358146
Roxin, A., Riecke, H., and Solla, S. A. (2004). Self-sustained activity in a small-world network of excitable neurons. Phys. Rev. Lett. 92, 198101. doi:10.1103/PhysRevLett.92.198101
Rybalova, E., Strelkova, G., Schöll, E., and Anishchenko, V. (2020). Relay and complete synchronization in heterogeneous multiplex networks of chaotic maps. Chaos 30, 061104. doi:10.1063/5.0008902
Schmeltzer, C., Soriano, J., Sokolov, I. M., and Rüdiger, S. (2014). Percolation of spatially constrained Erdös-Rényi networks with degree correlations. Phys. Rev. E 89, 012116. doi:10.1103/PhysRevE.89.012116
Schöll, E. (2021). Partial synchronization patterns in brain networks. Europhys. Lett. 136, 18001. doi:10.1209/0295-5075/ac3b97
Schöll, E., Sawicki, J., Berner, R., and Ivanov, P. C. (2022). Editorial: adaptive networks in functional modeling of physiological systems. Front. Netw. Physiology 2, 996784. doi:10.3389/fnetp.2022.996784
Semenova, N., Zakharova, A., Anishchenko, V., and Schöll, E. (2016). Coherence-resonance chimeras in a network of excitable elements. Phys. Rev. Lett. 117, 014102. doi:10.1103/PhysRevLett.117.014102
Shi, J., Kirihara, K., Tada, M., Fujioka, M., Usui, K., Koshiyama, D., et al. (2022). Criticality in the healthy brain. Front. Netw. Physiology 1, 755685. doi:10.3389/fnetp.2021.755685
Sinha, N., Joshi, R. B., Sandhu, M. R. S., Netoff, T. I., Zaveri, H. P., and Lehnertz, K. (2022). Perspectives on understanding aberrant brain networks in epilepsy. Front. Netw. Physiology 2, 868092. doi:10.3389/fnetp.2022.868092
Sinha, S., Saramäki, J., and Kaski, K. (2007). Emergence of self-sustained patterns in small-world excitable media. Phys. Rev. E 76, 015101(R). doi:10.1103/PhysRevE.76.015101
Tattini, L., Olmi, S., and Torcini, A. (2012). Coherent periodic activity in excitatory Erdös-Rényi neural networks: the role of network connectivity. Chaos 22, 023133. doi:10.1063/1.4723839
Venkadesh, S., Shaikh, A., Shakeri, H., Barreto, E., and Van Horn, J. D. (2024). Biophysical modulation and robustness of itinerant complexity in neuronal networks. Front. Netw. Physiology 4, 1302499. doi:10.3389/fnetp.2024.1302499
Walter, S., Nunnenkamp, A., and Bruder, C. (2014). Quantum synchronization of a driven self-sustained oscillator. Phys. Rev. Lett. 112, 094102. doi:10.1103/PhysRevLett.112.094102
Watts, D. J., and Strogatz, S. H. (1998). Collective dynamics of ‘small-world’ networks. Nature 393, 440–442. doi:10.1038/30918
Wu, Y., Wang, N., Li, L., and Xiao, J. (2012). Anti-phase synchronization of two coupled mechanical metronomes. Chaos 22, 023146. doi:10.1063/1.4729456
Xu, X., and Liu, F. (2008). Continuous-time quantum walks on Erdös-Rényi networks. Phys. Lett. A 372, 6727–6732. doi:10.1016/j.physleta.2008.09.042
Zhang, H., Chen, Z., Liu, F., Lei, Z., Zheng, Z., and Qian, Y. (2024a). Alternate attractor chimeralike states on rings of chaotic Lorenz-type oscillators. New J. Phys. 26, 023016. doi:10.1088/1367-2630/ad2411
Zhang, X., Boccaletti, S., Guan, S., and Liu, Z. (2015). Explosive synchronization in adaptive and multilayer networks. Phys. Rev. Lett. 114, 038701. doi:10.1103/PhysRevLett.114.038701
Keywords: network physiology, biological science, brain networks, complex systems, network models
Citation: Qian Y, Cao J, Han J, Zhang S, Chen W, Lei Z, Cui X and Zheng Z (2024) A statistical analysis method for probability distributions in Erdös–Rényi random networks with preferential cutting–rewiring operation. Front. Netw. Physiol. 4:1390319. doi: 10.3389/fnetp.2024.1390319
Received: 23 February 2024; Accepted: 27 September 2024;
Published: 17 October 2024.
Edited by:
Eckehard Schöll, Technical University of Berlin, GermanyCopyright © 2024 Qian, Cao, Han, Zhang, Chen, Lei, Cui and Zheng. This is an open-access article distributed under the terms of the Creative Commons Attribution License (CC BY). The use, distribution or reproduction in other forums is permitted, provided the original author(s) and the copyright owner(s) are credited and that the original publication in this journal is cited, in accordance with accepted academic practice. No use, distribution or reproduction is permitted which does not comply with these terms.
*Correspondence: Yu Qian, cWlhbnl1MDI3MkAxNjMuY29t; Zhao Lei, bGVpemhhbzEwMTBAMTYzLmNvbQ==; Xiaohua Cui, eGhjdWlAYm51LmVkdS5jbg==; Zhigang Zheng, emd6aGVuZ0BocXUuZWR1LmNu