 Nuray Vakitbilir1*
 Amanjyot Singh Sainbhi1
 Abrar Islam1
 Alwyn Gomez2,3
 Kevin Yuwa Stein1
 Logan Froese4Tobias Bergmann5Davis McClarty6
 Rahul Raj7
 Frederick Adam Zeiler1,2,4,8
- 1Biomedical Engineering, Price Faculty of Engineering, University of Manitoba, Winnipeg, MB, Canada
- 2Section of Neurosurgery, Department of Surgery, Rady Faculty of Health Sciences, University of Manitoba, Winnipeg, MB, Canada
- 3Department of Human Anatomy and Cell Science, Rady Faculty of Health Sciences, University of Manitoba, Winnipeg, MB, Canada
- 4Department of Clinical Neuroscience, Karolinska Institutet, Stockholm, Sweden
- 5Undergraduate Engineering, Price Faculty of Engineering, University of Manitoba, Winnipeg, MB, Canada
- 6Undergraduate Medicine, Rady Faculty of Health Sciences, University of Manitoba, Winnipeg, MB, Canada
- 7Department of Neurosurgery, University of Helsinki, Helsinki, Finland
- 8Division of Anaesthesia, Department of Medicine, Addenbrooke’s Hospital, University of Cambridge, Cambridge, United Kingdom
Cerebral physiological signals embody complex neural, vascular, and metabolic processes that provide valuable insight into the brain’s dynamic nature. Profound comprehension and analysis of these signals are essential for unraveling cerebral intricacies, enabling precise identification of patterns and anomalies. Therefore, the advancement of computational models in cerebral physiology is pivotal for exploring the links between measurable signals and underlying physiological states. This review provides a detailed explanation of computational models, including their mathematical formulations, and discusses their relevance to the analysis of cerebral physiology dynamics. It emphasizes the importance of linear multivariate statistical models, particularly autoregressive (AR) models and the Kalman filter, in time series modeling and prediction of cerebral processes. The review focuses on the analysis and operational principles of multivariate statistical models such as AR models and the Kalman filter. These models are examined for their ability to capture intricate relationships among cerebral parameters, offering a holistic representation of brain function. The use of multivariate statistical models enables the capturing of complex relationships among cerebral physiological signals. These models provide valuable insights into the dynamic nature of the brain by representing intricate neural, vascular, and metabolic processes. The review highlights the clinical implications of using computational models to understand cerebral physiology, while also acknowledging the inherent limitations, including the need for stationary data, challenges with high dimensionality, computational complexity, and limited forecasting horizons.
1 Introduction
The notably high energy demand of brain cells, compared to most other bodily tissues, necessitates a constant energy supply through oxidative metabolism, and any momentary disruption in oxygen delivery can lead to severe consequences potentially resulting in brain damage or even fatality (Ainslie et al., 2007). Sustaining oxygen availability relies on an intricate and resilient hemodynamic regulation system called cerebral autoregulation, which modulates cerebral blood flow (CBF) in response to variations in systemic supply, such as blood pressure and oxygen saturation, and cerebral demand, particularly energy consumption linked to neuronal activity (Liu et al., 2019; Kostoglou et al., 2014). Dysfunction in cerebral regulatory mechanisms is common in various disease states, making the monitoring of cerebral oxygenation and metabolism an essential aspect of neurocritical care management (Chen et al., 2006). The dynamics of cerebral autoregulation, however, vary significantly across different disease conditions, often impairing the brain’s ability to maintain stable blood flow and oxygenation in response to changes in systemic pressure. This monitoring, in turn, allows for the acquisition of a wide range of cerebral physiologic signals in high temporal resolutions allowing for the implementation of sophisticated analytical techniques (Katsogridakis et al., 2016).
Cerebral physiologic signals encapsulate intricate neural, vascular, and metabolic activities within the brain, offering insight into the dynamic and multifaceted nature of cerebral function (Kuo et al., 1998). Continuous cerebral physiologic signals, such as intracranial pressure (ICP), cerebral autoregulation, and brain tissue oxygenation (PbtO2), are readily available from patients with neural injuries and those critically injured in intensive care units. Thoroughly understanding and analyzing these signals is crucial for comprehending the complexities of cerebral processes, which enables the identification of intricate patterns and the accurate pinpointing of anomalies (Peng et al., 2008; Zeiler et al., 2017). Thus, the development of computational models of cerebral physiology plays a crucial role in exploring the connections between measurable signals and the underlying physiological state.
In this narrative review, we explore the landscape of time series modeling and prediction of continuous cerebral physiology, focusing on the nuanced power of multivariate statistical models. Time series analysis serves as a fundamental tool in uncovering hidden patterns within sequential data. In time series modeling and prediction, multivariate models are used as versatile tools capable of capturing the dynamic relationships and interactions across various cerebral parameters simultaneously (Martins et al., 2020). Unlike univariate models, which may oversimplify the intricacies of cerebral physiology, multivariate models consider the interdependence of signals, providing a holistic representation of the brain’s dynamic state (Peng et al., 2008; Chacon et al., 2011).
Multivariate vector-based autoregressive (AR) models, such as vector autoregressive (VAR) models in the context of cerebral physiology, play a pivotal role in capturing the intricate dynamics of interrelated variables. These models operate by considering multiple time series simultaneously, with each variable representing a specific aspect of cerebral function (Scherrer et al., 2019). Through the estimation of lagged relationships among these variables, VAR models reveal how changes in one component influence others within the system over time. The core principle of vector-based models lies in their ability to represent the dynamic interplay and feedback loops inherent in complex physiological systems (Olson et al., 2020). By incorporating the temporal dependencies among multiple variables, these models provide a more nuanced understanding of the interactions between the cerebral processes (the time-based relationships). The estimation process involves determining coefficients that characterize the strength and direction of the relationships between variables, allowing for the prediction of future states based on past observations (Zivot and Wang, 2006). Additionally, multivariate AR models offer integration into deep learning-based methods, enhancing their capabilities for data prediction and statistical analysis (He et al., 2023).
Other multivariate state-space models, such as Kalman filter, are designed to represent and capture the evolving dynamics of a system over time (Ferreira et al., 2022). Unlike multivariate AR models that focus on relationships among observed variables, state-space models introduce the concept of unobservable states, representing latent processes that influence the observed signals (Aoki, 1990). These models consider that there are underlying hidden factors driving the observed data. The fundamental idea behind state-based models is to estimate these hidden states by combining information from the observed signals and the dynamic evolution of the system (Hamilton, 1994). They operate through a two-fold process: the state equation, describing how the system evolves over time, and the observation equation, detailing how the unobservable states contribute to the observed signals. By iteratively updating the estimates of both states and parameters, state-space models offer a comprehensive framework for modeling the intricate temporal dependencies within cerebral physiologic signals (Aoki, 1990; Hinrichsen and Holmes, 2009). Figure 1 provides a concise overview of the pathway from collected raw data to modeling using multivariate time-series models, illustrating the main steps involved in the process.
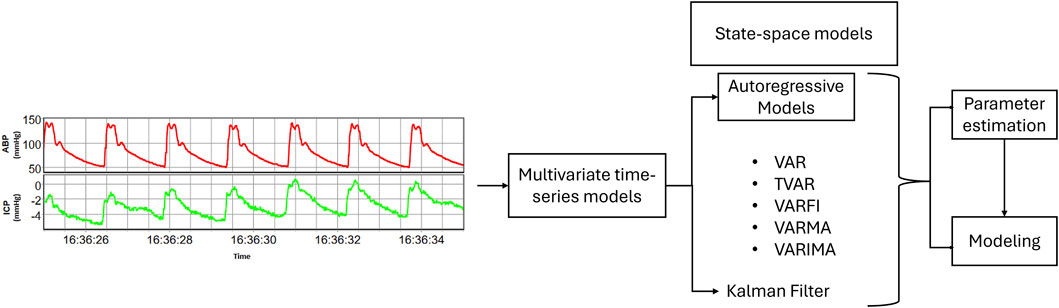
Figure 1. A schematic overview illustrating the pathway from raw data to final modeling.
This review seeks to offer a comprehensive exploration of widely employed multivariate statistical models, namely, multivariate AR models and the Kalman filter, while intentionally excluding machine learning approaches such as Gaussian processes to focus on traditional statistical methodologies. Through a detailed examination of their operational principles and mathematical formulations, this narrative review aims to elucidate the intricacies inherent in these modeling approaches. Additionally, the discussion will extend beyond theoretical foundations to delve into the practical applications and clinical significance of these models. This review aims to provide a nuanced understanding that bridges the gap between theoretical concepts of the multivariate statistical models and their implications with respect to cerebral physiology.
2 Multivariate state-space models
State-space models comprise state variables, observation variables, and a set of equations governing their dynamic interactions (Hamilton, 1994). State-space modeling emphasizes the existence of unobserved or hidden states that influence the observed variables (Holmes et al., 2012). The mathematical formulation involves transition equations that describe the evolution of the system’s state over time, coupled with observation equations establishing the relationship between the state and observed variables (Aoki, 1990). State-space models come in various forms, including linear, nonlinear, discrete-time, and continuous-time models, each tailored to specific applications. The following sub-sections focus on the linear state-space models that are employed in cerebral physiology analysis, which is also summarized in Table 1.
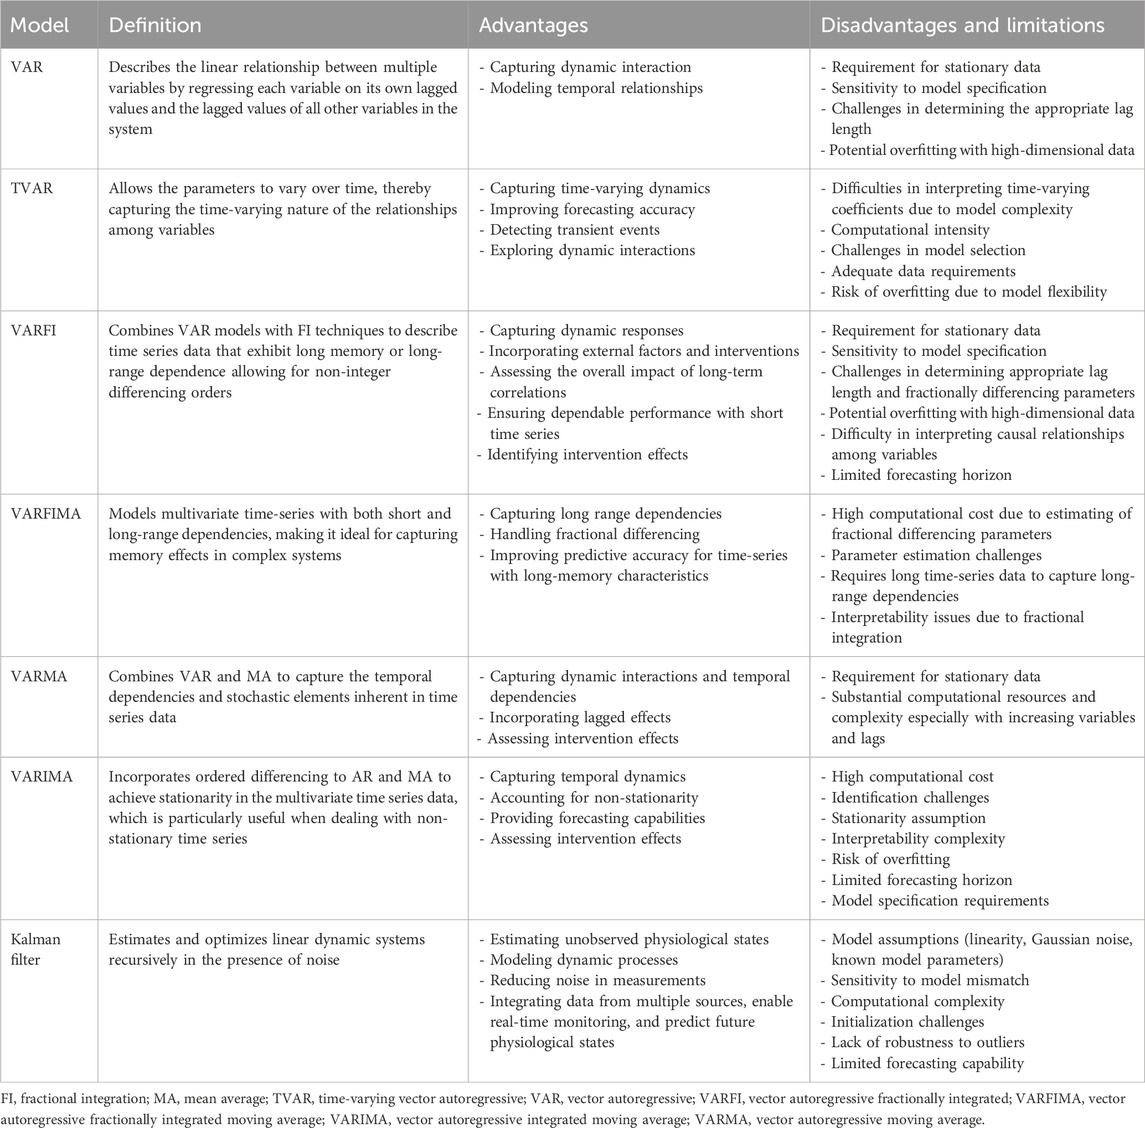
Table 1. The summary of the linear state-space models.
2.1 Vector autoregressive (VAR) models
AR models represent a fundamental class of time series models that play a pivotal role in understanding and predicting sequential data patterns. In essence, these models capture the idea that each observation in a time series is linearly dependent on its own past values. This singular focus on the relationship between a variable and its own lagged values provides a powerful framework for modeling temporal dependencies and capturing the inherent autocorrelation present in time series data (Olson et al., 2020). However, AR models have inherent limitations in capturing interdependencies among multiple variables. Hence, extending beyond the analysis of a single variable involves the utilization of multivariate modeling through models such as VAR, and vector autoregressive moving average (VARMA) models. These models offer a nuanced perspective that enables the exploration of how changes in one component influence others within a system (Scherrer et al., 2019; Zivot and Wang, 2006).
VAR models represent a natural extension of AR models to accommodate multiple parallel time series. The VAR model is particularly valuable when analyzing systems where several variables interact and influence each other over time. In essence, a VAR model consists of a system of dynamic equations, wherein each variable is regressed on its own lagged values and the lagged values of all other variables in the system allowing for the simultaneous consideration of interdependencies among multiple variables and capturing the intricate dynamics within a system (Zivot and Wang, 2006). The formulation for a VAR model of order 'p' (VAR(p)) encapsulates the relationships and dependencies among the variables, providing a versatile tool for projecting time-series variables and understanding the dynamic evolution of multivariate time series data. The order p determines the number of lagged observations included in the model. Mathematically, VAR(p) can be formulated as given in Equation 1, where Yt is an n-dimensional vector of endogenous variables at time t, A terms are
Each Ai matrix captures the contemporaneous relationships among the variables. The estimation of a VAR model involves determining the coefficients in these matrices which allows for the analysis of the dynamic interactions among variables using techniques such as least squares or maximum likelihood estimation (Zivot and Wang, 2006). However, when few data samples are available, VAR models can also be identified using penalized regression techniques, which help address overfitting and improve model stability (Antonacci et al., 2024a). VAR models assume linearity, stationarity, and often normality of residuals, and their effectiveness may vary depending on the characteristics of the data being analyzed (Toda and Phillips, 1994).
VAR models prove invaluable for its ability to capture dynamic interactions, model temporal relationships, and assess causality within multivariate time-series data. As an essential component of multivariate analysis, VAR models contribute to uncovering network interactions, identifying functional connectivity patterns, and enhancing sensitivity to subtle changes in brain activity.
2.2 Time-varying autoregressive (TVAR) model
Time-varying autoregressive (TVAR) model extends the traditional VAR model by allowing the parameters to vary over time, thereby capturing the time-varying nature of the relationships among variables (Haslbeck et al., 2021; Oikonomou et al., 2007). A typical TVAR model can be expressed as shown in Equation 2, where Yt is a p-dimensional vector time-series at time t, βi,t are the coefficient matrices corresponding to each lag i varying over time, εt is a p-dimensional vector of error terms assumed to be normally distributed with mean zero and covariance matrix (Σt), allowing for time-varying volatility (Haslbeck et al., 2021).
Estimating TVAR models involves estimating Σt and βi which captures the dynamic relationships among variables over time (Guo et al., 2022). Each element of βi represents the coefficient of the corresponding lagged variable at time t. These coefficients are allowed to change over time, reflecting fluctuations in the relationships among variables (Guo et al., 2022). There are various methods for estimating TVAR models, including Kalman filtering, rolling window estimation, and Bayesian techniques (Haslbeck et al., 2021; Oikonomou et al., 2007; Omidvarnia et al., 2011). Additionally, least mean square methods and their recursive counterparts provide alternative approaches for estimating TVAR models, particularly in scenarios requiring adaptive filtering or online learning (Antonacci et al., 2024a). TVAR models allow capturing time-varying dynamics, improving forecasting accuracy, detecting transient events, and exploring dynamic interactions, offering valuable insights into the dynamic nature of cerebral function (Haslbeck et al., 2021; Oikonomou et al., 2007).
2.3 Vector autoregressive fractionally integrated (VARFI) model
Vector autoregressive fractionally integrated (VARFI) framework is a time series modeling technique that combines VAR models with fractional integration (FI) techniques. FI is used to describe time series data that exhibit long memory or long-range dependence allowing for non-integer differencing orders, which enables capturing long memory properties in the data, unlike traditional integer-order differencing (Pinto et al., 2021). The VARFI framework combines these two concepts by incorporating fractional integration into the VAR model allowing the model to capture both the linear interdependencies among multiple time series variables and the long memory properties exhibited by the data (Martins et al., 2020; Balboa et al., 2021). The VARFI process is depicted in Equation 3 where L refers to back-shift operator (LiXn = Xn-i), A(L) represents VAR polynomial of order p, Xn is the zero-mean stationary multivariate stochastic process, and εt represents the uncorrelated Gaussian innovations (Martins et al., 2020; Pinto et al., 2021).
VAR model with polynomial order p is then represented by Equation 5, where IM refers to the identity matrix of size M where M represents the number of endogenous variables in the system.
The parameter d = (dR, dS, dH) dictates the long-term characteristics of the process Xi, while the coefficients of A(L) describe its short-term dynamics. By approximating a VARFI(p, d) model with a finite-order VAR(p + q) process, VARFI models prove advantageous for analyzing time series data that commonly exhibit both multivariate dependencies and long memory properties (Pinto et al., 2021).
VARFI models are capable of incorporating external factors and interventions, capturing dynamic responses, assessing the overall impact of long-term correlations, ensuring dependable performance with short time series, and identifying intervention effects (Balboa et al., 2021; Pinto et al., 2022a), thus providing valuable insights into cerebral function under varying conditions.
2.4 Vector autoregressive fractionally integrated moving average (VARFIMA) model
The Vector Fractionally Integrated Autoregressive Moving Average (VARFIMA) model extends the traditional VARMA model by incorporating fractional differencing, allowing for long memory behavior in multivariate time-series data (Ehouman, 2020). This is particularly useful for analyzing processes that exhibit long-range dependencies and slow decay in autocorrelations, such as physiological signals and economic time series. The general form of VARFIMA (p,d,q) model is given in Equation 6, where Yt is a n-dimensional vector of time-series observation at time t, Φ(L) is a
The fractional differencing operator (1-L)d is defined using the binominal expansion given in Equation 7, where
By incorporating fractional differencing, VARFIMA provides a more flexible framework for modeling multivariate time series with long-memory characteristics compared to standard VARMA models.
2.5 Vector autoregressive moving average (VARMA) model
VARMA models represent a sophisticated extension of time series analysis that combines the strengths of both AR and moving average (MA) processes. VARMA models provide a powerful framework for capturing the temporal dependencies and stochastic elements inherent in time series data (Scherrer et al., 2019). Mathematically, VARMA(p, q) model can be expressed as given in Equation 8, where Yt is a vector of endogenous variables at time t, A terms are coefficient matrices capturing the lagged effects, εt is a vector of white noise disturbances, c is a constant term, B terms are coefficient matrices capturing the moving average effects, and εt-i represent the lagged white noise disturbances.
The p parameter represents the order of the AR component, while q represents the order of the MA component. The selection of the appropriate order (p, q) is crucial for the model’s accuracy and is often determined through model selection techniques. The parameters of the VARMA model are estimated using methods such as maximum likelihood estimation. VARMA models are particularly useful for capturing the interdependencies and dynamic interactions among multiple time series variables.
VARMA models extend the capabilities of VAR models by incorporating AR and MA components for exploration of temporal dependencies and stochastic processes within cerebral physiologic data. VARMA models are, similar to VAR models, capable of capturing dynamic interactions among multiple brain regions, but they can additionally incorporate the impact of past disturbances on the current state of the system (Nadalizadeh et al., 2023). This integration allows for a more comprehensive examination of the temporal dynamics of brain signals, considering both the inherent autocorrelation and the influence of random disturbances.
2.6 Vector autoregressive integrated moving average (VARIMA) model
VARIMA models are an extension of the univariate autoregressive integrated moving average (ARIMA) models to handle multiple time series variables simultaneously (Rusyana et al., 2020). In a VARIMA model, each variable in the system is treated as a linear function of its own past values, the past values of all other variables in the system, and possibly the past values of some white noise error terms. VARIMA models incorporate differencing to achieve stationarity in the time series data, which is particularly useful when dealing with non-stationary time series (Rusyana et al., 2020; Anderson, 1977). The general form of a VARIMA(p, d, q) model is expressed as given in Equation 9, where Yt is a vector of endogenous variables at time t, εt is a vector of white noise disturbances, c is a constant term, L is a lag operator, Φi are the autoregressive parameters, Θi are the moving average parameters, d is the order of differencing (Olson et al., 2020). The notations p, d and q, similar to that in an ARIMA model, refer to the order of the AR component, the order of differencing needed to make the series stationary, and the order of MA component, respectively (Anderson, 1977).
VARIMA models are particularly useful for time series data with trends, as the integrated component helps in detrending the series (Rusyana et al., 2020). Similar to other vector AR models, the estimation and forecasting procedures for VARIMA models involve techniques like maximum likelihood estimation and can be more complex than those for univariate ARIMA models.
VARIMA models consider both AR and MA effects, as well as trends in the data providing a comprehensive approach to modeling and understanding the temporal dynamics of cerebral physiologic data. Through techniques like granger causality and impulse response function analyses, multivariate AR models enable the investigation of directional influences, shedding light on the causal relationships between different brain areas (Manomaisaowapak et al., 2022; Barnett and Seth, 2015).
2.7 Kalman filter
The Kalman filter is an algorithm used for recursive estimation and optimization of linear dynamic systems in the presence of noise (Maybeck et al., 1990). The filter operates by combining predictions from a mathematical model of the system with real-world measurements to produce accurate and reliable estimates of the system’s state (Welch, 1997; Barton et al., 2009). The Kalman filter tries to estimate the state x in a discrete-time controlled process using the linear stochastic difference equation given in Equation 10 where xt is the state at time-step t, A is the state transition matrix, B is the control input matrix, ut is the control input, and wt is the process noise (Welch, 1997).
The measurement equation that is used to relate the observed measurements to the underlying state of the system is represented as given in Equation 11, where zt is the measurement at time t, H is the measurement matrix, and vt is the measurement noise. The measurement equation defines how the true state influences the measurements that are obtained from the real-world system (Kim et al., 2019). The measurement equation plays a crucial role in the update step of the Kalman filter, where it helps refine the estimate of the system’s state based on the comparison between the predicted measurements and the actual measurements.
Two stages make up the Kalman filter algorithm, namely, prediction and update. In the prediction step, the Kalman filter predicts the current state, Equation 12 where
In the update step, the Kalman gain (denoted as Kt), estimated using Equation 14 where R represents the measurement noise covariance, is applied to update the state as per Equation 15. The covariance is also updated using Equation 16, where Pt signifies the updated covariance, and I is the identity matrix. This update is performed based on a comparison between the predicted values and the actual measurement.
The Kalman filter continuously iterates through the prediction and update steps as new measurements become available, providing an optimal estimate of the system’s state even in the presence of noise (Welch, 1997).
The Kalman filter can accurately estimate unobserved physiological states, model dynamic processes, reduce noise in measurements, integrate data from multiple sources, enable real-time monitoring, and predict future physiological states (Nadalizadeh et al., 2023; Rajabioun et al., 2017; Sun et al., 2008; Azzalini et al., 2023), proving its importance in cerebral physiologic signal analysis.
3 Clinical relevance
In the realm of cerebral signal analysis, multivariate time-series analysis is crucial for simultaneously examining the spatial and temporal dynamics of cerebral physiological signals to study how different brain regions interact over time, consequently, capturing the complexity of neural processes that cannot be fully understood with univariate approaches (Kostoglou et al., 2014). Multivariate analysis allows assessment of the correlations and functional connectivity patterns between signals, helping to uncover network interactions and the coordination of brain activity (Salvador et al., 2020). Multivariate analysis is also more sensitive to subtle changes in brain function which is crucial for detecting early signs of neurological disorders, monitoring treatment effects, or understanding the impact of interventions on brain function (Brier et al., 2022; Gessell et al., 2021).
Vector-based models, with their multivariate nature, have the ability to capture dynamic interactions, model temporal relationships, assess causality, and provide valuable insights into the complex dynamics of brain activity over time (Ferreira et al., 2022; Aoki, 1990; Triantafyllopoulos and Triantafyllopoulos, 2021). Multivariate time series models play a crucial role in life sciences, providing powerful tools to analyze complex dynamics across animal and human populations, offering enhanced classification performance compared to simpler methods, such as univariate time series models, enabling researchers to discern subtle patterns in physiological signals such as EEG signals (Oikonomou et al., 2007; Omidvarnia et al., 2011; Nadalizadeh et al., 2023; Anderson, 1977; Rajabioun et al., 2017; Samdin et al., 2013; Pascucci et al., 2020; Hart et al., 2021; Jajcay and Hlinka, 2023; Kamiński et al., 1997; Lie and van Mierlo, 2017). They excel in capturing shared dynamics among individuals and populations, shedding light on similarities in physiological processes within and across groups.
Moreover, multivariate models facilitate the automatic assessment of critical physiological parameters, allowing for a deeper understanding of regulatory mechanisms such as cerebral autoregulation (Pinto et al., 2022b; Schäck et al., 2018; Jachan et al., 2009). Additionally, multivariate AR models serve as valuable tools for mitigating data overload by reducing data resolution, aiding in the integration of high-resolution cerebral data into predictive models, such as neural networks (Thelin et al., 2020), and enhancing utility in clinical decision-making processes. By uncovering intricate neural dynamics underlying cognitive processes and serving as tools for data resolution reduction, these models provide valuable insights into brain function, functional connectivity patterns, and the integration of high-resolution cerebral signal monitoring data into trajectory models.
Furthermore, multivariate modeling techniques enhance the analysis of EEG recordings by improving signal quality and reducing noise, leading to more accurate interpretations of brain activity and functions (Oikonomou et al., 2007). They also enable the detection of rapid changes in connectivity patterns, providing valuable information about brain network dynamics and the functions that emerge from these networks (Omidvarnia et al., 2011). Additionally, these models offer insights into cerebrovascular dynamics and the relationship between physiological variables such as ICP, mean arterial pressure, and brain oxygenation, contributing to our understanding of conditions like traumatic brain injury and their effects on brain function (Thelin et al., 2020; Zeiler et al., 2020; Zeiler et al., 2021; Valdés-Sosa et al., 2005; Antonacci et al., 2020; Antonacci et al., 2021a).
Moreover, penalized regression techniques for identifying VAR models have shown particular promise in brain-computer interface applications, where such methods are used to enhance model robustness and performance with limited data samples (Antonacci et al., 2024a). These applications should be highlighted in the context of clinical relevance, emphasizing their potential to translate complex cerebral signal analysis into actionable insights for neurological and clinical applications.
Additionally, it is worth noting that VARFIMA, currently, has not been widely applied in cerebral physiology modelling research, despite its potential advantages. Given its ability to capture both short and long-range dependencies in multivariate time-series data, VARFIMA could offer a more nuanced representation of cerebral physiologic signals, particularly in scenarios where fractional differencing can better model effects in autoregulatory indices such as pressure reactivity index (PRx). Integrating VARFIMA into cerebral physiology studies could enhance trend analysis and predictive modeling, offering a valuable framework for understanding complex neural interactions over varying temporal resolutions.
In summary, multivariate time series models are indispensable tools for studying complex physiological phenomena, offering valuable insights into brain function, cerebral dynamics, and neurological disorders across diverse populations. Table 2 presents the studies utilizing linear multivariate state-space models for analyzing various cerebral physiological signals. Majority of the studies focused on EEG signal analysis (Oikonomou et al., 2007; Omidvarnia et al., 2011; Nadalizadeh et al., 2023; Anderson, 1977; Rajabioun et al., 2017; Samdin et al., 2013; Pascucci et al., 2020; Hart et al., 2021; Jajcay and Hlinka, 2023; Kamiński et al., 1997; Lie and van Mierlo, 2017; Antonacci et al., 2023; Pagnotta and Plomp, 2018; Astolfi et al., 2008; Antonacci et al., 2024b; Antonacci et al., 2021b; Endemann et al., 2022; Milde et al., 2010), with a few focused on other cerebral physiology such as ICP (Pinto et al., 2022b; Schäck et al., 2018; Jachan et al., 2009; Thelin et al., 2020; Zeiler et al., 2020; Zeiler et al., 2021; Swiercz et al., 1998; Swiercz et al., 2000; Gomez et al., 2023a; Gomez et al., 2023b) for tasks ranging from assessment of physiological dynamics (Oikonomou et al., 2007; Jajcay and Hlinka, 2023; Kamiński et al., 1997), connectivity analysis (Omidvarnia et al., 2011; Rajabioun et al., 2017; Pascucci et al., 2020; Lie and van Mierlo, 2017), transfer entropy estimation (Pinto et al., 2022b), classification or prediction and pattern recognition (Nadalizadeh et al., 2023; Samdin et al., 2013; Zeiler et al., 2020; Zeiler et al., 2021; Swiercz et al., 1998; Swiercz et al., 2000; Anderson et al., 1998). Majority of these studies have utilized VAR model (Nadalizadeh et al., 2023; Anderson, 1977; Hart et al., 2021; Jajcay and Hlinka, 2023; Kamiński et al., 1997; Lie and van Mierlo, 2017; Jachan et al., 2009; Pagnotta and Plomp, 2018; Antonacci et al., 2024b; Antonacci et al., 2021b; Gomez et al., 2023a; Gomez et al., 2023b). Kalman filter was the second most utilized multivariate model (Oikonomou et al., 2007; Omidvarnia et al., 2011; Nadalizadeh et al., 2023; Rajabioun et al., 2017; Pascucci et al., 2020; Lie and van Mierlo, 2017; Schäck et al., 2018; Pagnotta and Plomp, 2018).
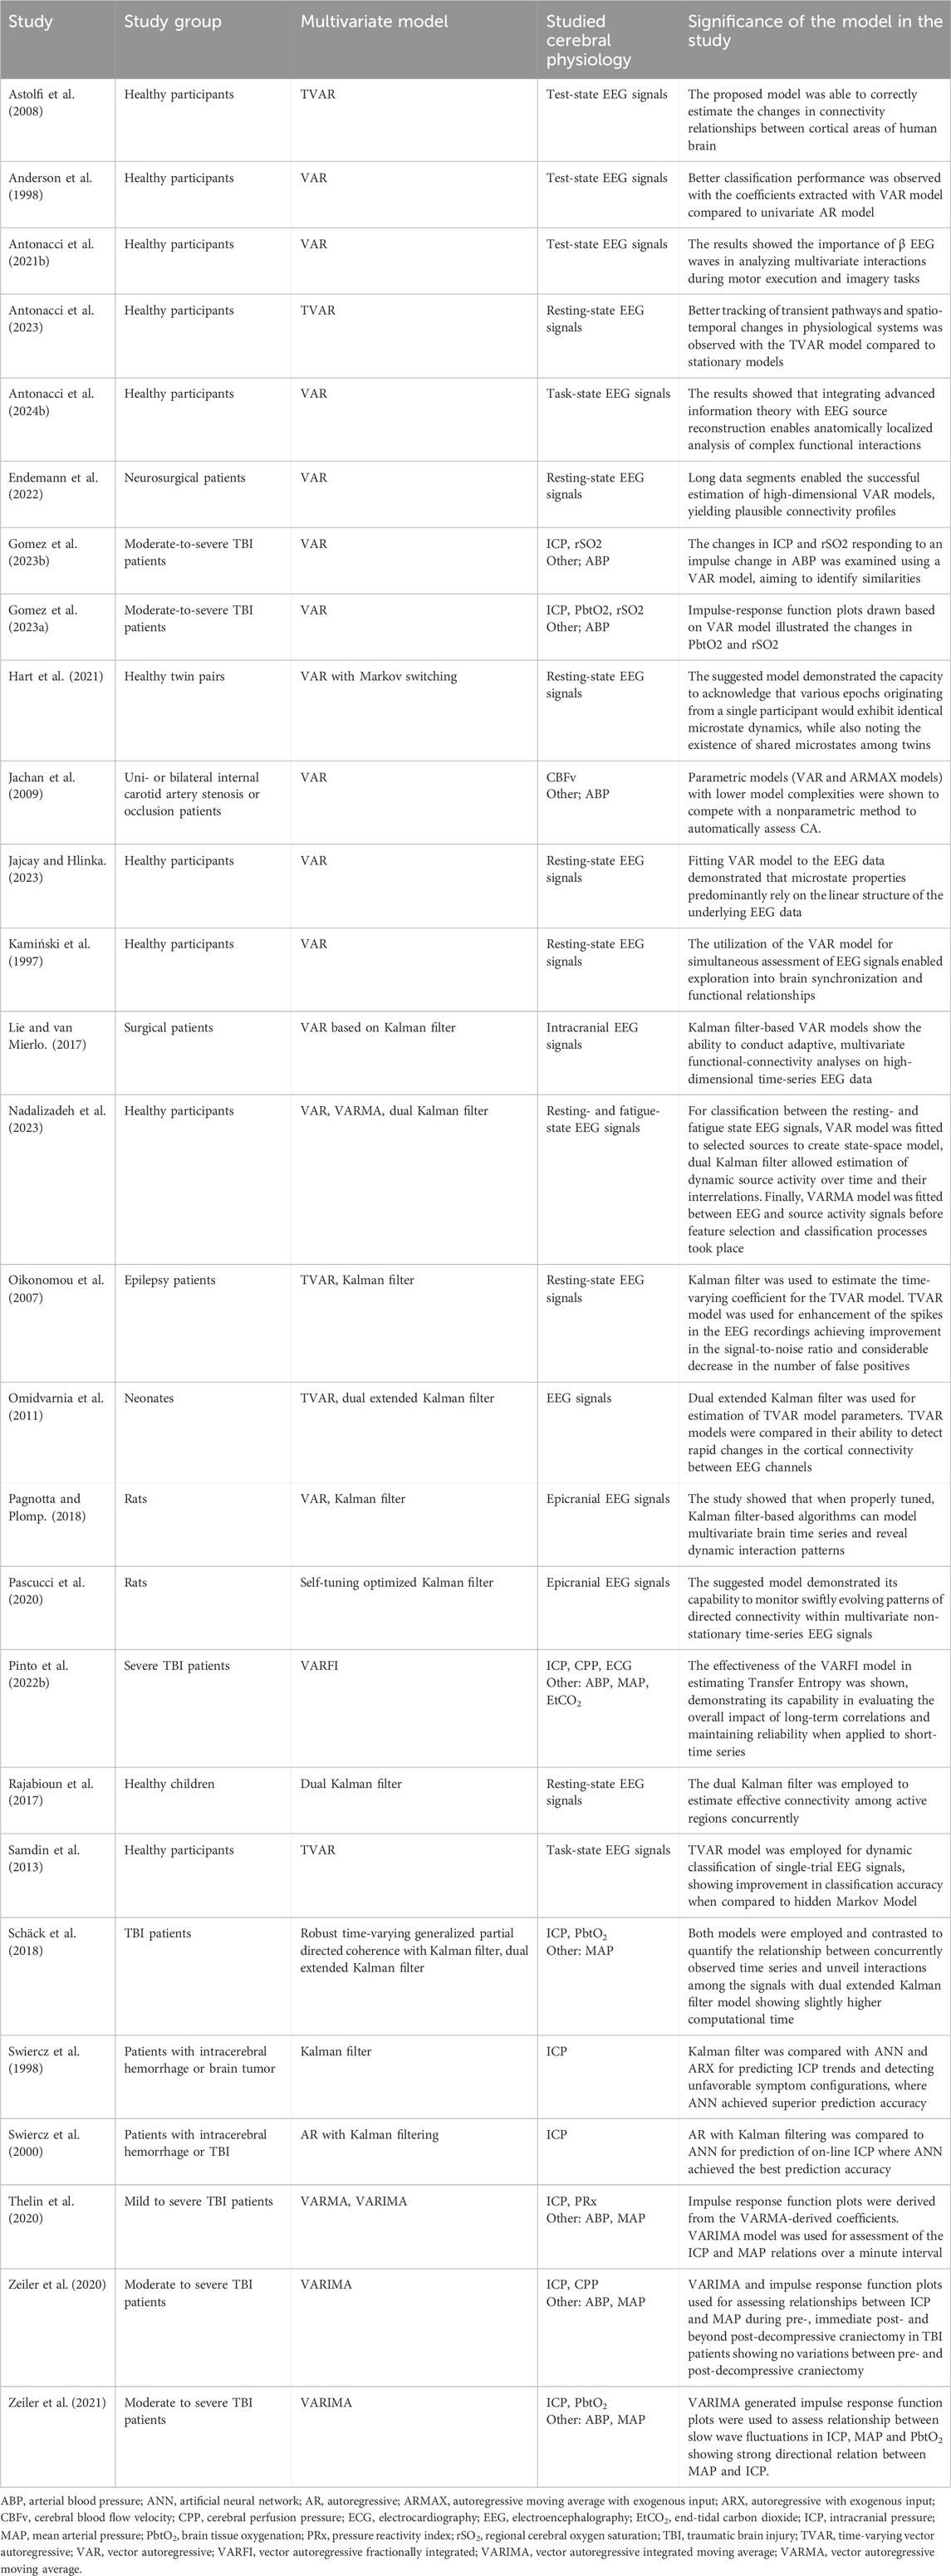
Table 2. The studies employing linear multivariate state-space models for various cerebral physiologic signal analysis.
4 Limitations of linear multivariate state-space models
While linear multivariate state-space models offer valuable insights and tools for analyzing complex systems, they also come with several inherent limitations effecting model selection, applicability, and interpretation various contexts. Many of these models assume linearity and stationarity of underlying processes, which may not hold true for many real-world systems exhibiting nonlinear and non-stationary behavior (Loaiza-Maya and Nibbering, 2023). Parameter estimation in multivariate state-space models can be challenging, particularly for high-dimensional data or complex systems, leading to potential biases in model predictions (Hinrichsen and Holmes, 2009). Sensitivity to initial conditions and limited flexibility in capturing complex interactions further constrain the utility of these models (Triantafyllopoulos and Triantafyllopoulos, 2021). Moreover, the computational complexity of analyzing and fitting multivariate state-space models, coupled with the risk of model overfitting and challenges in interpretability, poses significant hurdles in their application (Gessell et al., 2021; Triantafyllopoulos and Triantafyllopoulos, 2021). However specific models retain their own limitations and disadvantages.
The main limitation shared among the autoregressive models is the requirement for stationary data, which affects VAR, VARFI, VARFIMA, VARMA, and VARIMA models (Hinrichsen and Holmes, 2009; Triantafyllopoulos and Triantafyllopoulos, 2021). This assumption may not hold true in real-world datasets, potentially biasing parameter estimates and leading to unreliable forecasts. However, this limitation could be addressed through techniques such as differencing or, in some cases, incorporating fractional integration, i.e., VARFI and VARFIMA, with careful consideration during model specification and estimation. Additionally, all autoregressive models face challenges in dealing with high dimensionality, posing difficulties in accurate parameter estimation, and increasing the risk of overfitting (Triantafyllopoulos and Triantafyllopoulos, 2021), particularly in cerebral physiologic datasets, which often exhibit high dimensionality with numerous variables recorded simultaneously. Computational complexity is another common limitation, especially with increasing variables and lags, demanding substantial computational resources. Model interpretation complexity arises due to the intricate relationships among variables, requiring additional statistical techniques or domain knowledge (Olson et al., 2020).
Furthermore, all models have a limited forecasting horizon, typically suited for short-to medium-term predictions, and extrapolating beyond observed data may lead to unreliable forecasts, particularly if underlying relationships change over time (Olson et al., 2020; Triantafyllopoulos and Triantafyllopoulos, 2021). Additionally, careful model specification is crucial across all models to avoid bias in parameter estimates and inaccurate forecasts (Gessell et al., 2021). The limitations of the Kalman filter include its reliance on specific model assumptions such as linearity and Gaussian noise, which if violated, can lead to biased estimates (Maybeck et al., 1990). Moreover, its sensitivity to model mismatch, computational complexity, and the challenge of accurate initialization can hinder its performance, especially in complex systems (Kim et al., 2019; Sun et al., 2008). Tuning parameters and the assumption of complete observability further contribute to its limitations, along with its susceptibility to outliers and limited forecasting capability (Maybeck et al., 1990).
Additionally, cerebral physiologic data present unique challenges for multivariate state space modeling due to several factors. Apart from high dimensionality of the data, constructing appropriate multivariate state space models for cerebral physiologic data requires making assumptions about underlying physiological processes and interactions, which may not always hold true, leading to model misspecification and potential biases. Parameter estimation in such models is also challenging, especially with nonlinearities or non-Gaussian distributions in the cerebral physiologic data. Moreover, the complexity of multivariate state space models can hinder their interpretability, making it difficult to relate estimated parameters to underlying physiological mechanisms. Validation of these models is further complicated by the limited availability of ground truth measurements, risking overfitting and poor generalization performance. Finally, handling missing data and noise in cerebral physiologic datasets is crucial for accurate inference, as is addressing inter-subject variability stemming from factors like age, gender, and pathology.
5 Conclusion
This narrative review aimed to explore the significance of multivariate time-series analysis in understanding cerebral physiology. These analyses offer insights into the spatial and temporal dynamics of cerebral signals, aiding in the study of brain interactions, functional connectivity patterns, and detection of early signs of neurological disorders. Multivariate models, such as VAR models and state-space models, capture dynamic interactions, temporal relationships, and hidden states within cerebral signals, facilitating the development of trajectory models and clinical decision-making processes. Moreover, these models enable the integration of high-resolution cerebral data, reduce data overload, enhance signal quality, and provide valuable information about brain network dynamics and cerebrovascular dynamics. Additionally, they offer integrability into deep learning models, further enhancing their capabilities for analyzing cerebral physiology. By focusing on traditional statistical methodologies, such as multivariate AR models and the Kalman filter, this review aimed to bridge the gap between theoretical concepts and practical applications, offering a comprehensive understanding of their implications in cerebral physiology.
Author contributions
NV: Conceptualization, Investigation, Methodology, Writing - original draft, Writing - review and editing. AS: Writing - review and editing. AI: Writing - review and editing. AG: Writing - review and editing. KS: Writing - review and editing. LF: Writing - review and editing. TB: Writing - review and editing. DM: Writing - review and editing. RR: Writing - review and editing. FZ: Conceptualization, Funding acquisition, Supervision, Writing - review and editing.
Funding
The author(s) declare that financial support was received for the research and/or publication of this article. This work was directly supported through the Endowed Manitoba Public Insurance (MPI) Chair in Neuroscience and the Natural Sciences and Engineering Research Council of Canada (NSERC; ALLRP-576386–22 and ALLRP 586244–23).
Acknowledgments
FAZ is supported through the Endowed Manitoba Public Insurance (MPI) Chair in Neuroscience/TBI Research Endowment, NSERC (DGECR-2022–00260, RGPIN-2022–03621, ALLRP-578524–22, ALLRP-576386–22, I2IPJ 586104–23, and ALLRP 586244–23), Canadian Institutes of Health Research (CIHR), the MPI Neuroscience Research Operating Fund, the Health Sciences Centre Foundation Winnipeg, the Canada Foundation for Innovation (CFI) (Project #: 38583), Research Manitoba (Grant #: 3906 and 5429) and the University of Manitoba VPRI Research Investment Fund (RIF). NV is supported by NSERC (RGPIN-2022–03621, ALLRP-576386–22, ALLRP 586244–23). ASS is supported through the University of Manitoba Graduate Fellowship (UMGF) – Biomedical Engineering, NSERC (RGPIN-2022–03621), and the Graduate Enhancement of Tri-Council Stipends (GETS) – University of Manitoba. AI is supported by a University of Manitoba Dept of Surgery GFT Grant, the University of Manitoba International Graduate Student Entrance Scholarship (IGSES), and the University of Manitoba Graduate Fellowship (UMGF) in Biomedical Engineering. AG is supported through a CIHR Fellowship (Grant #: 472286). KYS is supported through the NSERC CGS-D program (CGS D-579021–2023), University of Manitoba R.G. and E.M. Graduate Fellowship (Doctoral) in Biomedical Engineering, and the University of Manitoba MD/PhD program. LF is supported through a Research Manitoba PhD Fellowship, the Brain Canada Thomkins Travel Scholarship, NSERC (ALLRP-578524–22, ALLRP-576386–22) and the Graduate Enhancement of Tri-Council Stipends (GETS) – University of Manitoba. TB is supported through the NSERC CGS-M program. RR is supported through state-funding (Helsinki University Hospital), the Swedish Cultural Foundation in Finland, Finska Läkaresällskapet and Medicinska Understödsföreningen Liv och Häls.
Conflict of interest
The authors declare that the research was conducted in the absence of any commercial or financial relationships that could be construed as a potential conflict of interest.
Generative AI statement
The authors declare that no Generative AI was used in the creation of this manuscript.
Publisher’s note
All claims expressed in this article are solely those of the authors and do not necessarily represent those of their affiliated organizations, or those of the publisher, the editors and the reviewers. Any product that may be evaluated in this article, or claim that may be made by its manufacturer, is not guaranteed or endorsed by the publisher.
References
Ainslie, P. N., Barach, A., Murrell, C., Hamlin, M., Hellemans, J., and Ogoh, S. (2007). Alterations in cerebral autoregulation and cerebral blood flow velocity during acute hypoxia: rest and exercise. Am. J. Physiology-Heart Circulatory Physiology 292, H976–H983. doi:10.1152/ajpheart.00639.2006
Anderson, C. W., Stolz, E. A., and Shamsunder, S. (1998). Multivariate autoregressive models for classification of spontaneous electroencephalographic signals during mental tasks. IEEE Trans. Biomed. Eng. 45, 277–286. doi:10.1109/10.661153
Anderson, O. D. (1977). The interpretation of box-jenkins time series models. J. R. Stat. Soc. Ser. D Statistician 26, 127–145. doi:10.2307/2987959
Antonacci, Y., Astolfi, L., Nollo, G., and Faes, L. (2020). Information transfer in linear multivariate processes assessed through penalized regression techniques: validation and application to physiological networks. Entropy 22, 732. doi:10.3390/e22070732
Antonacci, Y., Barà, C., Sparacino, L., Pirovano, I., Mastropietro, A., Rizzo, G., et al. (2024b). Spectral information dynamics of cortical signals uncover the hierarchical organization of the human brain’s motor network. IEEE Trans. Biomed. Eng., 1–10. doi:10.1109/TBME.2024.3516943
Antonacci, Y., Barà, C., Zaccaro, A., Ferri, F., Pernice, R., and Faes, L. (2023). Time-varying information measures: an adaptive estimation of information storage with application to brain-heart interactions. Front. Netw. Physiol. 3, 1242505. doi:10.3389/fnetp.2023.1242505
Antonacci, Y., Minati, L., Faes, L., Pernice, R., Nollo, G., Toppi, J., et al. (2021a). Estimation of granger causality through artificial neural networks: applications to physiological systems and chaotic electronic oscillators. PeerJ Comput. Sci. 7, e429. doi:10.7717/peerj-cs.429
Antonacci, Y., Minati, L., Nuzzi, D., Mijatovic, G., Pernice, R., Marinazzo, D., et al. (2021b). Measuring high-order interactions in rhythmic processes through multivariate spectral information decomposition. IEEE Access 9, 149486–149505. doi:10.1109/ACCESS.2021.3124601
Antonacci, Y., Toppi, J., Pietrabissa, A., Anzolin, A., and Astolfi, L. (2024a). Measuring connectivity in linear multivariate processes with penalized regression techniques. IEEE Access 12, 30638–30652. doi:10.1109/ACCESS.2024.3368637
Astolfi, L., Cincotti, F., Mattia, D., De Vico Fallani, F., Tocci, A., Colosimo, A., et al. (2008). Tracking the time-varying cortical connectivity patterns by adaptive multivariate estimators. IEEE Trans. Biomed. Eng. 55, 902–913. doi:10.1109/TBME.2007.905419
Azzalini, L. J., Crompton, D., D’Eleuterio, G. M. T., Skinner, F., and Lankarany, M. (2023). Adaptive unscented kalman filter for neuronal state and parameter estimation. J. Comput. Neurosci. 51, 223–237. doi:10.1007/s10827-023-00845-z
Balboa, M., Rodrigues, P. M. M., Rubia, A., and Taylor, A. M. R. (2021). Multivariate fractional integration tests allowing for conditional heteroskedasticity with an application to return volatility and trading volume. J Appl. Econ. 36, 544–565. doi:10.1002/jae.2829
Barnett, L., and Seth, A. K. (2015). Granger causality for state space models. Phys. Rev. E 91, 040101. doi:10.1103/PhysRevE.91.040101
Barton, M. J., Robinson, P. A., Kumar, S., Galka, A., Durrant-Whyte, H. F., Guivant, J., et al. (2009). Evaluating the performance of kalman-filter-based EEG source localization. IEEE Trans. Biomed. Eng. 56, 122–136. doi:10.1109/TBME.2008.2006022
Brier, L. M., Zhang, X., Bice, A. R., Gaines, S. H., Landsness, E. C., Lee, J.-M., et al. (2022). A multivariate functional connectivity approach to mapping brain networks and imputing neural activity in mice. Cereb. Cortex 32, 1593–1607. doi:10.1093/cercor/bhab282
Chacon, M., Araya, C., and Panerai, R. B. (2011). Non-linear multivariate modeling of cerebral hemodynamics with autoregressive support vector machines. Med. Eng. and Phys. 33, 180–187. doi:10.1016/j.medengphy.2010.09.023
Chen, Z., Hu, K., Stanley, H. E., Novak, V., and Ivanov, P.Ch. (2006). Cross-correlation of instantaneous phase increments in pressure-flow fluctuations: applications to cerebral autoregulation. Phys. Rev. E 73, 031915. doi:10.1103/PhysRevE.73.031915
Ehouman, Y. A. (2020). Volatility transmission between oil prices and banks’ stock prices as a new source of instability: lessons from the United States experience. Econ. Model. 91, 198–217. doi:10.1016/j.econmod.2020.06.009
Endemann, C. M., Krause, B. M., Nourski, K. V., Banks, M. I., and Veen, B. V. (2022). Multivariate autoregressive model estimation for high-dimensional intracranial electrophysiological data. NeuroImage 254, 119057. doi:10.1016/j.neuroimage.2022.119057
Ferreira, G., Mateu, J., and Porcu, E. (2022). Multivariate kalman filtering for spatio-temporal processes. Stoch. Environ. Res. Risk Assess. 36, 4337–4354. doi:10.1007/s00477-022-02266-3
Gessell, B., Geib, B., and De Brigard, F. (2021). Multivariate pattern analysis and the search for neural representations. Synthese 199, 12869–12889. doi:10.1007/s11229-021-03358-3
Gomez, A., Griesdale, D., Froese, L., Yang, E., Thelin, E. P., Raj, R., et al. (2023a). Temporal statistical relationship between regional cerebral oxygen saturation (rSO2) and brain tissue oxygen tension (PbtO2) in moderate-to-severe traumatic brain injury: a Canadian high resolution-TBI (CAHR-TBI) cohort study. Bioengineering 10, 1124. doi:10.3390/bioengineering10101124
Gomez, A., Sainbhi, A. S., Stein, K. Y., Vakitbilir, N., Froese, L., and Zeiler, F. A. (2023b). Statistical properties of cerebral near infrared and intracranial pressure-based cerebrovascular reactivity metrics in moderate and severe neural injury: a machine learning and time-series analysis. ICMx 11, 57. doi:10.1186/s40635-023-00541-3
Guo, T., Song, S., and Yan, Y. (2022). A time-varying autoregressive model for groundwater depth prediction. J. Hydrology 613, 128394. doi:10.1016/j.jhydrol.2022.128394
Hamilton, J. D. (1994). “Chapter 50 state-space models,” in Handbook of econometrics (Elsevier), 4, 3039–3080. doi:10.1016/s1573-4412(05)80019-4
Hart, B., Malone, S., and Fiecas, M. (2021). A grouped beta process model for multivariate resting-state EEG microstate analysis on twins. Can. J. Statistics 49, 89–106. doi:10.1002/cjs.11589
Haslbeck, J. M. B., Bringmann, L. F., and Waldorp, L. J. (2021). A tutorial on estimating time-varying vector autoregressive models. Multivar. Behav. Res. 56, 120–149. doi:10.1080/00273171.2020.1743630
He, M., Das, P., Hotan, G., and Purdon, P. L. (2023). Switching state-space modeling of neural signal dynamics. PLOS Comput. Biol. 19, e1011395. doi:10.1371/journal.pcbi.1011395
Hinrichsen, R. A., and Holmes, E. E. (2009). Using multivariate state-space models to study spatial structure and dynamics.
Holmes, E. E., Ward, E., Wills, J., and Marss, K. (2012). MARSS: multivariate autoregressive state-space models for analyzing time-series data. R J. 4, 11. doi:10.32614/RJ-2012-002
Jachan, M., Reinhard, M., Spindeler, L., Hetzel, A., Schelter, B., and Timmer, J. (2009). Parametric versus nonparametric transfer function estimation of cerebral autoregulation from spontaneous blood-pressure oscillations. Cardiovasc Eng. 9, 72–82. doi:10.1007/s10558-009-9072-5
Jajcay, N., and Hlinka, J. (2023). Towards a dynamical understanding of microstate analysis of M/EEG data. NeuroImage 281, 120371. doi:10.1016/j.neuroimage.2023.120371
Kamiński, M., Blinowska, K., and Szelenberger, W. (1997). Topographic analysis of coherence and propagation of EEG activity during sleep and wakefulness. Electroencephalogr. Clin. Neurophysiology 102, 216–227. doi:10.1016/S0013-4694(96)95721-5
Katsogridakis, E., Simpson, D. M., Bush, G., Fan, L., Birch, A. A., Allen, R., et al. (2016). Revisiting the frequency domain: the multiple and partial coherence of cerebral blood flow velocity in the assessment of dynamic cerebral autoregulation. Physiol. Meas. 37, 1056–1073. doi:10.1088/0967-3334/37/7/1056
Kim, Y., and Bang, H. (2019). “Introduction to kalman filter and its applications,” in Introduction and implementations of the kalman filter. Editor F. Govaers (London, United Kingdom: IntechOpen). doi:10.5772/intechopen.75731
Kostoglou, K., Debert, C. T., Poulin, M. J., and Mitsis, G. D. (2014). Nonstationary multivariate modeling of cerebral autoregulation during hypercapnia. Med. Eng. and Phys. 36, 592–600. doi:10.1016/j.medengphy.2013.10.011
Kuo, T.B.-J., Chern, C.-M., Sheng, W.-Y., Wong, W.-J., and Hu, H.-H. (1998). Frequency domain analysis of cerebral blood flow velocity and its correlation with arterial blood pressure. J. Cereb. Blood Flow. Metab. 18, 311–318. doi:10.1097/00004647-199803000-00010
Lie, O. V., and van Mierlo, P. (2017). Seizure-onset mapping based on time-variant multivariate functional connectivity analysis of high-dimensional intracranial EEG: a kalman filter approach. Brain Topogr. 30, 46–59. doi:10.1007/s10548-016-0527-x
Liu, X., Gadhoumi, K., Xiao, R., Tran, N., Smielewski, P., Czosnyka, M., et al. (2019). Continuous monitoring of cerebrovascular reactivity through pulse transit time and intracranial pressure. Physiol. Meas. 40, 01LT01. doi:10.1088/1361-6579/aafab1
Loaiza-Maya, R., and Nibbering, D. (2023). Efficient variational approximations for state space models.
Manomaisaowapak, P., Nartkulpat, A., and Songsiri, J. (2022). Granger causality inference in EEG source connectivity analysis: a state-space approach. IEEE Trans. Neural Netw. Learn. Syst. 33, 3146–3156. doi:10.1109/TNNLS.2021.3096642
Martins, A., Pernice, R., Amado, C., Rocha, A. P., Silva, M. E., Javorka, M., et al. (2020). Multivariate and multiscale complexity of long-range correlated cardiovascular and respiratory variability series. Entropy 22, 315. doi:10.3390/e22030315
Maybeck, P. S. (1990). “The kalman filter: an introduction to concepts,” in Autonomous robot vehicles. Editors I. J. Cox, and G. T. Wilfong (New York, NY: Springer), 194–204.
Milde, T., Leistritz, L., Astolfi, L., Miltner, W. H. R., Weiss, T., Babiloni, F., et al. (2010). A new kalman filter approach for the estimation of high-dimensional time-variant multivariate AR models and its application in analysis of laser-evoked brain potentials. NeuroImage 50, 960–969. doi:10.1016/j.neuroimage.2009.12.110
Nadalizadeh, F., Rajabioun, M., and Feyzi, A. (2023). Driving fatigue detection based on brain source activity and ARMA model. Med. Biol. Eng. Comput. 62, 1017–1030. doi:10.1007/s11517-023-02983-z
Oikonomou, V. P., Tzallas, A. T., and Fotiadis, D. I. (2007). A kalman filter based methodology for EEG spike enhancement. Comput. Methods Programs Biomed. 85, 101–108. doi:10.1016/j.cmpb.2006.10.003
Olson, D. L., and Wu, D. (2020). “Autoregressive models. In predictive data mining models,” in Computational risk management. Editors D. L. Olson, and D. Wu (Singapore: Springer), 79–93.
Omidvarnia, A. H., Mesbah, M., Khlif, M. S., O’Toole, J. M., Colditz, P. B., and Boashash, B. (2011). “Kalman filter-based time-varying cortical connectivity analysis of newborn EEG,” in Proceedings of the 2011 annual international conference of the IEEE engineering in medicine and biology society (Boston, MA, August: IEEE), 1423–1426.
Pagnotta, M. F., and Plomp, G. (2018). Time-varying MVAR algorithms for directed connectivity analysis: critical comparison in simulations and benchmark EEG data. PLOS ONE 13, e0198846. doi:10.1371/journal.pone.0198846
Pascucci, D., Rubega, M., and Plomp, G. (2020). Modeling time-varying brain networks with a self-tuning optimized kalman filter. PLOS Comput. Biol. 16, e1007566. doi:10.1371/journal.pcbi.1007566
Peng, T., Rowley, A. B., Ainslie, P. N., Poulin, M. J., and Payne, S. J. (2008). Multivariate system identification for cerebral autoregulation. Ann. Biomed. Eng. 36, 308–320. doi:10.1007/s10439-007-9412-9
Pinto, H., Dias, C., and Rocha, A. P. (2022b). “Multiscale information decomposition of long memory processes: application to plateau waves of intracranial pressure,” in Proceedings of the 2022 44th annual international conference of the IEEE engineering in medicine and biology society (EMBC), 1753–1756.
Pinto, H., Pernice, R., Amado, C., Silva, M. E., Javorka, M., Faes, L., et al. (2021). “Assessing transfer entropy in cardiovascular and respiratory time series under long-range correlations,” in Proceedings of the 2021 43rd annual international conference of the IEEE engineering in medicine and biology society (EMBC), 748–751.
Pinto, H., Pernice, R., Eduarda Silva, M., Javorka, M., Faes, L., and Rocha, A. P. (2022a). Multiscale partial information decomposition of dynamic processes with short and long-range correlations: theory and application to cardiovascular control. Physiol. Meas. 43, 085004. doi:10.1088/1361-6579/ac826c
Rajabioun, M., Nasrabadi, A. M., and Shamsollahi, M. B. (2017). Estimation of effective brain connectivity with dual kalman filter and EEG source localization methods. Australas. Phys. Eng. Sci. Med. 40, 675–686. doi:10.1007/s13246-017-0578-7
Rusyana, A., Tatsara, N., Balqis, R., and Rahmi, S. (2020). Application of clustering and VARIMA for rainfall prediction. IOP Conf. Ser. Mater. Sci. Eng. 796, 012063. doi:10.1088/1757-899X/796/1/012063
Salvador, R., Verdolini, N., Garcia-Ruiz, B., Jiménez, E., Sarró, S., Vilella, E., et al. (2020). Multivariate brain functional connectivity through regularized estimators. Front. Neurosci. 14, 569540. doi:10.3389/fnins.2020.569540
Samdin, S. B., Ting, C.-M., Salleh, S.-H., Ariff, A. K., and Mohd Noor, A. B. (2013). “Linear dynamic models for classification of single-trial EEG,” in Proceedings of the 2013 35th annual international conference of the IEEE engineering in medicine and biology society (EMBC), 4827–4830.
Schäck, T., Muma, M., Feng, M., Guan, C., and Zoubir, A. M. (2018). Robust nonlinear causality analysis of nonstationary multivariate physiological time series. IEEE Trans. Biomed. Eng. 65, 1213–1225. doi:10.1109/TBME.2017.2708609
Scherrer, W., and Deistler, M. (2019). “Vector autoregressive moving average models,” in Handbook of statistics. Editors H. D. Vinod, and C. R. Rao (Elsevier), 41, 145–191. Conceptual econometrics using R. doi:10.1016/bs.host.2019.01.004
Sun, X., Jin, L., and Xiong, M. (2008). Extended kalman filter for estimation of parameters in nonlinear state-space models of biochemical networks. PLoS ONE 3, e3758. doi:10.1371/journal.pone.0003758
Swiercz, M., Mariak, Z., Krejza, J., Lewko, J., and Szydlik, P. (2000). Intracranial pressure processing with artificial neural networks: prediction of ICP trends. Acta Neurochir. (Wien) 142, 401–406. doi:10.1007/s007010050449
Swiercz, M., Mariak, Z., Lewko, J., Chojnacki, K., Kozlowski, A., and Piekarski, P. (1998). Neural network technique for detecting emergency states in neurosurgical patients. Med. Biol. Eng. Comput. 36, 717–722. doi:10.1007/BF02518874
Thelin, E. P., Raj, R., Bellander, B.-M., Nelson, D., Piippo-Karjalainen, A., Siironen, J., et al. (2020). Comparison of high versus low frequency cerebral physiology for cerebrovascular reactivity assessment in traumatic brain injury: a multi-center pilot study. J. Clin. Monit. Comput. 34, 971–994. doi:10.1007/s10877-019-00392-y
Toda, H. Y., and Phillips, P. C. B. (1994). Vector autoregression and causality: a theoretical overview and simulation study. Econ. Rev. 13, 259–285. doi:10.1080/07474939408800286
Triantafyllopoulos, K. (2021). “Multivariate state space models,” in Bayesian inference of state space models: kalman filtering and beyond. Editor K. Triantafyllopoulos (Cham: Springer International Publishing), 209–261. Springer Texts in Statistics.
Valdés-Sosa, P. A., Sánchez-Bornot, J. M., Lage-Castellanos, A., Vega-Hernández, M., Bosch-Bayard, J., Melie-García, L., et al. (2005). Estimating brain functional connectivity with sparse multivariate autoregression. Philosophical Trans. R. Soc. B Biol. Sci. 360, 969–981. doi:10.1098/rstb.2005.1654
Zeiler, F. A., Aries, M., Cabeleira, M., van Essen, T. A., Stocchetti, N., Menon, D. K., et al. (2020). Statistical cerebrovascular reactivity signal properties after secondary decompressive craniectomy in traumatic brain injury: a CENTER-TBI pilot analysis. J. Neurotrauma 37, 1306–1314. doi:10.1089/neu.2019.6726
Zeiler, F. A., Cabeleira, M., Hutchinson, P. J., Stocchetti, N., Czosnyka, M., Smielewski, P., et al. (2021). Evaluation of the relationship between slow-waves of intracranial pressure, mean arterial pressure and brain tissue oxygen in TBI: a CENTER-TBI exploratory analysis. J. Clin. Monit. Comput. 35, 711–722. doi:10.1007/s10877-020-00527-6
Zeiler, F. A., Donnelly, J., Menon, D. K., Smielewski, P., Zweifel, C., Brady, K., et al. (2017). Continuous autoregulatory indices derived from multi-modal monitoring: each one is not like the other. J. Neurotrauma 34, 3070–3080. doi:10.1089/neu.2017.5129
Keywords: cerebral physiologic signals, multivariate time-series analysis, computational neuroscience, brain function modeling, statistical models, state-space models
Citation: Vakitbilir N, Sainbhi AS, Islam A, Gomez A, Stein KY, Froese L, Bergmann T, McClarty D, Raj R and Zeiler FA (2025) Multivariate linear time-series modeling and prediction of cerebral physiologic signals: review of statistical models and implications for human signal analytics. Front. Netw. Physiol. 5:1551043. doi: 10.3389/fnetp.2025.1551043
Received: 07 January 2025; Accepted: 03 April 2025;
Published: 16 April 2025.
Edited by:
Sebastiano Stramaglia, University of Bari Aldo Moro, ItalyCopyright © 2025 Vakitbilir, Sainbhi, Islam, Gomez, Stein, Froese, Bergmann, McClarty, Raj and Zeiler. This is an open-access article distributed under the terms of the Creative Commons Attribution License (CC BY). The use, distribution or reproduction in other forums is permitted, provided the original author(s) and the copyright owner(s) are credited and that the original publication in this journal is cited, in accordance with accepted academic practice. No use, distribution or reproduction is permitted which does not comply with these terms.
*Correspondence: Nuray Vakitbilir, dmFraXRiaXJAbXl1bWFuaXRvYmEuY2E=