 Si-Chun Gu1†
 Xiao-Lei Yuan1†Ping Yin1†Yuan-Yuan Li2Chang-De Wang3Min-Jue Gu1Li-Min Xu1Chen Gao1You Wu1Yu-Qing Hu1
 Can-Xing Yuan1Yang Cao4*
 Qing Ye1*
- 1Longhua Hospital, Shanghai University of Traditional Chinese Medicine, Shanghai, China
- 2Ruijin Hospital, Shanghai Jiao Tong University School of Medicine, Shanghai, China
- 3Shanghai TCM-integrated Hospital, Shanghai University of Traditional Chinese Medicine, Shanghai, China
- 4Yueyang Hospital of Integrated Traditional Chinese and Western Medicine, Shanghai University of Traditional Chinese Medicine, Shanghai, China
Background: The association between body mass index (BMI) and rapid eye-movement (REM) sleep-related behavioral disorder (RBD) in Parkinson’s disease (PD) remains unknown. Our study was to investigate the association of BMI with RBD in PD patients.
Methods: In this cross-sectional study, a total of 1,115 PD participants were enrolled from Parkinson’s Progression Markers Initiative (PPMI) database. BMI was calculated as weight divided by height squared. RBD was defined as the RBD questionnaire (RBDSQ) score with the cutoff of 5 or more assessed. Univariable and multivariable logistic regression models were performed to examine the associations between BMI and the prevalence of RBD. Non-linear correlations were explored with use of restricted cubic spline (RCS) analysis. And the inflection point was determined by the two-line piecewise linear models.
Results: We identified 426 (38.2%) RBD. The proportion of underweight, normal, overweight and obese was 2.61, 36.59, 40.36, and 20.44%, respectively. In the multivariate logistic regression model with full adjustment for confounding variables, obese individuals had an odds ratio of 1.77 (95% confidence interval: 1.21 to 2.59) with RBD compared with those of normal weight. In the RCS models with three knots, BMI showed a non-linear association with RBD. The turning points of BMI estimated from piecewise linear models were of 28.16 kg/m2, 28.10 kg/m2, and 28.23 kg/m2 derived from univariable and multivariable adjusted logistic regression models. The effect modification by depression on the association between BMI and RBD in PD was also found in this study. Furthermore, the sensitivity analyses linked with cognition, education, and ethnic groups indicated the robustness of our results.
Conclusion: The current study found a significant dose–response association between BMI and RBD with a depression-based difference in the impact of BMI on RBD in PD patients.
1 Introduction
Body mass index (BMI) is a widely used measure of relative body weight and is considered the gold standard of general nutritional status (1). Both high and low BMI are directly related to health risks including hypertension, type 2 diabetes, cardiovascular disease, and certain cancers, and can result in detrimental health outcomes. A change in BMI is considered an important outcome in monitoring health and well-being (2, 3). BMI has been found to be associated with function in several neurodegenerative diseases. In patients with amyotrophic lateral sclerosis, a BMI < 18.5 kg/m2 is associated with reduced survival, while a BMI of 30–35 kg/m2 is associated with increased survival (4). In patients with dementia, a low BMI is associated with reduced survival and serves as an independent predictor of mortality, regardless of cognitive impairment severity (5).
Parkinson’s disease (PD) is a neurological degenerative disease characterized by motor symptoms including rigidity, tremor, bradykinesia, and postural instability, along with a wide range of non-motor symptoms, including sleep disturbances, autonomic dysfunction, neuropsychiatric disorders, and cognitive impairment (6). The combination of the heterogeneous symptomatology mentioned above directly threatens the ability of individuals with PD to live independently and imposes a significant economic and global burden (7, 8).
Given the high prevalence of weight variation in PD, increasing attention is being paid to investigate the role of BMI in PD. For the diagnosis of PD, several studies have associated obesity with a higher risk of developing PD. Conversely, patients with PD are consistently reported to have lower body weight compared to healthy controls (9). When considering survival in PD, there is a significant inverse dose–response relationship between BMI and mortality. BMI > 23 kg/m2 contributes to extended survival rates, while BMI < 18.5 kg/m2 is linked with poor survival (10). The association between BMI and motor symptoms of PD has been explored, that is decreasing-BMI is associated with worse scores over time in UPDRS motor scores, whereas increasing-BMI is associated with better UPDRS motor scores (11). Although the biological mechanisms have not been identified, potential contributors may include perturbation of hypothalamic metabolic regulation, gastrointestinal dysfunction, and alteration of energy expenditure and food intake (12).
However, to the best of our knowledge, the effects of BMI on PD non-motor symptoms have not been previously studied. As the most common disabling non-motor symptom of PD, the prevalence of rapid eye-movement (REM) sleep-related behavioral disorder (RBD) is around 20 to 50% in PD patients (13). RBD is characterized by a loss of muscle atonia during REM sleep, leading to dream enactment behaviors that are frequently injurious to patients and their partners (14, 15). Previous studies have clearly observed U-shaped and inverse U-shaped relationships between sleep duration and BMI (16). However, the impact of BMI on RBD in PD has not been fully clarified, and understanding is crucial for improving outcomes related to non-motor symptoms in patients with PD. Therefore, the objective of this study was to investigate the association between BMI and RBD in patients with PD using a large population-based dataset.
2 Methods
2.1 Study design
Study data used in the present study were obtained from the Parkinson’s Progression Markers Initiative (PPMI) database.1 PPMI is an ongoing observational, international, multicentre cohort study aiming to identify blood-based, genetic, spinal fluid, and imaging biomarkers of Parkinson’s disease (PD) progression with longitudinal follow-up in a large cohort. The aims and methodology of PPMI study have been published elsewhere (17). Study protocol and manuals and are available online. The study was approved by the Institutional Review Board at each site, and all participants provided written informed consent.
For this study, we utilized the dataset of PPMI from 33 participating outpatient PD treatment centers worldwide on the basis of inclusion and exclusion criteria previously published. All the methods were performed in accordance with relevant institutional guidelines and regulations. The Strengthening the Reporting of Observational studies in Epidemiology (STROBE) guideline was included in Supplementary material. Figure 1 illustrated the selection process of our study. Participants who were diagnosed as idiopathic PD, with Rapid eye movement (REM) sleep behavior disorder questionnaire (RBDSQ) score and BMI data were included as study population. Healthy controls, scans without evidence of dopaminergic deficit (SWEDD) patients, prodromal patients, duplicated participants, individuals with missing RBDSQ score or BMI data were excluded from this analysis. In total, 1,115 patients with complete information, enrolled between November 2010 and June 2023, were included in our analyses. The data were downloaded on September 15, 2023.
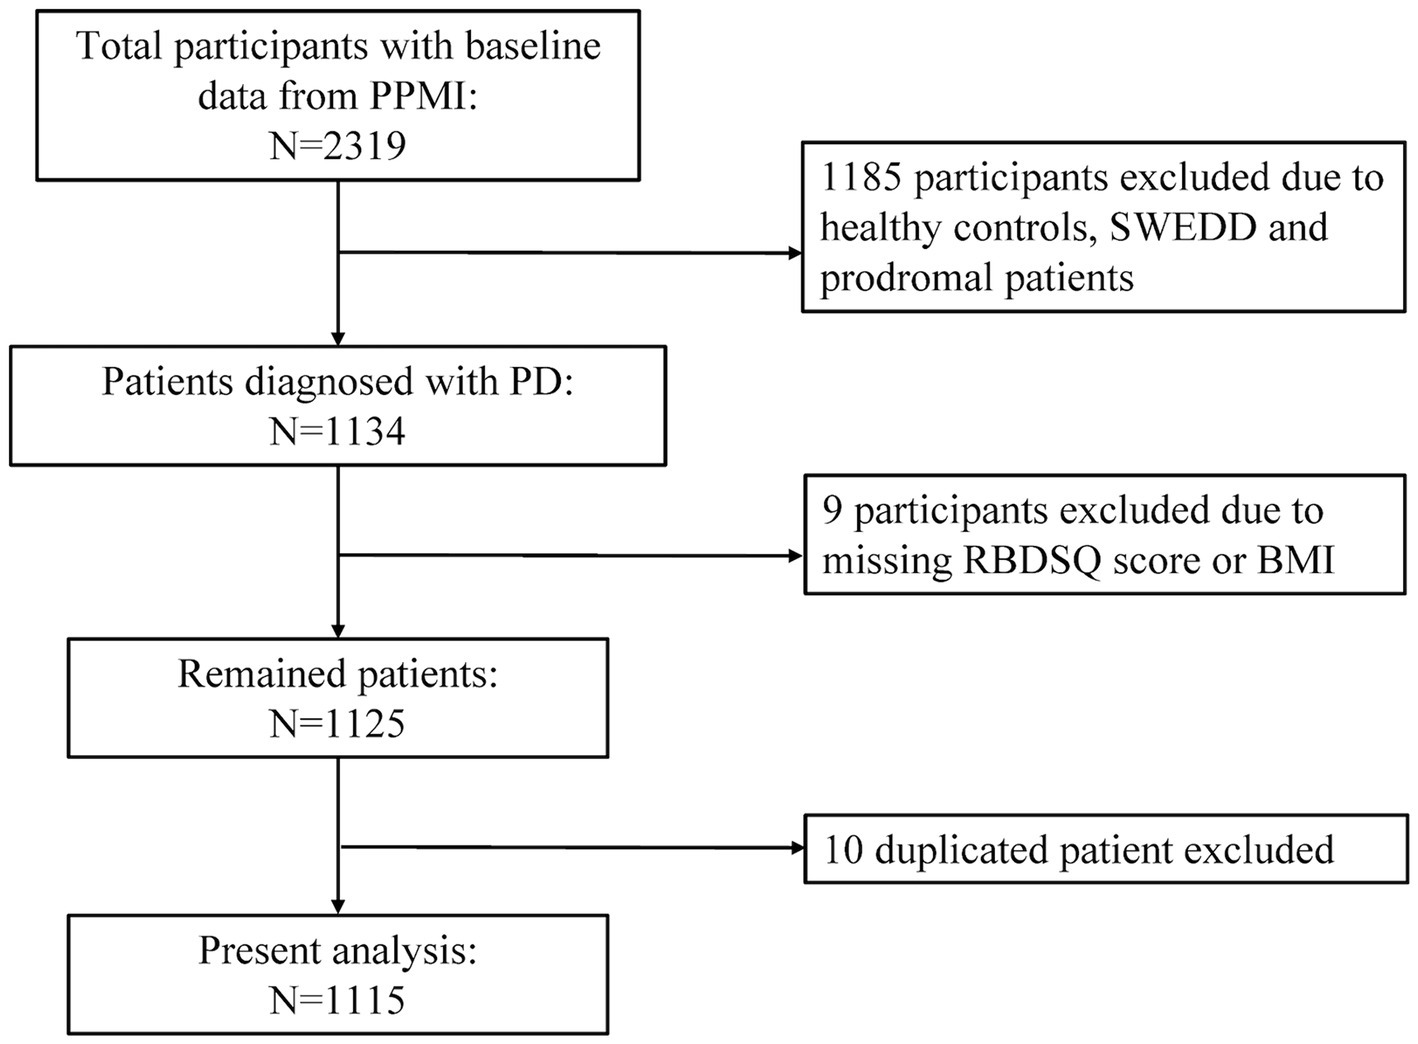
Figure 1. Flow chart of the study population. PPMI, Parkinson’s Progression Markers Initiative; PD, Parkinson’s disease; SWEDD, scans without evidence of dopaminergic deficit; RBDSQ, rapid eye movement (REM) sleep behavior disorder questionnaire; BMI, body mass index.
2.2 Exposure and outcome
Exposure was assigned as BMI. Anthropometric data, including height and weight, were obtained from PPMI data. BMI was calculated as weight divided by height squared [weight (kg)/height (m2)], and then classified into 4 WHO categories, including underweight (BMI < 18.5 kg/m2), normal weight (18.5 ≤ BMI < 25.0 kg/m2), overweight (25 ≤ BMI < 30 kg/m2) and obese (BMI ≥ 30 kg/m2) categories (18, 19).
Outcome was assigned as REM-sleep behavior disorder (RBD). The 10-item RBDSQ has been validated in PD patients and demonstrates good accuracy in identifying RBD (20). Items 1 to 4 of the RBDSQ assess the frequency and content of dreams, as well as their relationship to nocturnal movements and behavior. Item 5 asks about self-injuries and injuries to the bed partner. Item 6 consists of four subitems specifically assessing nocturnal motor behavior, including questions about nocturnal vocalization, sudden limb movements, complex movements, or items falling from the bed. Items 7 and 8 inquire about nocturnal awakenings. Item 9 focuses on general sleep disturbances, while item 10 pertains to the presence of any neurological disorder. The maximum total score on the RBDSQ is 13 points. Following the definition set by the International Parkinson and Movement Disorders Society (MDS) Task Force, we defined RBD as a RBDSQ score equal to or greater than 5 (20).
2.3 Covariates
To assess the potential influence of confounding factors, important covariates were considered on the basis of previous evidence and applicability to PPMI: age, sex, PD duration, depression (measured by the 15-item Geriatric Depression Scale [GDS-15] score in PPMI), levodopa equivalent daily dose (LEDD), hypertension (defined as self-reported hypertension, systolic blood pressure ≥ 140 mmHg, diastolic blood pressure ≥ 90 mmHg, or use of antihypertensive drugs), and MDS Unified Parkinson’s Disease Rating Scale (MDS-UPDRS) score (21). All participants in the PPMI study underwent the standard test battery of assessments. In addition to the covariates mentioned above, sociodemographic characteristics and clinical battery relevant to this study including education, Hoehn & Yahr stage, serum uric acid, autonomic function assessed by the Scale for Outcomes for Parkinson’s Disease-autonomic function (SCOPA-AUT) score, anxiety assessed by State-Trait Anxiety Inventory (STAI) score, and daily living quality assessed by Modified Schwab and England Activities of Daily Living Scale (MSEADL) were adjusted as potential confounders in the models. Although PPMI collected an array of cerebrospinal fluid (CSF) biomarkers, these measures were only available for a small subset of participants and thus were not included in this study.
2.4 Statistical analysis
Summary statistics were performed and tested for normality (Shapiro–Wilk). Continuous data were presented as median (interquartile range [IQR]) or mean ± standard deviation (mean ± SD), with categorical data presented as proportion and number (N [%]) as appropriate. Group comparisons were analyzed with use of Student’s t tests or Wilcoxon’s rank-sum tests for continuous data and Chi-square tests or Fisher’s exact tests for categorical data. Data were more than 99% complete. The remaining missing values were imputed by multivariable chained imputation with fully conditional specification, and imputed and reported results were similar (22). All statistical tests were two-sided and the level of significance was set at 0.05.
Participants were divided into two groups based on whether they had RBD. The relationship between BMI and RBD was examined using logistic regression models. The adjustment was accomplished via 3 models: (1) model 1, without any covariate adjustment; (2) model 2, adjusted for age, sex, PD duration, GDS-15 score, LEDD, hypertension, depression, and MDS-UPDRS I, II and III scores; (3) model 3, additionally adjusted for education level, serum uric acid, Hoehn & Yahr stage, STAI, SCOPA-AUT, and MSEADL scores as covariates. The results were presented as odds ratios (OR) with corresponding 95% confidence intervals (CI).
Restricted cubic spline (RCS) analysis was also performed to examine the association of between BMI and RBD based on univariable and multivariable adjusted logistic regression models (23). To balance best fit and overfitting in the main splines, the number of knots, between three and seven, was chosen as the lowest value for the Akaike information criterion. If the difference in the number of knots was within two for different models, the lowest number of knots was selected (24). The same number of knots from the main splines was also applied for stratified analyses to allow direct comparison of overall and stratified analyses, including test of interaction. We tested for potential non-linearity by using a likelihood ratio test comparing the model with only a linear term against the model with linear and cubic spline terms. Piecewise-linear models were then fitted to quantify the association between BMI and RBD. If evidence of non-linearity was found, a two-line piecewise linear model with a single change point was estimated by trying all possible values for the change point and selecting the value with the highest likelihood among those considered, while accounting for covariates.
We fitted interactions to investigate effect modification by depression (with depression, without depression, GDS-15 ≥ 5 or not), motor subtype [tremor dominate (TD), non-TD including postural instability/gait disorder (PIGD) or Indeterminate], sex (male, female), and hypertension (yes, no) (25–27). Due to the nonlinear association between BMI and RBD in the whole participants, we used continuous BMI and the quadratic term BMI2 in multivariable adjusted logistic regression models (model 3) to allow for the nonlinearity during the interaction analyses. The first model to test for the depression-by-BMI interaction allowed for interaction with both the linear and quadratic terms of BMI (28).
In the absence of interaction with the quadratic term, the model was then simplified to only allow for interaction with the linear term.
The significance of the interaction was determined based on the highest level interaction term in the models, and here, lack of interaction was inferred when neither BMI2 × depression (Model A) nor BMI × depression (Model B) were significant at the 5% level. Interactions by subtype, hypertension, and sex were examined in the corresponding manner, replacing “depression” above with hypertension, sex or subtype as relevant.
To assess the robustness of the results, we additionally applied three sensitivity analyses. First, we examined the shape of BMI-RBD relation after excluding individuals who had a Montreal Cognitive Assessment (MOCA) score less than 26 as the definition of cognitive impairment (29). Second, we restricted the analysis to individuals in the first and second categories of education. Third, we performed the analysis after excluding other ethnic groups. All data were analyzed using R (version 4.0.2).
3 Results
Of 1,115 participants included in the study, we identified 426 (38.2%) RBD. Table 1 summarized the characteristics of participants according to BMI categories. The proportion of underweight, normal, overweight and obese was 2.61, 36.59, 40.36, and 20.44%, respectively. The median BMI was 26.1, and the median age was 63.6 years. Within 4 BMI categories, significant differences were observed regarding the proportion of RBD, RBDSQ score, sex, education status, MOCA score, GDS-15 score, SCOPA-AUT score, proportion of hypertension, and serum uric acid. The individuals with higher BMI tended to have higher RBDSQ score, as well as a higher proportion of RBD. The proportion of RBD decreased with higher BMI. The proportion of male decreased with higher BMI. The individuals with lower BMI tended to have a lower proportion of the first category of education (<13 years) and a higher proportion of the second category of education (13–23 years). Underweight individuals had higher MOCA score, GDS-15 score, and SCOPA-AUT score than others. Serum uric acid increased with higher BMI, with the median of 4.1 mg/dL in underweight individuals, 4.5 mg/dL in normal weight individuals, 5.4 mg/dL in overweight individuals, and 5.5 mg/dL in obese individuals. Moreover, a positive association was observed between hypertension and BMI. 17.2% of underweight individuals had hypertension, whereas 49.6% of obese individuals had hypertension.
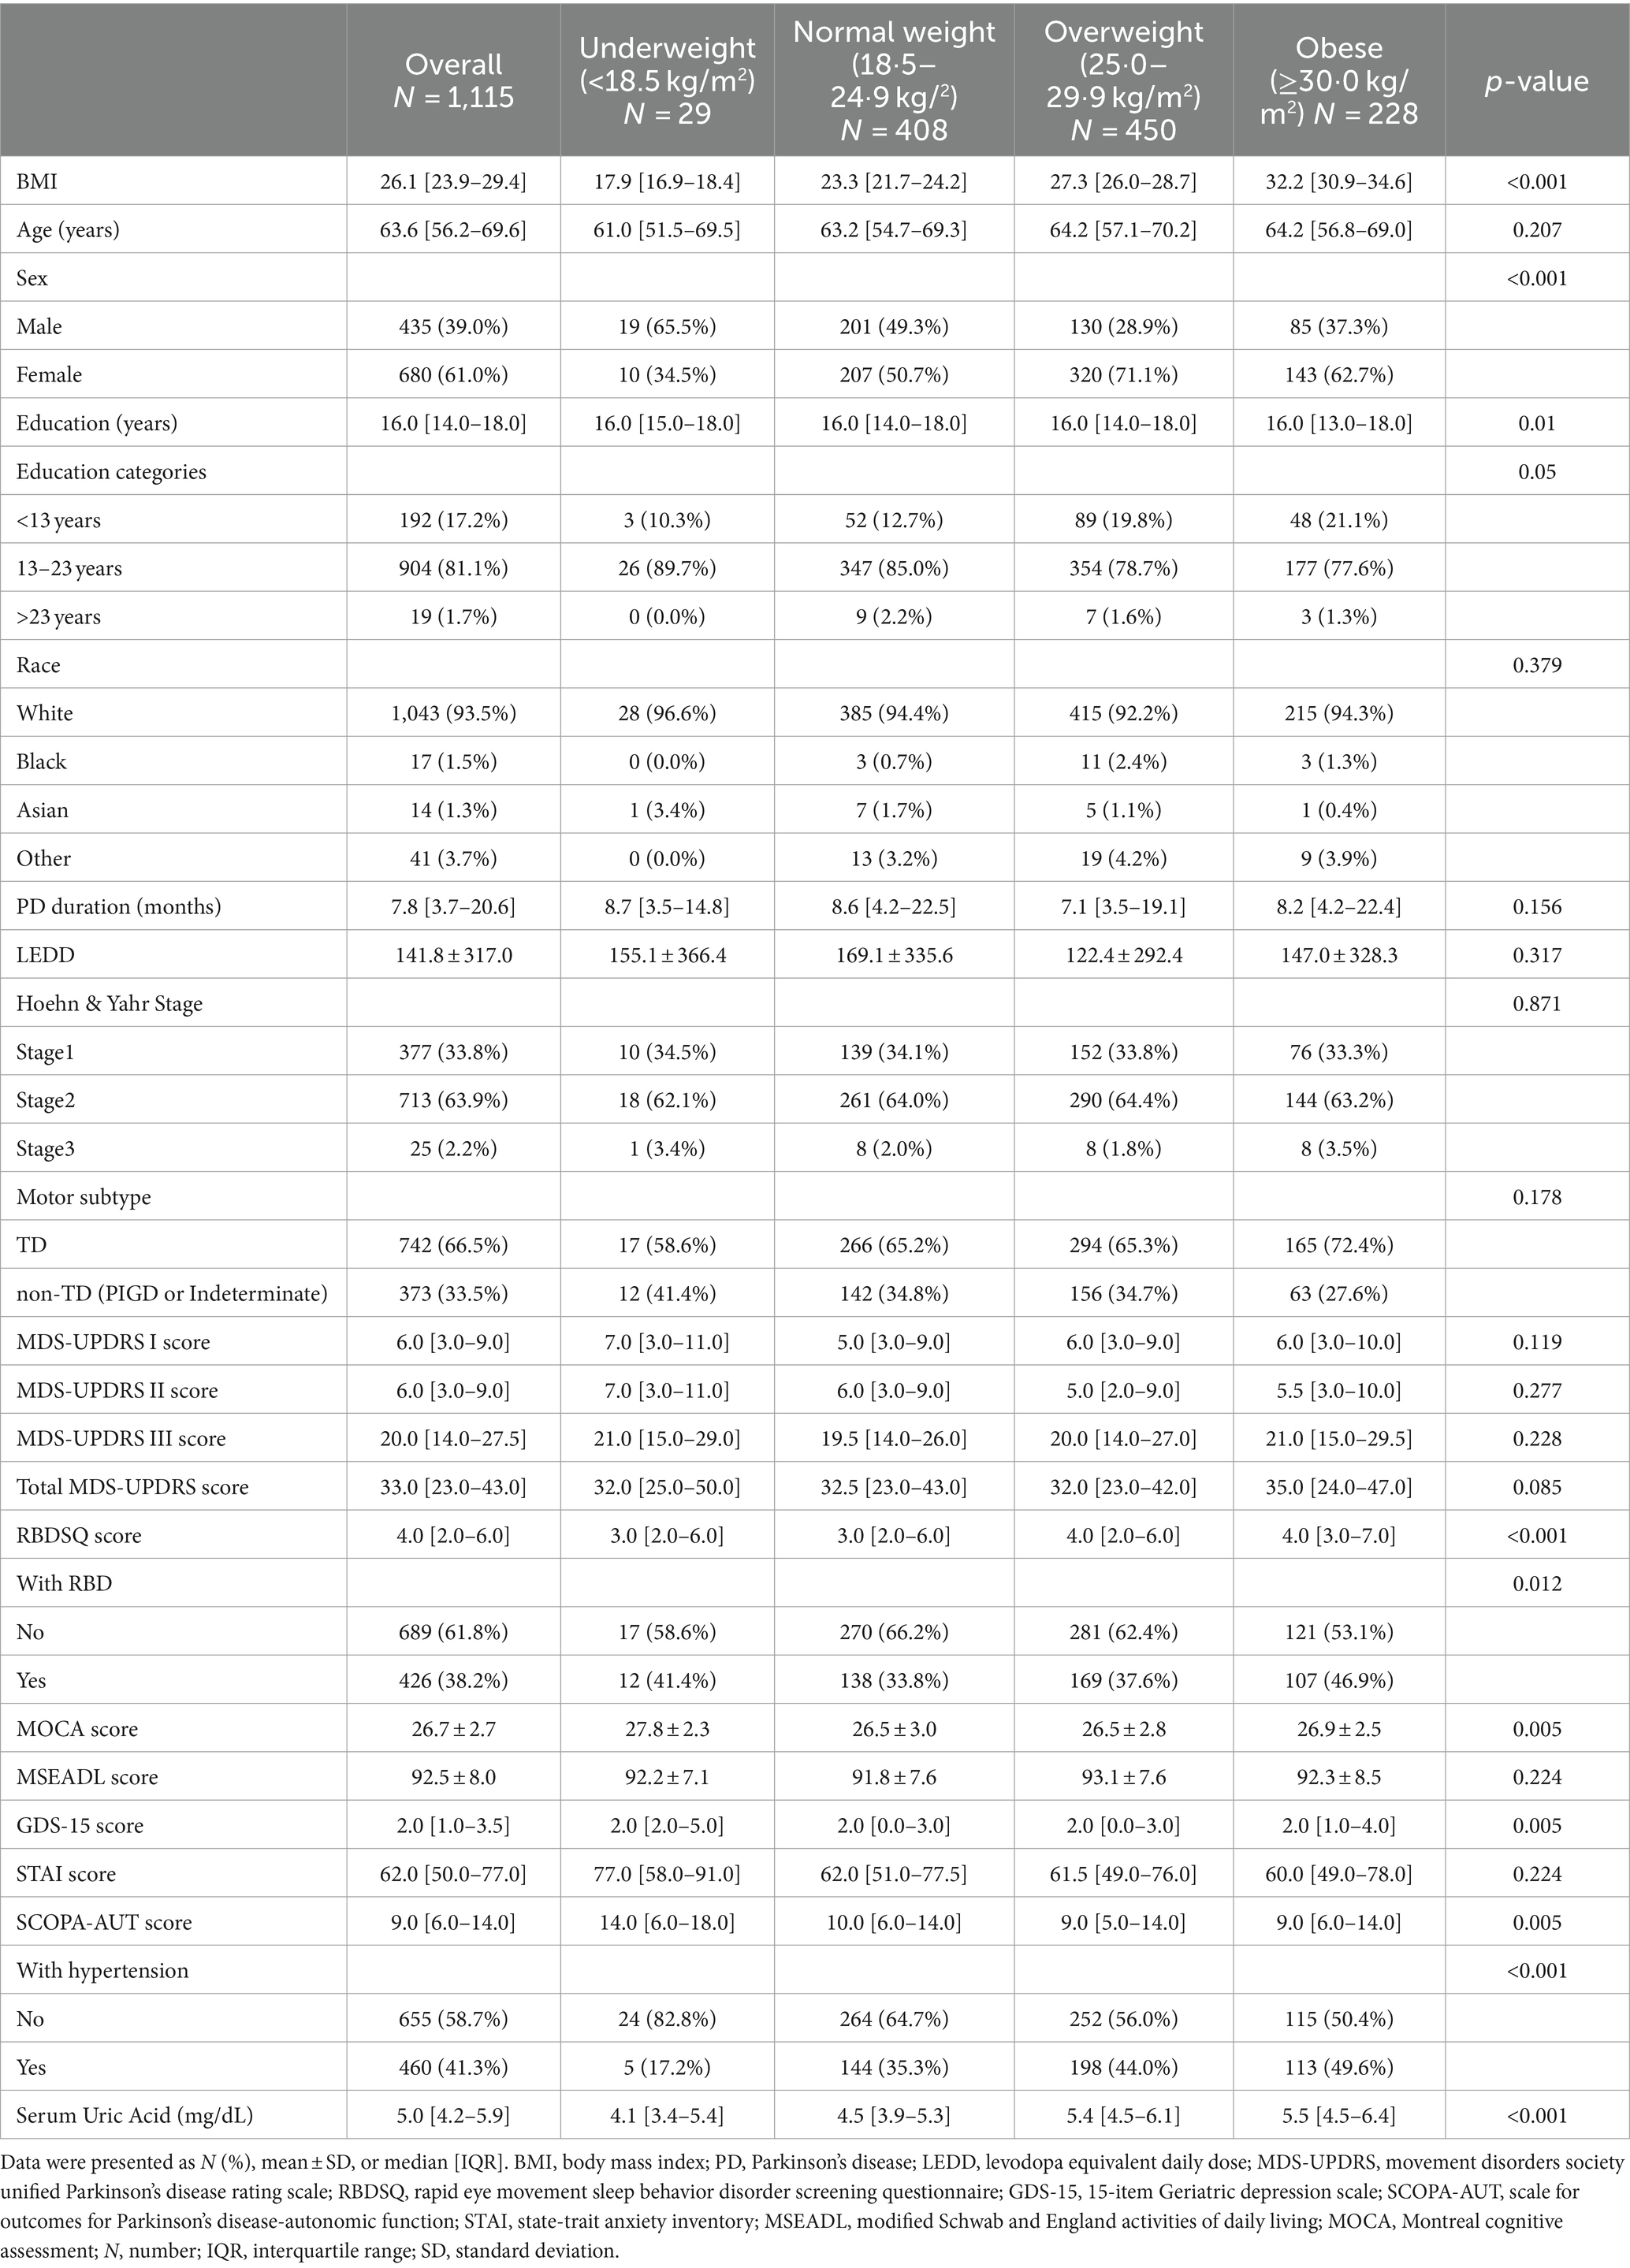
Table 1. Characteristics of study population according to BMI measure by WHO BMI category.
Table 2 showed the association of BMI and RBD. In the crude logistic regression model, obese individuals had an OR of 1.73 (95% CI 1.24 to 2.41) for RBD compared with normal weight individuals, which indicated that the odds of RBD were increasing for rise in BMI. The strong positive association between BMI and RBD consistently existed in adjusted models. Compared with those of normal weight, obese individuals had ORs of 1.63 (95% CI 1.14 to 2.34) and 1.77 (95% CI 1.21 to 2.59) for RBD in model 2 and model 3.

Table 2. The association between baseline BMI and the incidence of RBD in PD.
We used RCS to flexibly model and visualize the relation of BMI with RBD in PD with three knots (Figures 2A–C). For the odds of RBD, there was evidence of non-linearity with two main patterns seen: we found positive associations below the change points of BMI with the rapid increase of the odds of RBD, whereas there was little evidence of association above the change points of BMI with relative flat trend (P for non-linearity <0.001). The change points of BMI estimated from piecewise linear models were of 28.16 kg/m2, 28.10 kg/m2, and 28.23 kg/m2 in univariable and multivariable adjusted logistic regression models (Table 3).
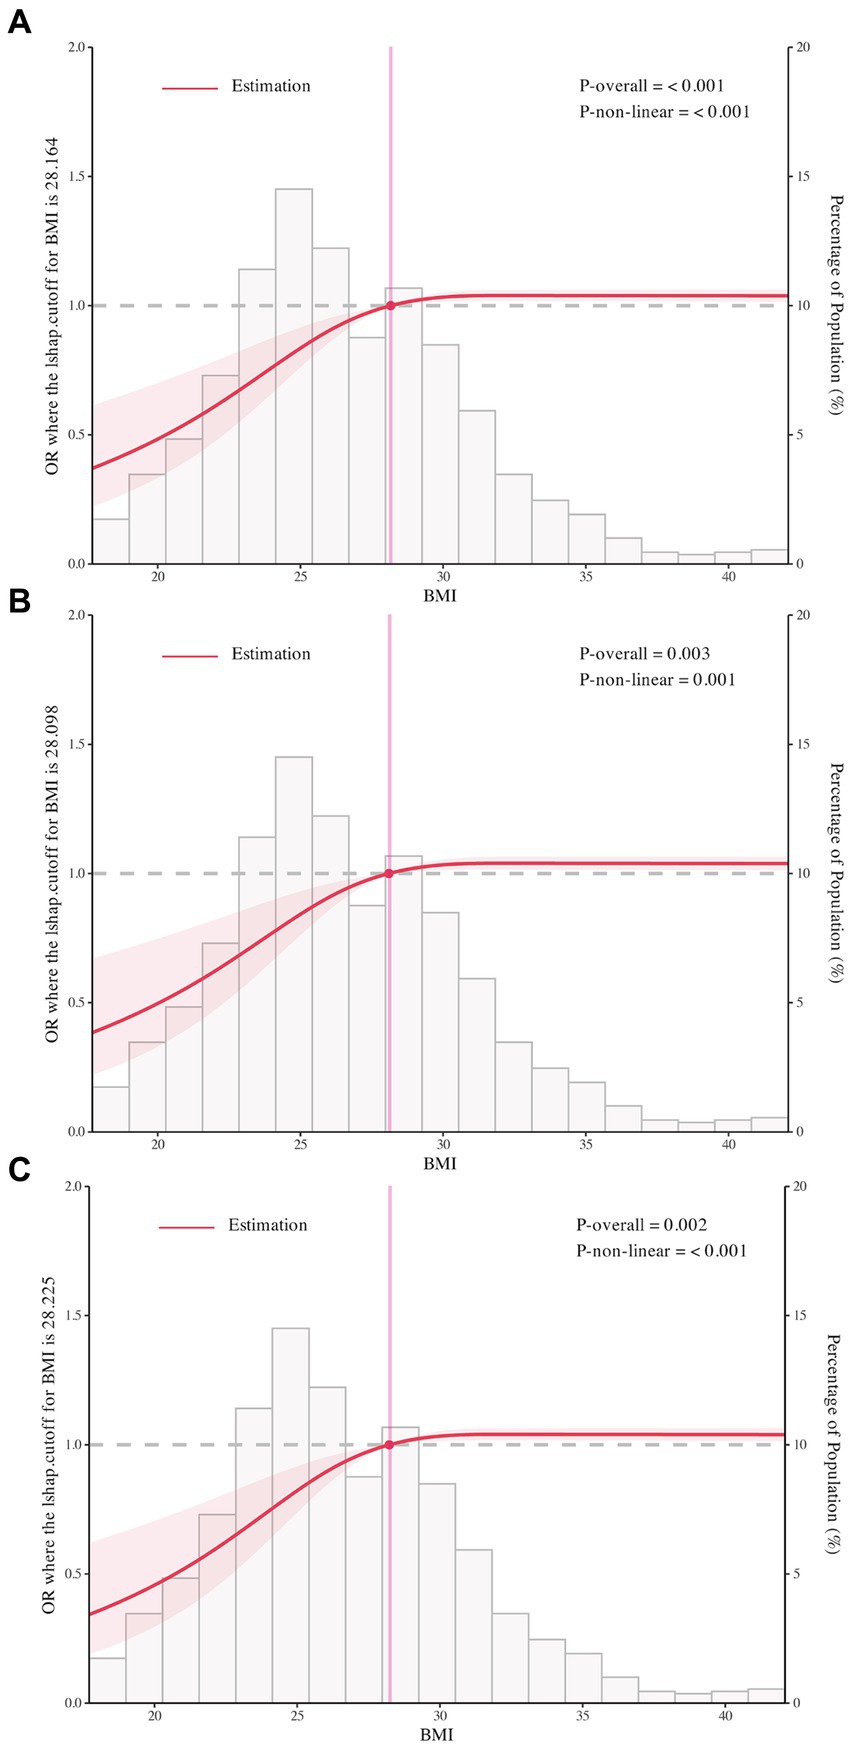
Figure 2. The restricted cubic spline for the association of body mass index with rapid eye movement sleep behavior disorder in Parkinson’s Disease. Odds ratios were indicated by solid lines and 95% confidence interval by shaded areas based on the restricted cubic spline models. For (A), rapid eye movement sleep behavior disorder was not adjusted for any covariate. For (B,C), adjusted factors were consistent with model 2 and model 3. All figures were created with the use of R software (version 3.3.3, https://www.r-project.org/).
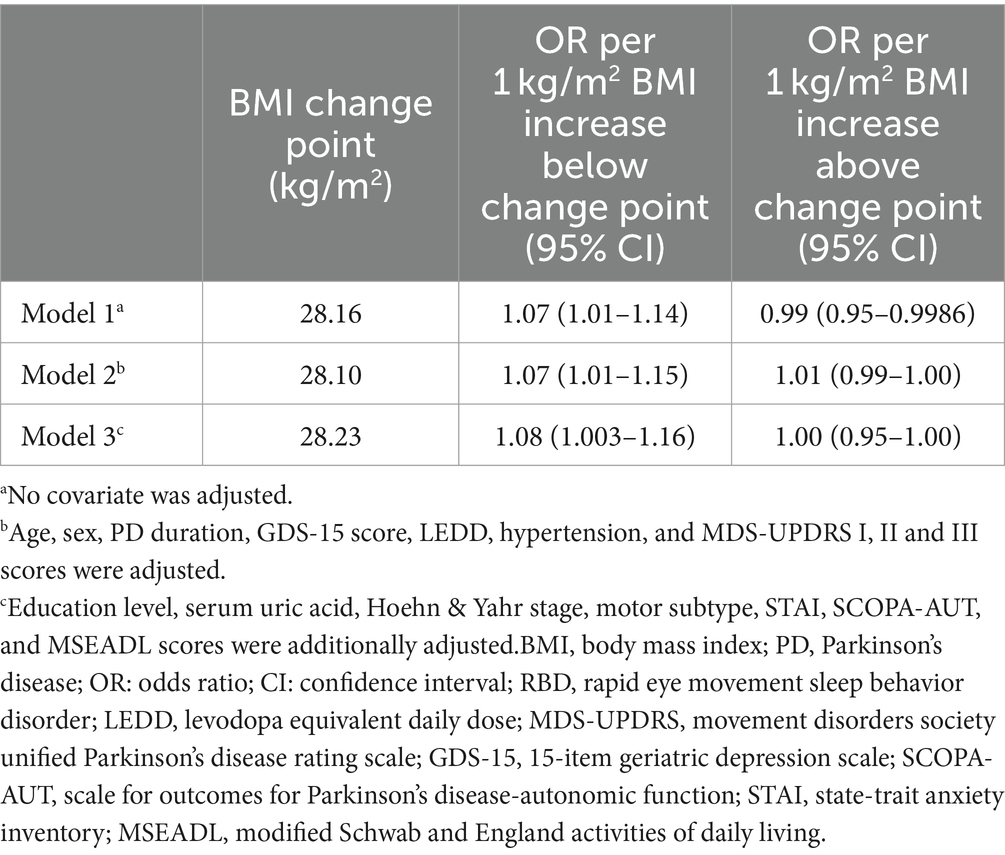
Table 3. Estimated change points in the association between BMI and RBD in PD below and above the change point from piecewise two-line models.
The effect modification by depression on the association between BMI and RBD in PD was found in this study. In individuals with depression, we found that the relationship between BMI and RBD was linear with the odds of RBD increasing continuously with higher BMI (OR: 1.08, 95% CI 1.002 to 1.18, P for non-linearity = 0.15; Figure 3A). In individuals without depression, the threshold effect analysis of BMI on RBD was further performed by the two-piecewise linear regression. The odds of RBD increased rapidly until BMI of 28.31 kg/m2 (OR: 1.10, 95% CI: 1.01 to 1.19) with minimal change afterwards (OR: 0.98, 95% CI: 0.93 to 1.00, P for non-linearity = 0.001; Figure 3A). We found no evidence of effect modification by sex, motor subtype and hypertension on the association between BMI and RBD in PD (Figures 3B–E; Supplementary Table S1).
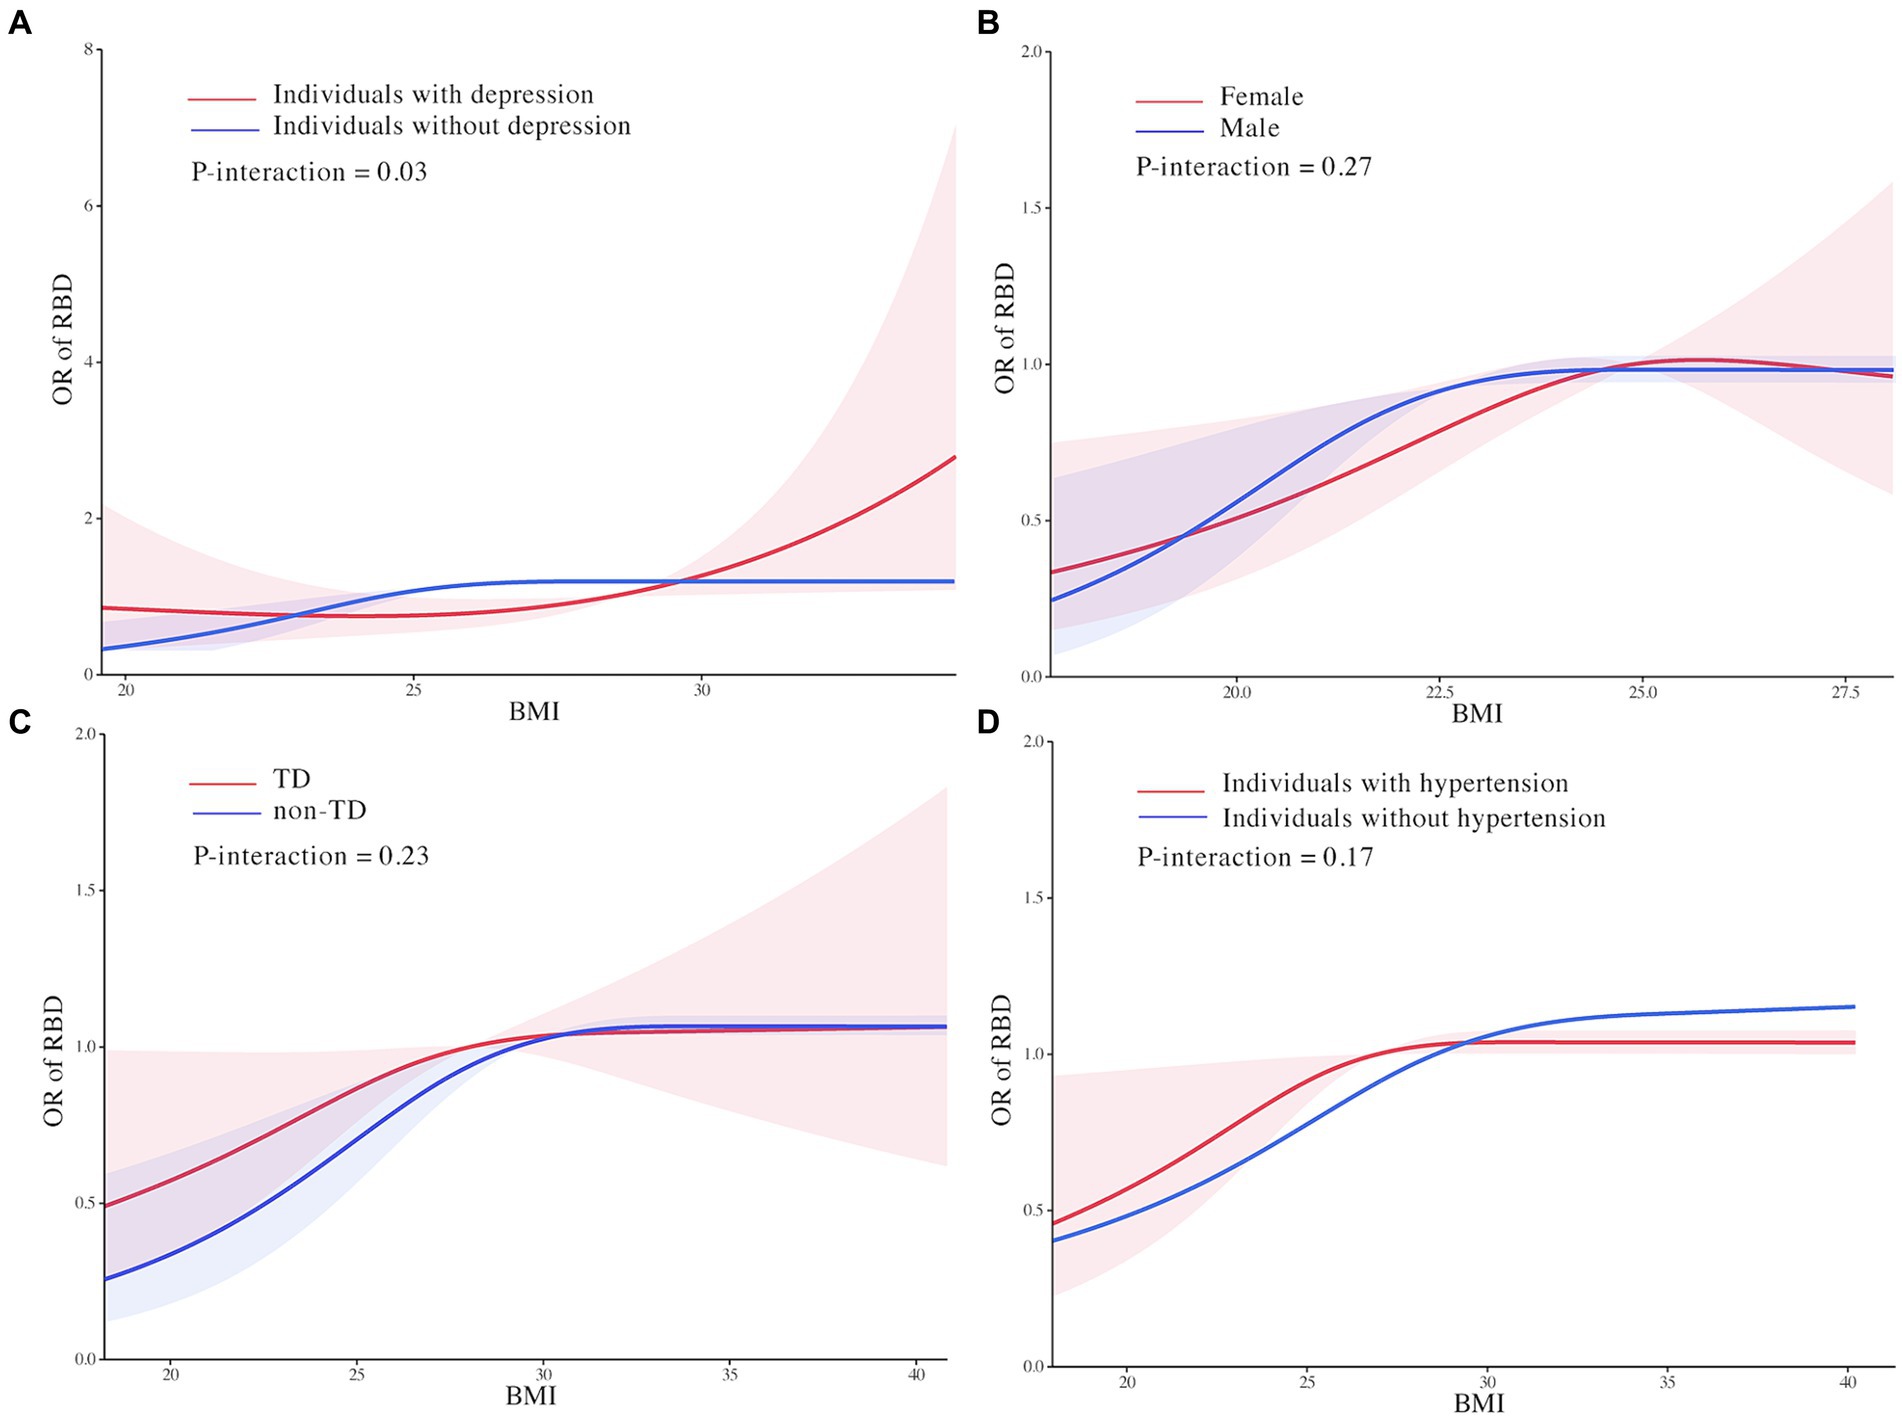
Figure 3. Effect modification of depression (A), motor subtype (B), sex (C), and hypertension (D) on the association of body mass index with rapid eye movement sleep behavior disorder in Parkinson’s Disease. Odds ratios were indicated by solid lines and 95% confidence interval by shaded areas based on the restricted cubic spline models. Estimates were adjusted for age, sex, Parkinson’s Disease duration, 15-item Geriatric Depression Scale score, levodopa equivalent daily dose, hypertension, depression, Unified Parkinson’s Disease Rating Scale I, II, and III scores, education level, serum uric acid, Hoehn & Yahr stage, State-Trait Anxiety Inventory score, Scale for Outcomes for Parkinson’s Disease-autonomic function score, and Modified Schwab and England Activities of Daily Living Scale score. All figures were created with the use of R software (version 3.3.3, https://www.r-project.org/).
The results of sensitivity analyses were similar to the main analysis, when excluding participants with MOCA score less than 26, restricting the analysis to individuals in the first and second categories of education, or excluding other ethnic groups, which indicating the robustness of our results (Supplementary Figure S1).
4 Discussion
To our knowledge, this was the first study to investigate the association between BMI and non-motor symptom of PD. In the current study, we examined the association between RBD and BMI among PD patients with use of PPMI cross-sectional data. Our findings showed the significant presence of dose–response relationship between BMI and RBD with a depression-based difference in the impact of BMI on RBD in PD patients.
In the RCS models, BMI tended to be positively associated with the odds of RBD up to change points with little association above these change points. And we also estimated an increased odds of RBD among obese individuals compared with those of healthy weight in PD. Although the study confirmed the nonlinear association between BMI and RBD in PD, the mechanisms did not seem straightforward. It has been reported that the pathology of PD originates from the gastrointestinal tract, which also serves as an energy portal, and develops upward along the neural pathway to the central nervous system, including the dorsal motor nucleus of substantia nigra, vagus, and hypothalamus. These areas are also involved in energy metabolism control and sleep regulation (30, 31). Some studies have suggested that altered sleep quality and circadian clock could directly affect neuro-endocrine systems involved in the regulation of energy balance, resulting in overweight. This includes the sympathetic nervous system, hypothalamic–pituitary–adrenal (HPA) axis, brain metabolism-related peptides such as glucagon-like peptide 1 (GLP-1), insulin, leptin, and ghrelin levels (32). Furthermore, it has been found that a lack of orexin or insufficient orexin signaling, along with low physical activity, might promote the coexistence of sleep disorders and overweight (33) (Figure 4). Conversely, RBD itself might predispose individuals to worsening overweight due to sleep deprivation, increased sympathetic activation, sleep fragmentation, ineffective sleep, and insulin resistance. This could potentially lead to diabetes and aggravation of obesity (34, 35) (Figure 4). Thus, it seems that RBD and weight status in the context of PD form a cycle interrelating with each other. It is crucial to understand the precise interaction between them.
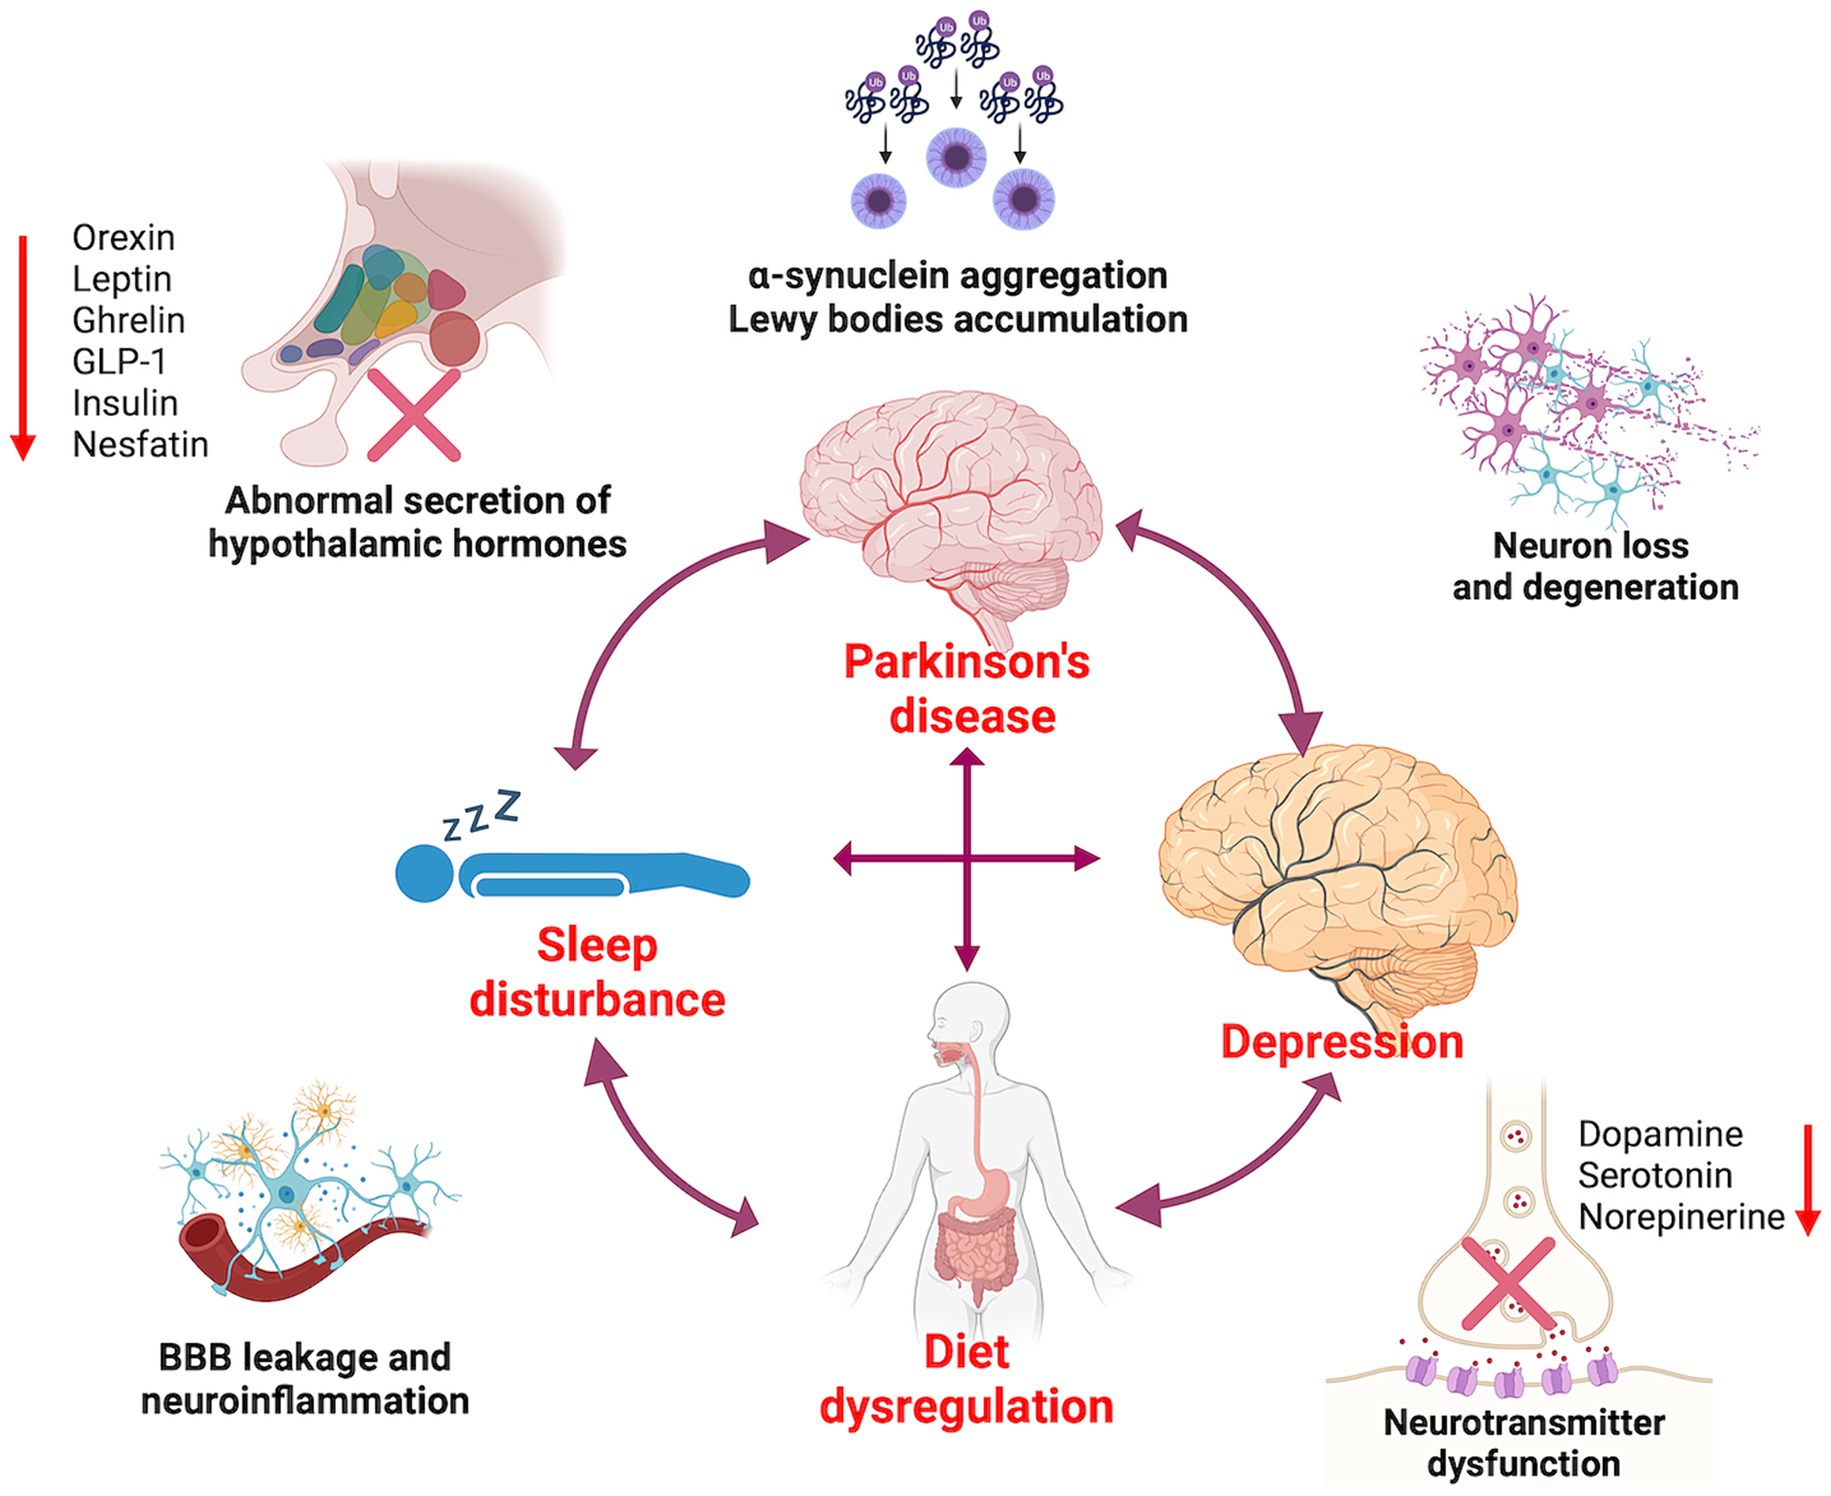
Figure 4. The interactions between Parkinson’s disease, diet dysregulation, sleep disorders, and depression.
Subgroup analyses showed strong interactions of depression and the clear heterogeneity in the associations of BMI and RBD, meaning that the association of RBD with BMI would be affected by the mood status of PD patients. The odds of RBD were higher for obese individuals with depression compared to those without depression, which were partly consistent with results from some major studies.
It has been shown that patients with depression exhibit abnormalities in sleep parameters throughout all phases of sleep architecture. Among these alterations, changes in REM sleep are particularly prominent and are often considered a distinct biological marker of depression (36). Patients with depression may experience longer disease duration, more severe symptoms, and a higher overall illness severity compared to individuals without depression. As a result, they are at higher odds of developing RBD (37). Several studies investigating the pathophysiological mechanisms underlying the relationship between sleep disturbance and depression have found that dysregulation of monoamine neurotransmitters such as serotonin, norepinephrine, and dopamine, which are responsible for REM sleep abnormalities, is also associated with the presentation of depression (38, 39). Furthermore, sleep disorders can increase markers of inflammation by activating the sympathetic nervous system and β-adrenergic signaling, leading to increased NF-κB activity and activation of inflammatory gene expression. Notably, there is a strong association between inflammation and depression (40, 41) (Figure 4). To better understand the link between sleep and depression, further research is needed to elucidate the role of inflammation, monoamines, and other related neurotransmitters.
This study might provide more insight into the complex interactions between PD, diet dysregulation, sleep disorders, and depression in clinical practice. Conducting a comprehensive assessment, including evaluating PD symptoms, sleep disorders, BMI, and depression during diagnosis and treatment might be essential. In addition, the multidisciplinary management approach including neurologist, primary care physician, psychologists, and nutritionists is crucial for PD patients. Furthermore, the combination of pharmacological interventions (anti-parkinsonism meditations, hypnotics and antidepressants), non-pharmacological therapies (such as cognitive-behavioral therapy for insomnia or light therapy for circadian rhythm disorders), and lifestyle modifications (such as regular physical exercise and well-rounded nutritional diet) should be highlighted. The better understanding of the pathophysiological mechanisms between PD, diet regulation, sleep and mood is urgently needed for comprehensive manage this comorbidity.
There were several limitations to this study. First, despite efforts to adjust for confounding variables leading to potential confounding bias in the current study, bias might still be inherent and sometimes inevitable in cross-sectional studies. One reason is the reliance on data collected at a single point in time, limiting researchers’ ability to establish temporal relationships or causality between variables. Additionally, cross-sectional studies often rely on self-reported data, which can be subject to recall bias or social desirability bias. Selection bias might arise from the non-random sampling of participants, resulting in an unrepresentative sample and limit the generalizability of findings to the target population (42–44). Thus, prospective and large cohort studies are still needed in the future. Second, although we tried to adjust many variables that can be related to RBD in PD, factors such as smoking and drinking could not be include due to the restriction of data source in PPMI. Third, in our participants, the number of patients with BMI <18·5 kg/m2 was relatively small, which should be considered when interpreting results.
5 Conclusion
In conclusion, this study demonstrated a significant dose–response association between BMI and RBD in PD patients, even after adjusting for potential confounders. And there was a depression-based difference in the impact of BMI on RBD. Regular monitoring of BMI is thus important for patients with PD, particularly patients with depression. Future randomized controlled trials or cohort studies are needed to validate these findings and provide more precise prevention and treatment options for RBD in PD.
Data availability statement
The datasets presented in this study can be found in online repositories. The names of the repository/repositories and accession number(s) can be found at: www.ppmi-info.org/data.
Ethics statement
The studies involving humans were approved by the Institutional Review Board at each site (the full list is available as a Supplementary File). The studies were conducted in accordance with the local legislation and institutional requirements. The participants provided their written informed consent to participate in this study.
Author contributions
S-CG: Conceptualization, Data curation, Formal analysis, Funding acquisition, Software, Writing – original draft, Writing – review & editing. X-LY: Conceptualization, Data curation, Formal analysis, Funding acquisition, Writing – original draft, Writing – review & editing. PY: Conceptualization, Data curation, Formal analysis, Writing – original draft, Writing – review & editing. Y-YL: Data curation, Investigation, Writing – review & editing. C-DW: Data curation, Investigation, Writing – review & editing. M-JG: Data curation, Investigation, Writing – review & editing. L-MX: Data curation, Investigation, Writing – review & editing. CG: Data curation, Investigation, Writing – review & editing. YW: Data curation, Investigation, Writing – review & editing. Y-QH: Data curation, Investigation, Writing – review & editing. C-XY: Data curation, Investigation, Writing – review & editing. YC: Conceptualization, Data curation, Formal analysis, Writing – original draft, Writing – review & editing. QY: Conceptualization, Funding acquisition, Writing – original draft, Writing – review & editing.
Funding
The author(s) declare that financial support was received for the research, authorship, and/or publication of this article. This work was supported by Shanghai Science and Technology Committee [grant number 21Y31920300]; National Natural Science Foundation of China [grant number 82074355]; Shanghai Pujiang Program [grant number 2020PJD066]; Shanghai Sailing Program [grant number 2021YF1447800], and Shanghai Municipal Health Commission [grant number 20204Y0168]. PPMI (a public–private partnership) is funded by the Michael J. Fox Foundation for Parkinson’s Research and funding partners, including Abbvie, Allergan, Avid Radiopharmaceuticals, Biogen, BioLegend, Bristol-Myers Squibb, Celgene, Denali, GE Healthcare, Genentech, GlaxoSmithKline, Lilly, Lundbeck, Merck, Meso Scale Discovery, Pfizer, Piramal, Prevail Therapeutics, Roche, Sanofi Genzyme, Servier, Takeda, Teva, UCB, Verily, Voyager Therapeutics and Golub Capital.
Conflict of interest
The authors declare that the research was conducted in the absence of any commercial or financial relationships that could be construed as a potential conflict of interest.
Publisher's note
All claims expressed in this article are solely those of the authors and do not necessarily represent those of their affiliated organizations, or those of the publisher, the editors and the reviewers. Any product that may be evaluated in this article, or claim that may be made by its manufacturer, is not guaranteed or endorsed by the publisher.
Supplementary material
The Supplementary material for this article can be found online at: https://www.frontiersin.org/articles/10.3389/fneur.2024.1388131/full#supplementary-material
Footnotes
References
1. GBD 2015 Obesity CollaboratorsAfshin, A, Forouzanfar, MH, Reitsma, MB, Sur, P, Estep, K, et al. Health effects of overweight and obesity in 195 countries over 25 years. N Engl J Med. (2017) 377:13–27. doi: 10.1056/NEJMoa1614362
2. Berrington de Gonzalez, A, Hartge, P, Cerhan, JR, Flint, AJ, Hannan, L, MacInnis, RJ, et al. Body-mass index and mortality among 1.46 million white adults. N Engl J Med. (2010) 363:2211–9. doi: 10.1056/NEJMoa1000367
3. Parr, CL, Batty, GD, Lam, TH, Barzi, F, Fang, X, Ho, SC, et al. Body-mass index and cancer mortality in the Asia-Pacific cohort studies collaboration: pooled analyses of 424,519 participants. Lancet Oncol. (2010) 11:741–52. doi: 10.1016/S1470-2045(10)70141-8
4. Paganoni, S, Deng, J, Jaffa, M, Cudkowicz, ME, and Wills, AM. Body mass index, not dyslipidemia, is an independent predictor of survival in amyotrophic lateral sclerosis. Muscle Nerve. (2011) 44:20–4. doi: 10.1002/mus.22114
5. Wu, S, Lv, X, Shen, J, Chen, H, Ma, Y, Jin, X, et al. Association between body mass index, its change and cognitive impairment among Chinese older adults: a community-based, 9-year prospective cohort study. Eur J Epidemiol. (2021) 36:1043–54. doi: 10.1007/s10654-021-00792-y
6. Armstrong, MJ, and Okun, MS. Diagnosis and treatment of Parkinson disease: a review. JAMA. (2020) 323:548–60. doi: 10.1001/jama.2019.22360
7. Connolly, BS, and Lang, AE. Pharmacological treatment of Parkinson disease: a review. JAMA. (2014) 311:1670–83. doi: 10.1001/jama.2014.3654
8. Kalia, LV, and Lang, AE. Parkinson's disease. Lancet. (2015) 386:896–912. doi: 10.1016/S0140-6736(14)61393-3
9. Noyce, AJ, Kia, DA, Hemani, G, Nicolas, A, Price, TR, de Pablo-Fernandez, E, et al. Estimating the causal influence of body mass index on risk of Parkinson disease: a Mendelian randomisation study. PLoS Med. (2017) 14:e1002314. doi: 10.1371/journal.pmed.1002314
10. Yoon, SY, Heo, SJ, Lee, HJ, Shin, J, Kim, YW, Yang, SN, et al. Initial BMI and weight loss over time predict mortality in Parkinson disease. J Am Med Dir Assoc. (2022) 23:1719.e1. doi: 10.1016/j.jamda.2022.07.015
11. Wills, AM, Pérez, A, Wang, J, Su, X, Morgan, J, and Rajan, SS. Association between change in body mass index, unified Parkinson's disease rating scale scores, and survival among persons with Parkinson disease: secondary analysis of longitudinal data from NINDS exploratory trials in Parkinson disease long-term study 1. JAMA Neurol. (2016) 73:321–8. doi: 10.1001/jamaneurol.2015.4265
12. Park, K, Oeda, T, Kohsaka, M, Tomita, S, Umemura, A, and Sawada, H. Low body mass index and life prognosis in Parkinson's disease. Parkinsonism Relat Disord. (2018) 55:81–5. doi: 10.1016/j.parkreldis.2018.05.011
13. St Louis, EK, and Boeve, BF. REM sleep behavior disorder: diagnosis, clinical implications, and future directions. Mayo Clin Proc. (2017) 92:1723–36. doi: 10.1016/j.mayocp.2017.09.007
14. Dauvilliers, Y, Schenck, CH, Postuma, RB, Iranzo, A, Luppi, PH, Plazzi, G, et al. REM sleep behaviour disorder. Nat Rev Dis Primers. (2018) 4:19. doi: 10.1038/s41572-018-0016-5
15. Postuma, RB, Iranzo, A, Hu, M, Högl, B, Boeve, BF, Manni, R, et al. Risk and predictors of dementia and parkinsonism in idiopathic REM sleep behaviour disorder: a multicentre study. Brain. (2019) 142:744–59. doi: 10.1093/brain/awz030
16. Ren, L, Chang, L, Kang, Y, Zhao, Y, Chen, F, and Pei, L. Gender-specific association between sleep duration and body mass index in rural China. Front Endocrinol. (2022) 13:877100. doi: 10.3389/fendo.2022.877100
17. Parkinson Progression Marker Initiative. The Parkinson progression marker initiative (PPMI). Prog Neurobiol. (2011) 95:629–35. doi: 10.1016/j.pneurobio.2011.09.005
18. Flegal, KM, Graubard, BI, Williamson, DF, and Gail, MH. Excess deaths associated with underweight, overweight, and obesity. JAMA. (2005) 293:1861–7. doi: 10.1001/jama.293.15.1861
19. Razak, F, Anand, SS, Shannon, H, Vuksan, V, Davis, B, Jacobs, R, et al. Defining obesity cut points in a multiethnic population. Circulation. (2007) 115:2111–8. doi: 10.1161/CIRCULATIONAHA.106.635011
20. Stiasny-Kolster, K, Mayer, G, Schäfer, S, Möller, JC, Heinzel-Gutenbrunner, M, and Oertel, WH. The REM sleep behavior disorder screening questionnaire—a new diagnostic instrument. Mov Disord. (2007) 22:2386–93. doi: 10.1002/mds.21740
21. Wu, Z, Wu, J, Xie, C, Wang, L, Li, H, Zhang, M, et al. Risk factors for rapid eye-movement sleep-related behavioral disorders (RBDs): a systematic review and a meta-analysis. Gen Hosp Psychiatry. (2022) 79:118–27. doi: 10.1016/j.genhosppsych.2022.10.009
22. White, IR, Royston, P, and Wood, AM. Multiple imputation using chained equations: issues and guidance for practice. Stat Med. (2011) 30:377–99. doi: 10.1002/sim.4067
23. Durrleman, S, and Simon, R. Flexible regression models with cubic splines. Stat Med. (1989) 8:551–61. doi: 10.1002/sim.4780080504
24. Hamza, T, Furukawa, TA, Orsini, N, Cipriani, A, Iglesias, CP, and Salanti, G. A dose-effect network meta-analysis model with application in antidepressants using restricted cubic splines. Stat Methods Med Res. (2022) 9622802211070256:70256. doi: 10.1177/09622802211070256
25. Shin, C, Park, MH, Lee, SH, Ko, YH, Kim, YK, Han, KM, et al. Usefulness of the 15-item geriatric depression scale (GDS-15) for classifying minor and major depressive disorders among community-dwelling elders. J Affect Disord. (2019) 259:370–5. doi: 10.1016/j.jad.2019.08.053
26. Tolosa, E, Garrido, A, Scholz, SW, and Poewe, W. Challenges in the diagnosis of Parkinson’s disease. Lancet Neurol. (2021) 20:385–97. doi: 10.1016/S1474-4422(21)00030-2
27. de Simone, G, Mancusi, C, Hanssen, H, Genovesi, S, Lurbe, E, Parati, G, et al. Hypertension in children and adolescents. Eur Heart J. (2022) 43:3290–301. doi: 10.1093/eurheartj/ehac328
28. Zhou, A, and Hypponen, E. Long-term coffee consumption, caffeine metabolism genetics, and risk of cardiovascular disease: a prospective analysis of up to 347,077 individuals and 8368 cases. Am J Clin Nutr. (2019) 109:509–16. doi: 10.1093/ajcn/nqy297
29. Zhuang, L, Yang, Y, and Gao, J. Cognitive assessment tools for mild cognitive impairment screening. J Neurol. (2021) 268:1615–22. doi: 10.1007/s00415-019-09506-7
30. Sauerbier, A, Jenner, P, Todorova, A, and Chaudhuri, KR. Non motor subtypes and Parkinson’s disease. Parkinsonism Relat Disord. (2016) 22:S41–6. doi: 10.1016/j.parkreldis.2015.09.027
31. Zheng, LF, Zhang, Y, Chen, CL, Song, J, Fan, RF, Cai, QQ, et al. Alterations in TH-and ChAT-immunoreactive neurons in the DMV and gastric dysmotility in an LPS-induced PD rat model. Auton Neurosci. (2013) 177:194–8. doi: 10.1016/j.autneu.2013.04.012
32. McHill, AW, and Wright, KP. Role of sleep and circadian disruption on energy expenditure and in metabolic predisposition to human obesity and metabolic disease. Obes Rev. (2017) 18:15–24. doi: 10.1111/obr.12503
33. Schmid, SM, Hallschmid, M, Jauch-Chara, K, Bandorf, N, Born, J, and Schultes, B. Sleep loss alters basal metabolic hormone secretion and modulates the dynamic counterregulatory response to hypoglycemia. J Clin Endocrinol Metab. (2007) 92:3044–51. doi: 10.1210/jc.2006-2788
34. Rutters, F, Gonnissen, HK, Hursel, R, Lemmens, SG, Martens, EA, and Westerterp-Plantenga, MS. Distinct associations between energy balance and the sleep characteristics slow wave sleep and rapid eye movement sleep. Int J Obes. (2012) 36:1346–52. doi: 10.1038/ijo.2011.250
35. Liu, M, Jiao, Q, Du, X, Bi, M, Chen, X, and Jiang, H. Potential crosstalk between Parkinson’s disease and energy metabolism. Aging Dis. (2021) 12:2003–15. doi: 10.14336/AD.2021.0422
36. Long, K, Wan, C, Xiang, Y, Liu, J, Xu, Q, Sun, Q, et al. Study on the clinical features of Parkinson's disease with probable rapid eye movement sleep behavior disorder. Front Neurol. (2020) 11:979. doi: 10.3389/fneur.2020.00979
37. Fang, H, Tu, S, Sheng, J, and Shao, A. Depression in sleep disturbance: a review on a bidirectional relationship, mechanisms and treatment. J Cell Mol Med. (2019) 23:2324–32. doi: 10.1111/jcmm.14170
38. Wang, YQ, Li, R, Zhang, MQ, Zhang, Z, Qu, WM, and Huang, ZL. The neurobiological mechanisms and treatments of REM sleep disturbances in depression. Curr Neuropharmacol. (2015) 13:543–53. doi: 10.2174/1570159x13666150310002540
39. McCall, WV, Blocker, JN, D’Agostino, R Jr, Kimball, J, Boggs, N, Lasater, B, et al. Treatment of insomnia in depressed insomniacs: effects on health-related quality of life, objective and self-reported sleep, and depression. J Clin Sleep Med. (2010) 06:322–9. doi: 10.5664/jcsm.27872
40. Adrien, J. Neurobiological bases for the relation between sleep and depression. Sleep Med Rev. (2002) 6:341–51. doi: 10.1053/smrv.2001.0200
41. Irwin, MR, and Cole, SW. Reciprocal regulation of the neural and innate immune systems. Nat Rev Immunol. (2011) 11:625–32. doi: 10.1038/nri3042
42. Ma, LL, Wang, YY, Yang, ZH, Huang, D, Weng, H, and Zeng, XT. Methodological quality (risk of bias) assessment tools for primary and secondary medical studies: what are they and which is better? Mil Med Res. (2020) 7:7. doi: 10.1186/s40779-020-00238-8
43. Wang, MC, and Yang, Y. Complexity and bias in cross-sectional data with binary disease outcome in observational studies. Stat Med. (2020) 40:950–62. doi: 10.1002/sim.8812
44. Page, MJ, and Higgins, JP. Rethinking the assessment of risk of bias due to selective reporting: a cross-sectional study. Syst Rev. (2016) 5:108. doi: 10.1186/s13643-016-0289-2
Glossary
Keywords: body mass index, rapid eye movement sleep behavior disorder, Parkinson’s disease, Parkinson’s progression markers initiative, restricted cubic spline
Citation: Gu S-C, Yuan X-L, Yin P, Li Y-Y, Wang C-D, Gu M-J, Xu L-M, Gao C, Wu Y, Hu Y-Q, Yuan C-X, Cao Y and Ye Q (2024) Association of body mass index with rapid eye movement sleep behavior disorder in Parkinson’s disease. Front. Neurol. 15:1388131. doi: 10.3389/fneur.2024.1388131
Edited by:
Keisuke Suzuki, Dokkyo Medical University, JapanReviewed by:
Xiaoli Shen, Qingdao University Medical College, ChinaAnastasia Bougea, National and Kapodistrian University of Athens, Greece
Copyright © 2024 Gu, Yuan, Yin, Li, Wang, Gu, Xu, Gao, Wu, Hu, Yuan, Cao and Ye. This is an open-access article distributed under the terms of the Creative Commons Attribution License (CC BY). The use, distribution or reproduction in other forums is permitted, provided the original author(s) and the copyright owner(s) are credited and that the original publication in this journal is cited, in accordance with accepted academic practice. No use, distribution or reproduction is permitted which does not comply with these terms.
*Correspondence: Yang Cao, cindy8813966@126.com; Qing Ye, 1273313618@qq.com
†These authors have contributed equally to this work and share first authorship