 Kah Hui Yap1
 Hanani Abdul Manan2,3*
 Noorazrul Yahya4
 Shahrul Azmin1
 Shahizon Azura Mohamed Mukari2
 Norlinah Mohamed Ibrahim1
- 1Department of Medicine, Universiti Kebangsaan Malaysia (UKM) Medical Centre, Kuala Lumpur, Malaysia
- 2Makmal Pemprosesan Imej Kefungsian, Department of Radiology, Universiti Kebangsaan Malaysia (UKM) Medical Centre, Kuala Lumpur, Malaysia
- 3Department of Radiology and Intervency, Hospital Pakar Kanan-Kanak, Children Specialist Hospital, Universiti Kebangsaan Malaysia (UKM), Kuala Lumpur, Malaysia
- 4School of Diagnostic and Applied Health Sciences, Faculty of Health Sciences, National University of Malaysia, Kuala Lumpur, Malaysia
Background: Spinocerebellar ataxia type 3 (SCA3) is a complex cerebrocerebellar disease primarily characterized by ataxia symptoms alongside motor and cognitive impairments. The heterogeneous clinical presentation of SCA3 necessitates correlations between magnetic resonance imaging (MRI) and clinical findings in reflecting progressive disease changes. At present, an attempt to systematically examine the brain-behavior relationship in SCA3, specifically, the correlation between MRI and clinical findings, is lacking.
Objective: We investigated the association strength between MRI abnormality and each clinical symptom to understand the brain-behavior relationship in SCA3.
Methods: We conducted a systematic review on Medline and Scopus to review studies evaluating the brain MRI profile of SCA3 using structural MRI (volumetric, voxel-based morphometry, surface analysis), magnetic resonance spectroscopy, and diffusion tensor imaging, including their correlations with clinical outcomes.
Results: Of 1,767 articles identified, 29 articles met the eligibility criteria. According to the National Institutes of Health quality assessment tool for case-control studies, all articles were of excellent quality. This systematic review found that SCA3 neuropathology contributes to widespread brain degeneration, affecting the cerebellum and brainstem. The disease gradually impedes the cerebral cortex and basal ganglia in the late stages of SCA3. Most findings reported moderate correlations (r = 0.30–0.49) between MRI features in several regions and clinical findings. Regardless of the MRI techniques, most studies focused on the brainstem and cerebellum.
Conclusions: Clinical findings suggest that rather than individual brain regions, the connectivity between different brain regions in distributed networks (i.e., cerebellar-cerebral network) may be responsible for motor and neurocognitive function in SCA3. This review highlights the importance of evaluating the progressive changes of the cerebellar-cerebral networks in SCA3 patients, specifically the functional connectivity. Given the relative lack of knowledge about functional connectivity on SCA3, future studies should investigate possible functional connectivity abnormalities in SCA3 using fMRI.
Introduction
Spinocerebellar ataxia type 3 (SCA3) is the most common dominantly inherited ataxia worldwide (Paulson, 2012). SCA3 neuropathology involves mutation of cytosine-adenine-guanine (CAG) repeat in the ATXN3 gene that codes for the ataxin-3 protein. This elongated polyglutamine tract formed protein aggregates primarily deposited and resulted in cerebellar cell deaths (Pedroso et al., 2013). As a result, SCA3 is primarily characterized by progressive cerebellar degeneration, resulting in increasingly worsening ataxia symptoms, including gait abnormalities, dysarthria, and abnormal eye movements (Bodranghien et al., 2016). Ataxia severity is commonly measured using the Scale for the Assessment and Rating of Ataxia (SARA; 0–40) and the International Cooperative Ataxia Rating Scale (ICARS; 0–100) (Zhou et al., 2011). Apart from the cerebellum, individual differences in the extracerebellar involvement further contribute to the varying degree of ataxia, non-ataxia, and cognitive impairment in SCA3 (Lindsay and Storey, 2017). In addition, the severity of ataxia may exacerbate the cognitive impairment on pen-and-paper tests (Yap et al., 2022b). Therefore, clinical measures alone might not reflect progressive disease changes, requiring correlations with objective measures such as magnetic resonance imaging (MRI) (Döhlinger et al., 2008).
Magnetic resonance imaging has many advantages, including high spatial resolution, and is capable of morphological and functional imaging. Advanced MRI techniques are able to assess structural and volumetric changes, metabolic alterations (magnetic resonance spectroscopy; MRS), white matter integrity (diffusion-tensor imaging; DTI), and functional abnormalities (task-based and resting-state functional MRI; fMRI) (Currie et al., 2013). These neuroimages may provide biologically-relevant measures that may be valuable biomarkers for spinocerebellar ataxia (SCA) (Adanyeguh et al., 2018).
MRI structural abnormalities have been widely reported in SCA3 and correlations with clinical findings have been explored (Wan et al., 2020). However, functional connectivity abnormalities have been poorly assessed and there is a relative lack of knowledge about fMRI application on SCA3. A recent review has discussed the relationship between MRI structural abnormalities, disease severity, CAG repeats, and disease duration qualitatively (Wan et al., 2020). However, an attempt to systematically examine the association between brain regions and clinical scales is lacking (Wan et al., 2020). Therefore, understanding the association strength between MRI abnormality and each clinical symptom will help understand the brain-behavior relationship in SCA3. We systematically reviewed published articles that have evaluated the brain MRI profile of SCA3, including studies that reported correlations with clinical outcomes. We aimed to identify brain regions responsible for motor and cognitive decline in SCA3, respectively.
Methods
Search Strategy
We performed a literature search using two electronic databases: Medline (Ovid) and Scopus. The search identified articles providing information on the brain MRI profile of SCA3 with or without comparisons against healthy comparisons (HC). We included only original articles written in English and reported human studies. To avoid selection bias, we excluded articles with fewer than 12 participants in each group (i.e., SCA3 vs. HC) (Szucs and Ioannidis, 2020). We also excluded studies that used MRI with <1.5 Tesla field (T) to minimize the risk of Type II error. We considered 1.5 and 3.0 T MRI as equal there was little difference in the diagnostic accuracy (Wardlaw et al., 2012). We searched the articles on March 23, 2021, using Medical Subject Headings (MeSH) terms such as “SCA3” and “Machado-Joseph disease,” coupled with terms related to MRI, such as “volumetric,” “morphometric,” “functional,” “resting-state,” “magnetic resonance,” “spectroscopy” “diffusion tensor imaging,” “tractography,” “MRI,” “DTI,” “white matter,” and “gray matter.”
Data Extraction and Analysis
The first author performed an initial eligibility screening by going through the titles and abstracts of 1,767 initially identified articles, then cross-checked by another author. As illustrated in Figure 1, we adhered to the Preferred Reporting Items for Systematic Review and Meta-Analyses (PRISMA) reporting guidelines (Page et al., 2021). Finally, we included a total of 29 articles in this review. Twenty papers examined structural MRI [volumetric: n = 12 (Bürk et al., 1996; Etchebehere et al., 2001; Yoshizawa et al., 2003; Liang et al., 2009; Schulz et al., 2010; Camargos et al., 2011; D'Abreu et al., 2011; Ogawa et al., 2012; De Rezende et al., 2015; Nunes et al., 2015; Rezende et al., 2018; Jao et al., 2019b), voxel-based morphometry (VBM): n = 8 (Schulz et al., 2010; D'Abreu et al., 2012; Guimarães et al., 2013; Lopes et al., 2013; Kang et al., 2014; Hernandez-Castillo et al., 2017; Peng et al., 2019; Guo et al., 2020), and surface analysis: n = 4 (De Rezende et al., 2015; Nunes et al., 2015; Rezende et al., 2018; Arruda et al., 2020)], seven papers examined MRS (Lei et al., 2011; Lirng et al., 2012; Wang et al., 2012; Lopes et al., 2013; Chen et al., 2014; Adanyeguh et al., 2015; Peng et al., 2019), and ten papers examined DTI (Guimarães et al., 2013; Lopes et al., 2013; Kang et al., 2014; Nunes et al., 2015; Wu et al., 2017; Rezende et al., 2018; Jao et al., 2019a; Peng et al., 2019; Meira et al., 2020; Inada et al., 2021). We summarized findings in Supplementary Table 3 and outlined the details in Supplementary Table 2. Subsequently, we synthesized the findings into two parts: (1) Difference in MRI-related findings between SCA3 and HC, and (2) MRI-related findings and their correlation with clinical scales in SCA3, specifically, ataxia, non-ataxia, and cognitive function. Due to the lack of findings, that is, three or fewer articles, we only discussed these findings concerning avenues for future studies, if applicable: 3D fractal dimension (3D-FD) analysis: n = 3 (Huang et al., 2017; Jao et al., 2019b; Wang et al., 2020), texture analysis: n = 1 (De Oliveira et al., 2010), relaxometry: n = 1 (Guimarães et al., 2013), and neuromelanin contrast: n = 1 (Nakata et al., 2020), and task-based fMRI (Duarte et al., 2016).
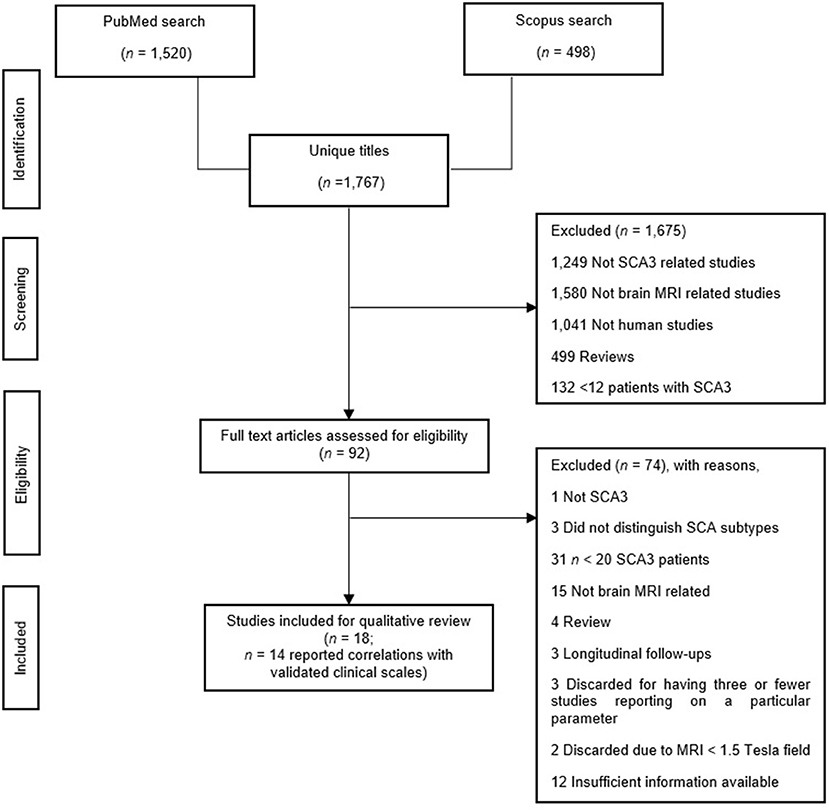
Figure 1. Study search in accordance with the PRISMA guideline (Page et al., 2021).
As per the National Health Medical Research Council guidelines (National Health Medical Research Council, 2009), we classified all 29 studies as Level III-2 evidence. We adapted the National Institutes of Health quality assessment tool for case-control studies (National Institutes of Health, 2019). The results, displayed in Supplementary Table 1, showed that all studies were of excellent quality due to the consistent use of standardized diagnostic criteria in screening SCA3 patients and HC.
In the present review, we were interested in the outcomes of validated clinical scales, including the SARA and ICARS for ataxia severity and well-established neuropsychological tests for cognitive impairment. We did not consider outcomes derived from subscales from SARA and ICARS. In addition, screening tests usually lack validation and may be vulnerable to ceiling effects, making them relatively insensitive when used in isolation. Such screening tests included Mini-Mental State Examination (Franco-Marina et al., 2010) and the Montreal Cognitive Assessment (Smith et al., 2007).
The correlation coefficient, r, was recorded as the correlation between the clinical and MRI outcomes in SCA3. The r values of 0.10, 0.30, and 0.50 indicate small, moderate, and strong correlations, respectively (Cohen, 2013). In this review, a larger r indicated a stronger correlation between clinical and MRI outcomes in SCA3 (Cohen, 2013). Given the nature of the tests (e.g., higher scores in SARA indicate greater severity, whereas higher scores in ICARS indicate a lower severity), we only considered the absolute values. We did not consider studies that reported correlation without providing the r values.
Results
SCA3 vs. Healthy Comparisons
Structural MRI
Cerebrum (Cortical)
Two studies analyzed the volumetric changes in the cortical regions of SCA3 patients (Schulz et al., 2010; Jao et al., 2019b). Both studies reported atrophy in the temporal lobe. While the first study reported atrophy in the frontal, parietal, and occipital lobes (Jao et al., 2019b), the second study reported non-significant increased volume in these regions (Schulz et al., 2010).
Six studies analyzed the VBM changes in the cortical regions' gray matter volume (GMV) (Schulz et al., 2010; D'Abreu et al., 2012; Lopes et al., 2013; Hernandez-Castillo et al., 2017; Peng et al., 2019; Guo et al., 2020). While a study reported no change in the overall GMV in the cerebral hemisphere (Schulz et al., 2010), reduced GMV were reported separately in cerebral lobes, including frontal (precentral gyrus, and superior, medial, and inferior frontal gyri), parietal (postcentral gyrus, superior, and inferior parietal lobes, and association cortex), temporal (insula, fusiform gyrus, and middle, and superior temporal gyri), and occipital (lingual gyrus, cuneus, and occipital gyri) lobes. Lack of change in the GMV of the overall cerebral hemispheres may suggest that individual difference in the SCA3 neuropathology differentially affects the cortical regions, which may explain heterogeneous clinical manifestation across SCA3 patients (Pedroso et al., 2013). Alternatively, using a small sample size (nSCA3 = 24 vs. nHC = 31) and four different scanners may contribute to the methodological limitation that may explain the null finding (Schulz et al., 2010).
Four studies analyzed the surface of the cortical regions (De Rezende et al., 2015; Nunes et al., 2015; Rezende et al., 2018; Arruda et al., 2020). These studies reported reduced cortical thickness in the frontal (precentral and superior frontal gyri), temporal (superior temporal gyrus), and occipital lobes. While surface analysis selectively investigates cortical thickness, VBM provides a composite measure of GMV, including cortical surface area or cortical folding, as well as cortical thickness (Hutton et al., 2009). This difference between VBM and surface analysis may explain the inconsistent findings regarding the GMV of the parietal lobe; that is, reduced cortical folding and surface area contributes to the GMV loss in the parietal lobe. Conversely, a relatively preserved cortical thickness in the parietal lobe may only be affected later in the SCA3 pathology.
Cerebrum (Subcortical)
Five studies analyzed the volumetric changes in the subcortical regions of SCA3 patients (D'Abreu et al., 2011; De Rezende et al., 2015; Nunes et al., 2015; Rezende et al., 2018; Jao et al., 2019b). These studies reported atrophy in the diencephalon (ventral diencephalon and thalamus), limbic system (limbic lobe and hippocampus), basal ganglia (globus pallidus, putamen, caudate, and substantia nigra), and lenticular fasciculus.
Six studies analyzed the VBM changes in the GMV of subcortical regions (Schulz et al., 2010; D'Abreu et al., 2012; Guimarães et al., 2013; Lopes et al., 2013; Kang et al., 2014; Guo et al., 2020). All studies consistently reported reduced GMV in the limbic system (limbic lobe and posterior cingulate), and claustrum. Three studies reported reduced GMV in the basal ganglia (lentiform nucleus, caudate, and putamen), absent in the remaining study characterized by a smaller sample size and the use of four different scanners (Schulz et al., 2010).
Only one study analyzed and reported reduced cortical thickness of the limbic system (posterior cingulate) (Rezende et al., 2018). This scarcity in research is likely because while theory and convention informed the classification of the limbic system under the subcortical region (Berkowitz, 2016), the limbic system involves cortical structures (Rolls, 2015). This classification may explain the scarcity of surface analysis on the limbic system.
Brainstem
Nine studies analyzed the volumetric changes in the brainstem of SCA3 patients (Bürk et al., 1996; Yoshizawa et al., 2003; Liang et al., 2009; Schulz et al., 2010; Camargos et al., 2011; Ogawa et al., 2012; De Rezende et al., 2015; Nunes et al., 2015; Rezende et al., 2018). These studies reported widespread atrophy in the overall brainstem, including pons, midbrain, and medulla. Two studies reported atrophy in the midbrain, while one study did not show any changes in the aforementioned brain regions (Liang et al., 2009). While the sample size may not explain the discrepancy in findings, the difference in the brain structure across ethnicity may be contributory (i.e., East Asian vs. Western) (Tang et al., 2018).
Six studies analyzed the VBM changes in the GMV of the brainstem (Schulz et al., 2010; D'Abreu et al., 2012; Guimarães et al., 2013; Kang et al., 2014; Hernandez-Castillo et al., 2017; Peng et al., 2019). These studies consistently reported reduced GMV in the overall brainstem, including medulla, midbrain, and pyramids. Conversely, three studies reported reduced GMV in the pons, while one did not. A smaller sample size may explain the absence of reduced GMV in the pons (Schulz et al., 2010). Similar to the GMV in the brainstem, the overall brainstem also showed reduced WBV, including medulla, pyramids, pons, and midbrain.
Cerebellum
Ten studies analyzed the volumetric changes in the cerebellum of SCA3 patients (Bürk et al., 1996; Etchebehere et al., 2001; Liang et al., 2009; Schulz et al., 2010; Camargos et al., 2011; Ogawa et al., 2012; De Rezende et al., 2015; Nunes et al., 2015; Rezende et al., 2018; Jao et al., 2019b). These studies consistently reported atrophy in the overall cerebellum, including cerebellar hemispheres and vermis.
Eight studies analyzed the VBM changes in the GMV of the cerebellum (Schulz et al., 2010; D'Abreu et al., 2012; Guimarães et al., 2013; Lopes et al., 2013; Kang et al., 2014; Hernandez-Castillo et al., 2017; Peng et al., 2019; Guo et al., 2020). These studies consistently reported reduced GMV in the cerebellum, including cerebellar hemispheres (cerebellar hemispheres, tonsil, and inferior semilunar lobule) and vermis (overall, culmen, declive, uvula, fastigium, and tuber). On the other hand, two studies analyzed the white matter volume (WMV) (Schulz et al., 2010; Guimarães et al., 2013). These studies reported reduced WMV in the overall cerebellum, including left cerebellar hemisphere, vermis (tonsil, dentate, uvula, fastigium, and tuber, sparing the nodule), and cerebellar peduncles.
Summary
SCA3 neuropathology involves widespread atrophy across the brain, including cortical and subcortical cerebral regions, brainstem, and cerebellum. The present findings suggest that the volumetric loss in the cerebrum involved both GMV loss and cortical thinning. On the other hand, findings on the brainstem and cerebellum implicated that the volumetric loss in these regions is not restricted to GMV loss; WMV loss is similarly prominent in these regions (Schulz et al., 2010; Guimarães et al., 2013). Future studies may investigate the difference between GMV and WMV loss in the cerebrum, contributing to the heterogeneous clinical profile in SCA3 patients.
MRS
The levels of N-acetyl aspartate (NAA), glutamate (Glu), Choline (Cho), myo-Inositol (myo-Ins), and Creatinine (Cr) are the primary metabolites being studied. NAA and Glu concentration reflects the neuronal viability and integrity, in which reduced concentrations indicate neuronal and axonal injury or loss (Moffett et al., 2007). Cho is a precursor of acetylcholine and is essential for cell membrane and neurotransmitter metabolism. Myo-Ins is a biomarker for glial activation in response to neuronal injury and degeneration (Duarte et al., 2012). Cr reflects brain energy metabolism and is relatively stable under normal conditions, serving as a reference for comparison (Lirng et al., 2012).
Cerebrum (Subcortical)
Only one study analyzed and reported reduced NAA/Cr and NAA/Cho in the diencephalon (thalamus) of SCA3 patients (Peng et al., 2019). The same study reported no change of NAA/Cr in the basal ganglia (putamen) (Peng et al., 2019).
Brainstem
Only one study reported reduced NAA and glutamate (Glu) and increased Cr and myo-Ins in the brainstem (pons) (Adanyeguh et al., 2015). The finding suggests that changes in NAA/Cr ratio in the pons may represent a better early biomarker for SCA3 neuropathology (Adanyeguh et al., 2015; Peng et al., 2019). Consistently, changes in the pons, alongside the cerebellum, are promising biomarkers for the disease progression in SCA3 (Adanyeguh et al., 2018).
Cerebellum
Six studies analyzed the metabolic changes in the cerebellum of SCA3 patients (Lei et al., 2011; Lirng et al., 2012; Wang et al., 2012; Chen et al., 2014; Adanyeguh et al., 2015; Peng et al., 2019). One study reported reduced NAA and Glu and increased Cr and myo-Ins in the vermis (Adanyeguh et al., 2015). The remaining studies consistently reported reduced NAA/Cr in the cerebellar hemispheres, vermis (overall and dentate), and middle cerebellar peduncles. Four studies reported reduced NAA/Cho in the cerebellar hemispheres, vermis (overall and dentate), and middle cerebellar peduncles.
Conversely, while four studies reported no change in the Cho/Cr in the overall cerebellum (Lei et al., 2011; Lirng et al., 2012; Wang et al., 2012; Chen et al., 2014), a study reported reduced Cho/Cr in the vermis (Peng et al., 2019). This finding suggests that the SCA3 neuropathology may affect the vermis in the early stage of the disease. The vermis is typically more affected than the cerebellar hemispheres in genetic disorders (Aldinger and Doherty, 2016), although this finding has not been replicated in the SCA3 population.
A study reported that the following metabolites were reduced in the cerebellum: NAA/Total Cr (Cr+PCr) ratio, NAA+N-acetyl-aspartyl-glutamate (NAA+NAAG)/Cr+PCr ratio, and glutamine (Glx)/Cr+PCr ratio (Lopes et al., 2013). The same study also reported that the following metabolites did not change in the cerebellum: Glu/Cr+PCr ratio, phosphorylcholine (PCh)/Cr+PCr ratio, and myo-Ins/Cr+PCr ratio (Lopes et al., 2013).
Summary
While far from being a sensitive biomarker, MRS findings may explain the metabolic changes and neuronal dysfunction before the neuronal loss and clinical manifestation of SCA3 (Chen et al., 2014). Reduced NAA and Glu primarily present in the pons and vermis of SCA3 patients imply reduced metabolism and neuronal loss in these regions (Adanyeguh et al., 2015). Conversely, increased myo-Ins is likely a response to the degenerative nature of SCA3, while increased Cr may be a compensatory response to maintain the energy supply of brain tissue (Brewer and Wallimann, 2000). The lack of studies on the absolute concentration of individual metabolites compared to metabolite ratios is likely because the latter offers a more robust approach in accounting for a small sample size (Hoch et al., 2017).
Overall, reduced metabolism primarily involves the brainstem (pons) and cerebellum (vermis). These findings may represent an early biomarker of the SCA3 neuropathology that precedes structural loss. Compared to its structural counterpart, MRS studies using individual metabolites on the cerebrum of SCA3 are lacking. Likewise, several metabolite ratios were preliminary and deserved further study (Lopes et al., 2013).
DTI
We only considered fractional anisotropy (FA) to represent a reliable marker for DTI changes (Bennett et al., 2010). Fractional anisotropy (FA) is sensitive to microstructural changes, reflecting white matter fiber density, axonal diameter, and myelination. A higher FA indicates greater white matter integrity and vice versa (Dong et al., 2012).
Cerebrum (Cortical)
Four studies reported reduced FA in the frontal (precentral and middle frontal gyri), parietal (postcentral gyrus temporal), and occipital lobes (Kang et al., 2014; Rezende et al., 2018; Jao et al., 2019a; Inada et al., 2021).
Cerebrum (Subcortical)
Five studies reported reduced FA in the corona radiata, internal and external capsules, thalamic radiation, forceps, cingulate fasciculus, parietal-temporal superior and inferior longitudinal fasciculus, and corpus callosum (Kang et al., 2014; Rezende et al., 2018; Jao et al., 2019a; Meira et al., 2020; Inada et al., 2021).
Brainstem
Eight studies analyzed the FA changes in the brainstem (Guimarães et al., 2013; Lopes et al., 2013; Kang et al., 2014; Wu et al., 2017; Rezende et al., 2018; Jao et al., 2019a; Meira et al., 2020; Inada et al., 2021). These studies reported reduced FA in the brainstem (overall and pons). Regarding the tracts, studies reported reduced FA in the cortical-spinal tract, lemniscus, and pons crossing tract.
Cerebellum
Seven studies analyzed the FA changes in the cerebellum (Guimarães et al., 2013; Kang et al., 2014; Wu et al., 2017; Rezende et al., 2018; Jao et al., 2019a; Peng et al., 2019; Inada et al., 2021). A study reported reduced FA in the cerebellar hemispheres and vermis (nodule, culmen, dentate, fastigium, and lingual) (Guimarães et al., 2013). Regarding the tracts, studies reported reduced FA in the cerebellar peduncles (overall, superior, middle, and inferior cerebellar peduncles).
Summary
DTI studies reported a widespread decrease in FA in the white matter across the whole brain, with relatively more studies in the cerebellum and the brainstem. These studies also reported white matter abnormalities in several fiber pathways. These fibers typically involved cerebellar connecting tracts, including cerebellar peduncles, thalamic radiations, and cortical-spinal tract. These findings suggest that apart from individual brain regions that are impaired, disrupted connectivity between cerebellum from other brain regions is equally contributory to the clinical manifestations in SCA3.
MRI vs. Clinical Correlations in SCA3
Motor (Ataxia)
Structural MRI
Cerebrum (Cortical). A study reported that ataxia severity using SARA moderately correlates with GMV of frontal (precentral gyrus: r = −0.30, middle frontal cortex: r = −0.33, paracentral lobule: r = −0.31), and temporal (transverse temporal gyrus: r = −0.30, superior temporal sulcus: r = −0.35, transverse temporal cortex: r = −0.35) lobes (De Rezende et al., 2015). Another study showed that ataxia severity using ICARS moderately correlates with the GMV of occipital (r = 0.44) lobes, and strongly correlates with the GMV of the frontal (r = 0.62), parietal (r = 0.57), temporal (r = 0.72) lobes (D'Abreu et al., 2012). The findings showed that the correlations were more consistent using SARA; the r ranged between −0.35 and −0.30. Before attributing the findings to the differences in clinical scales, it is important to rule out potential confounding factors. Specifically, one study correlates SARA scores with specific regions (e.g., gyrus) (De Rezende et al., 2015), whereas another study correlates ICARS with the entire lobe (D'Abreu et al., 2012).
Cerebrum (Subcortical). Two studies reported correlations between changes in the subcortical regions and ataxia severity using SARA (Schulz et al., 2010; De Rezende et al., 2015). A study reported that ataxia severity moderately correlates with the volumetric changes in the dorsal striatum (r = −0.36); the correlation was marginally stronger when only the caudate nucleus was taken into account (r = −0.46) (Schulz et al., 2010). Another study reported strong correlations between SARA and the volumetric changes in the diencephalon (right: r = 0.58, left: r = 0.64, thalamus: r = 0.62) (De Rezende et al., 2015). Consistent with the findings, the caudate nucleus and thalamus are among the subcortical regions most affected in SCA3 (Meira et al., 2020). Degeneration in the thalamus may contribute to the severity of ataxia (Rüb et al., 2003). On the other hand, striatal degeneration may result in parkinsonism in SCA3 (Nunes et al., 2015), confounding the SARA scores.
Brainstem. Ataxia severity using SARA moderately correlates with the volumetric changes in the midbrain (r = −0.47) and medulla (r = −0.48), and strongly correlates with the volumetric changes in the total brainstem (r = −0.58 ~ −0.68) (Schulz et al., 2010; De Rezende et al., 2015), and pons (r = −0.56) (Schulz et al., 2010). Similarly, ICARS strongly correlates with volumetric changes in the total brainstem (r = −0.62), midbrain (r = −0.53) and pons (r = −0.57 ~ −0.68) (Liang et al., 2009; Camargos et al., 2011).
Cerebellum. Ataxia severity using SARA moderately correlates with the volumetric changes in the total cerebellum (r = −0.42 ~ −0.45) (Liang et al., 2009; Schulz et al., 2010) and cerebellar hemispheres (r = −0.46) (Schulz et al., 2010). Similarly, ataxia severity using ICARS moderately correlates with the volumetric changes in the right hemisphere (r = −0.49), while strongly correlates with the volumetric changes in the total cerebellum (r = −0.60), left hemisphere (r = −0.63), and vermis (r = −0.52) (Camargos et al., 2011). Likewise, ataxia severity using ICARS strongly correlates with the GMV of the total cerebellum (r = 0.73) (D'Abreu et al., 2012). Lastly, a study showed that the SARA moderately correlates with the WMV of the cerebellum (r = −0.46) (Arruda et al., 2020). The discrepancy in the r suggests that GMV of the total cerebellum may represent a more sensitive biomarker than volumetric changes and WMV for ataxia severity in SCA3.
Summary. Overall, the findings are consistent with a previous finding that both SARA and ICARS are similarly reliable and effective in assessing ataxia severity in SCA3 (Zhou et al., 2011). More studies, exploring correlations between SARA and ICARS and MRI abnormalities, are needed to confirm the findings. Nevertheless, the results are consistent with the body of evidence that structural loss in the cerebellum and brainstem, especially the GMV, contribute toward ataxia severity in SCA3 (Eichler et al., 2011). Thalamus atrophy may exacerbate ataxia severity in SCA3 (Rüb et al., 2003). Interestingly, ataxia severity in SCA3 was also associated with cortical atrophy, to which further investigations are needed to examine its role in ataxia.
MRS
Brainstem. Ataxia severity using SARA strongly correlates with NAA (r = −0.82), Cr (r = 0.64), and myo-Ins (r = 0.69) in the brainstem (Adanyeguh et al., 2015).
Cerebellum. Ataxia severity using SARA showed no correlation between SARA and NAA/Cr ratio in the total cerebellum (Wang et al., 2012; Adanyeguh et al., 2015). However, when examining specific cerebellar regions, SARA moderately correlates with the NAA/Cr ratio in the dentate nucleus (r = 0.45) and strongly correlates with the middle cerebellar peduncle (r = 0.95) (Lei et al., 2011). Ataxia severity using ICARS moderately correlates with NAA/Cr in the middle cerebellar peduncle (r = −0.45) and strongly correlates with the dentate nucleus (r = −0.50) (Peng et al., 2019). The discrepancy in findings using different clinical measures provides an avenue for future study on the reliability of SARA and ICARS in correlating with the NAA/Cr ratio.
Ataxia severity using SARA showed no correlation between SARA and Cho/Cr ratio in the total cerebellum (Wang et al., 2012; Adanyeguh et al., 2015). Regarding specific cerebellar regions, SARA moderately correlates with Cho/Cr ratio in the cerebellar hemispheres (r = −0.39) and dentate nucleus (r = 0.36), and strongly correlates with the vermis (r = 0.93) (Lei et al., 2011). Also, ataxia severity using ICARS moderately correlates with Cho/Cr ratio in the dentate nucleus (r = −0.37) (Peng et al., 2019). The correlation between Cho/Cr ratio in the dentate nucleus and ataxia severity measured by SARA and ICARS is similar. The finding suggests that the difference in the predictive value between SARA and ICARS for Cho/Cr ratio was minimal. Therefore, a strong correlation between Cho/Cr ratio in the vermis and ataxia severity is unlikely attributed to the type of scale, thereby representing a reliable biomarker.
Lastly, a study reported that ataxia severity using SARA moderately correlates with the NAA/Cho ratio cerebellar hemispheres (r = 0.46) and vermis (r = 0.37) (Lei et al., 2011).
Summary. Correlation between ataxia severity and MRS changes was scarcely studied in SCA3 patients. Specifically, only a single study established the correlation between ataxia severity and individual metabolite change in the brainstem of SCA3 patients (Adanyeguh et al., 2015). At present, changes in the metabolite ratios are not uniform across the cerebellum. Specifically, reduced Cho/Cr in the vermis may represent a more accurate MRS biomarker for ataxia severity in SCA3 patients due to its strong correlation with SARA scores.
DTI
Cerebrum (Subcortical). A study reported that ataxia severity using ICARS moderately correlates with FA of the posterior thalamic radiation (r = 0.44) (Wu et al., 2017).
Brainstem. A study reported that ataxia severity using SARA moderately correlates with FA of the left cortical-spinal tract (r = −0.47), and strongly correlates with FA of the right cortical-spinal tract (r = −0.51) (Meira et al., 2020). Another study reported that ataxia severity using ICARS strongly correlates with the FA of the medial lemniscus (r = −0.52) (Wu et al., 2017).
Cerebellum. A study reported no correlation between ataxia severity using SARA and FA in the total cerebellum (Guimarães et al., 2013). Ataxia severity using ICARS moderately to strongly correlates with FA in the superior (r = −0.43 ~ −0.64) (Wu et al., 2017; Peng et al., 2019), middle (r = −0.42), and inferior (r = −0.60) cerebellar peduncles (Peng et al., 2019).
Summary. There is no established correlation between SARA and FA in the total cerebellum, whereas ataxia severity using ICARS correlated with FA in several white matter tracts. These findings suggest that FA in white matter tracts indicates ataxia severity than FA of other brain regions, including the total cerebellum. These findings remain preliminary, and each tract's contribution deserves further exploration.
Motor (Non-ataxia)
There was no association between Burke–Marsden–Fahn's Dystonia Rating Scale (BMFDRS) and MRI techniques, including structural MRI and DTI. Similar to ataxia scales, one possible explanation for the lack of correlation is that the BMFDRS is susceptible to other movement difficulties (Kuiper et al., 2016). Nevertheless, the study reported the presence of precentral and paracentral cortices atrophy and more severe thalamus atrophy in SCA3 patients with dystonia compared to their non-dystonic counterparts (Nunes et al., 2015). In addition, midbrain atrophy may also contribute to dystonia in SCA3 (Vidailhet et al., 1999). Further studies are needed to identify brain regions that contribute to dystonia in SCA3 patients.
Neurocognition
We conducted an a-priori categorization of neuropsychological tests into three neurocognitive domains informed by theory and convention (Strauss et al., 2006; Lezak et al., 2012). These domains were (1) general intelligence, (2) working memory (WM), and (3) executive aspect of language. All of which were related to the executive function (EF) (Miyake et al., 2000; Van Aken et al., 2016; Tamura et al., 2018).
General Intelligence
General intelligence is a construct that represents a person's verbal and non-verbal reasoning abilities (Kamphaus, 2005).
Structural MRI
Cerebrum (Cortical). One study reported that verbal reasoning using the Similarities subtest strongly correlates with the cortical thickness of the left precentral gyrus (r = 0.82) and right superior occipital gyrus (r = 0.84) (De Rezende et al., 2015). On the other hand, non-verbal reasoning using Raven's Progressive Matrices (RPM) strongly correlates with the cortical thickness of the left middle occipital gyrus (r = 0.90) (De Rezende et al., 2015). Contradictorily, these measures of general intelligence are commonly associated with frontal and parietal cortices but not precentral and occipital gyri (Gläscher et al., 2009). Therefore, rather than playing a direct role in general intelligence, cortical thickness in the precentral and occipital gyri may share a parallel neurodegenerative process in the SCA3 neuropathology that impedes general intelligence.
MRS
Cerebellum. One study reported that the RPM moderately correlates with Glu (r = −0.42) and Glx (r = −0.41) in the cerebellum (Lopes et al., 2013). The correlation between the cerebellar metabolites and RPM may be attributed to the extensive reciprocal connections between the cerebellum and areas of the cerebrum (Bostan et al., 2013), which disrupts cognitive function (Stoodley and Schmahmann, 2010). Negative correlations between metabolites and RPM are likely related to the processing techniques such as global signal regression than actual anti-correlated activity (Murphy et al., 2009).
Working Memory
MRS
Cerebellum. One study reported that auditory WM using Digit Span (DS) moderately correlates with the NAA (r = 0.42) and NAA + NAAG (r = 0.43) in the cerebellum (Lopes et al., 2013), consistent with the finding that the cerebellum plays a role in the processing of auditory WM (Tomlinson et al., 2014).
DTI
Brainstem. One study reported that auditory WM using DS moderately correlates with the FA of the brainstem (r = 0.49) (Lopes et al., 2013). The relationship between the brainstem and WM is shown when WM plays an essential role in the early precortical sensory processing, in this case, auditory-evoked brainstem response (Sörqvist et al., 2012). The finding suggests that brainstem degeneration is associated with the WM impairment in SCA3.
Language
MRS
Cerebellum. One study reported that semantic verbal fluency strongly correlates with the PCh (r = 0.66) and GPC + PCh (r = 0.69) in the cerebellum (Lopes et al., 2013). This finding highlights the cerebellum's role in motor and sequential speech processing (Leggio et al., 2000). Specifically, an impaired cerebellar cortex-ventral dentate nucleus-thalamus-prefrontal cortex circuit in SCA3 is heavily implicated in strategic word retrieval (Tamura et al., 2018).
Summary
Existing findings on the correlations between neurocognition and neurodegenerative process in SCA3 are restricted to EF. The correlations between neurocognition the cerebellum in SCA3 were at least moderate. This finding is consistent with the cerebellum's role in EF processing due to its extensive reciprocal connections with areas of the cerebrum, including the prefrontal and posterior parietal cortex and the basal ganglia (Stoodley and Schmahmann, 2010; Bostan et al., 2013). Contradictorily, no correlation was found with the prefrontal-striatal circuit, which is impaired in SCA3 and plays a crucial role in higher-order cognitive functions (Alexander et al., 1986; Yap et al., 2022b). Instead, strong correlations were found between general intelligence and precentral gyrus and superior occipital gyrus (De Rezende et al., 2015). This finding determines whether these regions are simultaneously affected alongside the distributed network involved in the EF processing in SCA3.
Discussion
In this review, we demonstrated widespread brain degeneration with moderate correlations between MRI features in several regions and clinical findings in SCA3 patients. Regardless of the MRI techniques, most studies focused on the brainstem and cerebellum. This trend aligns with the body of evidence that suggests that these regions are affected earlier than the cerebrum (Rezende et al., 2018). These early degenerations are consistent with ataxia being the key symptom observed in SCA3 (Bodranghien et al., 2016). Interestingly, the structural loss of the cerebellum in SCA3 was less affected than other SCA subtypes (Schulz et al., 2010). Instead, studies reported degenerative atrophy of various cerebral structures in SCA3, including cortical and sub-cortical regions (Schulz et al., 2010; D'Abreu et al., 2012; De Rezende et al., 2015). As the disease progresses, the SCA3 neuropathology gradually affects the cerebrum, in which extensive atrophy is observed in the cerebral cortex and basal ganglia in the late stages of SCA3 (Rezende et al., 2018). This process results in widespread brain degeneration, contributing to and exacerbating non-ataxia and cognitive impairment in SCA3 (Lindsay and Storey, 2017).
We also examined the MRI abnormalities that may explain the clinical manifestations in SCA3 based on correlation studies. SARA and ICARS represent the most frequently used ataxia scales for SCA3 patients. Regardless of the MRI techniques, the correlation findings were similar between SARA and ICARS (Rüb et al., 2003; Eichler et al., 2011; Bodranghien et al., 2016). Consistently, SARA and ICARS are equally reliable in measuring ataxia severity in SCA3. However, a relatively higher inter-rater reliability, functional relevance, and timesaving nature confer advantages to the SARA (Zhou et al., 2011).
In contrast to the ataxia symptoms, the MRI correlates to the cognitive impairment in SCA3 have not been comprehensively evaluated. Specifically, existing findings focused only on the EF of SCA3 patients. Interestingly, some MRI abnormalities showed associations between EF and the left precentral gyrus and right superior occipital gyrus (De Rezende et al., 2015), rather than the frontal and parietal cortices (Gläscher et al., 2009). We postulate that these regions shared a parallel neurodegenerative process with the cognitive decline in SCA3. Alternatively, these regions may play a pivotal role in the distributed networks serving these neurocognitive domains.
At present, the correlations between the structural MRI, MRS, and DTI changes in several regions and ataxia and cognitive impairment were mainly in the moderate range (r = 0.30–0.49) (Cohen, 2013). In support, a study that used 3D-FD analysis showed a similar correlation between the cerebellar cortex and SARA scores (r = −0.33) (Wang et al., 2020). In addition, there was no correlation between dystonia using BMFDRS and MRI techniques in SCA3 patients. The presence of clinical syndrome may compound each other; that is, ataxia and dystonia may exacerbate each other when measured with their respective clinical scales. Likewise, motor impairment is often a confounding factor for clinical scales from truly reflecting cognitive impairment (Yap et al., 2022b). This issue is often exacerbated as few tests assess only a single domain (i.e., true process-pure tests), thereby affecting the test utility in the cerebellar patient population. Nevertheless, these symptoms are part of the clinical syndrome of SCA3 and are nearly impossible to disentangle from studying one another.
In addition, the involvement of multiple brain regions in SCA3 may also complicate the correlational findings. For example, several different brain regions may contribute to ataxia severity, including the thalamus, pons, and cerebellum (Rüb et al., 2003; Eichler et al., 2011; Bodranghien et al., 2016). This finding may explain moderate correlations between each brain region and the corresponding clinical findings. More importantly, it may represent the difference between isolated cerebellar (e.g., cerebellar stroke) and complex cerebrocerebellar diseases (e.g., SCA3), to which the latter involves both cerebellar and cerebral degeneration.
We postulate that in a complex cerebrocerebellar disease like SCA3, degeneration in any part of the brain region and its connections in the same distributed network may result in the same clinical symptom (Benowitz and Carmichael, 2010), despite each playing a different role in the process. For example, severe ataxia is not only observed when the cerebellum is impaired (Bodranghien et al., 2016); the disruption in the connection between the cerebellum and motor cortex in SCA3 also results in the same symptom (Maas et al., 2021). Specifically, the cerebellum projects to the contralateral premotor and primary motor cortices with sensory and motor information necessary to adapt movements in response to feedback, termed the motor network (Spampinato et al., 2020). Likewise, disruption in the cerebellar-cerebral network and prefrontal-striatal circuit were involved in the cognitive impairment in SCA3 (Lindsay and Storey, 2017). In this case, the cerebellum serves as a hub in the network that prepares for neural processing to optimize the action sequencing on the EF task (Beuriat et al., 2020). Cerebellar degeneration compounds the EF impairment due to the frontal lobe atrophy in SCA3 patients (Klinke et al., 2010).
Implications
This review highlights two research gaps in the literature. First, the brain-behavior relationship in SCA3 has not been comprehensively evaluated using MRI-based brain networks. We postulate that a distributed network, rather than an individual brain region such as the cerebellum, is responsible for the clinical syndrome in SCA3 (Beuriat et al., 2020; Spampinato et al., 2020). In support, the 3D-FD analysis showed that SCA3 neuropathology involves dissociation in the cerebellar-cerebral network (Huang et al., 2017; Jao et al., 2019b). Second, most studies mainly aimed at investigating the structural loss in SCA3 patients, including attempts to increase the sensitivity of the scan, such as texture analysis (De Oliveira et al., 2010) and neuromelanin contrast (Nakata et al., 2020), whereas functional activation has been scarcely studied. Functional activation allows the inference of brain regions and networks involved in a particular motor or cognitive process (Berman et al., 2006). At present, a relaxometry study showed decreased T2-relaxation values in the white matter of the right cerebellar hemisphere alongside structural loss (Guimarães et al., 2013), and a task-based fMRI study showed that a paced motor task elicited increased activations in the motor network SCA3 patients irrespective of gray matter loss (Duarte et al., 2016). These findings are similar to other neurodegenerative diseases such as Alzheimer's disease, which increases activation in early disease stage (Yap et al., 2017). Together with the presence of brain structural and metabolic changes before the clinical manifestation (Wu et al., 2017; Joers et al., 2018; Rezende et al., 2018), the findings imply functional reorganization of the brain and that compensatory activation is in play (Duarte et al., 2016), which gradually decline as the disease progresses (Yap et al., 2017). Notably, the compensatory activation may also obscure the correlations between brain structural and metabolic changes and clinical findings, which may also explain the moderate association strengths. Therefore, we need more findings on the fMRI for SCA3 patients, especially the resting-state networks.
The importance of these findings points to the pivotal role of adaptive or maladaptive compensatory activation. A maladaptive compensatory activation is shown when dysfunction in the brain region results in its inability to downregulate other brain regions in the same distributed network. Therefore, the increased activation disrupts clinical performance (Franzen et al., 2013; Jones et al., 2016). Conversely, adaptive compensatory activation may imply that neuroplasticity is present in SCA3 patients, providing support for early physical and cognitive rehabilitation. While restorative neurorehabilitation has been widely studied in the SCA3 population, findings for non-pharmacological approaches for SCA, such as cognitive rehabilitation and psychotherapy on other aspects of psychological symptoms, are lacking (Yap et al., 2022a).
Limitations
This review has several limitations. Firstly, different MRI techniques have not been consistently studied across different brain regions in the SCA3 population, specifically the cerebrum. Likewise, correlations between clinical impairment and brain regions were not consistently reported. Therefore, we could not conclude whether the absence of correlations was due to non-significant findings or was not assessed. Secondly, SCA3 patients are commonly characterized by peripheral nerve involvement, which further exacerbating test performances through non-ataxia symptoms such as muscle weakness and sensory disturbances (Van De Warrenburg et al., 2004). It is essential to rule out these factors before correlating the brain MRI abnormalities and clinical syndrome. Thirdly, a potential problem with MRI studies involved multiple comparisons, which increases the likelihood of false positives (Lindquist and Mejia, 2015). This problem applies to comparing brain regions between SCA3 and HC and the number of correlations conducted. Therefore, Bonferroni correction may help address the problem (Lindquist and Mejia, 2015). However, it is also possible that none of the true positives would survive multiple comparison corrections. Lastly, there is a lack of knowledge on the brain degenerative patterns between SCA3 patients from Western and East Asian countries. The difference in the brain structure may affect the degenerative pattern, although this has not been studied (Tang et al., 2018). In addition, factors such as test norms, age, gender, culture, education level, and functional level may further affect the degenerative pattern and correlations between MRI and clinical findings.
Conclusion
SCA3 neuropathology contributes to widespread brain degeneration. We speculate that the connectivity between different brain regions in distributed networks is responsible for motor and neurocognitive function in SCA3. However, this topic remains scarcely studied in SCA3. Therefore, future studies should investigate possible functional connectivity abnormalities in SCA3 using fMRI.
Data Availability Statement
The original contributions presented in the study are included in the article/Supplementary Material, further inquiries can be directed to the corresponding author/s.
Author Contributions
Funding acquisition was performed by NM. Literature search was performed by KY and HA. The first draft of this review was written by KY. All authors critically revised the work, contributed to the study conception and design, and read and approved the final version of the review.
Funding
This work was supported by the Dana Impak Perdana Grant (DIP-2019-007) received by NM from Universiti Kebangsaan Malaysia.
Conflict of Interest
The authors declare that the research was conducted in the absence of any commercial or financial relationships that could be construed as a potential conflict of interest.
Publisher's Note
All claims expressed in this article are solely those of the authors and do not necessarily represent those of their affiliated organizations, or those of the publisher, the editors and the reviewers. Any product that may be evaluated in this article, or claim that may be made by its manufacturer, is not guaranteed or endorsed by the publisher.
Supplementary Material
The Supplementary Material for this article can be found online at: https://www.frontiersin.org/articles/10.3389/fnins.2022.859651/full#supplementary-material
References
Adanyeguh, I. M., Henry, P., Nguyen, T. M., Rinaldi, D., Jauffret, C., Valabregue, R., et al. (2015). In vivo neurometabolic profiling in patients with spinocerebellar ataxia types 1, 2, 3, and 7. Mov. Disord. 30, 662–670. doi: 10.1002/mds.26181
Adanyeguh, I. M., Perlbarg, V., Henry, P.-G., Rinaldi, D., Petit, E., Valabregue, R., et al. (2018). Autosomal dominant cerebellar ataxias: imaging biomarkers with high effect sizes. NeuroImage: Clinical 19, 858–867. doi: 10.1016/j.nicl.2018.06.011
Aldinger, K. A., and Doherty, D. (2016). “The genetics of cerebellar malformations,” in Seminars in Fetal and Neonatal Medicine (Elsevier), 21, 321–332. doi: 10.1016/j.siny.2016.04.008
Alexander, G. E., Delong, M. R., and Strick, P. L. (1986). Parallel organization of functionally segregated circuits linking basal ganglia and cortex. Annu. Rev. Neurosci. 9, 357–381. doi: 10.1146/annurev.ne.09.030186.002041
Arruda, W. O., Meira, A. T., Ono, S. E., De Carvalho Neto, A., Betting, L. E. G. G., Raskin, S., et al. (2020). Volumetric MRI changes in spinocerebellar ataxia (SCA3 and SCA10) patients. Cerebellum 19, 536–543. doi: 10.1007/s12311-020-01137-3
Bennett, I. J., Madden, D. J., Vaidya, C. J., Howard, D. V., and Howard, J. H. Jr. (2010). Age-related differences in multiple measures of white matter integrity: a diffusion tensor imaging study of healthy aging. Hum. Brain Mapp. 31, 378–390. doi: 10.1002/hbm.20872
Benowitz, L. I., and Carmichael, S. T. (2010). Promoting axonal rewiring to improve outcome after stroke. Neurobiol. Dis. 37, 259–266. doi: 10.1016/j.nbd.2009.11.009
Berkowitz, A.. (2016). Lange Clinical Neurology and Neuroanatomy: A Localization-Based Approach. New York, NY: McGraw-Hill Education.
Berman, M. G., Jonides, J., and Nee, D. E. (2006). Studying mind and brain with fMRI. Soc. Cogn. Affect. Neurosci. 1, 158–161. doi: 10.1093/scan/nsl019
Beuriat, P.-A., Cohen-Zimerman, S., Smith, G. N., Krueger, F., Gordon, B., and Grafman, J. (2020). A new insight on the role of the cerebellum for executive functions and emotion processing in adults. Front. Neurol. 11, 1668. doi: 10.3389/fneur.2020.593490
Bodranghien, F., Bastian, A., Casali, C., Hallett, M., Louis, E. D., Manto, M., et al. (2016). Consensus paper: revisiting the symptoms and signs of cerebellar syndrome. Cerebellum 15, 369–391. doi: 10.1007/s12311-015-0687-3
Bostan, A. C., Dum, R. P., and Strick, P. L. (2013). Cerebellar networks with the cerebral cortex and basal ganglia. Trends Cogn. Sci. 17, 241–254. doi: 10.1016/j.tics.2013.03.003
Brewer, G. J., and Wallimann, T. W. (2000). Protective effect of the energy precursor creatine against toxicity of glutamate and β-amyloid in rat hippocampal neurons. J. Neurochem. 74, 1968–1978. doi: 10.1046/j.1471-4159.2000.0741968.x
Bürk, K., Abele, M., Fetter, M., Dichgans, J., Skalej, M., Laccone, F., et al. (1996). Autosomal dominant cerebellar ataxia type I clinical features and MRI in families with SCA1, SCA2 and SCA3. Brain 119, 1497–1505. doi: 10.1093/brain/119.5.1497
Camargos, S. T., Marques, W. Jr., and Santos, A. C. D. (2011). Brain stem and cerebellum volumetric analysis of Machado Joseph disease patients. Arq. Neuropsiquiatr. 69, 292–296. doi: 10.1590/S0004-282X2011000300005
Chen, H.-C., Lirng, J.-F., Soong, B.-W., Guo, W. Y., Wu, H.-M., Chen, C. C.-C., et al. (2014). The merit of proton magnetic resonance spectroscopy in the longitudinal assessment of spinocerebellar ataxias and multiple system atrophy-cerebellar type. Cereb. Ataxias 1, 1–10. doi: 10.1186/s40673-014-0017-4
Cohen, J.. (2013). Statistical Power Analysis for the Behavioral Sciences. Hoboken: Academic Press. doi: 10.4324/9780203771587
Currie, S., Hadjivassiliou, M., Craven, I. J., Wilkinson, I. D., Griffiths, P. D., and Hoggard, N. (2013). Magnetic resonance imaging biomarkers in patients with progressive ataxia: current status and future direction. Cerebellum 12, 245–266. doi: 10.1007/s12311-012-0405-3
D'Abreu, A., França, M. C. Jr., Yasuda, C. L., Campos, B. A., Lopes-Cendes, I., and Cendes, F. (2012). Neocortical atrophy in Machado-Joseph disease: a longitudinal neuroimaging study. J. Neuroimaging 22, 285–291. doi: 10.1111/j.1552-6569.2011.00614.x
D'Abreu, A., França, M. C. Jr., Yasuda, C. L., Souza, M. S., Lopes-Cendes, Í., and Cendes, F. (2011). Thalamic volume and dystonia in Machado–Joseph disease. J. Neuroimaging 21, e91–e93. doi: 10.1111/j.1552-6569.2010.00464.x
De Oliveira, M. S., D'abreu, A., França, M. C. Jr., Lopes-Cendes, I., Cendes, F., and Castellano, G. (2010). MRI-texture analysis of corpus callosum, thalamus, putamen, and caudate in Machado-Joseph disease. J. Neuroimaging 22, 46–52. doi: 10.1111/j.1552-6569.2010.00553.x
De Rezende, T., D'abreu, A., Guimarães, R., Lopes, T., Lopes-Cendes, I., Cendes, F., et al. (2015). Cerebral cortex involvement in Machado– Joseph disease. Eur. J. Neurol. 22, 277–e224. doi: 10.1111/ene.12559
Döhlinger, S., Hauser, T.-K., Borkert, J., Luft, A. R., and Schulz, J. B. (2008). Magnetic resonance imaging in spinocerebellar ataxias. Cerebellum 7, 204. doi: 10.1007/s12311-008-0025-0
Dong, G., Devito, E., Huang, J., and Du, X. (2012). Diffusion tensor imaging reveals thalamus and posterior cingulate cortex abnormalities in internet gaming addicts. J. Psychiatr. Res. 46, 1212–1216. doi: 10.1016/j.jpsychires.2012.05.015
Duarte, J. M., Lei, H., Mlynárik, V., and Gruetter, R. (2012). The neurochemical profile quantified by in vivo 1H NMR spectroscopy. Neuroimage 61, 342–362. doi: 10.1016/j.neuroimage.2011.12.038
Duarte, J. V., Faustino, R., Lobo, M., Cunha, G., Nunes, C., Ferreira, C., et al. (2016). Parametric fMRI of paced motor responses uncovers novel whole-brain imaging biomarkers in spinocerebellar ataxia type 3. Hum. Brain Mapp. 37, 3656–3668. doi: 10.1002/hbm.23266
Eichler, L., Bellenberg, B., Hahn, H., Köster, O., Schöls, L., and Lukas, C. (2011). Quantitative assessment of brain stem and cerebellar atrophy in spinocerebellar ataxia types 3 and 6: impact on clinical status. Am. J. Neuroradiol. 32, 890–897. doi: 10.3174/ajnr.A2387
Etchebehere, E. C., Cendes, F., Lopes-Cendes, I., Pereira, J. A., Lima, M. C., Sansana, C. R., et al. (2001). Brain single-photon emission computed tomography and magnetic resonance imaging in Machado-Joseph disease. Arch. Neurol. 58, 1257–1263. doi: 10.1001/archneur.58.8.1257
Franco-Marina, F., García-González, J. J., Wagner-Echeagaray, F., Gallo, J., Ugalde, O., Sánchez-García, S., et al. (2010). The Mini-mental State Examination revisited: ceiling and floor effects after score adjustment for educational level in an aging Mexican population. Int. Psychogeriatr. 22, 72–81. doi: 10.1017/S1041610209990822
Franzen, J. D., Heinrichs-Graham, E., White, M. L., Wetzel, M. W., Knott, N. L., and Wilson, T. W. (2013). Atypical coupling between posterior regions of the default mode network in attention-deficit/hyperactivity disorder: a pharmaco-magnetoencephalography study. J. Psychiatry Neurosci. 38, 333. doi: 10.1503/jpn.120054
Gläscher, J., Tranel, D., Paul, L. K., Rudrauf, D., Rorden, C., Hornaday, A., et al. (2009). Lesion mapping of cognitive abilities linked to intelligence. Neuron 61, 681–691. doi: 10.1016/j.neuron.2009.01.026
Guimarães, R. P., D'abreu, A., Yasuda, C. L., França, M. C. Jr., Silva, B. H., Cappabianco, F. A., et al. (2013). A multimodal evaluation of microstructural white matter damage in spinocerebellar ataxia type 3. Mov. Disord. 28, 1125–1132. doi: 10.1002/mds.25451
Guo, J., Chen, H., Biswal, B. B., Guo, X., Zhang, H., Dai, L., et al. (2020). Gray matter atrophy patterns within the cerebellum-neostriatum-cortical network in SCA3. Neurology 95, e3036–e3044. doi: 10.1212/WNL.0000000000010986
Hernandez-Castillo, C. R., Diaz, R., Campos-Romo, A., and Fernandez-Ruiz, J. (2017). Neural correlates of ataxia severity in spinocerebellar ataxia type 3/Machado-Joseph disease. Cereb. Ataxias 4, 1–4. doi: 10.1186/s40673-017-0065-7
Hoch, S. E., Kirov, I. I., and Tal, A. (2017). When are metabolic ratios superior to absolute quantification? A statistical analysis. NMR Biomed. 30, e3710. doi: 10.1002/nbm.3710
Huang, S.-R., Wu, Y.-T., Jao, C.-W., Soong, B.-W., Lirng, J.-F., Wu, H.-M., et al. (2017). CAG repeat length does not associate with the rate of cerebellar degeneration in spinocerebellar ataxia type 3. Neuroimage Clin. 13, 97–105. doi: 10.1016/j.nicl.2016.11.007
Hutton, C., Draganski, B., Ashburner, J., and Weiskopf, N. (2009). A comparison between voxel-based cortical thickness and voxel-based morphometry in normal aging. Neuroimage 48, 371–380. doi: 10.1016/j.neuroimage.2009.06.043
Inada, B. S. Y., Rezende, T. J. R., Pereira, F. V., Garcia, L. Á. L., Da Rocha, A. J., Neto, P. B., et al. (2021). Corticospinal tract involvement in spinocerebellar ataxia type 3: a diffusion tensor imaging study. Neuroradiology 63, 217–224. doi: 10.1007/s00234-020-02528-3
Jao, C.-W., Soong, B.-W., Huang, C.-W., Duan, C.-A., Wu, C.-C., Wu, Y.-T., et al. (2019a). Diffusion tensor magnetic resonance imaging for differentiating multiple system atrophy cerebellar type and spinocerebellar ataxia type 3. Brain Sci. 9, 354. doi: 10.3390/brainsci9120354
Jao, C.-W., Soong, B.-W., Wang, T.-Y., Wu, H.-M., Lu, C.-F., Wang, P.-S., et al. (2019b). Intra-and inter-modular connectivity alterations in the brain structural network of spinocerebellar ataxia type 3. Entropy. 21, 317. doi: 10.3390/e21030317
Joers, J. M., Deelchand, D. K., Lyu, T., Emir, U. E., Hutter, D., Gomez, C. M., et al. (2018). Neurochemical abnormalities in premanifest and early spinocerebellar ataxias. Ann. Neurol. 83, 816–829. doi: 10.1002/ana.25212
Jones, D. T., Knopman, D. S., Gunter, J. L., Graff-Radford, J., Vemuri, P., Boeve, B. F., et al. (2016). Cascading network failure across the Alzheimer's disease spectrum. Brain 139, 547–562. doi: 10.1093/brain/awv338
Kamphaus, R. W.. (2005). “Assessment of adolescent and adult intelligence,” in Clinical Assessment of Child and Adolescent Intelligence (New York, NY: Springer), 291–331. doi: 10.1007/978-0-387-29149-9_11
Kang, J.-S., Klein, J., Baudrexel, S., Deichmann, R., Nolte, D., and Hilker, R. (2014). White matter damage is related to ataxia severity in SCA3. J. Neurol. 261, 291–299. doi: 10.1007/s00415-013-7186-6
Klinke, I., Minnerop, M., Schmitz-Hübsch, T., Hendriks, M., Klockgether, T., Wüllner, U., et al. (2010). Neuropsychological features of patients with spinocerebellar ataxia (SCA) types 1, 2, 3, and 6. Cerebellum 9, 433–442. doi: 10.1007/s12311-010-0183-8
Kuiper, M. J., Vrijenhoek, L., Brandsma, R., Lunsing, R. J., Burger, H., Eggink, H., et al. (2016). The Burke-Fahn-Marsden dystonia rating scale is age-dependent in healthy children. Mov. Disord. Clin. Pract. 3, 580–586. doi: 10.1002/mdc3.12339
Leggio, M. G., Silveri, M. C., Petrosini, L., and Molinari, M. (2000). Phonological grouping is specifically affected in cerebellar patients: a verbal fluency study. J. Neurol. Neurosurg. Psychiatry 69, 102–106. doi: 10.1136/jnnp.69.1.102
Lei, L., Liao, Y., Liao, W., Zhou, J., Yuan, Y., Wang, J., et al. (2011). Magnetic resonance spectroscopy of the cerebellum in patients with spinocerebellar ataxia type 3/Machado-Joseph disease. Zhong Nan da Xue Xue Bao Yi Xue Ban 36, 511–519. doi: 10.3969/j.issn.1672-7347.2011.06.007
Lezak, M., Howieson, D., Bigler, E., and Tranel, D. (2012). Neuropsychological Assessment. OXford: Oxford University Press.
Liang, X., Jiang, H., Chen, C., Zhou, G., Wang, J., Zhang, S., et al. (2009). The correlation between magnetic resonance imaging features of the brainstem and cerebellum and clinical features of spinocerebellar ataxia 3/Machado-Joseph disease. Neurol. India 57, 578. doi: 10.4103/0028-3886.57803
Lindquist, M. A., and Mejia, A. (2015). Zen and the art of multiple comparisons. Psychosom. Med. 77, 114. doi: 10.1097/PSY.0000000000000148
Lindsay, E., and Storey, E. (2017). Cognitive changes in the spinocerebellar ataxias due to expanded polyglutamine tracts: a survey of the literature. Brain Sci. 7, 83–102. doi: 10.3390/brainsci7070083
Lirng, J.-F., Wang, P.-S., Chen, H.-C., Soong, B.-W., Guo, W. Y., Wu, H.-M., et al. (2012). Differences between spinocerebellar ataxias and multiple system atrophy-cerebellar type on proton magnetic resonance spectroscopy. PLoS ONE 7, e47925. doi: 10.1371/journal.pone.0047925
Lopes, T. M., Anelyssa, D., Junior, M. C. F., Yasuda, C. L., Betting, L. E., Samara, A. B., et al. (2013). Widespread neuronal damage and cognitive dysfunction in spinocerebellar ataxia type 3. J. Neurol. 260, 2370–2379. doi: 10.1007/s00415-013-6998-8
Maas, R. P., Van De Warrenburg, B. P., and Schutter, D. J. (2021). Inverse associations between cerebellar inhibition and motor impairment in spinocerebellar ataxia type 3. Brain Stimul. 14, 351–357. doi: 10.1016/j.brs.2021.01.020
Meira, A. T., Arruda, W. O., Ono, S. E., Franklin, G. L., De Carvalho Neto, A., Raskin, S., et al. (2020). Analysis of diffusion tensor parameters in spinocerebellar ataxia type 3 and type 10 patients. Parkinson. Relat. Disord. 78, 73–78. doi: 10.1016/j.parkreldis.2020.06.460
Miyake, A., Friedman, N. P., Emerson, M. J., Witzki, A. H., Howerter, A., and Wager, T. D. (2000). The unity and diversity of executive functions and their contributions to complex “frontal lobe” tasks: a latent variable analysis. Cogn. Psychol. 41, 49–100. doi: 10.1006/cogp.1999.0734
Moffett, J. R., Ross, B., Arun, P., Madhavarao, C. N., and Namboodiri, A. M. (2007). N-Acetylaspartate in the CNS: from neurodiagnostics to neurobiology. Progress Neurobiol. 81, 89–131. doi: 10.1016/j.pneurobio.2006.12.003
Murphy, K., Birn, R. M., Handwerker, D. A., Jones, T. B., and Bandettini, P. A. (2009). The impact of global signal regression on resting state correlations: are anti-correlated networks introduced? Neuroimage 44, 893–905. doi: 10.1016/j.neuroimage.2008.09.036
Nakata, Y., Sakamoto, A., and Kawata, A. (2020). Neuromelanin imaging analyses of the substantia nigra in patients with Machado-Joseph disease. Neuroradiology 62, 1433–1439. doi: 10.1007/s00234-020-02479-9
National Health Medical Research Council. (2009). NHMRC additional levels of evidence and grades for recommendations for developers of guidelines.
National Institutes of Health. (2019). Study Quality Assessment Tools. Available online at: https://www.nhlbi.nih.gov/health-topics/study-quality-assessment-tools (accessed April 20, 2021).
Nunes, M. B., Martinez, A. R. M., Rezende, T. J. R., Friedman, J. H., Lopes-Cendes, I., D'abreu, A., et al. (2015). Dystonia in Machado–Joseph disease: clinical profile, therapy and anatomical basis. Parkinson. Relat. Disord. 21, 1441–1447. doi: 10.1016/j.parkreldis.2015.10.016
Ogawa, Y., Ito, S., Makino, T., Kanai, K., Arai, K., and Kuwabara, S. (2012). Flattened facial colliculus on magnetic resonance imaging in Machado–Joseph disease. Mov. Disord. 27, 1041–1046. doi: 10.1002/mds.25060
Page, M., Mckenzie, J. B., Pm Boutron, I., Hoffmann, T., Mulrow, C. S. L, Tetzlaff, J., et al. (2021). The PRISMA 2020 statement: an updated guideline for reporting systematic reviews. BMJ 372, n71. doi: 10.1136/bmj.n71
Paulson, H.. (2012). Machado–Joseph disease/spinocerebellar ataxia type 3. Handb. Clin. Neurol. 103, 437–449. doi: 10.1016/B978-0-444-51892-7.00027-9
Pedroso, J. L., Franca, M. C. Jr., Braga-Neto, P., D'abreu, A., Saraiva-Pereira, M. L., Saute, J. A., et al. (2013). Nonmotor and extracerebellar features in Machado-Joseph disease: a review. Mov. Disord. 28, 1200–1208. doi: 10.1002/mds.25513
Peng, H., Liang, X., Long, Z., Chen, Z., Shi, Y., Xia, K., et al. (2019). Gene-related cerebellar neurodegeneration in SCA3/MJD: a case-controlled imaging-genetic study. Front. Neurol. 10, 1025. doi: 10.3389/fneur.2019.01025
Rezende, T. J. R., De Paiva, J. L. R., Martinez, A. R. M., Lopes-Cendes, I., Pedroso, J. L., Barsottini, O. G. P., et al. (2018). Structural signature of SCA3: from presymptomatic to late disease stages. Ann. Neurol. 84, 401–408. doi: 10.1002/ana.25297
Rolls, E. T.. (2015). Limbic systems for emotion and for memory, but no single limbic system. Cortex 62, 119–157. doi: 10.1016/j.cortex.2013.12.005
Rüb, U., Del Turco, D., Del Tredici, K., De Vos, R., Brunt, E., Reifenberger, G., et al. (2003). Thalamic involvement in a spinocerebellar ataxia type 2 (SCA2) and a spinocerebellar ataxia type 3 (SCA3) patient, and its clinical relevance. Brain 126, 2257–2272. doi: 10.1093/brain/awg234
Schulz, J. B., Borkert, J., Wolf, S., Schmitz-Hübsch, T., Rakowicz, M., Mariotti, C., et al. (2010). Visualization, quantification and correlation of brain atrophy with clinical symptoms in spinocerebellar ataxia types 1, 3 and 6. Neuroimage 49, 158–168. doi: 10.1016/j.neuroimage.2009.07.027
Smith, T., Gildeh, N., and Holmes, C. (2007). The montreal cognitive assessment: validity and utility in a memory clinic setting. Can. J. Psychiatry 52, 329–332. doi: 10.1177/070674370705200508
Sörqvist, P., Stenfelt, S., and Rönnberg, J. (2012). Working memory capacity and visual–verbal cognitive load modulate auditory–sensory gating in the brainstem: toward a unified view of attention. J. Cogn. Neurosci. 24, 2147–2154. doi: 10.1162/jocn_a_00275
Spampinato, D. A., Celnik, P. A., and Rothwell, J. C. (2020). Cerebellar–motor cortex connectivity: one or two different networks? J. Neurosci. 40, 4230–4239. doi: 10.1523/JNEUROSCI.2397-19.2020
Stoodley, C. J., and Schmahmann, J. D. (2010). Evidence for topographic organization in the cerebellum of motor control versus cognitive and affective processing. Cortex 46, 831–844. doi: 10.1016/j.cortex.2009.11.008
Strauss, E., Sherman, E. M., and Spreen, O. (2006). A Compendium of Neuropsychological Tests: Administration, Norms, and Commentary. Oxford: Oxford University Press.
Szucs, D., and Ioannidis, J. P. (2020). Sample size evolution in neuroimaging research: an evaluation of highly-cited studies (1990–2012) and of latest practices (2017–2018) in high-impact journals. Neuroimage 221, 117164. doi: 10.1016/j.neuroimage.2020.117164
Tamura, I., Takei, A., Hamada, S., Soma, H., Nonaka, M., Homma, S., et al. (2018). Executive dysfunction in patients with spinocerebellar ataxia type 3. J. Neurol. 265, 1563–1572. doi: 10.1007/s00415-018-8883-y
Tang, Y., Zhao, L., Lou, Y., Shi, Y., Fang, R., Lin, X., et al. (2018). Brain structure differences between Chinese and Caucasian cohorts: a comprehensive morphometry study. Hum. Brain Mapp. 39, 2147–2155. doi: 10.1002/hbm.23994
Tomlinson, S. P., Davis, N. J., Morgan, H. M., and Bracewell, R. M. (2014). Cerebellar contributions to verbal working memory. Cerebellum 13, 354–361. doi: 10.1007/s12311-013-0542-3
Van Aken, L., Kessels, R. P., Wingbermühle, E., Van Der Veld, W. M., and Egger, J. I. (2016). Fluid intelligence and executive functioning more alike than different? Acta Neuropsychiatr. 28, 31–37. doi: 10.1017/neu.2015.46
Van De Warrenburg, B. P., Notermans, N. C., Schelhaas, H. J., Van Alfen, N., Sinke, R. J., Knoers, N. V., et al. (2004). Peripheral nerve involvement in spinocerebellar ataxias. Arch. Neurol. 61, 257–261. doi: 10.1001/archneur.61.2.257
Vidailhet, M., Dupel, C., Lehéricy, S., Remy, P., Dormont, D., Serdaru, M., et al. (1999). Dopaminergic dysfunction in midbrain dystonia: anatomoclinical study using 3-dimensional magnetic resonance imaging and fluorodopa F 18 positron emission tomography. Arch. Neurol. 56, 982–989. doi: 10.1001/archneur.56.8.982
Wan, N., Chen, Z., Wan, L., Tang, B., and Jiang, H. (2020). MR imaging of SCA3/MJD. Front. Neurosci. 14, 749. doi: 10.3389/fnins.2020.00749
Wang, P.-S., Chen, H.-C., Wu, H.-M., Lirng, J.-F., Wu, Y.-T., and Soong, B.-W. (2012). Association between proton magnetic resonance spectroscopy measurements and CAG repeat number in patients with spinocerebellar ataxias 2, 3, or 6. PLoS ONE 7, e47479. doi: 10.1371/journal.pone.0047479
Wang, P.-S., Wu, Y.-T., Wang, T.-Y., Wu, H.-M., Soong, B.-W., and Jao, C.-W. (2020). Supratentorial and infratentorial lesions in spinocerebellar Ataxia Type 3. Front. Neurol. 11, 124. doi: 10.3389/fneur.2020.00124
Wardlaw, J. M., Brindle, W., Casado, A. M., Shuler, K., Henderson, M., Thomas, B., et al. (2012). A systematic review of the utility of 1.5 versus 3 Tesla magnetic resonance brain imaging in clinical practice and research. Eur. Radiol. 22, 2295–2303. doi: 10.1007/s00330-012-2500-8
Wu, X., Liao, X., Zhan, Y., Cheng, C., Shen, W., Huang, M., et al. (2017). Microstructural alterations in asymptomatic and symptomatic Patients with spinocerebellar ataxia Type 3: a tract-based spatial statistics study. Front. Neurol. 8, 714–722. doi: 10.3389/fneur.2017.00714
Yap, K. H., Azmin, S., Che Hamzah, J., Ahmad, N., Van De Warrenburg, B., and Mohamed Ibrahim, N. (2022a). Pharmacological and non-pharmacological management of spinocerebellar ataxia: a systematic review. J. Neurol. 269, 2315–2337. doi: 10.1007/s00415-021-10874-2
Yap, K. H., Kessels, R. P. C., Azmin, S., Van De Warrenburg, B., and Mohamed Ibrahim, N. (2022b). Neurocognitive changes in spinocerebellar ataxia type 3: a systematic review with a narrative design. Cerebellum 21, 314–327. doi: 10.1007/s12311-021-01282-3
Yap, K. H., Ung, W. C., Ebenezer, E. G. M., Nordin, N., Chin, P. S., Sugathan, S., et al. (2017). Visualizing hyperactivation in neurodegeneration based on prefrontal oxygenation: a comparative study of mild Alzheimer's disease, mild cognitive impairment, and healthy controls. Front. Aging Neurosci. 9, 287. doi: 10.3389/fnagi.2017.00287
Yoshizawa, T., Watanabe, M., Frusho, K., and Shoji, S. (2003). Magnetic resonance imaging demonstrates differential atrophy of pontine base and tegmentum in Machado–Joseph disease. J. Neurol. Sci. 215, 45–50. doi: 10.1016/S0022-510X(03)00185-0
Keywords: spinocerebellar ataxia type 3, magnetic resonance imaging, motor, neurocognition, cerebellar-cerebral network, functional compensation
Citation: Yap KH, Abdul Manan H, Yahya N, Azmin S, Mohamed Mukari SA and Mohamed Ibrahim N (2022) Magnetic Resonance Imaging and Its Clinical Correlation in Spinocerebellar Ataxia Type 3: A Systematic Review. Front. Neurosci. 16:859651. doi: 10.3389/fnins.2022.859651
Received: 21 January 2022; Accepted: 10 May 2022;
Published: 10 June 2022.
Edited by:
Sean Austin O. Lim, DePaul University, United StatesCopyright © 2022 Yap, Abdul Manan, Yahya, Azmin, Mohamed Mukari and Mohamed Ibrahim. This is an open-access article distributed under the terms of the Creative Commons Attribution License (CC BY). The use, distribution or reproduction in other forums is permitted, provided the original author(s) and the copyright owner(s) are credited and that the original publication in this journal is cited, in accordance with accepted academic practice. No use, distribution or reproduction is permitted which does not comply with these terms.
*Correspondence: Hanani Abdul Manan, hanani@ukm.edu.my