 Yanan Bai
 Vinh Ngoc Pham
 Enamul Huq
- Department of Molecular Biosciences and The Institute for Cellular and Molecular Biology, The University of Texas at Austin, Austin, TX, United States
Plants have evolved with complex sensory systems to recognize signals from multiple environmental conditions. A light signal is one of the most important environmental factors that regulates not only photomorphogenesis but also the developmental strategy of plants throughout their life cycle. The molecular mechanisms of the light signaling modules and the interactions between light and other environmental signals have been studied extensively. However, to enhance plant growth, particularly in crop production, we need to gain a deeper understanding of how light regulates plant development within gene regulatory networks (GRNs). Understanding GRNs is important to identify not only the novel genes and transcription factors in light signaling pathways but also the factors that connect light signaling and other environmental signals. Weighted gene co-expression network analysis (WGCNA) has been used to study GRN. We applied WGCNA to 58 RNA-seq samples of wild-type Arabidopsis grown under different light treatments and built the gene co-expression networks. We identified 14 different modules that are significantly associated with different light treatments. Among them, the honeydew1 and ivory display significant association with the dark-grown seedlings. Many hub genes identified from these modules are significantly enriched in light responses, including responses to red, far-red, blue light, light stimulus, auxin responses, and photosynthesis. Although we found many known transcription factors in these modules, we also identified several unknown genes and transcription factors that are significantly associated with the honeydew1 module and highly differentially expressed between dark and light conditions. To examine whether the hub genes in the honeydew1 module play a role in light signaling, we isolated mutants in selected hub genes and measured hypocotyl lengths under dark, red, and far-red light conditions. These assays showed that four hub genes are involved in regulating light signaling pathways. This study provides a new approach to identifying novel genes in GRNs underlying light responses in Arabidopsis.
Introduction
Light is not only the main energy source for photosynthesis but also the signal to optimize plant growth and development through the entire plant life cycle, from germination to flowering. Extensive studies have identified a large number of key photoreceptors, regulators, and downstream target genes in light signaling in Arabidopsis (Cheng et al., 2021; Huq et al., 2024). Different subsets, as well as a common set of genes, are regulated under various light conditions, including red, far-red, blue, and white light, or under-shade conditions. Transcriptomics data provided the genomic expression profiles in response to different light conditions and in different light signaling mutants. Genome-wide mapping of binding targets of a transcription factor data is also available for transcription factors, including LONG HYPOCOTYL5 (HY5), FAR-RED ELONGATED HYPOCOTYL3 (FHY3), PHYTOCHROME-INTERACTING FACTORS (PIFs), and PHYTOCHROME A (phyA) under dark and different light treatments (Lee et al., 2007; Li et al., 2016; Pfeiffer et al., 2014; Chen et al., 2014). In addition, functional profiling also revealed a small subset of early response genes necessary for seedling deetiolation (Khanna et al., 2006). However, a gene regulatory network (GRN) that combines available transcriptomic data to identify novel regulators and obtain a holistic view of light signaling in Arabidopsis has not yet been constructed.
With the increase in available genomics data, combinations of large-scale genomics data and molecular genetics have been leveraged for in-depth research in Arabidopsis. Microarray and RNA sequencing were applied to study differential gene expression, upregulated or downregulated genes under specific conditions or mutations or different tissues. A number of useful co-expression and co-functional online tools using plant databases enable the study of plant regulatory networks. One example is the Aranet functional network in Arabidopsis, with the integration of 24 types of omics data to identify the gene connections and group gene function together http://www.functionalnet.org/aranet/ (Lee et al., 2010). Using co-expression of microarray data, STARNET2 is a web-based tool to discover gene regulatory networks (Jupiter et al., 2009).
Co-expression network analysis has been successfully applied to study potential functional connections between genes, identify modules, and select hub genes in each module. Weighted gene co-expression network analysis (WGCNA) has been used widely as the most reliable method for identifying gene co-expression networks. In plants, a growing number of studies are applying WGCNA to Arabidopsis, including flower organ morphogenesis (Xie et al., 2015), seed germination (Bassel et al., 2011), and biotic stress-responsive (Amrine et al., 2015). Other plants are also being studied, such as the medicinal plant Dioscorea nipponica (Sun et al., 2017), tomato, rice (Lou et al., 2017), strawberry (Shahan et al., 2018), and wheat (Girousse et al., 2018). In these studies, the WGCNA method systematically builds scale-free gene co-expression networks from complex transcriptomic data, uncovering highly interconnected hub genes and biologically relevant modules tailored to specific conditions, such as energy metabolism clusters in rice roots or dioscin synthesis pathways in medicinal plants. Soft-threshold power selection and topological overlap matrix (TOM) analysis organize thousands of genes into functionally cohesive modules, highlighting intramodular hub genes (e.g., 18 ATP-linked hubs and 36 dioscin-associated genes) and clarifying module–trait correlations. This framework supports module preservation assessments and eigengene-driven clustering, connecting conserved regulatory architectures to traits like drought adaptation or specialized metabolite biosynthesis. However, WGCNA has not been applied to study light signaling pathways in Arabidopsis.
Here, we constructed nondirectional WGCNA applied to variations of light treatments from 58 RNA-seq datasets (Paik et al., 2019; Pham et al., 2018b; Sun et al., 2016; Pedmale et al., 2016; Xin et al., 2017; Yang et al., 2017; Wang et al., 2014; Chen et al., 2014; Suzuki et al., 2015). The various studies include red light-induced gene expression (Paik et al., 2019), differential light regulation of the development of cotyledon and hypocotyl (Sun et al., 2016), blue light-dependent CRY signal by modulating PIF activity genome-wide (Pedmale et al., 2016), light-controlled hypocotyl elongation via modulating histone acetylation (Tang et al., 2017), noncoding RNA mediated control of photomorphogenesis by red light (Wang et al., 2014), splicing regulation in light signaling under red light (Xin et al., 2017), and light stress acclimation (Suzuki et al., 2015). Our goal is to apply WGCNA using a scale-free topological network to identify different modules containing co-expressed genes based on a pairwise correlation between genes and relating modules to specific light treatments. Then, in each module, we will be able to identify the hub genes and highly connected genes in light responses.
Our analysis provided a comprehensive characterization of gene expression changes and identified the novel genes that might be potential key regulatory genes not only in light signaling but also in different developmental signals such as stress, hormones, and temperature. By using the hypocotyl length as a readout phenotype, we further confirmed that some hub genes are involved in regulating light signaling pathways. Therefore, this study provides a holistic view of light signaling regulatory networks and leverages the use of existing gene expression data to identify the novel genes and protein functions in light signaling in Arabidopsis.
Materials and methods
RNA-seq data preprocessing
RNA-seq samples were collected from NCBI databases, including different RNA-seq, in wild-type Arabidopsis grown under different light treatments. The quality of all the raw sequencing samples was tested using FastQC and MultiQC (https://multiqc.info/). Low-quality samples were removed from the list, and the final list contained 58 RNA-seq samples as described in the data. Raw reads from RNA-seq were accessed using FastQC to check the quality of the reads, and the adapter was removed (http://www.bioinformatics.babraham.ac.uk/projects/fastqc/.
Read alignment and differentially expressed gene (DEG) analysis
Kallisto (Bray et al., 2016) was used to quantify the abundance of transcripts, using pseudo alignment to rapidly determine the compatibility of reads with the target. The Arabidopsis reference genome was obtained from TAIR10 (https://www.arabidopsis.org/). Transcript abundance values from Kallisto can be further analyzed using sleuth or transformed into DEseq2 using tximport (Love et al., 2014) for DEG analysis. The VarianceStabilizingTransformation function from DEseq2 was applied to normalize the gene-level count, and significant genes were defined as p-adjust <0.05. Finally, we identified 24,447 genes as differentially expressed genes, and variant-transformed data were used for further WCGNA.
WGCNA
The WGCNA algorithm was implemented as described in the R WGCNA package (Langfelder and Horvath, 2008). Detail R scripts can also be found at https://github.com/donalbonny/co-expression-analysis-WGCNA. Heat maps were generated using DESeq2 and the ComplexHeatmap package (Gu et al., 2016) in R. Correlations of module eigengene with traits were calculated based on:
cor (MEs, Trait).
Where ME: Module eigengenes that represent the module’s gene expression profile.
Trait: the phenotypic interest trait used to measure the correlation with the module eigengene.
GS: gene significance to illustrate the absolute value of the correlation between the gene and the trait.
GS = |cor (xi, Trait)| where xi is the gene expression profile of the i-th gene.
Functional enrichment analysis of modules
Gene ontology (GO enrichment) analysis was performed using The Database for Annotation, Visualization and Integrated Discovery v6.8 (DAVID) (https://david.ncifcrf.gov/home.jsp) (Dennis et al., 2003). Significantly enriched terms with the lowest p-values and FDR (≤0.05) for GO terms were used to generate the GO enrichment graphs. Venn diagrams were generated using Venny 2.1.0 (http://bioinfogp.cnb.csic.es/tools/venny/).
Hub gene identification and visualization
Hub genes were defined by the genes with high gene significance (GS) and module membership (MM) values in each module. A gene with a higher absolute value of GS will be more biologically significant to that specific trait. Module membership values measure the correlation of a gene to the specific module (based on module eigengene). To identify the hub genes, we filtered values for MM > 0.8 and GS > 0.3, p-value <0.05 in each module. Weighted network and hub genes were visualized using VisANT http://visant.bu.edu/.
Results and discussion
Preprocessing the datasets and construction of weighted gene co-expression networks
Fifty-eight RNA-seq samples of wild-type Arabidopsis grown under different light treatments, including red, far-red, blue, white light, and dark conditions, were collected from publicly available studies (Paik et al., 2019; Pham et al., 2018b; Sun et al., 2016; Pedmale et al., 2016; Xin et al., 2017; Yang et al., 2017; Wang et al., 2014; Chen et al., 2014; Suzuki et al., 2015). Comprehensive data, including detailed information about the samples, references, run accession, and light treatments, are described in Table 1. First, to minimize all the batch effects and low read quality during analysis, we obtained raw reads from RNA-seq data and reanalyzed the data using the same pipeline for all samples from quality control, alignment, and identification of differentially expressed genes. The heat map shows the normalized read count of the top 100 differential genes from 58 samples (Figure 1A). We performed principal component analysis (PCA) of 58 RNA-seq samples to confirm the identity of any outliers (Figure 1B). In PCA, different light treatments were indicated by different colors. Data points are spread out in the two directions that explain most of the differences. The PC1 explains 30.6% of the variance, and PC2 explains 21.2% of the variance. We also plotted the heat map of sample-to-sample distance to quickly obtain an overview of similarities and dissimilarities between samples (Figure 2). The transcript abundance estimation using Kallisto is reported as transcripts per million (TPM) and estimated count (est_count). TPM values were then used to perform differential expression analysis using DESeq2 (Love et al., 2014). In order to prepare for downstream WGCNA, the data were transformed using variance-stabilizing transformation to stabilize variance (Figure 2).
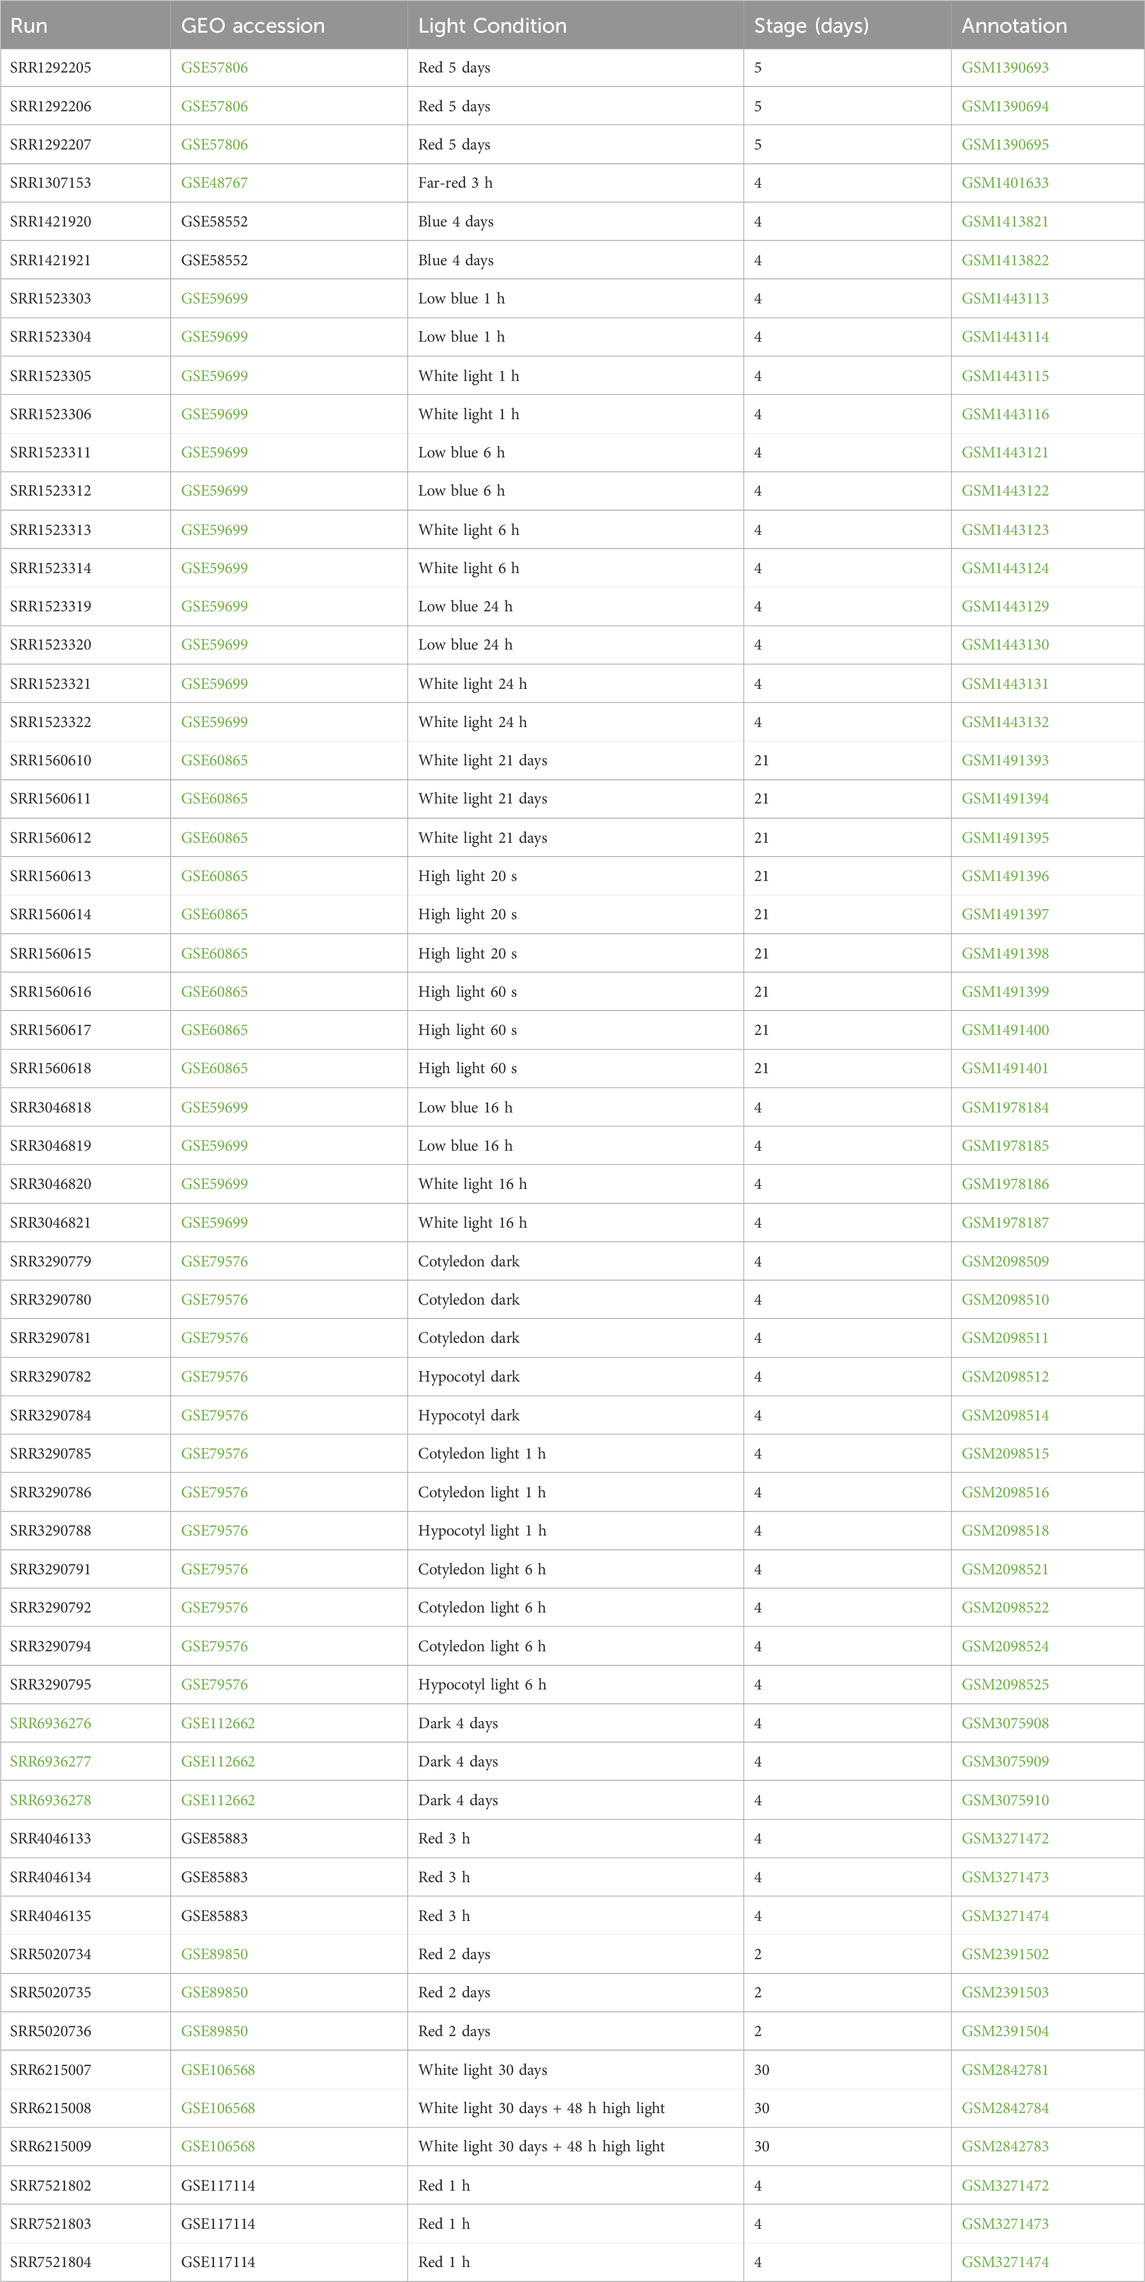
Table 1. RNASeq samples used in this study.
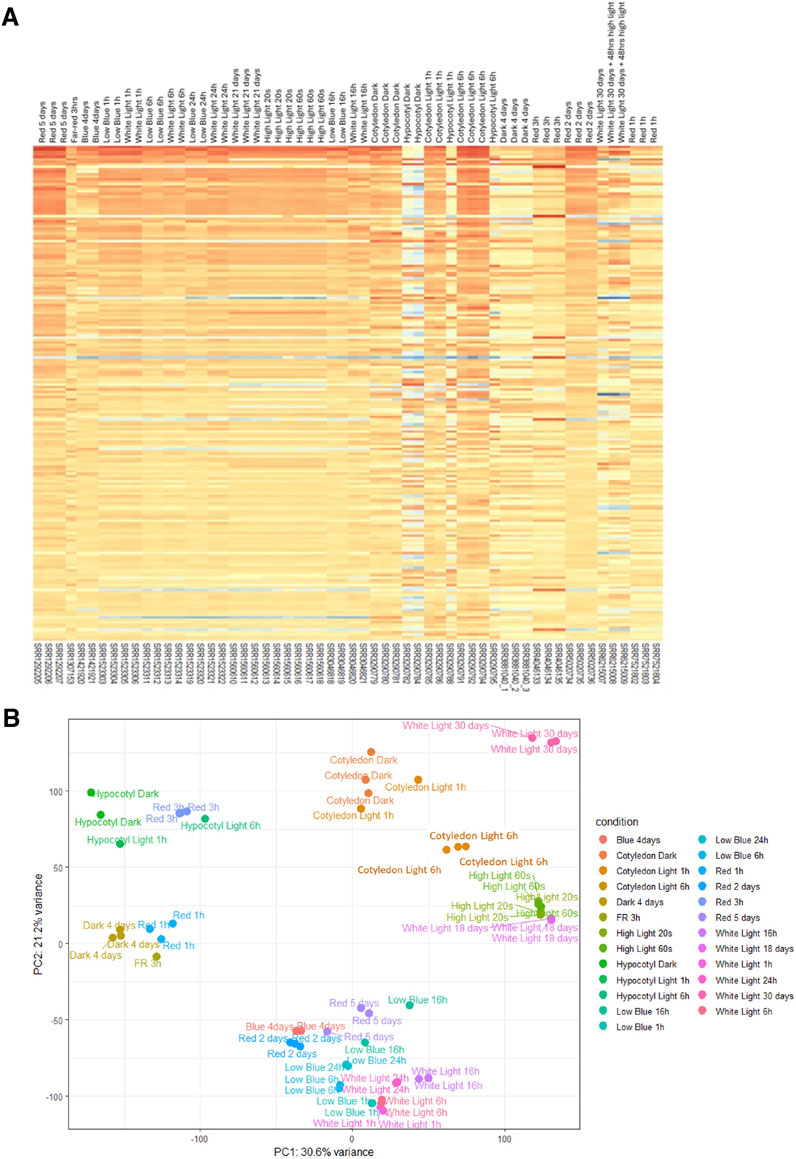
Figure 1. Characterization of RNASeq data. (A) The heat map shows the transcription expression value (TPM) of the most significant 100 differentially expressed genes from each sample. Each column represents a sample, and each gene is shown in a row. (B) Principal component analysis of 58 RNASeq samples. Samples are grouped by different conditions (light treatments).
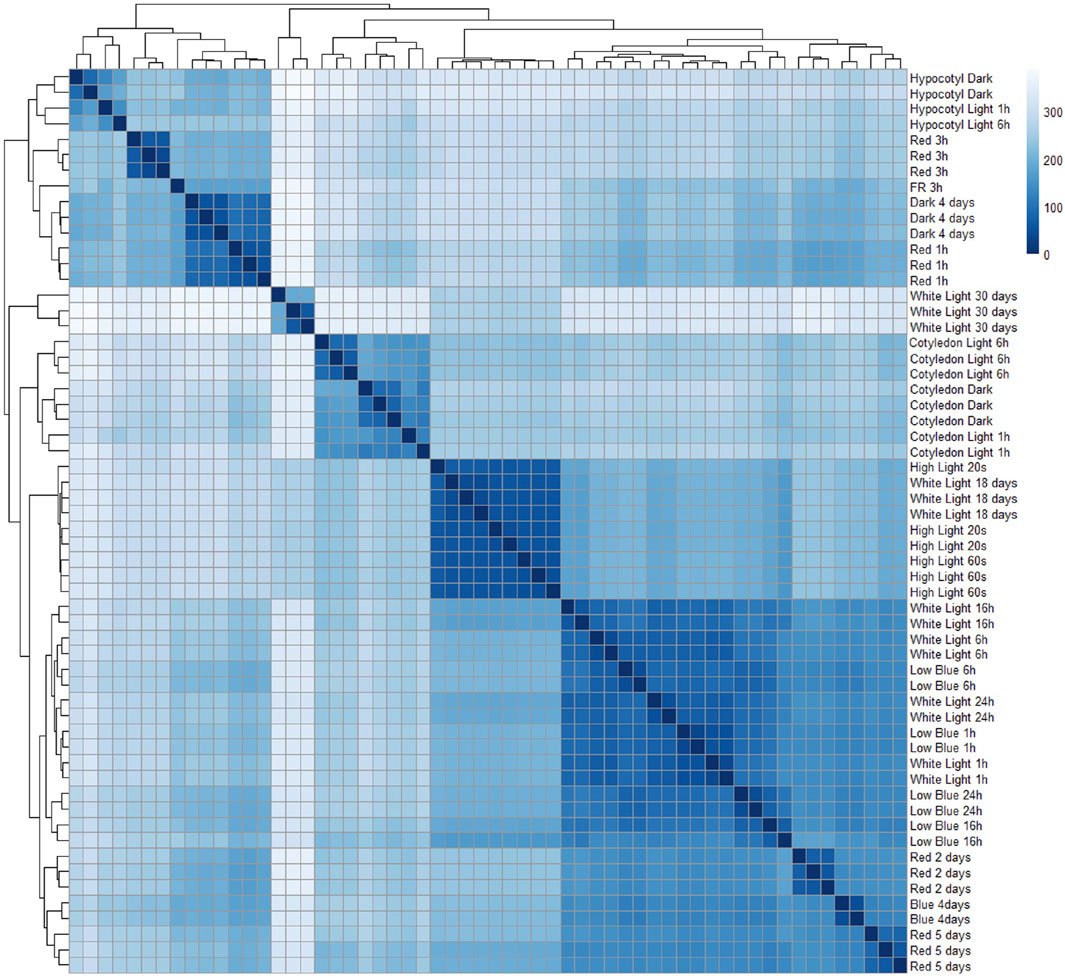
Figure 2. Heat map of sample-to-sample distance. Euclidean distances between the 58 samples were created using the variance-stabilizing transformation of the count data from Kallisto.
Gene network construction and module identification of light signaling responses
A gene expression network was constructed using weighted gene co-expression network analysis (WGCNA) as described in the method section (Zhang and Horvath, 2005; Langfelder and Horvath, 2008). WGCNA identifies modules based on the topological overlap matrix (TOM), which is the measurement of Pearson’s correlation raised to a power between every pair of genes and produces hierarchical clustering. We considered both positive and negative correlations in our co-expression network. Therefore, the “unsigned” network type was selected. The adjacency matrix (A) represents a network created by the correlation between a pair of genes or how a pair of genes is connected (Zhang and Horvath, 2005).
where β indicates the soft-thresholding powers, and aij indicates the correlation between genes i and j. The soft-threshold β is selected as the prior selected correlation cutoff is a key parameter in the WGCNA method. Therefore, in this analysis, we chose the soft-threshold powers (β) of 10 with a scale-free model fitting index R2 > 0.78. Soft-threshold power 10 is the lowest possible power for which the scale-free topology fit index curve flattens out upon reaching a high value (Figure 3A).
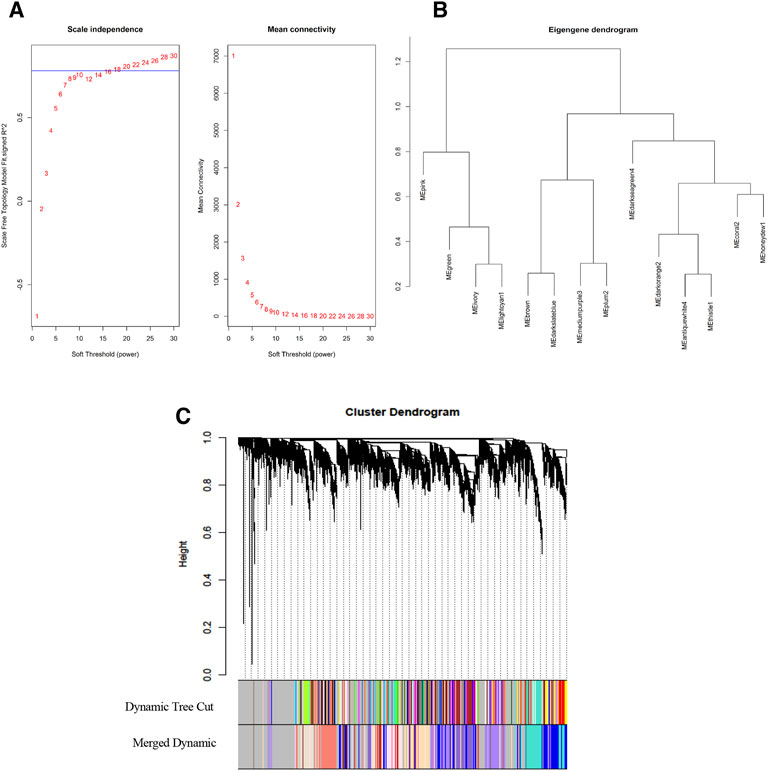
Figure 3. Network construct and module identification. (A) Analysis of the network topology for various soft-thresholding powers (β). The left plot shows the scale-free fit index as a function of the soft-thresholding power. The red line indicates soft-thresholding powers (β) of 10 with a scale-free model fitting index R2 > 0.78. The right plot shows the mean connectivity remains high with soft-thresholding powers (β) of 10. (B) Hierarchical clustering dendrogram of module eigengenes. (C) Clustering dendrograms of genes with dissimilarity based on topological overlap matrix (TOM) using the dynamic tree cut method. Each leaf of the clustering tree corresponds to a gene. Highly co-expressed genes are grouped into different modules, shown in different colors (dynamic tree cut). Then, modules with similar expression levels will be merged into a new module color (merged dynamic).
Module selection
We grouped the highly correlated genes or groups of nodes with high topological overlap into different modules across the samples. First, dissimilarity was computed (topological overlap ensures dissimilarity (disTOM)); then, modules were identified using the dynamic tree cut method in WGCNA (Figure 3C). The identification of the module also applied an unsupervised hierarchical clustering method using the hclust function in the WGCNA package. Using a height cut of 0.25 and a corresponding correlation of 0.75, we merged the similar expression profile of the modules. We plotted the gene dendrograms again, with the original and merged module colors underneath (Figure 3C). Finally, a module dendrogram was constructed using clustering module eigengene (ME) distance showing the 15 different modules identified (including a gray module whose genes are not grouped into any of the 14 modules) (Figure 3B). Module eigengenes (MEs) represent the module’s gene expression profiles or the first principal component of the expression matrix of that module. We can observe the close modules include honeydew1, oral2, and darkseagreen4. In addition, ivory and lightcyan1 are close to each other. The numbers of genes in each module, which range from 75 genes (darkseagreen4 module) to 3,488 genes (darkorange2 module), are listed (Table 2).
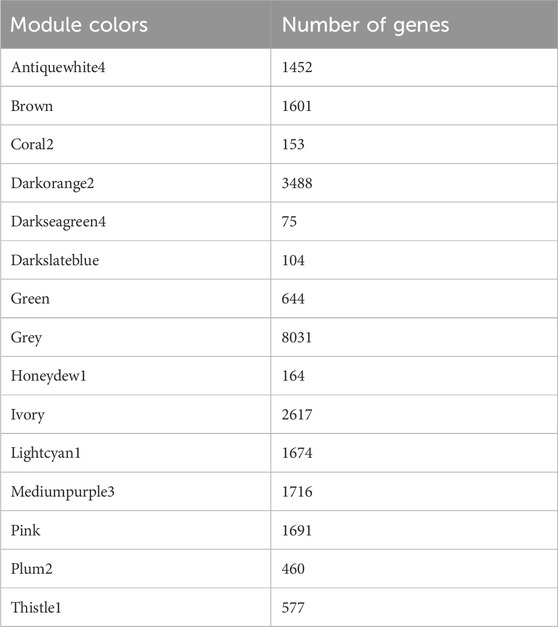
Table 2. Number of genes in each module.
Identification of highly correlated modules to traits of interest
To identify the modules that are significantly associated with different light conditions, module eigengenes (MEs) were calculated, and then the correlation between module eigenegenes with different light treatments using Pearson’s correlation was determined. Each association is coded by the correlation value, and the resulting color-coded table is shown in the association heat map (Figure 4). The most significant associations have been identified for each trait and corresponding module. The association heat map shows that honeydew1 (0.37, p-value 0.004) and antiquewhite4 have the highest association (0.38, p-value 0.003) with 4 days of dark treatment. The ivory module shows the strongest negative association with hypocotyl dark condition (−0.61, p-value 5e−07). We also observed a darkseagreen4 strong positive correlation (0.99, p-value 2e−54) with far-red 3-h treatment, and module coral2 shows a strong positive correlation (0.93, p-value 6e−26) with red light 3 h treatment (Figure 4).
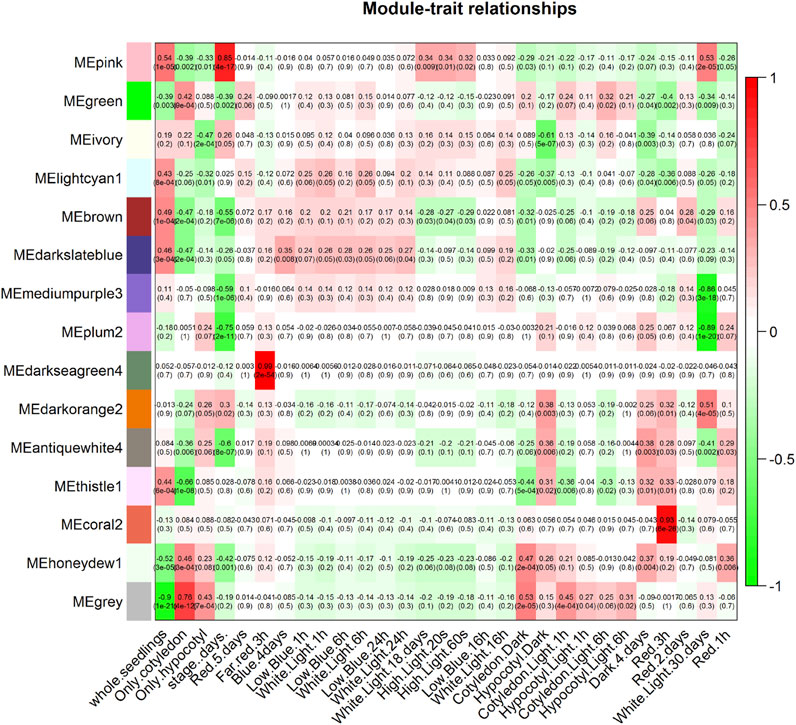
Figure 4. Module–trait associations. A summary profile is provided for each module (module eigengene, ME), then the association between the module eigengene and the traits is shown in the heat map. Each association is color coded by the correlation value. Each row represents a module eigengene, and each column is a different trait. Numbers indicate the correlation value between the module eigengene and the traits, and numbers in parentheses are the p-values.
We observed that some MEs are close in the eigengene dendrogram (Figure 3B) yet show very different patterns in the module–trait relationship (Figure 4). For instance, coral2 and honeydew1 are close in the dendrogram but show very different patterns in the module–trait relationship. If two modules appear very close to each other in the eigengene dendrogram, it generally means their module eigengenes are highly correlated, indicating similar overall expression patterns across samples. However, this does not necessarily guarantee that these modules will show similar module–trait associations. The eigengene dendrogram clusters modules based on the similarity of their eigengenes, reflecting how closely the modules’ overall expression profiles resemble each other. Modules with similar eigengenes may have related biological functions or co-regulation, but their correlation with external traits depends on how the trait relates to each module’s expression pattern. It is possible for two modules to be close in the dendrogram yet have different strengths or directions of correlation with a specific trait because the trait association depends on the specific relationship between the module eigengene and the trait data, not only module-module similarity. Therefore, proximity in the dendrogram suggests similarity in module expression but does not guarantee identical or even similar module–trait correlations.
Gene expression and GO analysis of modules
The heatmap displays the module eigengenes (MEs) or the module gene expressions for honeydew1 and ivory (Figures 5A,B). Each column of the heatmap represents an individual sample and corresponds to the gene expression profile shown in the histogram below. To test whether the module identification has biological meaning, gene ontology (GO) was conducted to obtain meaningful functional enrichment in each module. We found that in honeydew1, six different GO terms are enriched (Figure 5C), which illustrated the specificity of the module identification. Honeydew1 had enrichment in regulation of transcription (BBX16, ERF14, VIP5), response to far-red light (HFR1, GFR7 GROWTH-REGULATING FACTOR 7, and FHY1), osmotic stress, negative regulation of flower development (LATE, a zinc-finger transcriptional regulator that controls the transition to flowering), VERNALIZATION INDEPENDENCE 5 (VIP5), and UBIQUITIN CARRIER PROTEIN 1 (UBC1) (Figure 5C).
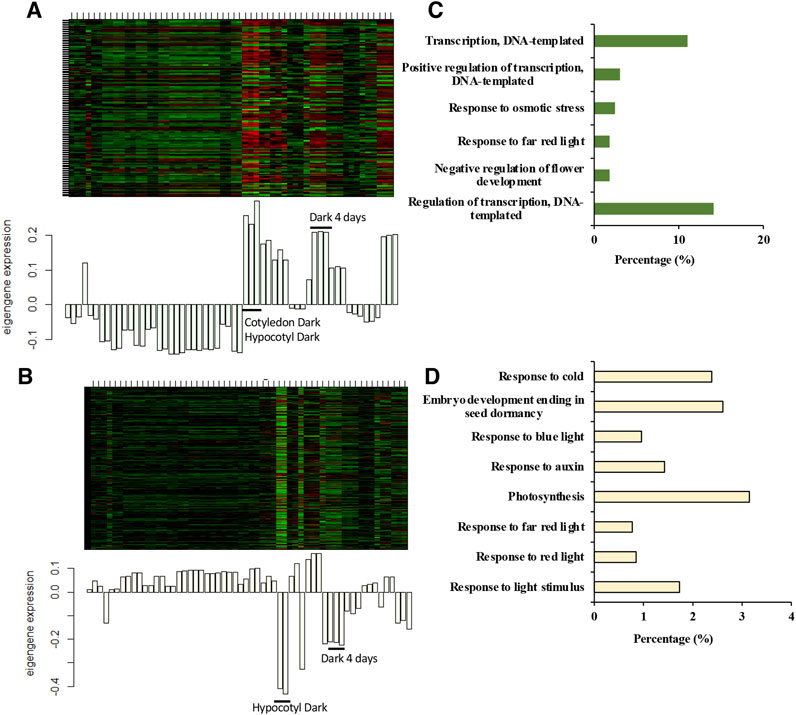
Figure 5. Honeydew1 and ivory modules show a strong association with dark-grown seedlings. (A,B) The heat map shows module expression in honeydew1 (A) and ivory modules (B), where each row represents a gene, and each column represents a sample. Module genes are under-expressed (green color in the heat map) and over-expressed (red color in the heat map). Below the heat map is a bar plot showing the module gene expression profile in each sample. (C,D) GO term analysis in honeydew1 and ivory modules, respectively.
Many genes in ivory were enriched in response to various forms of light stimulus, including far-red light (FHL, RGA1, and LIGHT HARVESTING COMPLEX PHOTOSYSTEM II), red light (LIGHT HARVESTING COMPLEX PHOTOSYSTEM II, CAB, SIG2, RUBISCO SMALL SUBUNIT, SMALL AUXIN UPREGULATED RNA 25, HEMERA, IAA29, and ABA1), and blue light (PHOT2, PLASTID MOVEMENT IMPAIRED (PMI1,2), and SIG2), as well as photosynthesis genes (Figures 5D, 6). Previous studies have shown that a number of well-known light signaling target genes, such as PIF direct genes, HY5/ HFR1 direct target genes, and COP1/SPA-regulated genes, are enriched in response to light stimulus, auxin signaling, and photosynthesis (Pham et al., 2018a). The GO terms analysis in honeydew1 and ivory illustrated that these two modules have a strong association with light responses and might be interesting for further study.
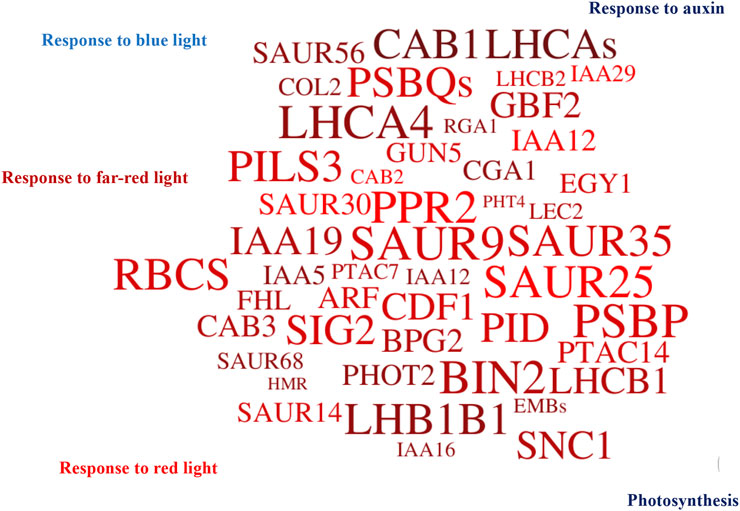
Figure 6. A large number of ivory genes are involved in light signaling. The word cloud shows a large number of genes in the ivory module are related to light signaling, including response to blue light, red, far-red light, response to auxin, and photosynthesis. GO analysis was done using the Database for Annotation, Visualization and Integrated Discovery (DAVID). The word cloud was generated using WordItOut, with word colors and sizes assigned randomly. The responses to different forms of light in different colors were enriched in response to light stimulus, far-red light, and blue light, as well as photosynthesis genes, to illustrate the GO analysis and genes in the ivory module.
Transcription factors identification in honeydew1 and ivory modules
We also compared genes in honeydew1 and ivory modules with the Arabidopsis Transcription Factor Database http://planttfdb.cbi.pku.edu.cn/ and found a large number of TF identified in light signaling in honeydew1 and ivory modules. For instance, in comparison to 1717 TF in Arabidopsis, we found 136 TF in ivory (5.2% total ivory genes) and 16 TF (9.7% total honewdew1 genes) in hondeydew1 modules (Figures 7A,B). In the honeydew1 module, some well-known transcription factors, such as HFR1, EIN2, GRF7 (GROWTH-REGULATING FACTOR7), BIM1 (BES1-INTERACTING MYC-LIKE1 (BIM1), BBX16 (B-BOX DOMAIN PROTEIN 16), CONSTANS-LIKE 7 (COL7), BBX23, ERF14, MYBC1, and RAP2-2 (related to AP2), are present (Table 3). In the Ivory module, we found TCP families (TCP10, 17, 13), B-Box Domain COL16, Zinc finger nuclease 3 (ZFN3), Zinc finger protein 1 (ZFN1), BES1/BZR1 homolog 4 (BEH4), ERF13, ERF 119, ALSO ATHB22, CYTOKININ-RESPONSIVE GATA FACTOR 1 (CGA1), SEPALLATA 4 (SEP4), AGAMOUS-LIKE 87 (AGL87), and MYB DOMAIN PROTEIN MYB106 (Table 4).
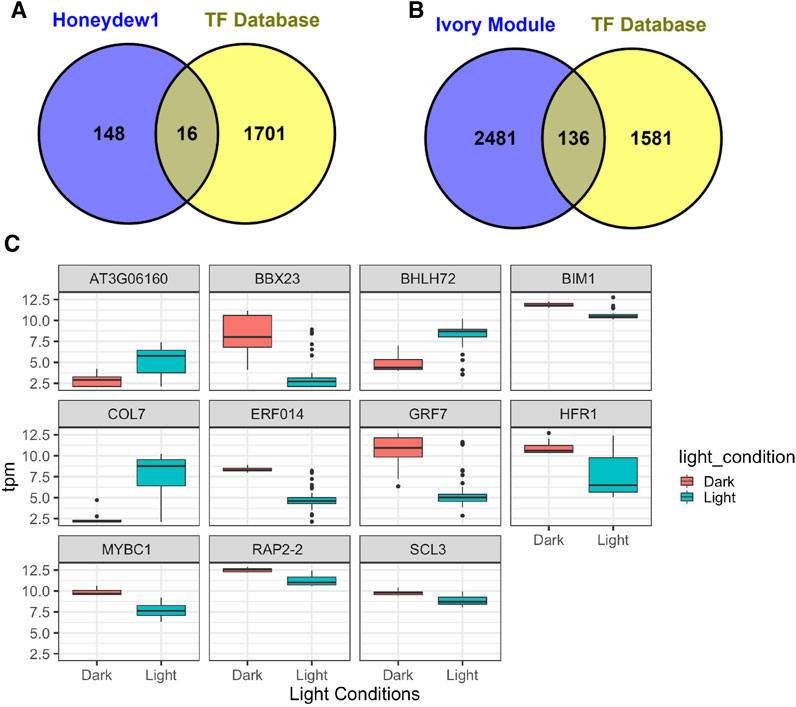
Figure 7. Transcription factors (TF) in honeydew1 and ivory modules. (A,B) Venn diagrams show the number of TFs in honeydew1 and ivory modules (in comparison with the transcription factor database results for Arabidopsis (1717 TF) http://planttfdb.cbi.pku.edu.cn/). (C) Expression patterns of selected TFs in honewdew1 by RNASeq. Expression values are plotted using different colors grouped by light conditions. The dark condition illustrates the dark-4-day hypocotyl and cotyledon samples grown in the dark. Other samples with red, far-red, blue, and white light treatments are grouped into light conditions.
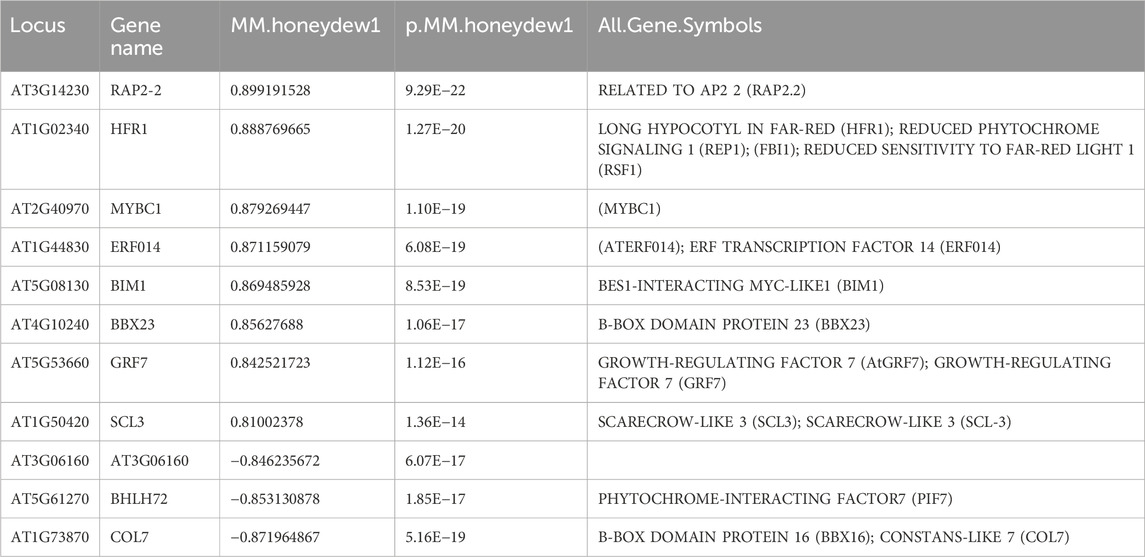
Table 3. List of TF in the honeydew1 module with high module significance >0.8.
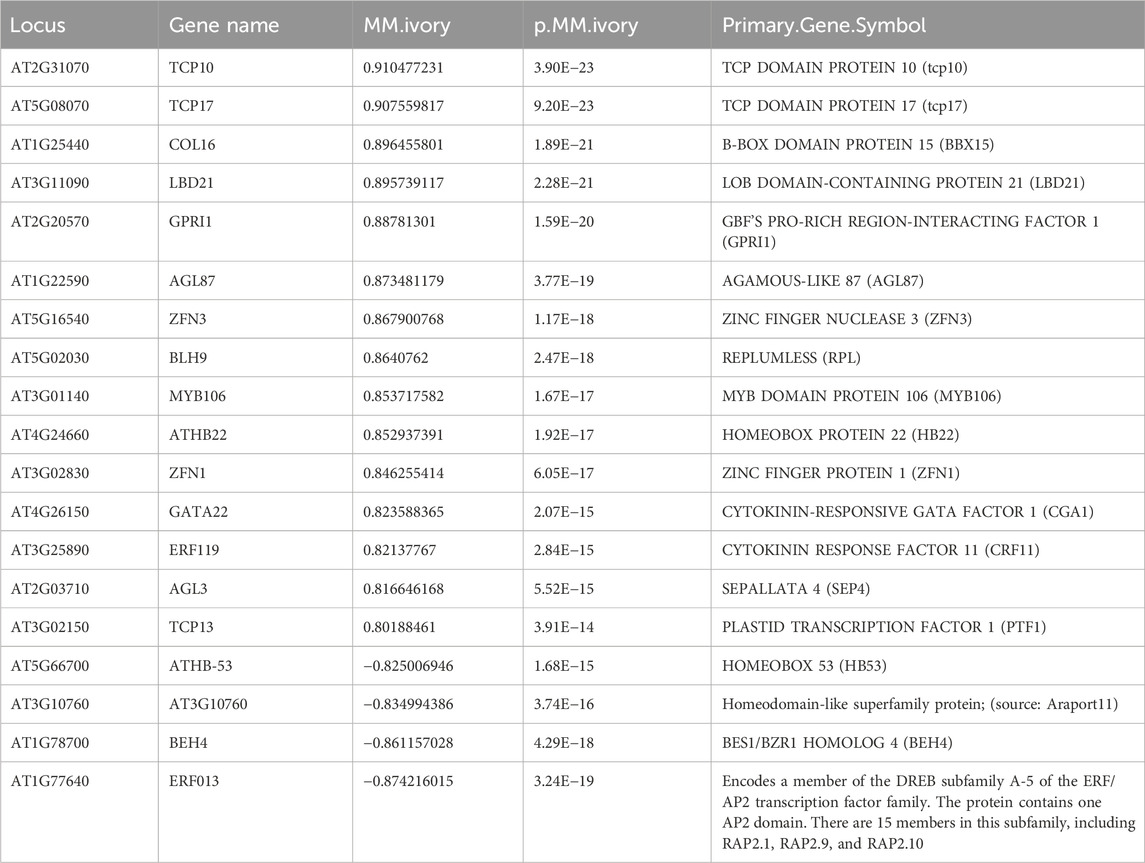
Table 4. List of TFs in the ivory module with high module significance >0.8.
We also examined the expression patterns of TF in the honeydew1 module using the RNA-seq data (Figure 7C). The dark condition illustrates the 4-day-old dark-grown seedlings. Other samples, including red, far-red, blue, and white light treatments, are grouped into light conditions. Most of the TFs displayed differential expression between dark and light conditions. It will be interesting to look at the TFs in these modules that are not related to light signaling to elucidate the cross-talk or novel functions of TF between light and multiple pathways.
Identification of genes with high gene significance (GS) and module membership (MM)
Identification of hub genes is one of the most important goals of co-expression network analysis. We identified genes with high significance (gene significance) to the light condition and also genes with high correlation (module membership) with the module. GS measures the correlation between the gene and the interesting trait, and MM measures the correlation between the expression levels of a gene and the module eigengene. Furthermore, a specific module whose MM and GS were significantly connected and associated with the trait is a module that plays a more important biological role in light response and regulation. Because honeydew1 and ivory have shown strong associations with light signaling in GO analysis and are also highly correlated with the dark condition, we plotted a scatterplot of GS vs. MM in honeydew1 and ivory modules compared with the grey module. The scatterplots show that the gray module exhibits a very weak correlation between GS and MM (0.18). Honeydew1 and ivory, however, show strong associations with dark 4-day treatment (correlation values of 0.36 and 0.39, respectively) (Figure 8). Modules with high trait significance and genes with high module membership were selected for further study for the identification of hub genes and network analyses. In order to identify the hub genes in those two modules, we selected genes with high MM (or high intramodular connectivity), which is a good representative of the overall expression profile in the module. In the honeydew1, hub genes were defined by the genes with MM > 0.8 and GS > 0.3. A list of 75 genes was selected from the module (Dataset 1). In the ivory module, genes with MM > 0.95 and GS > 0.3, 89 genes were selected (Dataset 2).
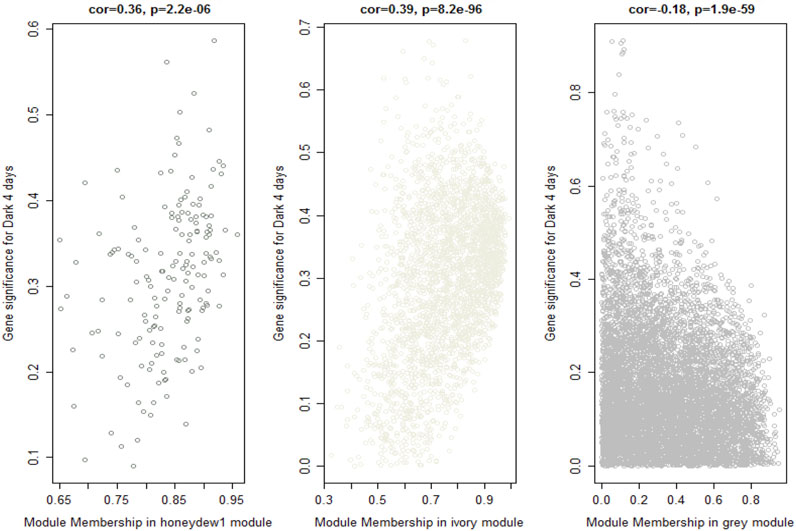
Figure 8. Identifying genes with high gene significance (GS) and module membership (MM). Scatter plots of GS for a dark-4-day condition vs. MM in the honeydew1 and ivory modules show a highly significant correlation between GS and MM in these modules (correlation values of 0.36 and 0.39 in hondeydew1 and ivory, respectively); however, the gray module shows a very weak correlation (correlation value −0.18). The p-value is shown on top.
Characterization of hub genes related to light responses from the honeydew1 module
The most interconnected hub genes from the honeydew1 module with strong connections (TOM >0.13) were selected and are shown in Figure 9A. The top eight genes that show strong positive and negative correlations to the dark 4-day condition are labeled with blue color in Figure 9A. We also examined the expression levels of these eight top genes, as shown in Figure 9B. We refer to the samples, including dark 4 days, hypocotyl in the dark, and cotyledon in the dark, as “Dark” and the far-red, red, and blue light, and white light treatments as “Light” (Figure 9B). Indeed, we observed that AT5G15840 (CO), AT1G20790 (F-box family protein), HSD5 (encodes a putative hydroxysteroid dehydrogenase), and OL3 (encodes oleosin3, a protein found in oil bodies, involved in seed lipid accumulation) show a strong positive correlation with dark 4 days in the honeydew1 module. These data correlated with the gene expression value, showing a stronger expression of these genes in the dark than in the light conditions. Similarly, gene expression values in AT5G67370 (DUF1230 family protein), AT5G63060 (Sec14p-like phosphatidylinositol transfer family protein), AT1G28610 (L-aspartase-like family protein), and AT1G36280 (L-aspartase-like family protein) all show a strong negative correlation with dark 4 days, which is correlated to the lower expression of these genes in the dark than the light conditions (Figure 9B).
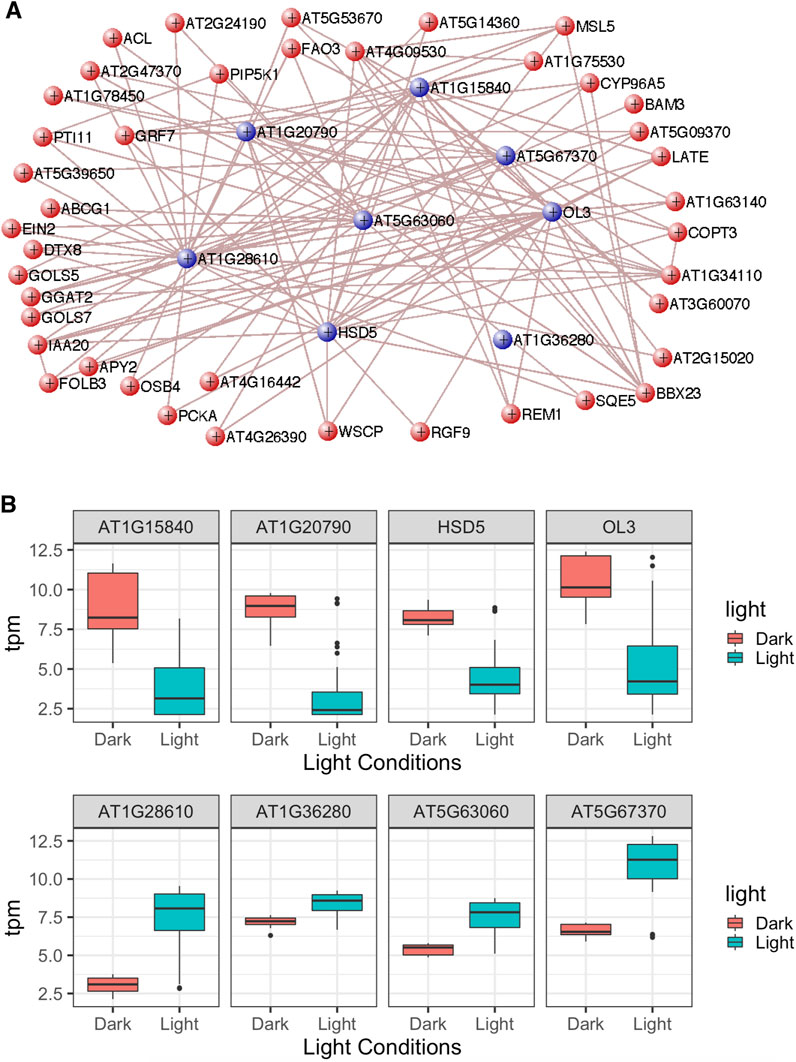
Figure 9. Characterization of hub genes related to light responses from the honeydew1 module. (A) Visualization of the network connections in the honeydew1 module using VisANT. The network shows connections whose topological overlap is above the threshold of 0.13. The network only shows the genes with more than two connections. (B) Gene expression using transcripts per million (TPM) values for eight hub genes in the honeydew1 module from RNASeq data. These genes are indicated in blue colors in Figure (A).
To identify potential new regulators in light signaling pathways, we selected eight genes from the honeydew1 module to investigate their involvement in this process. Given that hypocotyl elongation experiments are commonly used to test light signaling phenotypes, we focused on measuring hypocotyl lengths for seedlings grown in darkness and under red and far-red light conditions for this study. We obtained at least two independent T-DNA insertion lines for each candidate gene and designed genotyping primers to isolate homozygous mutant lines from the segregating population (see Supplementary Table S1; Supplementary Figures S1A–H). We then measured hypocotyl lengths for seedlings grown under darkness for 4 days and 1 day dark, followed by three additional days of growth under red and far-red light conditions using two different light intensities. Finally, we compared the hypocotyl lengths between the Col-0 and the candidate gene mutant lines using a Student’s t-test.
AT1G20790 (F-box family protein) shows lower expression under light than dark conditions (Figure 9B). This gene has been identified as a homolog of novel genes in legumes (Graham et al., 2004). Being at the core of the honeydew1 module, this gene might play an important role in light signaling. We isolated two independent homozygous T-DNA insertion lines and examined their phenotypes. The results show that both alleles display longer hypocotyls under red and far-red light than the wild type (Figures 10A–C). Hypocotyl lengths were comparable for the mutant and wild-type under dark, suggesting that these mutants are hyposensitive to red and far-red light conditions in a light-dependent manner. Previously, several F-box proteins have been shown to be involved in light signaling pathways. For example, EID1 (Dieterle et al., 2001), EBF1/2 (Dong et al., 2017), MAX2 (Shen et al., 2007), CTG10 (Majee et al., 2018), and CFH1 (Liu et al., 2024) have been shown to regulate photomorphogenesis. Many of these F-box proteins promote the degradation of the negatively acting phytochrome-interacting factors (PIFs) and thereby promote photomorphogenesis. It is possible that AT1G20790 might also control PIF stability to regulate photomorphogenesis. Further analysis is necessary to understand how AT1G20790 regulates photomorphogenesis.
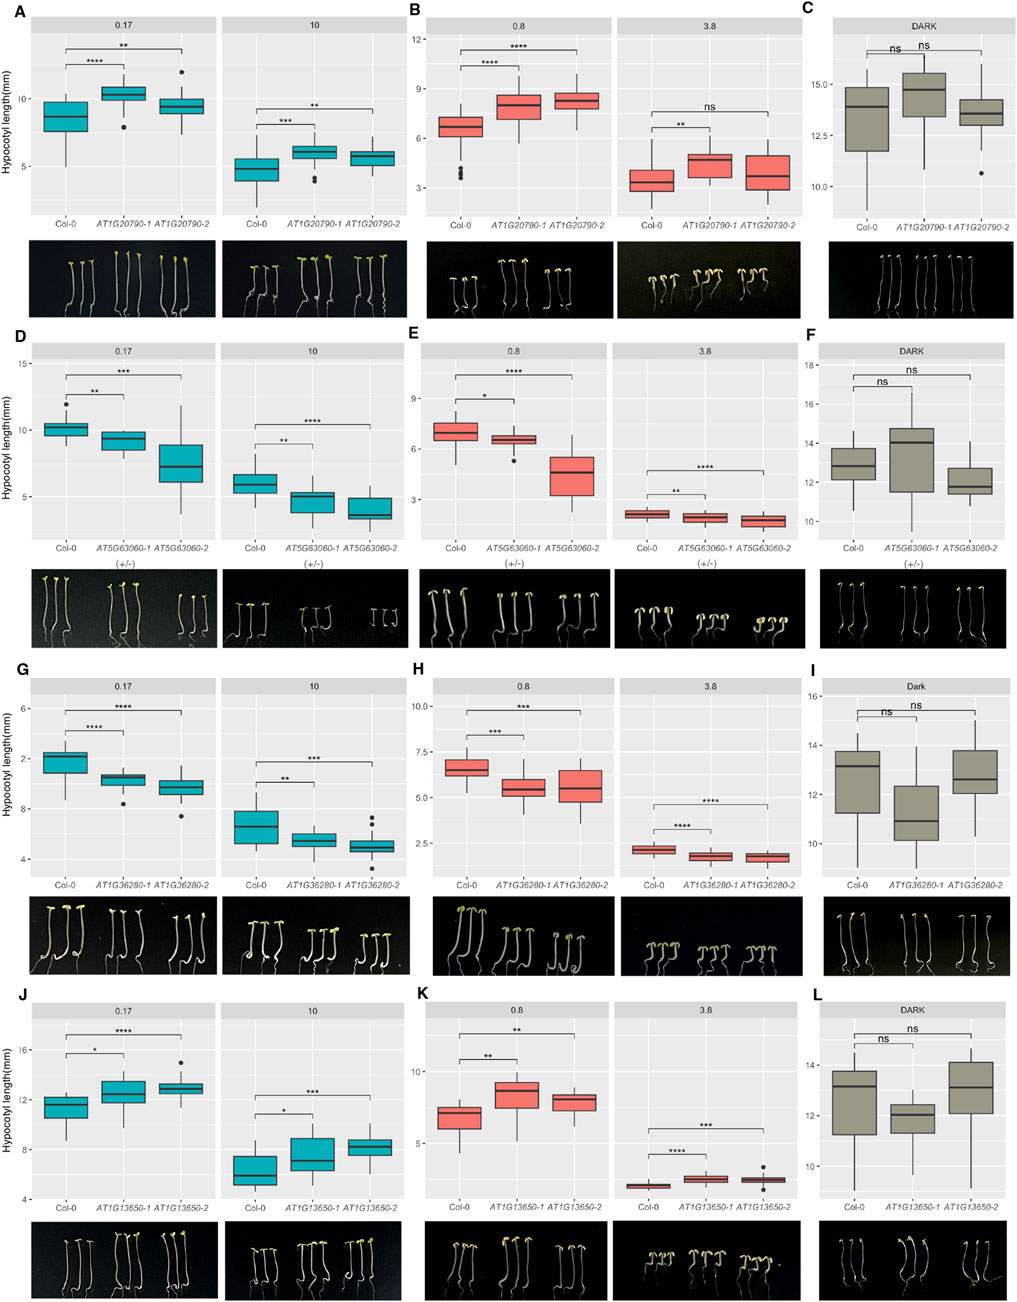
Figure 10. Four selected hub genes display the hypocotyl phenotype under red and far-red light. Box plots show the hypocotyl lengths of two independent alleles of each gene showing red light phenotypes (A,D,G,J) and far-red light phenotypes (B,E,H,K) compared to dark conditions (C,F,I,L). Seedlings were grown under darkness for four days or one day under dark followed by 3 days under red or far-red light at two intensities (in μmol/m−2/s−1) shown on top of the box plots. Statistically significant differences are indicated by *p < 0.05, **p < 0.01, ***p < 0.001, and ****p < 0.0001.
AT5G63060 (CHLOROPLAST-LOCALIZED SEC14-LIKE PROTEIN, CPSFL1, and PITP7) shows higher expression when transitioning from dark to light (Figure 9B). Previous studies have demonstrated that CPSFL1 is essential for chloroplast vesicle formation and photoautotrophic development of Arabidopsis (Hertle et al., 2020; Kim et al., 2022). As CPSFL1 is located at the core of the honeydew1 module, it might play an important role in light signaling. For our hypocotyl elongation experiments, we used one heterozygous T-DNA insertion line, AT5G63060-1(+/−) (Salk_116713), as homozygous seedlings did not grow to adult plants, and one homozygous weak T-DNA insertion line, AT5G63060-2 (Salk_047586C). We measured the hypocotyl lengths of all the seedlings for both alleles. The results showed that both AT5G63060-1(+/−) and AT5G63060-2 exhibited shorter hypocotyl lengths than the wild type under both red and far-red light conditions but no significant phenotype difference under dark conditions compared to Col-0 (Figures 10D–F). This suggests that cpsfl1 is hypersensitive to red and far-red light and may function as a negative regulator in phytochrome-mediated hypocotyl elongation.
AT1G36280 (L-aspartase-like family protein) also exhibits higher gene expression under light conditions (Figure 9B), although its function in plants is not yet fully characterized. The L-aspartase-like family proteins primarily function in deaminating L-aspartate into fumarate and ammonia (Mizobata and Kawata, 2007). In plants, L-aspartate (Asp) serves as a precursor for the biosynthesis of other amino acids, nucleotides, nicotinamide adenine dinucleotide (NAD), and other aspartate-derived biomolecules, playing a crucial role in plant growth and development. L-aspartate also influences the biosynthesis of phytohormones, such as ethylene and indole-3-acetic acid (IAA) (Han et al., 2021). However, how light affects L-aspartase and, subsequently, L-aspartate remains unclear. To test whether AT1G36280 functions in the light signaling pathway, we measured hypocotyl lengths of two independent T-DNA insertional mutants under red and far-red light conditions. Both AT1G36280-1 and AT1G36280-2 T-DNA insertion lines exhibited a shorter hypocotyl phenotype than Col-0 under both red and far-red light conditions (Figures 10G–I). This suggests that AT1G36280 might be a negative regulator in the light signaling pathway.
From our WGCNA, we identified several hypothetical proteins, including AT1G13650, whose function is currently unknown. Previous reports indicate that this gene is expressed in various biological processes, such as pathogen response, cold treatment, osmotic stress, seed maturation, and leaf development (Ascencio-Ibánez et al., 2008; Hannah et al., 2005; Wohlbach et al., 2008; Efroni et al., 2008). Because AT1G13650 is present in the honeydew module, we aim to further investigate its role in light signaling. Based on its hypocotyl phenotype under red and far-red light conditions, two independent alleles of AT1G13650 mutants exhibit significantly longer hypocotyl lengths than Col-0 (Figures 10J–L). This suggests that AT1G13650 may act as a positive regulator for seedling hypocotyl elongation under red and far-red light. Interestingly, AT1G13650 mutants also display a cotyledon opening phenotype under dark conditions, which suggests that AT1G13650 might act as a negative regulator in regulating cotyledon opening in the dark. These findings provide new insights into the role of hypothetical proteins in identifying new regulators in light signaling pathways.
The other four genes, including AT5G67370 (DUF1230 family protein, accumulates progressively upon iron deficiency), AT3G06160 (AP2/B3-like transcriptional factor family protein), AT3G03770 (leucine-rich repeat protein kinase family protein), and AT1G28610 (GGL3, GUARD-CELL-ENRICHED GDSL LIPASE 3, which is a GDSL-motif esterase/acyltransferase/lipase), did not show significant hypocotyl phenotypes in a light-dependent manner (Supplementary Figures S2A–L). However, we found that AT1G28610 mutants exhibit longer hypocotyl lengths under dark conditions but no significant hypocotyl phenotype under red and far-red light conditions (Supplementary Figures S2A–C). GDSL-type lipases can hydrolyze and synthesize lipids, affecting lipid metabolism and energy production (Ding et al., 2019). These lipases are essential for various aspects of plant development, including seed germination, coleoptile elongation, root development, stomata development, and flower development (Shen et al., 2022). Additionally, the GDSL-type lipase family responds to both abiotic and biotic stresses. Thus, these data suggest that AT1G28610 might play a negative role in regulating hypocotyl elongation under dark. Thus, these genes might function in regulating other facets of light-mediated plant development. Further experiments are needed to explore their roles in light signaling pathways.
In summary, this study shows the first evidence of using WGCNA co-expression networks to predict the functional roles of individual genes at a system-wide scale in light responses by leveraging transcriptomic data in wild-type Arabidopsis. Fourteen modules have been identified, and each module shows a strong association with different light treatments. Among them, honeydew1 and ivory show a strong association with the dark condition, coral 2 shows a strong connection with red light, and darkslateblue shows a high correlation with low blue light and white light, respectively. We identified hub genes from the honeydew1 module, including many known genes in light signaling but also hypothetical proteins with unknown functions in light signaling pathways. Functional analyses showed that at least four of eight hub genes (50%) are involved in regulating light signaling pathways. It is possible that the other hub genes are also involved in regulating other facets of photomorphogenesis. Moreover, the survey nature of our phenotypic analysis did not reveal the mechanistic details by which these hub genes regulate light signaling. A more comprehensive phenotypic and functional analysis is necessary to determine if and how these genes play a role in light signaling pathways. These results demonstrate that WGCNA is an efficient method for utilizing published RNA-seq data to construct gene co-expression networks (GRNs) and identify potential new regulators in light signaling pathways. This approach may also be beneficial for other plant developmental regulatory pathways.
Data availability statement
The datasets presented in this study can be found in online repositories. The names of the repository/repositories and accession number(s) can be found in the article/Supplementary Material.
Author contributions
YB: conceptualization, data curation, formal analysis, investigation, methodology, resources, validation, visualization, writing – original draft, writing – review and editing. VP: conceptualization, data curation, formal analysis, investigation, methodology, resources, software, validation, visualization, writing – original draft, writing – review and editing. EH: conceptualization, funding acquisition, supervision, writing – original draft, writing – review and editing.
Funding
The author(s) declare that financial support was received for the research and/or publication of this article. This work was supported by grants from the National Science Foundation (MCB-2014408) to EH and an Integrative Biology (IB) Research Fellowship grant from the University of Texas at Austin to YB.
Acknowledgments
We thank members of the Huq laboratory for critical reading of the manuscript. The authors acknowledge the Texas Advanced Computing Center (TACC) at The University of Texas at Austin for providing high-performance computing, visualization, and database resources that have contributed to the research results reported in this article.
Conflict of interest
The authors declare that the research was conducted in the absence of any commercial or financial relationships that could be construed as a potential conflict of interest.
Generative AI statement
The author(s) declare that no Generative AI was used in the creation of this manuscript.
Publisher’s note
All claims expressed in this article are solely those of the authors and do not necessarily represent those of their affiliated organizations, or those of the publisher, the editors and the reviewers. Any product that may be evaluated in this article, or claim that may be made by its manufacturer, is not guaranteed or endorsed by the publisher.
Supplementary material
The Supplementary Material for this article can be found online at: https://www.frontiersin.org/articles/10.3389/fphbi.2025.1597248/full#supplementary-material
References
Amrine, K. C., Blanco-Ulate, B., and Cantu, D. (2015). Discovery of core biotic stress responsive genes in Arabidopsis by weighted gene co-expression network analysis. PloS one 10, e0118731. doi:10.1371/journal.pone.0118731
Ascencio-Ibánez, J. T., Sozzani, R., Lee, T.-J., Chu, T.-M., Wolfinger, R. D., Cella, R., et al. (2008). Global analysis of Arabidopsis gene expression uncovers a complex array of changes impacting pathogen response and cell cycle during geminivirus infection. Plant physiol. 148, 436–454. doi:10.1104/pp.108.121038
Bassel, G. W., Lan, H., Glaab, E., Gibbs, D. J., Gerjets, T., Krasnogor, N., et al. (2011). Genome-wide network model capturing seed germination reveals coordinated regulation of plant cellular phase transitions. Proc. Natl. Acad. Sci. 108, 9709–9714. doi:10.1073/pnas.1100958108
Bray, N. L., Pimentel, H., Melsted, P., and Pachter, L. (2016). Near-optimal probabilistic RNA-seq quantification. Nat. Biotechnol. 34, 525–527. doi:10.1038/nbt.3519
Chen, F., Li, B., Li, G., Charron, J.-B., Dai, M., Shi, X., et al. (2014). Arabidopsis phytochrome A directly targets numerous promoters for individualized modulation of genes in a wide range of pathways. Plant Cell Online 26, 1949–1966. doi:10.1105/tpc.114.123950
Cheng, M.-C., Kathare, P. K., Paik, I., and Huq, E. (2021). Phytochrome signaling networks. Annu. Rev. Plant Biol. 72, 217–244. doi:10.1146/annurev-arplant-080620-024221
Dennis, G., Sherman, B. T., Hosack, D. A., Yang, J., Gao, W., Lane, H. C., et al. (2003). DAVID: database for annotation, visualization, and integrated discovery. Genome Biol. 4, R60–R11. doi:10.1186/gb-2003-4-9-r60
Dieterle, M., Zhou, Y. C., Schafer, E., Funk, M., and Kretsch, T. (2001). EID1, an F-box protein involved in phytochrome A-specific light signaling. Genes Dev. 15, 939–944. doi:10.1101/gad.197201
Ding, L.-N., Li, M., Wang, W.-J., Cao, J., Wang, Z., Zhu, K.-M., et al. (2019). Advances in plant GDSL lipases: from sequences to functional mechanisms. Acta Physiol. Plant. 41, 151–211. doi:10.1007/s11738-019-2944-4
Dong, J., Ni, W., Yu, R., Deng, X. W., Chen, H., and Wei, N. (2017). Light-dependent degradation of PIF3 by SCF-EBF1/2 promotes a photomorphogenic response in Arabidopsis. Curr. Biol. 27, 2420–2430.e6. doi:10.1016/j.cub.2017.06.062
Efroni, I., Blum, E., Goldshmidt, A., and Eshed, Y. (2008). A protracted and dynamic maturation schedule underlies Arabidopsis leaf development. Plant Cell 20, 2293–2306. doi:10.1105/tpc.107.057521
Girousse, C., Roche, J., Guerin, C., Le Gouis, J., Balzegue, S., Mouzeyar, S., et al. (2018). Coexpression network and phenotypic analysis identify metabolic pathways associated with the effect of warming on grain yield components in wheat. PLoS One 13, e0199434. doi:10.1371/journal.pone.0199434
Graham, M. A., Silverstein, K. A. T., Cannon, S. B., and Vandenbosch, K. A. (2004). Computational identification and characterization of novel genes from legumes. Plant Physiol. 135, 1179–1197. doi:10.1104/pp.104.037531
Gu, Z., Eils, R., and Schlesner, M. (2016). Complex heatmaps reveal patterns and correlations in multidimensional genomic data. Bioinformatics 32, 2847–2849. doi:10.1093/bioinformatics/btw313
Han, M., Zhang, C., Suglo, P., Sun, S., Wang, M., and Su, T. (2021). L-Aspartate: an essential metabolite for plant growth and stress acclimation. Molecules 26, 1887. doi:10.3390/molecules26071887
Hannah, M. A., Heyer, A. G., and Hincha, D. K. (2005). A global survey of gene regulation during cold acclimation in Arabidopsis thaliana. PLoS Genet. 1, e26. doi:10.1371/journal.pgen.0010026
Hertle, A. P., GarcíA-CerdáN, J. G., Armbruster, U., Shih, R., Lee, J. J., Wong, W., et al. (2020). A Sec14 domain protein is required for photoautotrophic growth and chloroplast vesicle formation in Arabidopsis thaliana. Proc. Natl. Acad. Sci. 117, 9101–9111. doi:10.1073/pnas.1916946117
Huq, E., Lin, C., and Quail, P. H. (2024). Light signaling in plants - a selective history. Plant Physiol. 195, 213–231. doi:10.1093/plphys/kiae110
Jupiter, D., Chen, H., and Vanburen, V. (2009). S TAR N ET 2: a web-based tool for accelerating discovery of gene regulatory networks using microarray co-expression data. BMC Bioinforma. 10, 332–337. doi:10.1186/1471-2105-10-332
Khanna, R., Shen, Y., Toledo-Ortiz, G., Kikis, E. A., Johannesson, H., Hwang, Y.-S., et al. (2006). Functional profiling reveals that only a small number of phytochrome-regulated early-response genes in Arabidopsis are necessary for optimal deetiolation. Plant Cell 18, 2157–2171. doi:10.1105/tpc.106.042200
Kim, E.-H., Poudyal, R. S., Lee, K.-R., Yu, H., Gi, E., and Kim, H. U. (2022). Chloroplast-localized PITP7 is essential for plant growth and photosynthetic function in Arabidopsis. Physiol. Plant. 174, e13760. doi:10.1111/ppl.13760
Langfelder, P., and Horvath, S. (2008). WGCNA: an R package for weighted correlation network analysis. BMC Bioinforma. 9, 559. doi:10.1186/1471-2105-9-559
Lee, I., Ambaru, B., Thakkar, P., Marcotte, E. M., and Rhee, S. Y. (2010). Rational association of genes with traits using a genome-scale gene network for Arabidopsis thaliana. Nat. Biotechnol. 28, 149–156. doi:10.1038/nbt.1603
Lee, J., He, K., Stolc, V., Lee, H., Figueroa, P., Gao, Y., et al. (2007). Analysis of transcription factor HY5 genomic binding sites revealed its hierarchical role in light regulation of development. Plant Cell 19, 731–749. doi:10.1105/tpc.106.047688
Li, D., Fu, X., Guo, L., Huang, Z., Li, Y., Liu, Y., et al. (2016). FAR-RED ELONGATED HYPOCOTYL3 activates SEPALLATA2 but inhibits CLAVATA3 to regulate meristem determinacy and maintenance in Arabidopsis. Proc. Natl. Acad. Sci. 113, 9375–9380. doi:10.1073/pnas.1602960113
Liu, W., Lowrey, H., Xu, A., Leung, C. C., Adamchek, C., He, J., et al. (2024). A circadian clock output functions independently of phyB to sustain daytime PIF3 degradation. Proc. Natl. Acad. Sci. 121, e2408322121. doi:10.1073/pnas.2408322121
Lou, Q., Chen, L., Mei, H., Xu, K., Wei, H., Feng, F., et al. (2017). Root transcriptomic analysis revealing the importance of energy metabolism to the development of deep roots in rice (Oryza sativa L.). Front. plant Sci. 8, 1314. doi:10.3389/fpls.2017.01314
Love, M. I., Huber, W., and Anders, S. (2014). Moderated estimation of fold change and dispersion for RNA-seq data with DESeq2. Genome Biol. 15, 550. doi:10.1186/s13059-014-0550-8
Majee, M., Kumar, S., Kathare, P. K., Wu, S., Gingerich, D., Nayak, N. R., et al. (2018). KELCH F-BOX protein positively influences Arabidopsis seed germination by targeting PHYTOCHROME-INTERACTING FACTOR1. Proc. Natl. Acad. Sci. 115, E4120–E4129. doi:10.1073/pnas.1711919115
Mizobata, T., and Kawata, Y. (2007). “Aspartases: molecular structure, biochemical function and biotechnological applications,” in Industrial enzymes: structure, function and applications (Springer).
Paik, I., Chen, F., Ngoc Pham, V., Zhu, L., Kim, J.-I., and Huq, E. (2019). A phyB-PIF1-SPA1 kinase regulatory complex promotes photomorphogenesis in Arabidopsis. Nat. Commun. 10, 4216. doi:10.1038/s41467-019-12110-y
Pedmale, U. V., Huang, S.-S C., Zander, M., Cole, B J., Hetzel, J., Ljung, K., et al. (2016). Cryptochromes interact directly with PIFs to control plant growth in limiting blue light. Cell 164, 233–245. doi:10.1016/j.cell.2015.12.018
Pfeiffer, A., Shi, H., Tepperman, J. M., Zhang, Y., and Quail, P. H. (2014). Combinatorial complexity in a transcriptionally-centered signaling hub in Arabidopsis. Mol. Plant 7, 1598–1618. doi:10.1093/mp/ssu087
Pham, V. N., Kathare, P. K., and Huq, E. (2018a). Phytochromes and phytochrome interacting factors. Plant Physiol. 176, 1025–1038. doi:10.1104/pp.17.01384
Pham, V. N., Xu, X., and Huq, E. (2018b). Molecular bases for the constitutive photomorphogenic phenotypes in Arabidopsis. Development 145, dev169870. doi:10.1242/dev.169870
Shahan, R., Zawora, C., Wight, H., Sittmann, J., Wang, W., Mount, S. M., et al. (2018). Consensus coexpression network analysis identifies key regulators of flower and fruit development in wild strawberry. Plant physiol. 178, 202–216. doi:10.1104/pp.18.00086
Shen, G., Sun, W., Chen, Z., Shi, L., Hong, J., and Shi, J. (2022). Plant GDSL esterases/lipases: evolutionary, physiological and molecular functions in plant development. Plants 11, 468. doi:10.3390/plants11040468
Shen, H., Luong, P., and Huq, E. (2007). The F-box protein MAX2 functions as a positive regulator of photomorphogenesis in Arabidopsis. Plant Physiol. 145, 1471–1483. doi:10.1104/pp.107.107227
Sun, N., Wang, J., Gao, Z., Dong, J., He, H., Terzaghi, W., et al. (2016). Arabidopsis SAURs are critical for differential light regulation of the development of various organs. Proc. Natl. Acad. Sci. U. S. A. 113, 6071–6076. doi:10.1073/pnas.1604782113
Sun, W., Wang, B., Yang, J., Wang, W., Liu, A., Leng, L., et al. (2017). Weighted gene co-expression network analysis of the dioscin rich medicinal plant Dioscorea nipponica. Front. plant Sci. 8, 789. doi:10.3389/fpls.2017.00789
Suzuki, N., Devireddy, A. R., Inupakutika, M. A., Baxter, A., Miller, G., Song, L., et al. (2015). Ultra-fast alterations in mRNA levels uncover multiple players in light stress acclimation in plants. Plant J. 84, 760–772. doi:10.1111/tpj.13039
Tang, Y., Liu, X., Liu, X., Li, Y., Wu, K., and Hou, X. (2017). Arabidopsis NF-YCs mediate the light-controlled hypocotyl elongation via modulating histone acetylation. Mol. plant 10, 260–273. doi:10.1016/j.molp.2016.11.007
Wang, Y., Fan, X., Lin, F., He, G., Terzaghi, W., Zhu, D., et al. (2014). Arabidopsis noncoding RNA mediates control of photomorphogenesis by red light. Proc. Natl. Acad. Sci. U. S. A. 111, 10359–10364. doi:10.1073/pnas.1409457111
Wohlbach, D. J., Quirino, B. F., and Sussman, M. R. (2008). Analysis of the Arabidopsis histidine kinase ATHK1 reveals a connection between vegetative osmotic stress sensing and seed maturation. Plant Cell 20, 1101–1117. doi:10.1105/tpc.107.055871
Xie, W., Huang, J., Liu, Y., Rao, J., Luo, D., and He, M. (2015). Exploring potential new floral organ morphogenesis genes of Arabidopsis thaliana using systems biology approach. Front. plant Sci. 6, 829. doi:10.3389/fpls.2015.00829
Xin, R., Zhu, L., Salomé, P. A., Mancini, E., Marshall, C. M., Harmon, F. G., et al. (2017). SPF45-related splicing factor for phytochrome signaling promotes photomorphogenesis by regulating pre-mRNA splicing in Arabidopsis. Proc. Natl. Acad. Sci. 114, E7018–E7027. doi:10.1073/pnas.1706379114
Yang, Z., Liu, B., Su, J., Liao, J., Lin, C., and Oka, Y. (2017). Cryptochromes orchestrate transcription regulation of diverse blue light responses in plants. Photochem. Photobiol. 93, 112–127. doi:10.1111/php.12663
Keywords: gene regulatory networks, hub genes, light signaling, WGCNA, photomorphogenesis
Citation: Bai Y, Pham VN and Huq E (2025) Gene co-expression regulatory network analysis identifies novel regulators in light signaling pathways in Arabidopsis. Front. Photobiol. 3:1597248. doi: 10.3389/fphbi.2025.1597248
Received: 20 March 2025; Accepted: 14 May 2025;
Published: 08 July 2025.
Edited by:
Cornelia Klose, University of Freiburg, GermanyReviewed by:
Yongjian Qiu, University of Mississippi, United StatesMartin Balcerowicz, University of Dundee, United Kingdom
Copyright © 2025 Bai, Pham and Huq. This is an open-access article distributed under the terms of the Creative Commons Attribution License (CC BY). The use, distribution or reproduction in other forums is permitted, provided the original author(s) and the copyright owner(s) are credited and that the original publication in this journal is cited, in accordance with accepted academic practice. No use, distribution or reproduction is permitted which does not comply with these terms.
*Correspondence: Enamul Huq, aHVxQGF1c3Rpbi51dGV4YXMuZWR1
†Present address: Vinh Ngoc Pham, Illumina Inc., San Diego, CA, United States
‡These authors have contributed equally to this work