 Gennadi Saiko
 Faraz Sadrzadeh-Afsharazar
 Timothy Burton
 Scott Prahl3
 Alexandre Douplik
- 1Department of Physics, Toronto Metropolitan University, Toronto, ON, Canada
- 2Department of Engineering, Toronto Metropolitan University, Toronto, ON, Canada
- 3Department of Electrical Engineering and Renewable Energy, Oregon Tech, Wilsonville, OR, United States
- 4iBEST, St. Michael’s Hospital, Toronto, ON, Canada
Blood is a complex biofluid with distinct optical characteristics that underpin a range of diagnostic and monitoring technologies. This review examines the absorption, scattering, and refractive index properties of whole blood and its components across the visible and near-infrared spectrum. Blood’s optical properties are determined primarily by water, hemoglobin, and its encapsulation in red blood cells. Hemoglobins dominate blood’s light absorption in the 400–1,100 nm range, with sharp spectral differences between oxygenated and deoxygenated forms. Scattering in whole blood is primarily due to red blood cells and is influenced by hematocrit, oxygenation, shear rate, and osmolarity. Reduced scattering coefficients are close to 13 cm−1 in the whole visible range of the spectrum, and the anisotropy factor is close to unity, indicating highly forward-directed scattering. While other blood cells (white blood cells and platelets) do not contribute significantly to blood’s optical properties, their scattering properties are used in many biomedical applications. We also highlight the role of the geometry of experiment—including detour, sieve, and self-shielding phenomena—in shaping blood’s optical response. Multiple clinical technologies, such as pulse oximetry, are based on blood’s optical properties. Recently reported discrepancies between consumer and clinical devices highlight the need for more accurate models of blood optics for emerging biomedical and wearable sensing applications.
1 Introduction
Blood is a critically important biofluid responsible for transporting oxygen and nutrients to all body tissues and removing waste. Blood has distinct optical features in the visible spectrum range, enabling multiple biomedical optical methods.
The study of optical and, particularly, the absorption properties of blood has a long history. Lavoisier (1743–1794) in 1777 observed that “the respirable portion of air has the property to combine with blood, and its combination results in its red color” (Lavoisier, 1777). Marie Francois Xavier Bichat (1771–1802) expanded Lavoisier’s observations and found that in the capillaries, light red blood was transformed into dark red blood. The opposite was observed in the lungs (Bichat, 1818). However, no explanation was given at the time.
It took another 50 years for these observations to become quantitative. Van Assendelft (1970) wrote in the introduction of his book, “Since the introduction of spectrophotometry, the technique has been applied in the study of haemoglobin and its derivatives. Among those who have contributed to the early spectrophotometric studies of haemoglobin derivatives mention should be made of the following. Angstrom was the first to describe spectral characteristics of blood in 1855 (Ångström, 1855). Hoppe (1862) described the light absorption bands of oxy and haemoglobin in the visible part of the spectrum. First mention of spectral characteristics of haemoglobin in the ultra-violet is made by Soret (1883) in 1878. His work was improved upon by Gamgee and Hill (1903) in 1897 using a quartz spectroscope with the sun as light source. Vierordt and Laupp (1873) again described spectral characteristics of haemoglobin and oxyhaemoglobin, also supplied a method to determine the haemoglobin content of blood samples using spectrophotometry. Calculation of the relative and total concentration of different haemoglobin derivatives was introduced by Hüfner and Pietzcker (1899). Also, in the nineteen thirties a great deal of work on the spectral characteristics of haemoglobin derivatives was published by Drabkin (1935). The first comprehensive monograph on this topic appeared in 1933 (Heilmeyer, 1933).
Despite its long history, blood optics is a dynamic field, which has numerous biomedical applications. With recent advances in sensor technologies, the biomedical field is experiencing a rapid influx of new technologies. As a result, in addition to traditional clinical applications, multiple applications in consumer health emerged. Many of these technologies are optics-based. For example, pulse oximetry found multiple applications in consumer health (smartwatches and Oura ring), and millions of users rely on them in daily life. However, while pulse oximetry technology is being considered as being simple to grasp, the direct comparison between consumer-grade and clinical-grade pulse oximeters paints quite a bleak picture (Zhang and Khatami, 2022). For example, the absolute mean difference between blood oxygen saturation between the Garmin smartwatch (Garmin, Olathe, KS, United States) and clinical oximeter increased from 4.7% to 13.1% when altitude increased from 0 to 5,500 m (Hermand et al., 2021). In part, it may be attributed to the fact that most of these new technologies are being developed outside of traditional biomedical labs, which accumulated extensive experience in the optics of blood. Thus, developers of new optical technologies and other new entrants to the field may benefit from a single source introduction to the field, which may help them to better understand contributing factors and how these factors interact and are interrelated.
This article aims to overview the optical properties of blood with a primary focus on visible and Near InfraRed (NIR) ranges of the spectrum, which are primarily used in clinical and particularly in consumer health applications. Light absorption and scattering by blood are key optical phenomena with distinct features that have found multiple applications in biooptics. While hemoglobin dominates the blood absorption, the blood scattering arises from multiple sources. In general, light scattering arises from a mismatch of refractive indices. Thus, the light scattering in blood arises primarily from a mismatch of refractive indices between the plasma and cells, particularly cell membranes. As such, the discussion of scattering will be incomplete without discussing the refractive index. Moreover, the refractive index of the medium is linked with its absorption through Kramers–Kronig equations (discussed in Sections 2, 3).
The purpose of this article is two-fold. Since the optical properties of blood are interrelated, this article aims to provide a broad overview of the optical properties (including absorption, scattering, and refractive index) of blood and its components. This complements other excellent resources (see, for example, Yaroslavsky et al., 2002), which focus on narrower aspects of the optical properties of blood. In addition, despite the long history, the blood’s optical properties are not a static field. Thus, since the last reviews novel technologies for measuring optical properties have emerged. Additionally, several theoretical concepts (i.e., a link between the refractive index of the medium and its absorption through Kramers–Kronig equations) have been refined. Therefore, the current review aims to accommodate these new developments.
Structurally, the blood consists of four essential components: red blood cells (RBCs), white blood cells (WBCs), platelets, and plasma. Blood plasma is a light, amber-colored liquid component of blood, which contains proteins (e.g., albumin) and other constituents of whole blood in suspension. Plasma comprises about 55% of the body’s total blood volume (50%–59% in men and 56%–64% in women (Cleveland Clinic, 2025). Cellular components comprise another 45% of the body’s total blood volume (hematocrit is 41%–50% in men and 36%–44% in women (Cleveland Clinic, 2025). Red blood cells (RBCs or erythrocytes) dominate among cell components (∼4,500 × 103/μL blood). Other types of cells are white blood cells (leukocytes, ∼8 × 10³/μL blood) and platelets (thrombocytes, ∼300 × 103/μL blood). Given the broad hierarchy of blood components and the complex composition of blood, the optical properties of blood are quite complex as different components contribute to the optical properties at various degrees. As such, in addition to the optical properties of whole blood, we included a review of the optical properties of its components.
Two forms of liquid components of blood are used in clinical tests and biomedical research: blood plasma and serum. Blood plasma is the liquid component of blood in which formative elements (blood cells) have been removed, but which contains proteins and other constituents of whole blood in suspension. It is obtained by centrifugation of the blood. Serum may be defined as blood plasma without the clotting factors, or as blood with all cells and clotting factors removed. To obtain serum, a blood sample is allowed to clot (coagulation), and then centrifuged. As such, the serum contains all the plasma proteins except the clotting factors. The difference in optical properties between plasma and serum is minor. As plasma and serum are often used in biooptical measurements, we also included them in the review.
As a reader may be interested in a particular narrow topic we deliberately separated absorption, refractive index, and scattering into separate Sections (Sections 2–4, respectively). Within each Section, we follow the same structure: starting the analysis of optical properties from individual components and building it to larger structures like cells and whole blood. However, in Section 5 we summarized key findings across various components.
2 Absorption properties of blood and its components
A thorough understanding of the optical behavior of whole blood requires consideration of the individual contributions of its components. Section 2 initiates this examination with a focus on absorption, as characterizing the absorption properties of blood and its constituents offers a foundational perspective on light–tissue interactions within this complex medium.
2.1 Absorption and extinction coefficients
The attenuation of light in a chromophore in the spectroscopic literature is typically reported in reference to molar concentrations (a molar extinction coefficient or extinction coefficient). In general, extinction (attenuation) refers to both absorption and scattering. However, in a non-scattering media, extinction is determined solely by absorption.
A typical spectroscopic setup includes light propagation through a cuvette. The light propagation of an initial light intensity
here ε is the extinction coefficient [cm−1M−1] or [L cm−1mol−1]. Historically, in spectroscopy, the distance is measured in [cm], and the base 10 is used instead of e.
The absorption coefficient μa of a tissue, commonly used in biooptics, is the sum of contributions from all absorbingchromophores within the tissue. Using Equation 1, the absorption coefficient of the medium can be expressed through extinction coefficients and concentrations of its chromophores indexed by i (Equation 2).
here, the absorption coefficient is measured in [cm−1].
However, molar concentrations are not always known. In this case, volume fractions fi of chromophores are used (Equation 3):
Absorption is related to the complex refractive index of the sample. In particular, the complex refractive index m(ω) can be split into the sum of real and imaginary parts, m(ω) = n(ω) + iκ (ω), where the imaginary part refers to dissipation, which can be linked to the absorption coefficient (Equation 4) (Faber et al., 2004).
here, c is the speed of light and ω is the angular frequency of light.
Using this formalism, the imaginary part (absorption) can be linked with the real part of the refractive index using Kramers–Kronig equations (see Section 3). As it is usually easier to measure absorption than refractive index, these relationships are typically used in one direction—to determine the imaginary refractive index using absorption measurements.
2.2 Absorption of blood and its components
Blood primarily consists of plasma (ca. 55% of blood by volume) and RBCs (ca. 45% of blood by volume), the primary cell components of blood. Other cell types can be broadly grouped into leucocytes (white blood cells) and thrombocytes (blood platelets).
2.2.1 Serum and plasma
As cell-free plasma consists of 90% water and 10% proteins, it is important to consider these components (Institute for Quality and Efficiency in Health Care IQWiG, 2023). In particular, the optical properties of blood in most spectral regions are dominated by the optical properties of water. The absorption spectrum of serum compiled from two sources is depicted in Figure 1. The absorption spectrum of water is included for comparison.
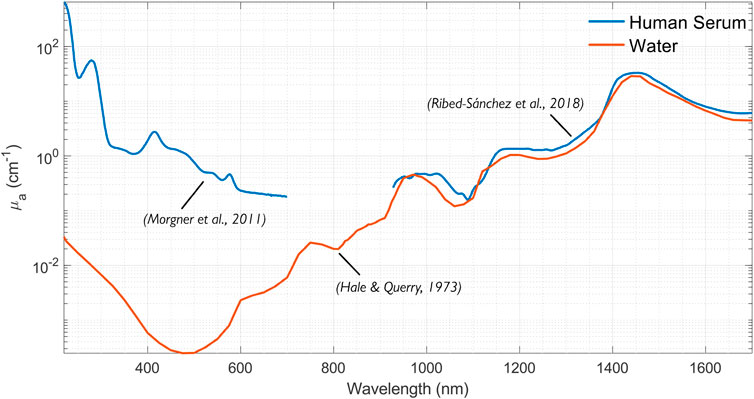
Figure 1. Compilation of the absorption spectra of human serum (Morgner et al., 2011; Ribed-Sánchez et al., 2018) in the 200–1,700 nm range. The water spectrum plotted from data by Hale and Querry (1973).
2.2.1.1 Water
Optical constants of water were measured and reviewed on multiple occasions (see, for example, Querry et al., 1997). Prahl (2025a) reviewed the optical properties of water, including absorption, and found that the data was consistent between the different authors. The water absorption coefficient in the 200–1700 µm range is depicted in Figure 1.
2.2.1.2 Proteins
The absorption of plasma in the IR is dominated by water absorption. However, plasma has much higher absorption than water for UV and visible wavelengths due to the proteins and other molecules (see Figure 1). Moreover, the absorption is subject to individual variability and sample preparation techniques; plasma from different individuals can vary from yellow to green to orange to brown.
Meinke et al. (2007) found that plasma absorption deviates from water absorption in some spectral regions and depends on the preparation. For example, plasma centrifuged at 62,000 g for 1 h showed an absorption peak at 460 nm (attributed to bilirubin), reaching a value of 0.08 mm−1. Plasma centrifuged at 1,600 g for 30 min showed an absorption peak of 0.37 mm−1 at 415 nm and 0.02 mm−1 at 580 nm. These peaks are most likely attributed to free hemoglobin. They also found that plasma absorption above 750 nm generally follows that of water.
2.2.2 Hemoglobin
There have been several studies on the absorption coefficients of hemoglobins. For example, using transmission spectrophotometry, Zijlstra et al. (2021) measured the absorption of hemolyzed hemoglobin in the 450–800 nm range.
A widely-used hemoglobin absorption dataset has been compiled by Prahl (2025b) for molar extinction coefficients of oxy- and deoxyhemoglobins in water in the range of 250–1,000 nm, citing data from van Assendelft (1970), Gratzer et al. (1999), Moaveni (1970), Schmitt (1986) and Takatani and Graham (1979).
As mentioned in Section 2.1, extinction coefficients can be turned into absorption coefficients for any particular hemoglobin content, x, measured in [g/L] (Equation 5).
It should be noted that as hemoglobin is a tetramer, different authors report extinction differently, either per globin (e.g., Zijlstra and Buursma, 1997) or per the whole molecule (e.g., Prahl, 2025b). This results in a correction factor of 4, which may need to be included.
The absorption coefficients for human oxy- and deoxyhemoglobin at normal hematocrit (150 g/L) are depicted in Figure 2.
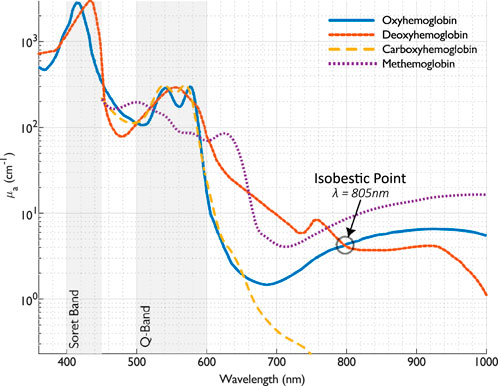
Figure 2. The absorption coefficient of oxy- and deoxyhemoglobin [calculated from the extinction coefficients provided by Prahl (2025b)], and carboxy-and methemoglobin (calculated from the extinction coefficients provided by Zijlstra and Buursma (1997)), at normal hemoglobin concentration (150 g/L).
The absorption spectra of oxy, deoxy-, carboxy-, and methemoglobins in the visible and near-infrared spectral range (450–1,000 nm) were measured by Zijlstra et al. (1991). In addition, they found that the small differences between fetal and adult hemoglobin absorption were significant enough to be considered in a multicomponent analysis of hemoglobin derivatives.
The absorption coefficients for human carboxy- and methemoglobin at normal hematocrit (150 g/L) are depicted in Figure 2, showing substantial divergence for methemoglobin around 630 nm.
2.2.3 Other blood components
2.2.3.1 White blood cells
Meinke et al. (2007) found that the existence of physiological concentrations of leucocytes has no measurable influence on the optical properties of plasma and, therefore, on the optical parameters of whole blood.
2.2.3.2 Platelets
Platelets absorb light much like pure plasma (Meinke et al., 2007). Even when platelets are highly concentrated, the plasma absorption maximum at 410 nm is shifted to 420 nm at 0.79 cm−1.
2.2.4 Whole blood
Whole blood consists of blood plasma and blood cells (primarily RBCs). Whole blood is a densely packed solution of RBCs, where neighboring RBCs may be in contact with each other. The concentration of RBCs in whole blood is characterized by hematocrit (hct), the cell volume fraction within the whole blood volume. A typical range for hematocrit is from 39%–55% in men and 36%–48% in women (Miale, 1989). The hemoglobin concentration ranges from 139–163 g/L (men) and 120–150 (women) for whole blood or 299–357 g/L for packed RBCs collected from donors (Roggan et al., 1999).
The absorption of whole blood has been investigated on several occasions. Most recently, they were reviewed by Bosschaart et al. (2014).
Schmitt (1986) measured hematocrit (hct) and blood oxygen saturation (SO2) using an implantable oximeter.
Roggan et al. (1999) investigated the optical properties of circulating human blood at 633 nm using a double integrating sphere technique and Monte Carlo simulations. They found that “(a) scattering and absorption increased at hematocrit <50%; (b) absorption and scattering decreased slightly with increasing shear rate; (c) the deformation of erythrocytes had no significant impact on the optical properties if volume and hemoglobin content was kept constant; (d) increasing osmolarity leads to an increase of absorption while scattering and anisotropy decreased; (e) increasing hemolysis led to a reduction in absorption and scattering and (f) hemoglobin solutions had a smaller absorption coefficient than whole blood at the same hemoglobin concentration.”
The most surprising finding by Roggan et al. (1999) was that the absorption coefficient μa significantly decreased with increasing hemolysis. In particular, when blood was completely hemolyzed, μa amounted to 0.11 ± 0.03 mm−1, which was only 55% of the value for intact blood (0.20 ± 0.05 mm−1).
Roggan et al. (1999) also measured the absorption coefficients of water and solutions of oxy- and deoxyhemoglobin in water in the 400–2,500 nm range (Figure 3). The absorption of hemoglobin solutions closely follows the spectral dependence of water in the 1,350–2,500 nm range.
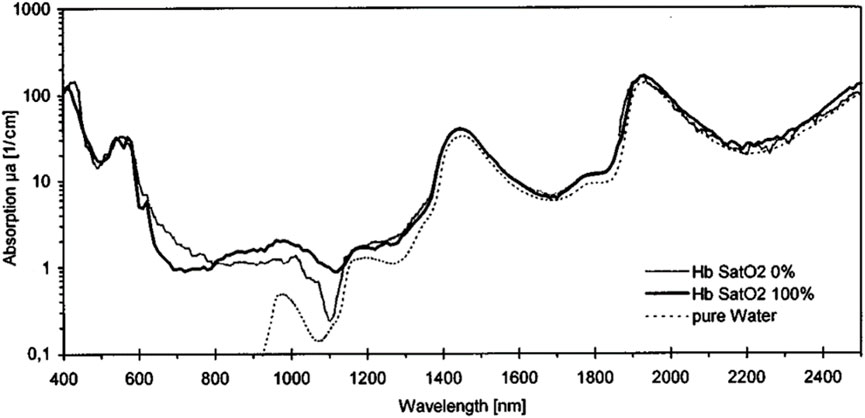
Figure 3. Absorption coefficients of water and solutions oxy- and deoxyhemoglobin in water at hct = 5% and a shear rate of 500 s−1. Reproduced from Roggan et al. (1999) CC BY 4.0.
The position of the absorption peaks of the blood depends on numerous factors. In particular, the position of Q-band peaks (535, 555, 576 nm) depends on oxygenation. The peak in the Soret band (400–450 nm) depends on numerous factors. For example, it depends on the age of the bloodstain (Hanson and Ballantyne, 2010), which can be used in criminology. Hanson and Ballantyne (2010) found a blue shift in the visible absorption spectrum of the Hb Soret band (from 414 nm to 408 nm) that strongly correlates with the age of the bloodstain. In addition to the age, the magnitude of the shift (0–7 nm) also depends upon the ambient temperature and relative humidity. The molecular basis for the observed Soret band blue-shift is likely based upon oxidation, dehydration, and hemichrome formation, followed by the eventual loss of coordinated heme and release of free iron.
The absorption of the whole blood is affected by multiple factors. Below are the primary factors that may impact measurements.
2.2.4.1 Hematocrit
Blood absorption is affected by hematocrit. As mentioned, Roggan et al. (1999) found that scattering and absorption increased linearly at hct < 50%. Several other effects may affect light absorption by blood, including so-called detour and sieve effects.
Pigments are typically found to be concentrated in cells (hemoglobins) or organelles (melanin); thus, the distribution of hemoglobin in the blood is not uniform. As a result, when light traverses the turbid media, refractive index mismatches between cell walls and intercellular medium cause multiple internal scatterings that increase the light optical pathlength, increasing the probability of light absorption. This lengthening of the optical pathlength is referred to as the detour effect (Butler, 1964).
The distribution of absorbers within a target media can also have an opposite effect on light absorption. For example, light may traverse a turbid media, such as blood, without encountering any pigment-containing structures, effectively passing through a sieve. The sieve effect in the blood can decrease absorption at strongly absorbed wavelengths.
Detour and sieve effects have opposite impacts on absorption. Moreover, they are dominant in different spectral ranges. While the detour effect is more noticeable in bands of absorption minima (Garlaschi et al., 1989), the sieve effect is more noticeable in bands of absorption maxima (Rabinowitch, 1951). Absorption spectra with strong sieve effects show flattened absorption peaks, hence the alternative term flattening effect.
Northam and Baranoski (2010) investigated the sieve factor in blood samples and its dependence on hematocrit and blood sample thickness using in silico modeling, namely, ray-casting techniques to compute the probability of a light ray intersecting these cells as it traverses a blood sample. In addition to a strong dependence on hematocrit, they found a strong dependence on the blood sample thickness (see Figure 4). However, the effect is noticeable only for both low hematocrit (below 10%) and thin sample thicknesses (below 1 mm).
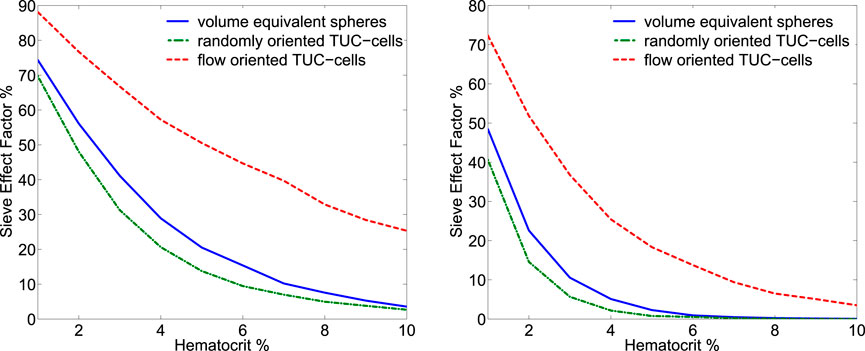
Figure 4. Plots of sieve effect factors (comparison with uniformly distributed hemoglobin from lysed blood cells) were computed for blood samples with thickness equal to 0.1 mm (left panel) and 0.5 mm (right panel). Three representations for the erythrocytes were considered in these experiments: volume equivalent spheres, randomly oriented torus with a cylinder or TUC-cells, and flow-oriented TUC-cells. Reproduced from Northam and Baranoski (2010) with permissions.
2.2.4.2 Oxygenation
The absorption of whole blood depends on the oxygenation. The isosbestic point, where absorption is independent of the oxygenation level, is at 805 nm (See Figure 2).
The difference in absorption between Hb and HbO2 is used to determine blood oxygenation by optical means. In a typical scenario, two wavelengths are used, one with dominant Hb absorption (e.g., 660 nm) and one with dominant HbO2 absorption (e.g., 880 nm).
2.2.4.3 Shear rate
RBC movement in blood vessels affects many things, including optical interactions. Overall, absorption and scattering decrease slightly with increasing shear rate (Roggan et al., 1999) (see Figure 5). High shear rates deform the RBCs and their orientation in the flow.
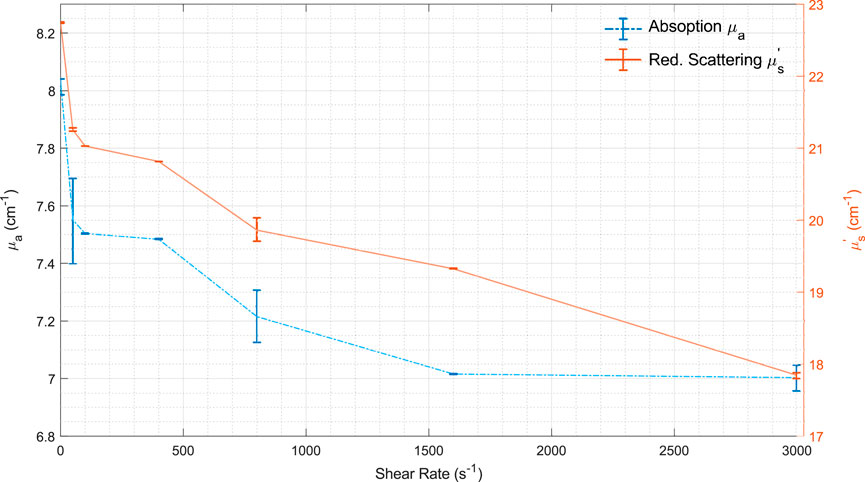
Figure 5. Mean values for μa and μs’vs. shear rate. Modified from Roggan et al. (1999) CC BY 4.0. Lines are used just as a visual guide.
The optical impact of deformation is most likely relatively minimal. For example, Roggan et al. (1999) found that the deformation of erythrocytes had no significant impact on the optical properties when volume and hemoglobin content were kept constant.
However, flow-induced orientation (alignment) changes of RBCs may substantially influence optical properties through the sieve effect. In Figure 4, the absorption depends significantly on the orientation of RBCs (randomly oriented vs. flow-oriented). This effect is most likely noticeable only in solutions with low hematocrits (less than 10%) and thin thicknesses (less than 1 mm).
2.2.4.4 Osmolarity
A fluid’s osmotic concentration or osmolality measures the total number of solute particles (measured in osmoles or Osm) per kilogram of solvent. Osmolarity is a very similar concept, which measures the total number of solute particles (measured in osmoles or Osm) per liter of solvent. Blood osmolality or osmolarity characterizes the body’s electrolyte–water balance. The normal osmolality range is between 285 and 295 mOsm/kg for adults and 275 and 290 mOsm/kg for children (Swiner, 2022). Blood osmolarity is primarily regulated by vasopressin, also known as antidiuretic hormone (ADH), which controls the body’s water balance.
Changes in the plasma osmolarity lead to significant changes in the shape of the erythrocytes. In hyper-osmotic plasma, red blood cells shrink, often taking on a crenated appearance. In hypo-osmotic plasma, red blood cells swell and may become spherical.
The shape of the RBCs affects the optical properties of blood. As mentioned, Roggan et al. (1999) found that increasing osmolarity leads to increased absorption while scattering and anisotropy decrease. Specifically, the absorption coefficient μa increases with osmolarity, i.e., with cell shrinkage. At 225 mOsm/L, μa amounted to60% of the value measured under isotonic conditions (300 mOsm/L), while μa was 150% of the isotonic value at 450 mOsm/L (Roggan et al., 1999).
2.2.4.5 Absorption heterogeneity
The blood distribution in tissues is highly heterogeneous. In healthy tissues, hemoglobin molecules are confined in the red blood cells, and RBCs are confined within blood vessels. When hemoglobin strongly absorbs light, the light intensity in the center of the RBC or vessel will be less than at its periphery. As inner layers contribute less to absorption, it results in smaller apparent (or measured) absorption than theoretical absorption.
This mechanism is occasionally called self-shielding (see, for example, Moço et al., 2018), and it causes spectral flattening. The self-shielding mechanism is similar for RBCs and blood vessels. However, they have different geometries: spherical or ellipsoidal in the case of RBCs and cylindrical in the case of blood vessels.
2.2.4.5.1 Red blood cells
Duyens (1956) examined the absorption differences between particles in suspension and solution, identifying this as a factor causing the absorption spectrum of a particle suspension to appear flattened compared to that of a solution. Building on Duyens’ approach, Bosschaart et al. (2014) derived an absorption correction for blood (Equation 6).
where μa,bl, and μa,Hb are the absorption coefficient of a blood sample and hemoglobin solution, respectively. Here, dRBC and μa,RBC are the diameter of RBC and the absorption coefficient inside the red blood cell.
2.2.4.5.2 Blood vessel diameter
Due to strong light absorption by blood, the fluence rate near the center of the larger vessel can be much lower than at the periphery. Thus, red blood cells near the center of a vessel absorb less light than those at the periphery. However, unlike RBCs, which have similar volumes, blood vessels have different diameters, which may affect light propagation. Thus, in the case of blood vessels, the correction factor depends on its diameter instead of a generic correction factor.
Verkruysse et al. (1997) investigated the effect of inhomogeneous blood distribution in tissues by calculating a single blood vessel’s cross-sectional average fluence rate. They numerically estimated a scaling factor and found that diffuse and collimated light depends on the product of the blood vessel radius R and blood absorption coefficient, µa,bl. They observed that the use of a homogeneous distribution of blood to represent the influence of blood vessels on light distributions in skin tissue overestimates the influence of absorption of light by the blood when the absorption length (1/µa,bl) is equal to or less than the vessel radius R.
The scaling factor f connects the actual blood volume (Cbl) with the apparent blood volume (Cbl,app) (Equation 7):
Several approaches have been proposed to approximate the scaling factor. For example, Moço et al. (2018) used the following scaling function for collimated light (Equation 8).
3 Refractive index of blood and its components
Building on the analysis of absorption, Section 3 turns to the refractive index—another fundamental optical property that governs light propagation in biological media. Understanding the refractive indices of blood and its components is essential for interpreting scattering behavior and for applying dispersion relations such as the Kramers–Kronig formalism.
3.1 Refractive indices of solutions
Blood represents a complex mixture of components dominated by water. If we know the refractive index of these components, several analytical approaches can be used to calculate the refractive index of the media.
In particular, the law of Gladstone and Dale states that the resulting value of the refractive index
where ni and fi are the refractive index and volume fraction of the individual components, respectively, and N is the number of components (Khlebtsov et al., 2002).
Modeling the behavior of the refractive index of tissues, blood, and their components, can be based on a remarkable property of proteins: equal concentrations of aqueous solutions of different proteins all have approximately the same refractive index, npw (Barer et al., 1953). Moreover, the refractive index varies almost linearly with concentration, cp (Equation 10):
where nw is the refractive index of water and αp is the specific refractive increment, cp is measured in grams per 100 mL (g/dL). For example, the refractive index of human erythrocyte cytoplasm, defined by the cell-bounded hemoglobin solution, can be found from this equation at αp = 0.001942 valid for a wavelength of 589 nm; i.e., for normal hemoglobin concentration in the cytoplasm of 300–360 g/L, the RBC refractive index nRBC = 1.393–1.406 (Roggan et al., 1999). Values of specific refractive increment αp for total serum (human) and total albumin measured by Abbe refractometer at a wavelength of 589 nm were found to be 0.00179 and 0.00181, respectively (Barer et al., 1953).
It should be noted that the optical properties of blood and its components are typically measured at several wavelengths. Only a few investigators have published the refractive index across a whole spectral region. For example, using an internal reflection technique, Liu et al. (2019) measured the refractive indexes of whole blood and its components, such as serum, plasma, and hemoglobin, in the 400–750 nm spectral range with a spectral resolution of about 0.263 nm.
Below, we will summarize experimental results for various blood components.
3.2 Blood and component refractive indices
3.2.1 Water
The refractive indices of water,
here, the wavelength λ is measured in [nm]. As the refractive index of the water depends on the wavelength, the blood’s RI depends on the wavelength, too. Thus, blood can be considered as a dispersive medium.1
Dispersion curves of the blood and its components are typically characterized by several standard fitting functions (e.g., the Cauchy equation for plasma).
3.2.2 Serum and plasma
The refractive indexes of serum and plasma in the visible range of the spectrum decrease while the wavelength increases. The most common approach to characterize the dispersion of serum and plasma is to use the so-called Cauchy equation (Equation 12):
here, the empirical coefficients A, B, and C are calculated by a fitting program, and λ is the wavelength [nm]. Estimations for empirical coefficients of the Cauchy equation reported by several groups are presented in Table 1.
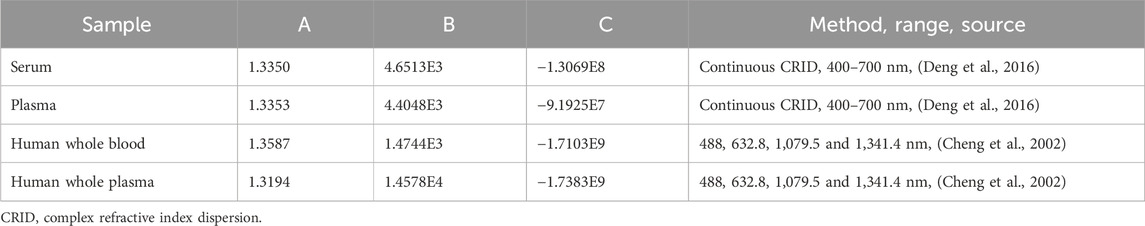
Table 1. Estimations for empirical coefficients of the Cauchy equation.
Meinke et al. (2007), using an Abbe refractometer, found that the refractive index of plasma is 1.3577 at 400 nm, 1.3506 at 500 nm, 1.3473 at 600 nm, and 1.3438 at 700 nm.
Jin et al. (2006) measured the refractive indexes of serum and plasma and reported only a marginal difference between them.
Tuchin et al. (2004) obtained another approximation for the refractive index of blood plasma,
Another approximation, which is commonly used in blood optics, is the so-called Sellmeier formula (Equation 14), where
For example, Liu et al. (2019) used it to approximate the dispersion of the whole blood.
3.2.3 Hemoglobin
Faber et al. (2004) determined the complex refractive index of oxygenated and deoxygenated hemoglobin in the wavelength range 250–1,000 nm using a Kramers–Kronig analysis from tabulated data (Prahl, 2018). The calculated values were calibrated with the optical path at 800 nm explicitly measured using optical coherence tomography. They found that the refractive index depends on oxygenation.
The hemoglobin solution demonstrates anomalous dispersion, which occurs at 420 nm (the Soret band), and slight anomalies in the range of 500–600 nm (Q bands) (see Figure 6).
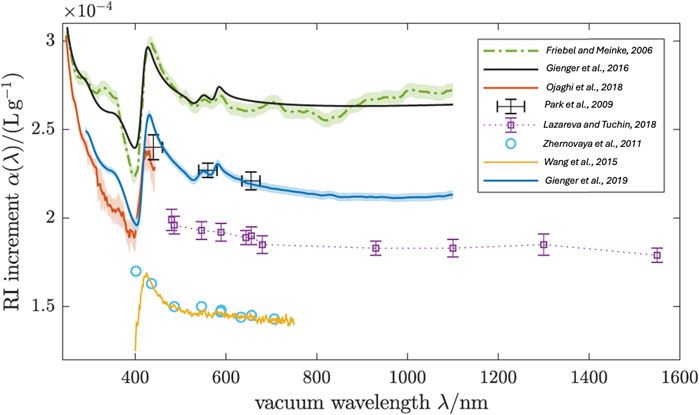
Figure 6. Real RI increment of oxygenated human RBCs. The blue line is the arithmetic mean of the individual curves in Figure 8. Various literature values for the RI increment of oxygenated Hb solutions and RBCs are compared. Samples for these measurements were: (i) Hb solutions from powder (Park et al., 2009; Zhernovaya et al., 2011; Wang et al., 2015) (ii) Hb solutions from freshly hemolysed RBCs (Friebel and Meinke, 2006; Lazareva and Tuchin, 2018), and (iii) single native RBCs (Ojaghi et al., 2018). The Kramers–Kronig computation (Gienger et al., 2016) matched to (Friebel and Meinke, 2006) shows the RI dispersion expected from the accurately known extinction spectrum γ(λ). Modified from Gienger et al. (2019) CC BY 4.0.
Friebel and Meinke (2006) used Fresnel reflectance to measure the real part of the complex refractive index of oxygenated native hemoglobin solutions in the wavelength range 250–1,100 nm. They measured several concentrations, including 0, 4.6, 10.4, 16.5, and 28.7 g/dL. As a result, instead of Barer’s formula (Equation 10), they proposed a modified model function (Equation 15):
They found that in the wavelength ranges 310–355 nm and 500–1,100 nm (normal dispersion), a mean specific refractive increment β = (0.00199 ± 0.000036) dL/g can be used without increasing the error significantly. They also found that the specific refractive increment of their model function gives a 44% higher value at 589 nm compared to Barer’s formula (Equation 10).
Park et al. (2009) measured the dispersion of Hb solutions prepared from Hb protein powder at 440, 546, 560, 580, 600, 655, and 700 nm using spectroscopic phase microscopy.
Zhernovaya et al. (2011) measured the refractive index of human deoxygenated and oxygenated hemoglobin for nine wavelengths between 400 and 700 nm for various hemoglobin concentrations (up to 140 g/L). They found that the refractive indices are well described by linear dependence on concentration (see Equation 10). They also found specific refraction increments for each wavelength (see Table 2). They also used a modified Barer’s equation (Equation 10), where instead of the refractive index of water they used empirically found the effective refractive indices at zero concentration, n0 (see Table 2).
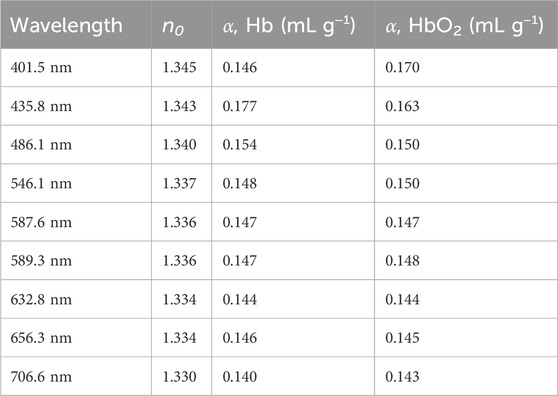
Table 2. The effective refractive indices at zero concentration and the specific refraction increments for the deoxygenated (Hb) and oxygenated hemoglobin (HbO2). Reproduced from Zhernovaya et al. (2011) with permissions.
Sydoruk et al. (2012) demonstrated that in the calculation of the refractive index of hemoglobin solution using Kramers–Kronig (KK) transformation, the dispersion of the refractive index of the non-absorbing solvent (water) needs to be taken into account in addition to the absorption of hemoglobin (imaginary part). In particular, they obtained a practical equation for the calculation of the refractive index of hemoglobin solutions (Equation 16):
here, ΚHb is the imaginary part of the hemoglobin refractive index, and PV represents the integral’s Principal value.
By accounting for water refractive index (RI) dispersion, Sydoruk et al. (2012) obtained good agreement with the experimental results of Friebel and Meinke (2006) in the range 250–1,000 nm and Zhernovaya et al. (2011) in the range 440–700 nm.
Figure 7 demonstrates the importance of explicitly including the refractive index of water. Calculations by Faber et al. (2004) (bottom curve) do not agree with experimental data by Friebel and Meinke (2006) (dotted curve). However, the explicit inclusion of the refractive index of water (Equation 16) provides a much better fit for experimental data.
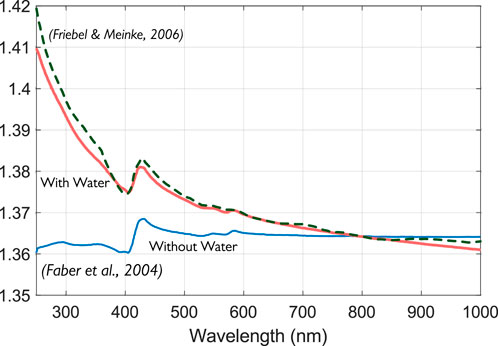
Figure 7. The real part of the complex refractive index of HbO2 was obtained from a subtractive KK analysis with (upper solid curve) and without (lower solid curve) inclusion of water RI dispersion. Modified from Sydoruk et al. (2012) with permissions.
Wang et al. (2015) measured the complex refractive index dispersion (CRID) of oxygenated and deoxygenated hemoglobin solutions in the continuous wavelength range of 400–750 nm with spectral resolution of about 0.259 nm. They also compared results obtained using KK transformation and found a good match. For example, the Soret band appeared almost at the same location for the two methods, and the CRID results show a fair agreement, with a shift of no more than 0.002.
Lazareva and Tuchin (2018), using a multiwavelength Abbe refractometer, measured the refractive index of hemoglobin solutions in the visible/near-infrared (NIR) spectral range at room temperature for characteristic laser wavelengths: 480, 486, 546, 589, 644, 656, 680, 930, 1,100, 1,300, and 1,550 nm. The Sellmeier formula (see Equation 14) was used to approximate RI dispersion. They found the RI-specific increment of hemoglobin as 0.192 ± 0.005 mL/g for the wavelength 589 nm and temperature at 23°C, which is quite close to Barer’s result (Barer et al., 1953). They also summarized RI measurements from the literature.
Using an internal reflection technique, Jin et al. (2006) measured the refractive indexes of hemoglobin and other blood components in the spectral range of 400–750 nm. However, the hemoglobin they used was not controlled for oxygenation.
3.2.4 RBC
A human RBC is a unique anucleate cell that can be considered a concentrated hemoglobin solution encapsulated by the lipid membrane. As such, the refractive index of RBC may have different values when measured by different methods.
In light scattering measurements, the primary scattering mode is caused by the refractive index mismatch on the membrane/plasma layer. Thus, this method will provide a surface refractive index. However, quantitative phase imaging (e.g., tomographic phase microscopy) will sample the refractive index of the whole RBC. Thus, it can be considered as a bulk refractive index.
The hemoglobin concentration inside erythrocytes is 250–350 g L−1 (Meinke et al., 2011). Preparation of such high Hb concentrations is challenging, with problems arising from the strong absorbance in this spectral range and from sample preparation at physiological concentrations exceeding CHb = 300 gL−1 due to high viscosity or incomplete dissolution of Hb (Barer and Joseph, 1954). However, there are good reasons to expect that the linear relationship with concentration (Equation 10) holds true for these concentrations as well. In particular, Zhernovaya et al. (2011) experimentally observed a linear dependence for solutions of methemoglobin in water with hemoglobin concentrations up to 280 g L−1. Thus, they estimated refractive indices at 320 g L−1to be 1.383 for both forms of hemoglobin at 589 nm.
Ojaghi et al. (2018) determined the optical properties of RBCs (including RI) in the 240–450 nm range using Ultraviolet Hyperspectral Interferometric Microscopy. They found excellent agreement between the data measured from an intact RBC and the expected results on hemoglobin solution at 336 g/L.
Gienger et al. (2019) determined the refractive index of human red blood cells between 290 nm and 1,100 nm by optical extinction measurements in six volunteers. They found the RI increment used Barer’s formula (See Figure 8). They also found that while there is significant interpatient variability, all six curves lie around α ≈ 0.22 mLg−1, with differences of about 0.015 mLg−1 being present between the highest curve (A) and the lowest (D) for most wavelengths, however reaching 0.036 mLg−1 at the Soret band around 420 nm.
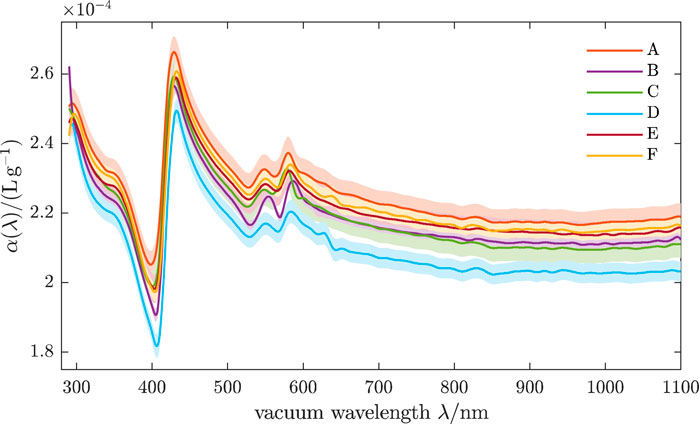
Figure 8. Real RI increment of oxygenated human RBCs. Shaded bands indicate ±1 estimated uncertainties, accounting for noise in the analyzed spectra and uncertainties of CBC parameters. Curves A-F stand for different volunteers. Reproduced from Gienger et al. (2019) CC BY 4.0.
3.2.4.1 Birefringence
Normal RBCs are typically considered not birefringent (Ascenzi and Silvestroni, 1953). However, Nagesh et al. (2014) found that when trapped with a linearly polarized laser, a normal human RBC reorients about the electric polarization direction and remains rotationally bound to this direction. This behavior is expected for a birefringent object. The birefringence is confined to the cell’s dimple region, and the slow axis is along a diameter (Nagesh et al., 2014). The study reported an average retardation of 3.5 ± 1.5 nm for linearly polarized green light (λ = 546 nm) using a polarizing microscope. Also, the study estimated a retardation of 1.87 ± 0.09 nm from the optomechanical response of the RBC in an optical trap (Nagesh et al., 2014). The authors attributed birefringence to the lipid bilayer’s phospholipid molecules and the membrane curvature variation.
3.2.5 Other blood cells
3.2.5.1 White blood cells
White blood cells are the immune response component of blood and contain many cell types, including neutrophils, lymphocytes and monocytes, eosinophils, and basophils. Lymphocytes and monocytes are the simplest from a structural perspective, having an approximately spherical shape and containing only one nucleus (Zharinov et al., 2006). Zharinov et al. (2006) validated a five-layered spherical model using light scattering data to simulate the optical properties of lymphocytes and monocytes and found refractive indices of 1.345 ± 0.006 and 1.344 ± 0.010. These results are similar to those found by Metcalf et al. (1978) using the index matching method, which yielded a lymphocyte refraction index of 1.3572 ± 0.0002.
3.2.5.2 Platelets
Platelets have a thrombotic function in blood, aggregating in response to injury. Kolesnikova et al. (2006) studied the refractive index of platelets using a theoretical methodology validated with experimental data based on a light scattering approach. They found a refractive index ranging from 1.36–1.44, similar to that used in clinical optical platelet counters (Marionneaux et al., 2013).
3.2.6 Whole blood
In the visible range of the spectrum (400–750 nm), Liu et al. (2019) measured the refractive index of whole blood and its component based on internal reflection and used the Sellmeier formula (see Equation 14) to approximate the dispersion of the whole blood. They obtained 0.7960, 5.1819, 1.0772 × 10⁴, and −7.8301 × 10⁵ for A1, A2, B1, and B2, respectively.
The optical properties of the whole blood in the 250–2,500 nm range were reviewed by Bosschaart et al. (2014). Using the subtractive KK transformation, they also calculated the optical properties of the real part of the whole blood including the refractive index from absorption measurements.
Rowe et al. (2017) analyzed the complex refractive index of the blood in the mid-IR range. They found that it closely resembles the refractive index of water. In Figure 9, one can see the deviations of the RI of whole blood from the refractive index of water.
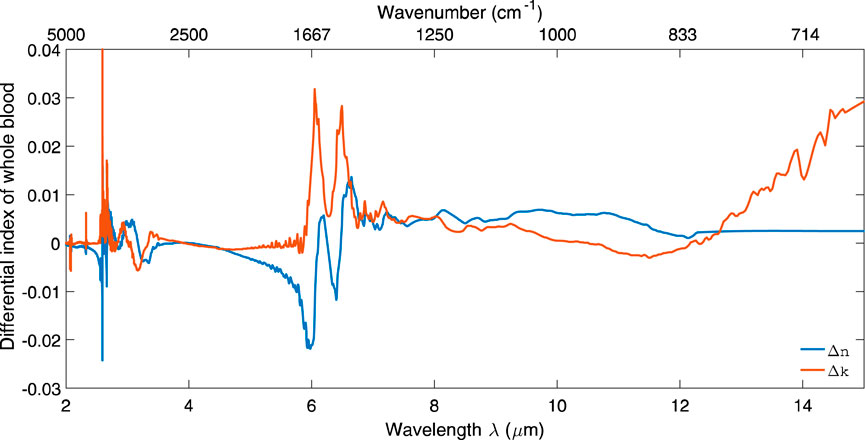
Figure 9. Change in the real and imaginary parts of refractive index for whole blood with respect to water in the mid-IR range. Reproduced from Marionneaux et al. (2013) CC BY 4.0.
The complex refractive index of the blood in the mid-IR range can be found in Rowe’s (2017) dataset (Rowe, 2017).
4 Light scattering by blood and blood components
The light scattering arises from a mismatch of refractive indices. Thus, the light scattering in blood arises primarily from a mismatch of refractive indices between the plasma and cells. As red blood cells are the most abundant cells in the blood, the scattering in blood primarily originates from them.
There are several approaches for light scattering measurements. Broadly, they can be categorized into static and dynamic light scattering.
Static light scattering (SLS) measures the time-averaged intensity of the scattered light. Thus, static light scattering provides information about particle/molecular size.
Dynamic light scattering (DLS) measures the time-dependent fluctuations in the scattered light intensity. DLS allows the determination of the translational diffusion coefficients (i.e., Brownian motion) and particle/molecular size. Thus, dynamic light scattering provides information about the cell dynamics and membrane properties.
Scattering is characterized by scattering cross-section and scattering distribution or scattering function. As the cross-section (or the scattering coefficient) will be the primary topic of this Section, below, we briefly discuss the scattering function pertinent to scattering on blood.
The scattering function of an individual scatterer like RBC can be found using Mie theory. However, as in the whole blood, the concentration of cellular components (RBCs, primarily) is very high, and the multiple scattering effects must be considered. Thus, instead of scattering phase functions of individual scatterers, statistical approaches are more relevant, and the scattering phase functions of the ensemble of the particles can be used.
In biooptics, the most used scattering phase function for tissue is the Henyey-Greenstein function (HG), first proposed by Jacques et al. (1987) (Equation 17):
where g is the scattering anisotropy parameter defined as the average cosine of the scattering phase function g = <cosθ>. When g = 0 scattering is isotropic, g = 1 implies total forward scattering, and g = –1 is for total backward scattering.
In diffuse approximation, light propagation in a medium is described by the absorption coefficient and the reduced scattering coefficient, which is defined as μs’ = μs (1−g), where μs is the scattering coefficient, and g is the anisotropy factor.
Whole blood is characterized by a very high anisotropy factor (close to 1), which implies strong forward scattering.
4.1 Plasma
The scattering properties of pure plasma are expected to be described by Rayleigh scattering of protein molecules, resulting in a scattering cross-section that decreases with increasing wavelength (∼λ−4) and isotropic scattering. However, Meinke et al. (2007) found that the scattering anisotropy factor g for the plasma is about 0.2, indicating a slightly forward scattering and a scattering coefficient that was much higher than expected by Rayleigh scattering only, based on calculations for a 10% albumin solution. Based on Mie’s theory, they estimated that particles with a size of approximately 100 nm and a total concentration of 10% must be present to explain the deviation from Rayleigh scattering. They attributed these particles to protein aggregates and lipids or cell components, which the centrifugation procedure could not remove.
4.2 RBC
Human RBCs are anucleate cells containing a dense hemoglobin solution, which is believed to be the primary component for the scattering and absorption of the UV, blue, and green spectral ranges of light (Lazareva and Tuchin, 2018).
A typical RBC shape is biconcave. However, depending on ambient factors (for example, moving in blood vessels), the RBC shape can deviate from the biconcave. In addition, red blood cells can undergo shape change from the “normal” discocyte to either echinocytes or stomatocytes, depending on a large variety of membrane and cytoplasmic parameters (see, for example, Mauer et al. (2017)). In particular, RBC shapes can be characterized by their asphericity α, which describes the deviation from a spherical shape. Asphericity ranges from 0.1 for a stomatocyte (or a cup-like shape) to 0.15 for a biconcave (or discocyte) shape.
4.2.1 Shear rate
In flow, some rheological transformations of blood components may occur. In particular, changes may depend on the shear rate, defined as the slope of the velocity profile. This rate is high when the flow velocity is high and the vessel diameter is small; conversely, the shear rate is low when the flow velocity is low and the vessel diameter is large. For example, reversible aggregation may occur at lower shear rates, while erythrocytes are deformed into ellipsoids under higher shear rates. The shear rate also impacts the alignment of RBCs.
The shear rate in blood vessels can vary depending on the location, vessel size, and blood flow rate. For example, the wall shear rates in large veins can be as low as 10 s−1, while in arteries, it can be as high as 1,000 s−1, and in pathology, it can be above 5,000 s−1 (Casa et al., 2015).
4.2.2 Deformability
Red blood cells (RBCs) deform (e.g., elongate) as they traverse capillaries that are sometimes smaller in diameter than the RBC itself. RBC deformation is thought to be an important stimulus for ATP export from RBCs and allows them to dilate arterioles and readily traverse capillaries (McMahon, 2019). The RBC deformability can be measured by several methods, including micropipette, filterability, ektacytometry, and using optical tweezers (Musielak, 2009). For example, in the optical tweezer technique, optical force is applied to opposite ends of a visualized cell, and one of the laser beams is moved inward, deforming the cell. To quantify deformability, the elongation index (EI), which is the ratio of length to width of the RBC, is reported as a function of stress.
Changes in deformability can be associated with certain diseases. For example, Agrawal et al. (2016) used optical tweezers to study the deformability of RBCs from type 2 diabetes mellitus (T2DM) patients with or without diabetic retinopathy compared to matched healthy controls. They found that deformability was modestly but significantly lower in both groups of T2DM patients than in the healthy controls.
4.2.3 Osmolarity
The composition of the surrounding medium of the cells can disturb the iso-osmotic balance of 300 mOsm/L. In a medium of low osmolarity (<300 mOsm/L), the cells start to swell by diffusion of water into the cell, leading to spherically formed cells, which become full to the point of bursting. In a hyperosmolar medium (>300 mOsm/L), cells shrink due to water outflow, resulting in characteristically shaped cells called spinocytes. These variations in osmolarity change not only the shape and volume of the cells but also the inner cell Hb concentration. As a result, the complex refractive index inside the cell increases due to increased Hb concentration.
Roggan et al. (1999) found that increasing osmolarity increases absorption while scattering and anisotropy decrease.
Mauer et al. (2017) used the Rayleigh–Gans-Debye approximation to calculate static and dynamic light scattering for a single red blood cell (RBC). Their results showed that the static scattering function averaged over many possible orientations of a diffusing RBC is not highly sensitive to changes in RBC membrane properties, such as shear elasticity and bending rigidity, or to moderate variations in RBC shapes (e.g., biconcave vs. stomatocyte). Based on this, they concluded that orientationally-averaged static light scattering (SLS) measurements are unlikely to be practical for detecting changes in RBC shape. However, they found that dynamic light scattering (DLS), which analyzes the temporal correlations of instantaneous scattering amplitudes, can effectively reveal the diffusive behavior of an RBC and its membrane properties.
4.2.4 Static light scattering
Mauer et al. (2017), using a triangulated discocyte model of the RBC, calculated the static light scattering on RBC using two mesoscopic hydrodynamics approaches, multi-particle collision dynamics (MPCD) (Gompper et al., 2009) and dissipative particle dynamics (DPD) (Espanol and Warren, 1995).
The calculated scattering intensities of the RBC for different orientations are depicted in Figure 10. One can see that the scattering intensities of RBC for small wave vectors q = 2π/λ are like those of short cylinders. They start to diverge only for larger wave vectors q. Thus, the first and second minima for RBC-shape intensity can be matched with the theory to produce estimates of the height h and radius R of the discocyte.
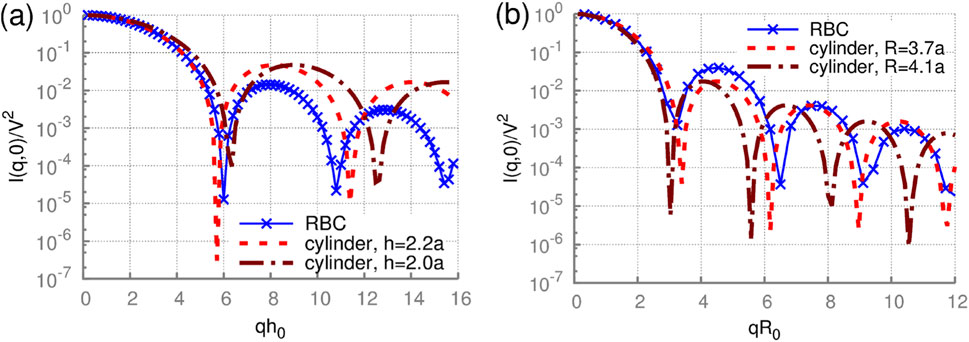
Figure 10. Static scattering by an RBC with a fixed orientation. The scattering intensity of a rigid discocyte for wave vectors q (a) parallel and (b) perpendicular to the RBC axis of rotational symmetry. h0 = 2a. Analytical solutions for cylinders with different radii R0 and heights h0 are also plotted for comparison. Reproduced from Mauer et al. (2017) CC BY 4.0.
In Figure 11, one can see the static scatting intensity averaged over multiple directions.
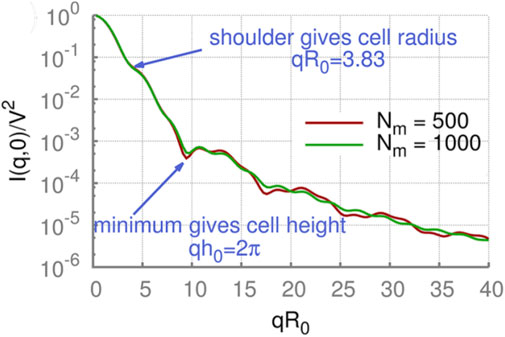
Figure 11. Orientationally-averaged static scattering functions of RBCs using the DPD method can be used to find cell height and radius. Simulation results converge, as shown by simulations with different numbers of triangles that approximate the shape (Nm = 500 and 1,000). V is the cell volume. Reproduced from Mauer et al. (2017) CC BY 4.0.
The orientationally-averaged scattering intensity is obviously different from the case of a fixed orientation; however, characteristic features are still visible. Firstly, a shoulder in the scattering intensity at qR0 = 3.83 is clearly visible in all cases, corresponding to the RBC radius. Secondly, the scattering curves have a local minimum at qh0 = 2π related to the thickness of RBCs. Thus, RBCs’ two main geometrical characteristics remain visible in the orientationally-averaged scattering intensities.
However, Mauer et al. (2017) found that differences in the static scattering function for biconcave and stomatocytic RBC shapes are not very pronounced. Therefore, the orientationally-averaged SLS function is not expected to be sensitive to changes in membrane properties and moderate alterations in cell shapes.
4.2.5 Dynamic light scattering
Mauer et al. (2017) used computer simulations of dynamic light scattering to calculate the translational diffusion of normal and deformed RBCs.
Park et al. (2011) used Fourier Transform Light Scattering (FTLS) to study the static and dynamic light scattering on red blood cells during the metabolic remodeling of the membrane. Using dynamic scattering, they found that the alterations in mechanical properties of the RBC membranes are ATP-dependent.
4.2.6 Multiple-scattering effects
In whole blood, the concentration of RBCs may be as high as 55%, and multiple-scattering effects must be considered.
For large ensembles of erythrocytes (like whole blood), approaches to account for the contribution of multiple scattering effects are required. They will be discussed in Section 4.4. However, some simple conclusions can be derived for the smaller groups of RBCs (e.g., hundreds or thousands of RBCs). For example, due to the strong forward-scattering nature of scattering on cellular blood components, one could expect that the contribution of multiple-scattering effects will be relatively small. This notion was confirmed indirectly by He et al. (2004), who investigated the interaction of light with multiple red blood cells using the finitedifference time-domain (FDTD) method (Drezek et al.,1999), the superposition approximation, the Rytov approximation (Kak and Slaney, 2001), and the discrete dipole approximation (DDA) (Draine and Flatau, 1994). Their simulations showed that the lateral multiple scattering between red blood cells is very weak and that the polarization has an almost insignificant influence on the distribution of the scattered light.
4.3 Other blood cells
4.3.1 White blood cells
Leukocytes contain nuclei (often multi-lobe); thus, light experiences additional scattering at the cytoplasm/nucleus interface.
Meinke et al. (2007) found that the presence of physiological concentrations of leukocytes has no measurable influence on the optical properties of plasma and, therefore, on the optical parameters of whole blood.
The primary interest in scattering properties of leukocytes lies in discrimination between different types of leukocytes and their counting in flow cytometry. Regular flow cytometry allows measuring the forward and side scattering from single cells, which can be used to discriminate lymphocytes, monocytes, and granulocytes (Terstappen et al., 1988). Terstappen et al. (1986) reported the correlation between the fraction of cells with significant side scattering and the fraction of cytotoxic lymphocytes, which can be potentially used to determine the latter fraction from light scattering only.
Angle-resolved light-scattering measurements of single mononuclear cells using optical traps were performed for human lymphocytes by Doornbos et al. (1996) and human monocytes by Watson et al. (2004). Zharinov et al. (2006) studied the light scattering profile (LSP) of individual WBC using proprietary-developed scanning flow cytometry (SFC). The same group (Matlsev et al. (2011)) proposed to use absolute values of the integrated whole light-scattering trace instead of side scattering for cell discrimination (see Figure 12). Even though monocytes and lymphocytes can be discriminated this way, it was impossible to determine whether a lymphocyte is T- or B-, using only its morphological characteristics determined from LSP.
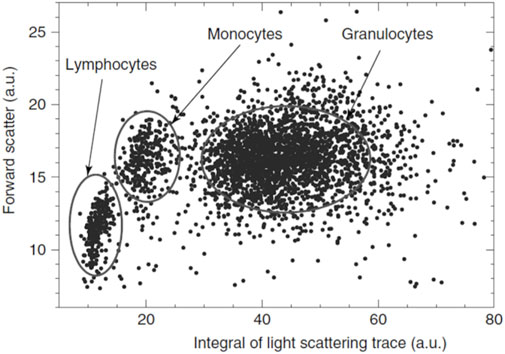
Figure 12. Light scattering cytogram of leukocytes. Reproduced from Maltsev et al. (2011) John Wiley & Sons.
In flow cytometers, granulocytes can be discriminated from other leukocytes by their higher forward and side scattering, except the basophils found in the light-scattering region of lymphocytes (Terstappen et al.,1991). However, using only LSP, granulocytes cannot be discriminated into sub-types (Matlsev et al., 2011).
Dannhauser et al. (2017) used an LSP to discriminate T-, B-lymphocytes, and monocytes using LSP analysis of individual mononuclear bloodstream cells in-flow. A distinctive optical signature for each viscoelastically aligned cell was obtained.
4.3.2 Platelets
Platelet analysis is an important part of routine clinical analysis (hematology). Platelet tests primarily measure the number of platelets (thrombocytes) in the blood, also known as the platelet count (PLT). This count is a crucial indicator of the blood’s ability to clot. In addition to platelet count modern hematology analyzers determine several other parameters (mean platelet volume (MPV), platelet distribution width (PDW), plateletcrit (PCT), and the immature platelet fraction (IPF).). Platelet shape and dose-dependent activation parameters are important factors, however they are outside the scope of commercial instruments. Ozaki et al. (1994) developed the detection of platelet aggregation using light scattering. Litvinenko et al. (2021) used a scanning flow cytometer for the measurement of angle-resolved light scattering and the discrete dipole approximation for the simulation of light scattering from a platelet optical model (an oblate spheroid) to retrieve dose-dependent activation parameters.
4.4 Scattering by whole blood
As the whole blood is a densely packed mixture of scatterers (RBCs), multiple scattering events have to be considered. This situation is often referred to as dependent scattering, which occurs when particles (RBCs in this case) are closely spaced or a correlation exists between their positions. The phase relation between the fields scattered from different particles cannot be ignored for dependent scattering. Therefore, the scattering fields should be added instead of the scattering intensities.
4.4.1 Scaling on hematocrit
Let’s assume that the space with the total volume VT contains N identical particles with a scattering cross section σs. Then, ignoring the interaction between particles, the scattering coefficient of this ensemble can be found as (Equation 18):
where hct is the hematocrit [%] or the volume percentage of red blood cells in the blood and VP is the volume of a RBC (typically assumed to be 90 μm3 (Steinke and Shepard, 1988)). Since this formulation assumes no interaction between particles, it is most relevant in low hematocrit conditions.
However, since the hematocrit (volume fraction) of blood is, on average, 40% for adult women and 45% for adult men, the interaction between scattering fields of individual particles cannot be ignored. The scattering coefficient for the dependent scattering, now given interaction between particles, can be expressed (see, for example, Bosschaart et al., 2014) through the scattering coefficient for the independent scattering (Equation 19).
where γ(hct) is a hematocrit-dependent scaling factor between the scattering cross-section for dependent and independent scattering. The scaling factor γ can be found as (Equation 20) (Bosschaart et al., 2014):
where ps(θ) is the scattering phase function of the individual scatterer and S(θ, hct) is the structural factor, which can be found as (Equation 21) (Hespel et al., 2001):
where q = 4π/λ sin (θ/2) and G(r) is the radial distribution function that characterizes the probability of finding two particles over a distance r.
Thus, the scaling factor γ can be found if we know both the scattering phase function of the individual scatterer and the radial distribution function.
In particular, solutions were derived by Twerky (1970) in the case of isotropic scattering (ps(θ) = 1/4π) for a gas (Equation 22):
And non-deformable spheres (Equation 23):
Steinke and Shepard (1988) found that Equations 22, 23, which are based on idealized assumptions such as isotropic scattering and non-interacting spherical particles, have limited accuracy in describing scattering for whole blood. To address this limitation, they proposed the empirical expression (Equation 24) which implicitly reflects the densely packed and anisotropic nature of red blood cells.
More recently, Bosschaart et al. (2014), using the Mie scattering phase function and the Percus–Yevick radial distribution function for non-deformable spheres (Percus and Yevick, 1958), obtained the following approximation (Equation 25):
However, it should be noted that Equations 24, 25 provide a very close match and the difference between them is negligible.
Douplik and Loschenov measured the optical properties of the whole blood as a function of hematocrit (Douplik and Loschenov, 1996a). They found a decrease in scattering with the hct increase of over 50% as the blood cells started to contact each other. The erythrocytes begin to adhere and to be deformed by each other. Blood-like media with “islands of erythrocytes and its aggregates within plasma” transform into the media “particles of plasma between erythrocytes.” In the limit hct → 100%, the “plasma particles” disappear, and μs of blood should approach zero (Ishimaru, 2017). The absorption and reduced scattering coefficients as a function of hct are shown in Figure 13. The decrease in scattering is consistent with the scaling model Equation 18 combined with the scaling factor provided by Equation 24 or Equation 25.
Figure 13. Whole blood absorption and reduced scattering coefficients as a function of hematocrit. The SO2 was 99% with an optical path of 140 μm (modified from Douplik and Loschenov (1996a)).
The optical properties of the whole blood, including scattering, were reviewed by Bosschaart et al. (2014). This review contains tabulated data for the optical properties of whole blood, hct = 45%, in the 250–2,000 nm range, using the scaling factor provided by Equation 25. In addition to optical properties compiled from the literature, they also estimated optical properties based on the Kramers–Kronig relation (see Figure 14) in the 250–2,000 nm range. Figure 14a shows the scattering coefficient of whole blood, Figure 14b presents the scattering anisotropy factor, and Figure 14c displays the reduced scattering coefficient. To summarize their findings, it appears reasonable to approximate μs′ as ∼13 cm−1 across the visible and near-infrared range. This approximation falls within the central range of reported values and reinforces the interpretation that absorption dominates over scattering in the visible spectrum.
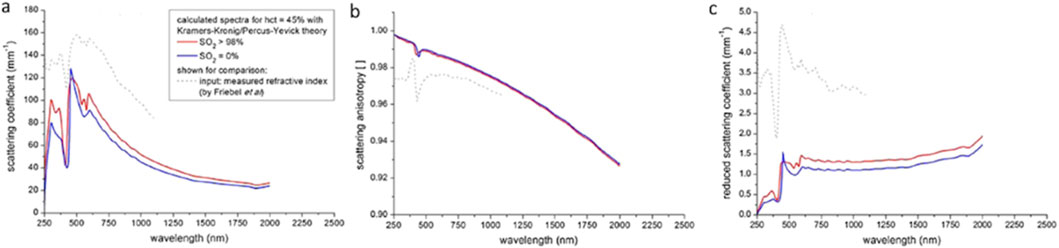
Figure 14. Theoretical estimates of the optical properties of whole blood: (a) scattering coefficient, (b) scattering anisotropy factor, and (c) reduced scattering coefficient. Reproduced from Bosschaart et al. (2014) CC BY 4.0.
4.4.2 Implications of large scattering anisotropy
As shown in Figure 14b, blood is characterized by a very high scattering anisotropy coefficient. Very high anisotropy implies strongly forward scattering with interesting implications. Despite the presence of strong light scattering, e.g., at 750 nm,
here, μa is the absorption coefficient; z is the distance from the slab’s surface. Thus, despite relatively strong scattering, absorption will determine the attenuation. These considerations align with estimations provided by Bosschaart et al. (2014).
Additionally, one can conclude that polarization degradation, which is sensitive to the number of scattering events, is high. Thus, polarization should not play an important role in the whole blood optical measurements, which is in line with simulations by He et al. (2004).
4.4.3 Scattering by blood in vessels
Roggan et al. (1999) investigated the optical properties of circulating human blood at 633 nm using a double integrating sphere technique and Monte Carlo simulations. Regarding scattering, they found that “a) scattering and absorption increased linearly at hct < 50%, b) absorption and scattering decreased slightly with increasing shear rate, c) the deformation of erythrocytes had no significant impact on the optical properties if volume and hemoglobin content were kept constant, d) increasing osmolarity leads to an increase of absorption while both scattering and anisotropy decreased, e) Mie calculations on spherical equivalents provided a precise estimation of the RBC scattering behavior, f) increasing hemolysis led to a reduction in absorption and scattering and g) oxygenation had no impact on scattering properties” (Roggan et al., 1999). Douplik et al. observed a modulation in the absorption and scattering coefficients influenced by the shear rate, which could not be solely attributed to the orientation of erythrocytes within the flow (Douplik et al., 1996). This phenomenon is likely also associated with the deformation of red blood cells.
5 Key findings and their clinical implications
Having examined absorption, refractive index, and scattering independently, Section 5 synthesizes these findings to highlight overarching patterns and interdependencies. This integrative perspective not only enhances the understanding of blood’s optical behavior, but also informs the development and refinement of clinically relevant optical diagnostic and monitoring techniques.
5.1 Serum and plasma
Serum and plasma have very similar optical properties. Water dominates the optical properties of serum and plasma in the whole visible and NIR ranges of the spectrum. The deviations from water’s absorption and refractive index are quite minimal. The refractive index of serum and plasma is well approximated by a linear dependence on protein concentration (Barer’s equation, Equation 10).
Light scattering in serum and plasma is primarily due to Raleigh scattering on proteins of various sizes. However, Meinke et al. (2007) found that the scattering anisotropy factor g for the plasma is about 0.2, indicating a slightly forward scattering and a scattering coefficient that was much higher than expected by Rayleigh scattering only. Thus, Mie correction may be appropriate.
5.1.1 Biomarkers
Biomarker refers to a broad subcategory of medical signs – that is, objective indications of medical state observed from outside the patient – which can be measured accurately and reproducibly. Blood and its derivatives (plasma and serum) are the primary media for biomarker testing. In the context of the blood, biomarkers refer to proteins, other molecules, or microorganisms (microbial biomarkers) present in blood. In most cases, the concentration of biomarkers is too low to detect via spectroscopic, scattering, or goniometric methods. Thus, other methods (e.g., fluorescence or immunoassays) are typically used. However, several biomarkers with high concentrations can be detected using spectroscopic, scattering, or goniometric methods.
5.1.1.1 Bilirubin
Bilirubin is a red-orange compound produced in the normal catabolic pathway of heme breaking down. It is mainly found in the spleen and liver. Excess bilirubin secretion in the liver can no longer be stored in bile and, therefore, flows into the bloodstream and leaks into the tissue, causing the skin to appear yellow. This chromophore has its central absorption peak around 467 nm. The absorption peak’s location and width depend on the solute in which it was diluted. Approximately 60% of term and 80% of pre-term newborns develop clinical jaundice in the first week after birth (Mitra and Rennie, 2017).
5.1.1.2 β-Carotene
β-Carotene is a precursor of vitamin A in the human diet, which turns into vitamin A in the liver. β-Carotene belongs to the family of carotenoids, which are found in many fruits and vegetables, as well as some animal products such as egg yolks. Vitamin A is essential for the proper production of red blood cells in the bone marrow.
Along with lycopene, β-carotene is among the most frequently consumed dietary carotenoids in human subjects, ranking among the highest in blood/plasma concentrations (Wawrzyniak et al., 2013). Carotenoids are primarily stored in fatty tissue which holds around 80% -85% of the β-carotene available in the organism; the rest stays in the liver (8% -12%) and muscles (2% -3%) (Grune et al., 2010). The normal range of β-carotene in serum is 50 -300 μg/dL or 0.93 -5.59 μmol/L (Salwen, 2017).
The long chain of alternating double bonds (conjugated) is responsible for the orange color of beta-carotene as they absorb in the green/blue part of the spectrum.
5.1.1.3 Glucose
Ali et al. (2017) sought to use red laser light (650 nm) to non-invasively measure blood glucose concentration, which is a key unmet clinical need. As glucose molecules modify the refractive index of blood proportionally to their concentration (Equation 10) and therefore changes in measured refractive index likely correspond to changes in blood glucose–thus, increasing concentration yielding decreasing refractive angle. Given the calculated calibration, the glucose concentration can then be determined. The refractive index device was validated on a cohort of 10 healthy subjects using a standard finger prick glucose instrument as the gold standard, exhibiting a relative error of 3%–8%, with variations due to sources such as shape and thickness of the finger and swelling caused by the laser light.
5.2 RBC
Among blood components, the optical properties of blood (including absorption) are dominated by red blood cells, whose absorption and scattering are two to three orders of magnitude larger than those of the other blood components (Meinke et al., 2007). Hematocrit, hemoglobin concentration, and RBC’s shape are analyzed using optical methods in numerous clinical applications.
5.2.1 Hemoglobins
Hemoglobins are the primary blood chromophores in the 400–1,100 nm range of the spectrum. Their absorption has a distinct dependence on oxygenation, which serves as the basis for numerous medical applications (e.g., pulse oximetry, tissue oximetry, etc.).
Other hemoglobins (e.g., methemoglobin and carboxyhemoglobin) are typically present at significantly lower concentrations. Thus, they do not significantly impact the overall spectrum in normal conditions. However, carboxyhemoglobin (HbCO) due to the similarity of its spectrum to oxyhemoglobin’s (HbO2) may pose a significant problem in pulse oximetry. As clinical pulse oximetry is typically based on two-wavelength measurements, in the presence of HbCO, the pulse oximeter confuses HbCO with oxyhemoglobin, and, thus, may seriously overestimate HbO2. For example, Barker and Tremper (1987) in animal experiments found that pulse oximeters read an oxygen saturation of greater than 90%, while the actual HbO2 was below 30%. Thus, the pulse oximeter, as the sole indicator of blood oxygenation, should be used with caution in patients with recent carbon monoxide exposure. To accurately assess oxygenation in suspected CO poisoning, a CO-oximeter, which can differentiate between different forms of hemoglobin (including HbCO), should be used to measure the actual oxygen saturation (SaO2) and HbCO levels (Hampson, 1998).
Similarly, elevated levels of methemoglobin may also pose a challenge to pulse oximetry. Methemoglobin has high absorbance at both wavelengths used in pulse oximetry, leading to interference that causes an inaccurate SpO2 reading. For example, according to Ludlow et al. (2023), when the level of methemoglobin approaches 30%–35%, the ratio of absorbance becomes 1.0, which reads as a SpO2 of 85% for (A660/A940) (Chan et al., 2013). There is a disproportional, inverse relationship between methemoglobin concentration and SpO2 and SaO2 calculations are falsely normal due to the assumption that all hemoglobin is either oxyhemoglobin or deoxyhemoglobin (Nappe et al., 2015). The difference between the depressed SpO2 measurement and the falsely normal SaO2 calculation is known as the “saturation gap.”
5.3 Other cells
Leucocytes and platelets have a marginal impact on the optical properties of whole blood. However, there are multiple applications, which analyze their shape and quantities, typically in flow cytometry geometry using light scattering techniques.
5.4 Whole blood
The absorption of the whole blood is dominated by the absorption of hemoglobins for wavelengths in the 400–1,100 nm range and water above 1,350 nm. The absorption of whole blood is strongly dependent on its oxygenation. It serves as the basis for numerous blood oxygenation measurement techniques. In addition, other factors like shear rate and osmolarity impact the absorption and scattering through changes in the size and shape of RBCs.
Whole blood represents a solution with densely packed RBCs. This organization has a significant impact on absorption and scattering. The interplay of different factors which affect the optical properties of whole blood is depicted in Figure 15.
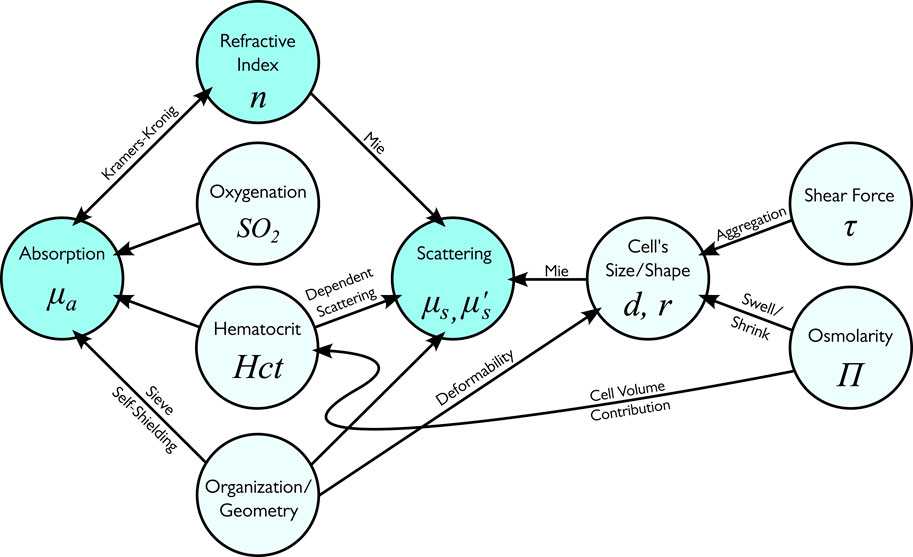
Figure 15. The primary dependencies between factors in whole blood optical measurements.
6 Novel technology development
Biomedical optics experiences an influx of new technologies, particularly in the imaging space.
Quantitative phase imaging (QPI) has emerged in recent years as a valuable method for investigating cells and tissues. As the images represent quantitative maps of optical path length delays introduced by the specimen, QPI provides an objective measure of morphology and dynamics, free of variability due to contrast agents (Park et al., 2018). Several approaches to QPI have emerged. Diffraction phase microscopy, DPM is a common-path QPI method, capable of accurately monitoring the dynamics of various nanoscale phenomena in a wide variety of environments (Bhaduri et al., 2014), including in situ. The method combines the principles of common path interferometry and single-shot phase imaging and is characterized by subnanometer pathlength stability and millisecond-scale acquisition time (Popescu et al., 2006). Tomographic phase microscopy (TPM) uses digital holographic measurements of complex scattered fields to reconstruct three-dimensional refractive index maps of cells with diffraction-limited resolution by solving inverse scattering problems (Jin et al., 2017). Ojaghi et al. (2018) developed Ultraviolet Hyperspectral Interferometric (UHI) Microscopy. A key element of this technology is the use of a 4f interferometric setup that permits coherent detection using an incoherent, broadband light source. The method can recover quantitative phase images with sensitivity to optical path lengths in the order of 1 nm.
Deep UV microscopy is a technique that allows high-resolution molecular imaging and absorption-based label-free mass mapping. Deep UV microscopy measures optical density in transmission geometry. Knowing the extinction coefficients and molar weights of its components, the dry mass per unit area (σ) is calculated from these measurements. Kaza et al. (2021) proposed using deep-UV microscopy to extract RBCs’ morphological properties and hemoglobin content.
Regarding scattering methods, Steelman et al. (2019) proposed the following categorization: wavelength-dependent, angle-resolved, and Fourier Domain methods. While angle-resolved (goniometric) and Fourier Domain methods are well-established in the literature, wavelength-dependent methods are relatively new. Strong dependence of the scattering on the wavelength makes it possible to analyze the scattering properties of the particle by fixing the scattering angle and scanning across various wavelengths. This observation is at the core of several light scattering techniques. In particular, light scattering spectroscopy (LSS) is based on detecting a light-scattering spectrum that depends on its size and refractive index (Perelman et al., 1998). In a typical scenario, the particle is illuminated with a broad-spectrum light source, and the spectroscopic output is analyzed to detect the particle sizes and their distribution. Originally, LSS was proposed to probe the structure of living epithelial cells in situ without the need for tissue removal (Gurjar et al., 2001). This technology can be used in cytometry as well.
7 Open questions
Despite significant efforts in blood optics, there are still numerous open questions.
The nature of light scattering on blood cells has yet to be clarified. Even though the calculations of scattering amplitudes can be done numerically, the complexity of calculations masks the dominant mechanisms of scattering. Notably, there are still conflicting accounts of the primary source of scattering. For example, in Tuchin (2007), the light scattering in blood is attributed primarily to the refractive index mismatch between blood plasma and erythrocyte cytoplasm, which depends on Hb concentration (Roggan et al., 1999). Similarly, in addition to scattering on the cell membrane interface with surrounding media, the elastic light scattering may originate from the cell nucleus and other intracellular structures (e.g., mitochondria). This determination can be done by measuring scattering from cells in media with different indices of refraction. The underlying principle of these experiments is that when the index of refraction difference between the scatterer and the surrounding media is reduced, the scattering intensity will be reduced. Therefore, when the index of refraction of the medium outside a cell is increased so that it is closer to that of the cell, scattering from the interface between the cell and the external medium will be reduced. Scattering from internal cellular structures, however, will not be affected. Thus, the decrease in scattering in the optical clearing experiments supports the notion of scattering on the cellular membranes.
An indirect confirmation of membrane-based origins of the scattering came from Roggan et al. (1999), who investigated the dependence of the scattering on the hemolysis rate. They found that the scattering coefficient μs showed a distinct (close to linear) decrease with increasing hemolysis. At complete hemolysis, μs amounted to 18% of the value measured for intact blood.
Another open question is the behavior of scattering of the whole blood for large hematocrit. It is well established that at high hematocrit, the scattering decreases as hematocrit increases. However, where this infliction point occurs is the question of debate. While some authors (e.g., Douplik and Loschenov (1996b)) claim that it occurs above 50%, other authors (e.g., Roggan et al., 1999) report values as low as 33%. This question can be boiled down to the scaling factor (Equation 20). In particular, if the simple scaling factor for gas (see Equation 22) holds true, then infliction occurs at 50%.
Another open question is the aggregation of RBCs and its impact on scattering. It is well-known that aggregation of RBCs occurs under certain conditions. In particular, the erythrocyte sedimentation rate (ESR) is a standard hematology test, which is a non-specific measure of inflammation. ESR measures the rate at which red blood cells in anticoagulated whole blood descend in a standardized tube over 1 h.
RBC aggregation has a significant impact on the optical properties of blood. In particular, the relationship between the RBC aggregation and optical signal has been well known and studied for many years in vitro (Donner et al., 1988; Klose et al., 1972; Priezzhev et al., 1999; Tsinopoulos et al., 2002).
It is known that blood sedimentation occurs primarily due to rouleau formation. Fine et al. (2001) proposed that the RBC aggregation process by rouleau formation can explain the optical signal (e.g., photoplethysmographic or PPG signal, including pulse oximetry) behavior in vivo. Later, Fine and Kaminsky (2019) elaborated the model and proposed a model of RBC aggregation, which can be qualitatively described as follows: The dynamic balance between the destruction and formation of RBC aggregates is determined by the blood velocity and shear rate. The size of RBC aggregates is inversely proportional to the magnitude of the shear rate (Bishop et al., 2004). The increase in shear rate results in the breakup of large aggregates into smaller ones or individual RBCs. All RBC aggregates for shear rates exceeding 50 s−1 are dissociated into single erythrocytes (Hoeks et al., 1995). Under normal conditions, a periodic pulse wave causes oscillations in velocity and shear forces, modulating the aggregate size. Hence, the oscillation in the shear forces of blood flow is the main rheological factor leading to observed variations in the measured optical signals (for example, PPG signal).
However, this hypothesis requires further verification. Firstly, the aggregation of RBCs is prevented by Coulomb forces, as RBCs are negatively charged due to the presence of the carboxyl group of sialic acids in the cell membrane (Eylar et al., 1962). As such, these charges create a repulsive electric zeta potential between cells. Secondly, in the ESR test, the blood sedimentation caused by rouleau formation occurs on a long time scale (1 h in the clinical test). Thus, the ability to rapidly aggregate and disaggregate during pulse wave propagation also requires further verification.
The impact of oxygenation on scattering is also being debated. Some authors (see, for example, Roggan et al., 1999) claim that whole blood scattering does not depend on oxygenation, but there are some reasons to expect that oxygenation affects scattering. Specifically, oxygenation changes the membrane potential, which may impact the aggregation of RBCs. Thus, aggregation (e.g., via the rouleau formation mentioned above) and sedimentation can be oxygenation-dependent. Moreover, as absorption and refractive index are interrelated through Kramers–Kronig relations, it is reasonable to expect that the strong difference in absorption will lead to differences in scattering as well. This is further supported by the experimental findings of Douplik and Loschenov, who demonstrated that oxygenation levels affect both the scattering coefficient and anisotropy factor of whole blood (Douplik and Loschenov, 1996a). This reasoning aligns with Bosschaart et al. (2014), who found a significant difference in scattering between oxygenated and deoxygenated blood using the Kramers–Kronig relations.
8 Conclusion
Blood is a critically important biofluid responsible for transporting oxygen and nutrients to all body tissues and removing waste. Blood has distinct optical features in the visible spectrum range, enabling multiple biomedical optical methods.
The absorption of water and hemoglobins dominates blood absorption. Hemoglobins dominate in the 400–1,100 nm range. Above 1,350 nm, the blood absorption closely follows water absorption.
Among blood components, the optical properties of blood (including absorption) are dominated by red blood cells, whose absorption and scattering are two to three orders of magnitude larger than those of the other blood components (Meinke et al., 2007).
The optical properties of the whole blood are significantly impacted by the encapsulation of hemoglobin molecules into red blood cells. In addition to scattering, it significantly impacts absorption and refractive index. Thus, any extrapolation of results based on hemoglobin solutions must be made cautiously.
Absorption and scattering of the whole blood are affected by multiple factors, including hematocrit, oxygenation, shear rate, and osmolarity. Due to the high heterogeneity of chromophore distribution in the blood (hemoglobins are concentrated in RBCs), optical measurements may be impacted by several effects, including the detour and sieve effects. As blood is a strong absorber of visible light, optical measurements are affected by the diameter of the blood vessels (the self-shielding effect). In addition, measurements of the whole blood in no-flow conditions may be affected by coagulation and sedimentation (Yaroslavsky et al., 2002). Thus, careful experimental planning is required.
Author contributions
GS: Funding acquisition, Investigation, Writing – original draft. FS-A: Visualization, Writing – review and editing. TB: Writing – original draft. SP: Visualization, Writing – review and editing. AD: Funding acquisition, Writing – review and editing.
Funding
The author(s) declare that financial support was received for the research and/or publication of this article. This work was funded by NSERC I2I Grant (GS and AD) and personal NSERC Discovery Grants (GS and AD).
Conflict of interest
The authors declare that the research was conducted in the absence of any commercial or financial relationships that could be construed as a potential conflict of interest.
The author(s) declared that they were an editorial board member of Frontiers, at the time of submission. This had no impact on the peer review process and the final decision.
Generative AI statement
The author(s) declare that no Generative AI was used in the creation of this manuscript.
Publisher’s note
All claims expressed in this article are solely those of the authors and do not necessarily represent those of their affiliated organizations, or those of the publisher, the editors and the reviewers. Any product that may be evaluated in this article, or claim that may be made by its manufacturer, is not guaranteed or endorsed by the publisher.
Footnotes
1In optics, dispersion (or chromatic dispersion) is the phenomenon in which the phase velocity of a wave depends on its frequency. A medium having this property is termed a dispersive medium.
References
Agrawal, R., Smart, T., Nobre-Cardoso, J., Richards, C., Bhatnagar, R., Tufail, A., et al. (2016). Assessment of red blood cell deformability in type 2 diabetes mellitus and diabetic retinopathy by dual optical tweezers stretching technique. Sci. Rep. 6 (1), 15873. doi:10.1038/srep15873
Ali, H., Bensaali, F., and Jaber, F. (2017). Novel approach to non-invasive blood glucose monitoring based on transmittance and refraction of visible laser light. IEEE Access 5, 9163–9174. doi:10.1109/access.2017.2707384
Ascenzi, A., and Silvestroni, E. (1953). On the optical properties of the hemoglobin in microdrepanocytic disease. Blood 8 (12), 1061–1066. doi:10.1182/blood.v8.12.1061.1061
Barer, R., and Joseph, S. (1954). Refractometry of living cells part I. Basic principles. J. Cell Sci. 3 (32), 399–423. doi:10.1242/jcs.s3-95.32.399
Barer, R., Ross, K. F. A., and Tkaczyk, S. (1953). Refractometry of living cells. Nature 4356 (171), 720–724. doi:10.1038/171720a0
Barker, S. J., and Tremper, K. K. (1987). The effect of carbon monoxide inhalation on pulse oximetry and transcutaneous PO2. Anesthesiology 66 (5), 677–679. doi:10.1097/00000542-198705000-00014
Bashkatov, A. N., and Genina, E. A. (2003). “Water refractive index in dependence on temperature and wavelength: a simple approximation,” in Saratov fall meeting 2002: optical technologies in biophysics and medicine IV (Bellingham, WA: SPIE), 393–395.
Bhaduri, B., Edwards, C., Pham, H., Zhou, R., Nguyen, T. H., Goddard, L. L., et al. (2014). Diffraction phase microscopy: principles and applications in materials and life sciences. Adv. Opt. Photonics 6 (1), 57–119. doi:10.1364/aop.6.000057
Bishop, J. J., Nance, P. R., Popel, A. S., Intaglietta, M., and Johnson, P. C. (2004). Relationship between erythrocyte aggregate size and flow rate in skeletal muscle venules. Am. J. Physiology-Heart Circulatory Physiology 286 (1), H113–H120. doi:10.1152/ajpheart.00587.2003
Bosschaart, N., Edelman, G. J., Aalders, M. C. G., van Leeuwen, T. G., and Faber, D. J. (2014). A literature review and novel theoretical approach on the optical properties of whole blood. Lasers Med. Sci. 29, 453–479. doi:10.1007/s10103-013-1446-7
Butler, W. L. (1964). Absorption spectroscopy in vivo theory and application. Annu. Rev. Plant Physiol. 15 (1), 451–460. doi:10.1146/annurev.pp.15.060164.002315
Casa, L. D. C., Deaton, D. H., and Ku, D. N. (2015). Role of high shear rate in thrombosis. J. Vasc. Surg. 61 (4), 1068–1080. doi:10.1016/j.jvs.2014.12.050
Chan, E. D., Chan, M. M., and Chan, M. M. (2013). Pulse oximetry: understanding its basic principles facilitates appreciation of its limitations. Respir. Med. 107 (6), 789–799. doi:10.1016/j.rmed.2013.02.004
Cheng, S., Shen, H. Y., Zhang, G., Huang, C. H., and Huang, X. J. (2002). “Measurement of the refractive index of biotissue at four laser wavelengths,” in Optics in health Care and biomedical optics: diagnostics and treatment (Bellingham, WA: SPIE), 172–176.
Cleveland Clinic (2025). Hematocrit. Available online at: https://my.clevelandclinic.org/health/diagnostics/17683-hematocrit (Accessed March 17, 2025).
Dannhauser, D., Rossi, D., Ripaldi, M., Netti, P. A., and Causa, F. (2017). Single-cell screening of multiple biophysical properties in leukemia diagnosis from peripheral blood by pure light scattering. Sci. Rep. 7 (1), 12666. doi:10.1038/s41598-017-12990-4
Deng, Z., Wang, J., Ye, Q., Sun, T., Zhou, W., Mei, J., et al. (2016). Determination of continuous complex refractive index dispersion of biotissue based on internal reflection. J. Biomed. Opt. 21 (1), 015003. doi:10.1117/1.jbo.21.1.015003
Drabkin, D. (1935). Preparations from washed blood cells; nitric oxide hemoglobin and sulfhemoglobin. J. Biol. Chem. 112, 51–65.
Donner, M., Siadat, M., and Stoltz, J. F. (1988). Erythrocyte aggregation: approach by light scattering determination. Biorheology 25 (1–2), 367–376. doi:10.3233/bir-1988-251-246
Doornbos, R. M. P., Schaeffer, M., Hoekstra, A. G., Sloot, P. M. A., de Grooth, B. G., and Greve, J. (1996). Elastic light-scattering measurements of single biological cells in an optical trap. Appl. Opt. 35 (4), 729–734. doi:10.1364/ao.35.000729
Douplik, A. Y., and Loschenov, V. B. (1996a). “Identification of spectroscopic and optical parameters of whole blood depending on its concentration and layer thickness,” in Laser-tissue interaction and tissue optics (Bellingham, WA: SPIE), 165–176.
Douplik, A. Y., and Loschenov, V. B. (1996b). “Identification of optical parameters of the whole blood depending on its oxygenation level,” in Optical diagnostics of living cells and biofluids (Bellingham, WA: SPIE), 548–555.
Douplik, A. Y., Loschenov, V. B., Malinin, V. G., Proscurnev, S., and Klimov, D. V. (1996). “Changes of optical parameters of moving whole blood depending on shear rate,” in Laser-tissue interaction and tissue optics II (Bellingham, WA: SPIE), 35–43.
Draine, B. T., and Flatau, P. J. (1994). Discrete-dipole approximation for scattering calculations. J. Opt. Soc. Am. A 11 (4), 1491–1499. doi:10.1364/josaa.11.001491
Drezek, R., Dunn, A., and Richards-Kortum, R. (1999). Light scattering from cells: finite-difference time-domain simulations and goniometric measurements. Appl. Opt. 38 (16), 3651–3661. doi:10.1364/ao.38.003651
Duyens, L. N. M. (1956). The flattering of the absorption spectrum of suspensions, as compared to that of solutions. Biochim. Acta 19, 1–12. doi:10.1016/0006-3002(56)90380-8
Espanol, P., and Warren, P. (1995). Statistical mechanics of dissipative particle dynamics. Europhys. Lett. 30 (4), 191–196. doi:10.1209/0295-5075/30/4/001
Eylar, E. H., Madoff, M. A., Brody, O. V., and Oncley, J. L. (1962). The contribution of sialic acid to the surface charge of the erythrocyte. J. Biol. Chem. 237 (6), 1992–2000. doi:10.1016/s0021-9258(19)73972-6
Faber, D. J., Aalders, M. C. G., Mik, E. G., Hooper, B. A., van Gemert, M. J. C., and van Leeuwen, T. G. (2004). Oxygen saturation-dependent absorption and scattering of blood. Phys. Rev. Lett. 93 (2), 028102. doi:10.1103/physrevlett.93.028102
Fine, I., Fikhte, B., and Shvartsman, L. D. (2001). “Occlusion spectroscopy as a new paradigm for noninvasive blood measurements,” in Optical diagnostics and sensing of biological fluids and glucose and cholesterol monitoring (Bellingham, WA: SPIE), 122–130.
Fine, I., and Kaminsky, A. (2019). Possible error in reflection pulse oximeter readings as a result of applied pressure. J. Healthc. Eng. 2019 (1), 1–7. doi:10.1155/2019/7293813
Friebel, M., and Meinke, M. (2006). Model function to calculate the refractive index of native hemoglobin in the wavelength range of 250–1100 nm dependent on concentration. Appl. Opt. 45 (12), 2838–2842. doi:10.1364/ao.45.002838
Gamgee, A., and Hill, A. C. (1903). On the optical activity of hæmoglobin and globin. Proc. R. Soc. Lond. 71 (467–476), 376–385.
Garlaschi, F. M., Zucchelli, G., and Jennings, R. C. (1989). Studies on light absorption and photochemical activity changes in chloroplast suspensions and leaves due to light scattering and light filtration across chloroplast and vegetation layers. Photosynth Res. 20, 207–220. doi:10.1007/bf00034065
Gienger, J., Groß, H., Neukammer, J., and Bär, M. (2016). Determining the refractive index of human hemoglobin solutions by Kramers–Kronig relations with an improved absorption model. Appl. Opt. 55 (31), 8951–8961. doi:10.1364/ao.55.008951
Gienger, J., Smuda, K., Müller, R., Bär, M., and Neukammer, J. (2019). Refractive index of human red blood cells between 290 nm and 1100 nm determined by optical extinction measurements. Sci. Rep. 9 (1), 4623. doi:10.1038/s41598-019-38767-5
Gompper, G., Ihle, T., Kroll, D. M., and Winkler, R. G. (2009). Multi-particle collision dynamics: a particle-based mesoscale simulation approach to the hydrodynamics of complex fluids. Adv. Comput. Simul. Approaches Soft Matter Sci. III, 1–87. doi:10.1007/978-3-540-87706-6_1
Gratzer, W. B., and Kollias, N. (1999). Personal communication from gratzer. Editor N. Kollias (Holly Hill, London and Boston: Med Res Council Labs and Wellman Laboratories, Harvard Medical School). Available online at: http://omlcogiedu/spectra/hemoglobin/ (Accessed May 15, 2025).
Grune, T., Lietz, G., Palou, A., Ross, A. C., Stahl, W., Tang, G., et al. (2010). β-Carotene is an important vitamin A source for humans. J. Nutr. 140 (12), 2268S–2285S. doi:10.3945/jn.109.119024
Gurjar, R. S., Backman, V., Perelman, L. T., Georgakoudi, I., Badizadegan, K., Itzkan, I., et al. (2001). Imaging human epithelial properties with polarized light-scattering spectroscopy. New York, United States: Nature Publishing Group.
Hale, G. M., and Querry, M. R. (1973). Optical constants of water in the 200-nm to 200-μ m wavelength region. Appl. Opt. 12 (3), 555–563. doi:10.1364/ao.12.000555
Hampson, N. B. (1998). Pulse oximetry in severe carbon monoxide poisoning. Chest 114 (4), 1036–1041. doi:10.1378/chest.114.4.1036
Hanson, E. K., and Ballantyne, J. (2010). A blue spectral shift of the hemoglobin soret band correlates with the age (time since deposition) of dried bloodstains. PLoS One 5 (9), e12830. doi:10.1371/journal.pone.0012830
He, J., Karlsson, A., Swartling, J., and Andersson-Engels, S. (2004). Light scattering by multiple red blood cells. J. Opt. Soc. Am. A 21 (10), 1953–1961. doi:10.1364/josaa.21.001953
Heilmeyer, L. (1933). Medizinische spektrophotometrie, 228. Jena, 33. Diese Z. (1934). Biochem Z 261:376.
Hermand, E., Coll, C., Richalet, J. P., and Lhuissier, F. J. (2021). Accuracy and reliability of pulse O2 saturation measured by a wrist-worn oximeter. Int. J. Sports Med. 42 (14), 1268–1273. doi:10.1055/a-1337-2790
Hespel, L., Mainguy, S., and Greffet, J. J. (2001). Theoretical and experimental investigation of the extinction in a dense distribution of particles: nonlocal effects. J. Opt. Soc. Am. A 18 (12), 3072–3076. doi:10.1364/josaa.18.003072
Hoeks, A. P. G., Samijo, S. K., Brands, P. J., and Reneman, R. S. (1995). Noninvasive determination of shear-rate distribution across the arterial lumen. Hypertension 26 (1), 26–33. doi:10.1161/01.hyp.26.1.26
Hoppe, F. (1862). Ueber das verhalten des blutfarbstoffesim spectrum des sonnenlichtes. VirchowsArchiv 23 (3), 446–449. doi:10.1007/bf01939277
Hüfner, G. (1899). Über den ursprung und die berechtigungbesonderer lehrstühle für physiologische chemie. Editor F. Pietzcker (Germany).
Institute for Quality and Efficiency in Health Care (IQWiG) (2023). Brief: what does blood do? Cologne, Germany.
Ishimaru, A. (2017). Electromagnetic wave propagation, radiation, and scattering: from fundamentals to applications. John Wiley & Sons.
Jacques, S. L., Alter, C. A., and Prahl, S. A. (1987). Angular dependence of HeNe laser light scattering by human dermis. Lasers Life Sci. 1 (4), 309–333.
Jin, D., Zhou, R., Yaqoob, Z., and So, P. T. C. (2017). Tomographic phase microscopy: principles and applications in bioimaging [Invited]. J. Opt. Soc. Am. B 34 (5), B64–B77. doi:10.1364/josab.34.000b64
Jin, Y. L., Chen, J. Y., Xu, L., and Wang, P. N. (2006). Refractive index measurement for biomaterial samples by total internal reflection. Phys. Med. Biol. 51 (20), N371–N379. doi:10.1088/0031-9155/51/20/n02
Kak, A. C., and Slaney, M. (2001). Principles of computerized tomographic imaging. Philadelphia, PA: SIAM.
Kaza, N., Ojaghi, A., and Robles, F. E. (2021). Hemoglobin quantification in red blood cells via dry mass mapping based on UV absorption. J. Biomed. Opt. 26 (8), 086501. doi:10.1117/1.jbo.26.8.086501
Khlebtsov, N., Maksimova, I., Tuchin, V., and Wang, L. (2002). “Introduction to light scattering by biological objects,” in Handbook of optical biomedical diagnostics. Editor V. V. Tuchin (Bellingham, WA: SPIE Press).
Klose, H. J., Volger, E., Brechtelsbauer, H., Heinich, L., and Schmid-Schönbein, H. (1972). Microrheology and light transmission of blood: I. The photometric effects of red cell aggregation and red cell orientation. Pfluegers Archiv 333, 126–139. doi:10.1007/bf00586912
Kolesnikova, I. V., Potapov, S. V., Yurkin, M. A., Hoekstra, A. G., Maltsev, V. P., and Semyanov, K. A. (2006). Determination of volume, shape and refractive index of individual blood platelets. J. Quant. Spectrosc Radiat Transf. 102 (1), 37–45. doi:10.1016/j.jqsrt.2006.02.050
Lavoisier, A. L. (1777). Expériences sur la respiration des animaux, et sur les changemens qui arrivent à l’airen passant par leurpoumon. Académie Des. Sci.
Lazareva, E. N., and Tuchin, V. V. (2018). Measurement of refractive index of hemoglobin in the visible/NIR spectral range. J. Biomed. Opt. 23 (3), 1. doi:10.1117/1.jbo.23.3.035004
Litvinenko, A. L., Nekrasov, V. M., Strokotov, D. I., Moskalensky, A. E., Chernyshev, A. V., Shilova, A. N., et al. (2021). Blood platelet quantification by light scattering: from morphology to activation. Anal. Methods 13 (29), 3233–3241. doi:10.1039/d1ay00431j
Liu, S., Deng, Z., Li, J., Wang, J., Huang, N., Cui, R., et al. (2019). Measurement of the refractive index of whole blood and its components for a continuous spectral region. J. Biomed. Opt. 24 (3), 1. doi:10.1117/1.jbo.24.3.035003
Ludlow, J. T., Wilkerson, R. G., and Nappe, T. M. (2023). Methemoglobinemia. Treasure Island (FL): StatPearls Publishing.
Maltsev, V. P., Hoekstra, A. G., and Yurkin, M. A. (2011). “Optics of white blood cells: optical models, simulations, and experiments,”. Advanced optical flow cytometry: methods and disease diagnoses. Editors V. V. Tuchin (John Wiley & Sons), 4, 3.
Marionneaux, S., Francisco, N., Chan, V., Hanenberg, J., Rafael, J., Chua, C., et al. (2013). Comparison of automated platelet counts and potential effect on transfusion decisions in cancer patients. Am. J. Clin. Pathol. 140 (5), 747–754. doi:10.1309/ajcp58intitvgqzi
Mauer, J., Peltomäki, M., Poblete, S., Gompper, G., and Fedosov, D. A. (2017). Static and dynamic light scattering by red blood cells: a numerical study. PLoS One 12 (5), e0176799. doi:10.1371/journal.pone.0176799
McMahon, T. J. (2019). Red blood cell deformability, vasoactive mediators, and adhesion. Front. Physiol. 10, 1417. doi:10.3389/fphys.2019.01417
Meinke, M., Müller, G., Helfmann, J., and Friebel, M. (2007). Optical properties of platelets and blood plasma and their influence on the optical behavior of whole blood in the visible to near infrared wavelength range. J. Biomed. Opt. 12 (1), 014024. doi:10.1117/1.2435177
Meinke, M. C., Friebel, M., and Helfmann, J. (2011). Optical properties of flowing blood cells. Adv. Opt. Flow Cytom. Methods Dis. Diagnoses, 95–132. doi:10.1002/9783527634286
Metcalf, W. K., Metcalf, N. F., and Gould, R. N. (1978). Lymphocyte cytoplasmic refractive index (LCRI). Antibiot Chemother 22, 149–154. doi:10.1159/000401160
Mitra, S., and Rennie, J. (2017). Neonatal jaundice: aetiology, diagnosis and treatment. Br. J. Hosp. Med. 78 (12), 699–704. doi:10.12968/hmed.2017.78.12.699
Moaveni, M. K. (1970). A multiple scattering field theory applied to whole blood. PhD Dissertation. Seattle, WA: University of Washington.
Moço, A. V., Stuijk, S., and De Haan, G. (2018). New insights into the origin of remote PPG signals in visible light and infrared. Sci. Rep. 8 (1), 8501. doi:10.1038/s41598-018-26068-2
Morgner, F., Stufler, S., Geißler, D., Medintz, I. L., Algar, W. R., Susumu, K., et al. (2011). Terbium to quantum dot FRET bioconjugates for clinical diagnostics: influence of human plasma on optical and assembly properties. Sensors 11 (10), 9667–9684. doi:10.3390/s111009667
Musielak, M. (2009). Red blood cell-deformability measurement: review of techniques. Clin. Hemorheol Microcirc 42 (1), 47–64. doi:10.3233/ch-2009-1187
Nagesh, B. V., Yogesha, , Pratibha, R., Parthasarathi, P., Iyengar, S. S., Bhattacharya, S., et al. (2014). Birefringence of a normal human red blood cell and related optomechanics in an optical trap. J. Biomed. Opt. 19 (11), 115004. doi:10.1117/1.jbo.19.11.115004
Nappe, T. M., Pacelli, A. M., and Katz, K. (2015). An atypical case of methemoglobinemia due to self-administered benzocaine. Case Rep. Emerg. Med. 2015 (1), 1–4. doi:10.1155/2015/670979
Northam, L., and Baranoski, G. V. G. (2010). A novel first principles approach for the estimation of the sieve factor of blood samples. Opt. Express 18 (7), 7456–7469. doi:10.1364/oe.18.007456
Ojaghi, A., Fay, M. E., Lam, W. A., and Robles, F. E. (2018). Ultraviolet hyperspectral interferometric microscopy. Sci. Rep. 8 (1), 9913. doi:10.1038/s41598-018-28208-0
Ozaki, Y., Satoh, K., Yatomi, Y., Yamamoto, T., Shirasawa, Y., and Kume, S. (1994). Detection of platelet aggregates with a particle counting method using light scattering. Anal. Biochem. 218 (2), 284–294. doi:10.1006/abio.1994.1180
Park, Y., Best-Popescu, C. A., Dasari, R. R., and Popescu, G. (2011). Light scattering of human red blood cells during metabolic remodeling of the membrane. J. Biomed. Opt. 16 (1), 011013. doi:10.1117/1.3524509
Park, Y., Depeursinge, C., and Popescu, G. (2018). Quantitative phase imaging in biomedicine. Nat. Photonics 12 (10), 578–589. doi:10.1038/s41566-018-0253-x
Park, Y., Yamauchi, T., Choi, W., Dasari, R., and Feld, M. S. (2009). Spectroscopic phase microscopy for quantifying hemoglobin concentrations in intact red blood cells. Opt. Lett. 34 (23), 3668–3670. doi:10.1364/ol.34.003668
Percus, J. K., and Yevick, G. J. (1958). Analysis of classical statistical mechanics by means of collective coordinates. Phys. Rev. 110 (1), 1–13. doi:10.1103/physrev.110.1
Perelman, L. T., Backman, V., Wallace, M., Zonios, G., Manoharan, R., Nusrat, A., et al. (1998). Observation of periodic fine structure in reflectance from biological tissue: a new technique for measuring nuclear size distribution. Phys. Rev. Lett. 80 (3), 627–630. doi:10.1103/physrevlett.80.627
Popescu, G., Ikeda, T., Dasari, R. R., and Feld, M. S. (2006). Diffraction phase microscopy for quantifying cell structure and dynamics. Opt. Lett. 31 (6), 775–777. doi:10.1364/ol.31.000775
Prahl, S. (2018). Assorted spectra. Available online at: https://omlc.org/spectra/ (Accessed March 23, 2025).
Prahl, S. (2025a). Optical absorption of water compendium. Available online at: https://omlc.org/spectra/water/abs/index.html (Accessed March 20, 2025).
Pralh, S. (2025b). Tabulated molar extinction coefficient for hemoglobin in water. Available online at: https://omlc.org/spectra/hemoglobin/summary.html (Accessed March 20, 2025).
Priezzhev, A. V., Ryaboshapka, O. M., Firsov, N. N., and Sirko, I. V. (1999). Aggregation and disaggregation of erythrocytes in whole blood: study by backscattering technique. J. Biomed. Opt. 4 (1), 76–84. doi:10.1117/1.429923
Querry, M. R., Wieliczka, D. M., and Segelstein, D. J. (1997). “Water (h2o),” in Handbook of optical constants of solids (Elsevier), 1059–1077.
Rabinowitch, E. I. (1951). Light absorption by pigments in the living cell. Photosynth. Relat. Process. 2 (Part 1), 672–739.
Ribed-Sánchez, B., González-Gaya, C., Varea-Díaz, S., Corbacho-Fabregat, C., Pérez-Oteyza, J., and Belda-Iniesta, C. (2018). Economic analysis of the reduction of blood transfusions during surgical procedures while continuous hemoglobin monitoring is used. Sensors 18 (5), 1367. doi:10.3390/s18051367
Roggan, A., Friebel, M., Dörschel, K., Hahn, A., and Mueller, G. J. (1999). Optical properties of circulating human blood in the wavelength range 400-2500 nm. J. Biomed. Opt. 4 (1), 36–46. doi:10.1117/1.429919
Rowe, D. (2017). Complex refractive index spectra of whole blood and aqueous solutions of anticoagulants, analgesics and buffers in the mid-infrared. Southhampton, England: University of Southampton. Available online at: https://eprints.soton.ac.uk/416388/.
Rowe, D. J., Smith, D., and Wilkinson, J. S. (2017). Complex refractive index spectra of whole blood and aqueous solutions of anticoagulants, analgesics and buffers in the mid-infrared. Sci. Rep. 7 (1), 7356. doi:10.1038/s41598-017-07842-0
Salwen, M. J. (2017). Vitamins and trace elements. Henry’s clinical diagnosis and management by laboratory methods. 23rd ed. St Louis, MO: Elsevier.
Schmitt, J. M. (1986). Optical measurement of blood oxygenation by implantable telemetry. Technical Report G558–15. Stanford.
Soret, J. L. (1883). Analysespectrale: Sur le spectred’absorption du sang dans la partieviolette et ultra-violette. Compt Rend. 97, 1269–1270.
Steelman, Z. A., Ho, D. S., Chu, K. K., and Wax, A. (2019). Light-scattering methods for tissue diagnosis. Optica 6 (4), 479–489. doi:10.1364/optica.6.000479
Steinke, J. M., and Shepherd, A. P. (1988). Comparison of Mie theory and the light scattering of red blood cells. Appl. Opt. 27 (19), 4027–4033. doi:10.1364/ao.27.004027
Swiner, C. (2022). “WebMD,” in Serum Osmolality Test. Available online at: https://www.webmd.com/a-to-z-guides/serum-osmolality-test (Accessed March 23, 2025).
Sydoruk, O., Zhernovaya, O., Tuchin, V., and Douplik, A. (2012). Refractive index of solutions of human hemoglobin from the near-infrared to the ultraviolet range: Kramers-Kronig analysis. J. Biomed. Opt. 17 (11), 115002. doi:10.1117/1.jbo.17.11.115002
Takatani, S., and Graham, M. D. (1979). Theoretical analysis of diffuse reflectance from a two-layer tissue model. IEEE Trans. Biomed. Eng. (12), 656–664. doi:10.1109/tbme.1979.326455
Terstappen, L., DeGrooth, B. G., Visscher, K., VanKouterik, F. A., and Greve, J. (1988). Four-parameter white blood cell differential counting based on light scattering measurements. Cytom. J. Int. Soc. Anal. Cytol. 9 (1), 39–43. doi:10.1002/cyto.990090107
Terstappen, L. W. M. M., De Grooth, B. G., Ten Napel, C. H. H., Van Berkel, W., and Greve, J. (1986). Discrimination of human cytotoxic lymphocytes from regulatory and B-lymphocytes by orthogonal light scattering. J. Immunol. Methods. 95 (2), 211–216. doi:10.1016/0022-1759(86)90408-4
Terstappen, LWMM, Johnson, T. D., Mickaels, R. A., Chen, T. J., and Garth, O. (1991). Multidimensional flow cvtometric blood cell differentiation lVithoutErvthrocvteLvsis. Blood Cells 7, 585–602.
Tsinopoulos, S. V., Sellountos, E. J., and Polyzos, D. (2002). Light scattering by aggregated red blood cells. Appl. Opt. 41 (7), 1408–1417. doi:10.1364/ao.41.001408
Tuchin, V. V. (2007). Tissue optics: light scattering methods and instruments for medical diagnosis. 2nd ed. (Bellingham, WA: SPIE Press).
Tuchin, V. V., Zhestkov, D. M., Bashkatov, A. N., and Genina, E. A. (2004). Theoretical study of immersion optical clearing of blood in vessels at local hemolysis. Opt. Express 12 (13), 2966–2971. doi:10.1364/opex.12.002966
Twersky, V. (1970). Absorption and multiple scattering by biological suspensions. J. Opt. Soc. Am. 60 (8), 1084–1093. doi:10.1364/josa.60.001084
Verkruysse, W., Lucassen, G. W., de Boer, J. F., Smithies, D. J., Nelson, J. S., and van Gemert, M. J. C. (1997). Modelling light distributions of homogeneous versus discrete absorbers in light irradiated turbid media. Phys. Med. Biol. 42 (1), 51–65. doi:10.1088/0031-9155/42/1/003
Vierordt, K. (1873). Die Anwendung des SpectralapparateszurPhotometrie der Absorptionsspectren und zurquantitativenchemischen Analyse. Editor H. Laupp
Wang, J., Deng, Z., Wang, X., Ye, Q., Zhou, W., Mei, J., et al. (2015). Measurement of the refractive index of hemoglobin solutions for a continuous spectral region. Biomed. Opt. Express 6 (7), 2536–2541. doi:10.1364/boe.6.002536
Watson, D., Hagen, N., Diver, J., Marchand, P., and Chachisvilis, M. (2004). Elastic light scattering from single cells: orientational dynamics in optical trap. Biophys. J. 87 (2), 1298–1306. doi:10.1529/biophysj.104.042135
Wawrzyniak, A., Hamułka, J., Friberg, E., and Wolk, A. (2013). Dietary, anthropometric, and lifestyle correlates of serum carotenoids in postmenopausal women. Eur. J. Nutr. 52, 1919–1926. doi:10.1007/s00394-013-0493-y
Yaroslavsky, A., and Yaroslavsky, I. (2002). “Optics of blood,” in Handbook of optical biomedical diagnostics. Editor V. Tuchin (Bellingham WA: SPIE Press).
Zhang, Z., and Khatami, R. (2022). Can we trust the oxygen saturation measured by consumer smartwatches? Lancet Respir. Med. 10 (5), e47–e48. doi:10.1016/s2213-2600(22)00103-5
Zharinov, A., Tarasov, P., Shvalov, A., Semyanov, K., Van Bockstaele, D. R., and Maltsev, V. (2006). A study of light scattering of mononuclear blood cells with scanning flow cytometry. J. Quant. Spectrosc Radiat Transf. 102 (1), 121–128. doi:10.1016/j.jqsrt.2006.02.048
Zhernovaya, O., Sydoruk, O., Tuchin, V., and Douplik, A. (2011). The refractive index of human hemoglobin in the visible range. Phys. Med. Biol. 56 (13), 4013–4021. doi:10.1088/0031-9155/56/13/017
Zijlstra, W. G., and Buursma, A. (1997). Spectrophotometry of hemoglobin: absorption spectra of bovine oxyhemoglobin, deoxyhemoglobin, carboxyhemoglobin, and methemoglobin. Comp. Biochem. B Biochem. Mol. Biol. 118 (4), 743–749. doi:10.1016/s0305-0491(97)00230-7
Keywords: biomedical optics, light-tissue interaction, refractive index, whole blood, chromophores, scattering and absorption
Citation: Saiko G, Sadrzadeh-Afsharazar F, Burton T, Prahl S and Douplik A (2025) Absorption, scattering, and refractive index of blood and its components: a review. Front. Photonics 6:1636398. doi: 10.3389/fphot.2025.1636398
Received: 27 May 2025; Accepted: 09 July 2025;
Published: 21 August 2025.
Edited by:
Azhar Zam, New York University Abu Dhabi, United Arab EmiratesReviewed by:
Nilesh Vasa, Indian Institute of Technology Madras, IndiaPauline John, New York University Abu Dhabi Research Institute, United Arab Emirates
Copyright © 2025 Saiko, Sadrzadeh-Afsharazar, Burton, Prahl and Douplik. This is an open-access article distributed under the terms of the Creative Commons Attribution License (CC BY). The use, distribution or reproduction in other forums is permitted, provided the original author(s) and the copyright owner(s) are credited and that the original publication in this journal is cited, in accordance with accepted academic practice. No use, distribution or reproduction is permitted which does not comply with these terms.
*Correspondence: Alexandre Douplik, ZG91cGxpa0B0b3JvbnRvbXUuY2E=