 Anne L. Nielsen
 Shi Chen2
 Shelby J. Fleischer
- 1Department of Entomology, Rutgers University, Bridgeton, NJ, United States
- 2Department of Population Health and Pathobiology, North Carolina State University, Charlotte, NC, United States
- 3Department of Entomology, Pennsylvania State University, University Park, PA, United States
A corrigendum on
Coupling Developmental Physiology, Photoperiod, and Temperature to Model Phenology and Dynamics of an Invasive Heteropteran, Halyomorpha halys
by Nielsen, A. L., Chen, S., and Fleischer, S. J. (2016). Front. Physiol. 7:165. doi: 10.3389/fphys.2016.00165
In this manuscript, we present model results from eight locations over 10 years based on temperatures at weather stations and photoperiod. We inadvertently made a poor choice for a weather station to represent Wenatchee WA. To avoid heat island effects, we chose the Grouse Camp weather station to represent Wenatchee. However, although Grouse Camp is only 21 km from Wenatchee, it is in a mountainous area (1,642 m elevation) and poorly represents the climate in the apple growing region of Wenatchee, WA (190 m elevation). Thus, the results do not reflect potential population dynamics of H. halys in Wenatchee. In re-evaluation of the model, the data show that populations at Wenatchee, WA, are predicted to behave similarly to those at Salem, OR, with an average albeit marginal positive population growth. Conclusions that were driven heavily by photoperiod, such as the range in days for initiation of oviposition by overwintered adults, were less affected (from 16 down to 13 days). The strong differences were due to markedly higher degree day accumulations at Wenatchee versus Grouse Camp.
The following six files use the same order of tables and figures from the original manuscript and use the Weather Station data for Wenatchee, WA (network ID: GHCND:USC00459074).
• Table 2. Model outputs defining key population parameters for the years 2005–2014.
• Figure 7. Model predictions of adult population size for Wenatchee, WA. P represented parental overwintered adults, which was initialized as 1000 for each year and for each simulation run.
• Figure 8. Predicted population sizes (+/− range from all simulations and years) across all geographic locations for (A) maximum adult population size, and (B) final population size, and (C) yearly degree-day accumulation. The error bars represent the standard errors from 100 simulations for the metrics.
• Figure S3. Predicted total population size by life stage for Wenatchee, WA from 2005 through 2014. Populations were initialized with 1000 adults for each year and simulation run.
• Figure S5. Degree-day accumulation for Halyomorpha halys development in Wenatchee, WA from 2005 through 2014.
• Figure S7. Predicted total population size by generation for Wenatchee, WA.
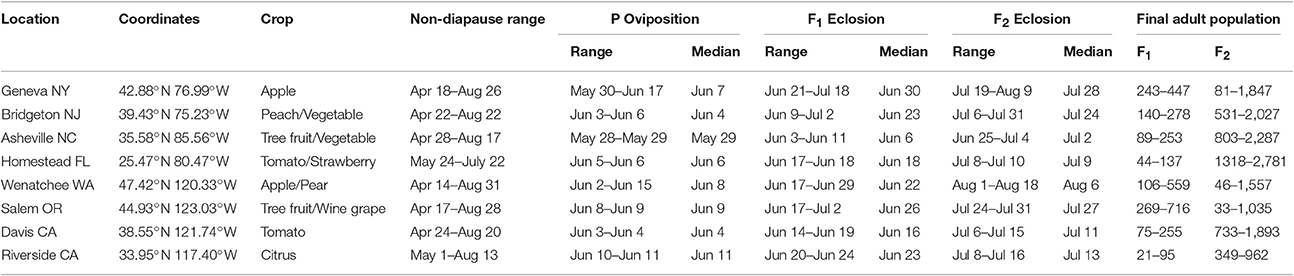
Table 2. Model outputs defining key population parameters for the years 2005-2014.
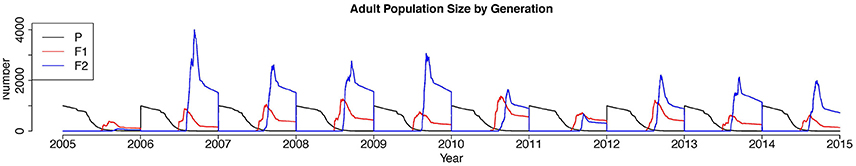
Figure 7. Model predictions of adult population size for Wenatchee, WA. P represented parental overwintered adults, which was initialized as 1,000 for each year and for each simulation run.
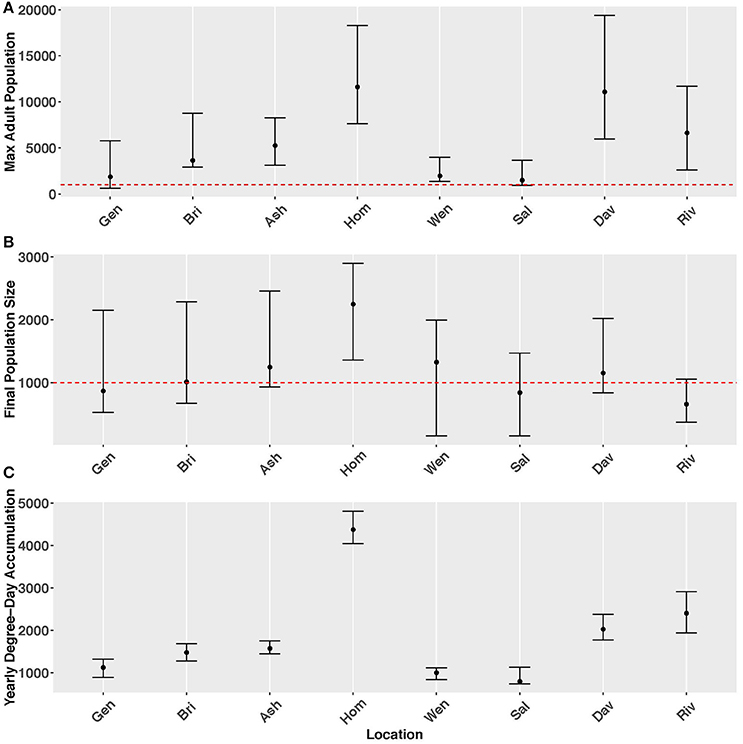
Figure 8. Predicted population sizes (+/− range from all simulations and years) across all geographic locations for (A) maximum adult population size, and (B) final population size, and (C) yearly degree-day accumulation. The error bars represent the standard errors from 100 simulations for the metrics.
We thank V. Jones for bringing this error to our attention, and the Frontiers journal for allowing us to add this Corrigendum.
Conflict of Interest Statement
The authors declare that the research was conducted in the absence of any commercial or financial relationships that could be construed as a potential conflict of interest.
Acknowledgments
This material is based upon the work supported by the National Institute of Food and Agriculture, U.S. Department of Agriculture, under award number SCRI 2011-51181-30937.
References
Keywords: brown marmorated stink bug, phenology, agent-based model, stochastic model, life-history, population dynamics, invasive species
Citation: Nielsen AL, Chen S and Fleischer SJ (2017) Corrigendum: Coupling Developmental Physiology, Photoperiod, and Temperature to Model Phenology and Dynamics of an Invasive Heteropteran, Halyomorpha halys. Front. Physiol. 8:568. doi: 10.3389/fphys.2017.00568
Received: 08 June 2017; Accepted: 20 July 2017;
Published: 11 August 2017.
Edited and reviewed by: Petros Damos, Aristotle University of Thessaloniki, Greece
Copyright © 2017 Nielsen, Chen and Fleischer. This is an open-access article distributed under the terms of the Creative Commons Attribution License (CC BY). The use, distribution or reproduction in other forums is permitted, provided the original author(s) or licensor are credited and that the original publication in this journal is cited, in accordance with accepted academic practice. No use, distribution or reproduction is permitted which does not comply with these terms.
*Correspondence: Anne L. Nielsen, bmllbHNlbkBhZXNvcC5ydXRnZXJzLmVkdQ==