 Jan Kijonka
 Petr Vavra2
- 1Department of Cybernetics and Biomedical Engineering, Faculty of Electrical Engineering and Computer Science, VSB—Technical University of Ostrava, Ostrava—Poruba, Czechia
- 2Department of Surgical Studies, Faculty of Medicine of the University of Ostrava, Ostrava, Czechia
- 3Faculty of Electrical Engineering and Information Technology, University of Žilina, Žilina, Czechia
This paper deals with a wavelet-based algorithm for automatic detection of isoelectric coordinates of individual QRS loops of VCG record. Fiducial time instants of QRS peak, QRS onset, QRS end, and isoelectric PQ interval are evaluated on three VCG leads
Introduction
Analysis of the electrocardiogram (ECG) which is an image of the electrical cardiac activity is widely used method for diagnostics of many heart diseases. Automatic detection of fiducial points of cardiac cycle: QRS peak, P, QRS, T waves onsets and ends is essential for ECG diagnostics, signal processing and further automatic heart diseases classification. Isoelectric line detection allows ECG beats alignment in order to averaging and ectopic ECG beats evaluation (Gatzoulis et al., 2018) and ECG record intra-individual variability assessment (Matveev et al., 2007; Penhaker et al., 2014).
Besides the common 12-leads ECG imaging, the vectorcardiography (VCG) with its three
We can find different approaches for automatic QRS detection and P, QRS, T waves segmentation based on the first and second derivative (e.g., Pan-Tompkins algorithm (Pan and Tompkins, 1985; Arzeno et al., 2006)), low-pass differentiation (LPD) (Chazal and Celler, 1996; Laguna et al., 1994), adaptive filtering (Soria-Olivas et al., 1998), wavelet transform (WT) (Martínez et al., 2004; Mahmoodabadi et al., 2005; Sahambi et al., 1997), morphology and gradient (TDMG) (Mazomenos, 2012), dynamic time warping (DTW) (Vullings et al., 1998a) or artificial neural networks (Dokur et al., 1997). An appropriate algorithm selection depends on a few factors like real-time (Pan and Tompkins, 1985; Mazomenos, 2012; Guven et al., 2014) or offline data processing (Martínez et al., 2004; Mahmoodabadi et al., 2005; Vullings et al., 1998a; Dokur et al., 1997), requirements for robustness of the detector in evaluation of records of purely healthy or also pathological cases, ability to recognize noisy signals with motion and other artifacts, processing of a standard quality or a diagnostic high resolution and high sampling rates ECG records, including single or multi-leads approaches.
Featured work follows on from the previous study of intra-individual variability of VCG record evaluation (Penhaker et al., 2014), where VCG loops were spatially aligned based on manually annotated isoelectric coordinates by cardiologist, time synchronized by QRS peaks and compared on specified QRS length (global QRS boundaries) for the intra-individual variability assessment. The proposed algorithm automates the process of the isoelectric coordinates and global QRS boundaries detection and follows the QRS peak detector based on wavelet transform and biorthogonal wavelet presented in previous work (Penhaker et al., 2014), as an alternative to Daubechies wavelet used in studies (Martínez et al., 2004; Mahmoodabadi et al., 2005; Sahambi et al., 1997). The properties of the biorthogonal wavelets were found ideally suited for ECG parameters estimation in (Sivannarayana and Reddy, 1999) since they excite various morphologies of ECG’s better at different scales. The wavelet scales for the proposed algorithm were experimentally established for QRS complex detection (QRS onset and QRS end) including wide-QRS conditions assessment detected on a different scale unlike previous studies (Martínez et al., 2004; Mahmoodabadi et al., 2005; Sahambi et al., 1997) using the same scales for various QRS morphologies. The QRS peak, QRS onset and QRS end detection is performed based on standardly used techniques of searching for maxima, minima, zero crossings and energy of wavelet coefficients in combination of time-domain signal analysis for QRS onset and QRS end adjusting by slope performed on a temporal search window. A time-domain signal analysis technique was already used in TDGM algorithm (Mazomenos, 2012) including signal preprocessing, QRS complex feature extraction employing Pan-Tompkins detection method (Pan and Tompkins, 1985) and temporal search windows followed by P-wave and T-wave feature extraction. While WT is quite robust in the presence of noise and baseline wander situations (Sivannarayana and Reddy, 1999; Dinh et al., 2001), the TDGM performed better in intricate ECG morphologies (Mazomenos, 2012). To benefit from both techniques, the proposed algorithm uses signal preprocessing before applying WT followed by time-domain-analysis. The signal preprocessing is performed by digital finite impulse response (FIR) high pass filter with 1 Hz cuttoff frequency in passband (0 dB signal attenuation) and infinite impulse response (IIR) 50 Hz or 60 Hz notch filter used for powerline distorted signals, meeting requirements for diagnostic ECG frequency bands (Klingfield et al., 2007; Medteq, 2022). The isoelectric line is searched on a temporal window localized before QRS onset as a flattest interval of a PQ segment, where the PQ segment appears to be the most acceptable location of zero cardiac activity, which is suitable for most pathological cases (Guven et al., 2014). In case of VCG leads, the isoelectric lines of the (X, Y, Z) leads defines coordinates with zero electrical activity situated in origin of the Cartesian coordinate system. With this assumption, the spatiotemporal VCG QRS loops alignment is performed by QRS loop isoelectric coordinates offsets removal and ECG beats synchronized with QRS peaks detected in one of the
The algorithm was developed and optimized on 161 records of 58 healthy control subjects (HC), 69 patients with myocardial infarction (MI), and 34 patients with bundle branch block (BBB) of the PTB (Physikalisch-Technische Bundesanstalt) diagnostic database of 12 standard ECG leads and 3 Frank VCG leads. All recordings are 2 min long, sampled at 1,000 Hz (Matveev et al., 2007; Bousseljot et al., 1995). The diagnostic ECG data are processed offline based on 3 VCG leads increasing robustness of the detector. Validation of the QRS detector and QRS onset and QRS end time instants detection was performed on CSE (Common Standards for Quantitative Electrocardiography) multilead database dataset 3 with 12 standard leads and 3 Frank leads of 125 biological ECGs. All recordings are 10 s long sampled at 500 Hz (Goldberger et al., 2000).
Used methods
One of possible signal analysis is its comparison with a set of the test functions, where
Continuous wavelet transform
If the base fiction
where
Continuous wavelet transform (CWT) uses a sampled data, but the process of translation is a smooth operation across the length of the sampled data. The scaling can be defined from a minimum (original signal scale) to a maximum selected by the user, making a finer resolution possible. The disadvantage compared to discrete wavelet transform (DWT) is increasing of the computational time and higher memory requirement for wavelet coefficients calculation (Aldroubi and Unser, 1996).
Wavelet type used
Wavelets can be classified as orthogonal, non-orthogonal and biorthogonal. Only biorthogonal wavelets provide the time symmetry and prevent phase shifts of the transformed signal (Altmann, 1996). For the ECG signal analysis, the shape of the signal in the time-domain is important, while a signal reconstruction (inverse-transform) is not required. From this standpoint, the biorthogonal wavelets are advantageous for the ECG signal analysis. The shape of the biorthogonal wavelet 2.2 used in this work resembles the shape of the ECG waveform (see Figure 1) which excite various morphologies of ECG waveforms better at different scales (Sivannarayana and Reddy, 1999). Application of biorthogonal wavelets for the ECG parameters (P, QRS, and T) estimation is known from the literature (Sivannarayana and Reddy, 1999; Louis et al., 1997) and it was already used for QRS peak detection in the previous work (Penhaker et al., 2014). The central frequency of the biorthogonal wavelet 2.2:
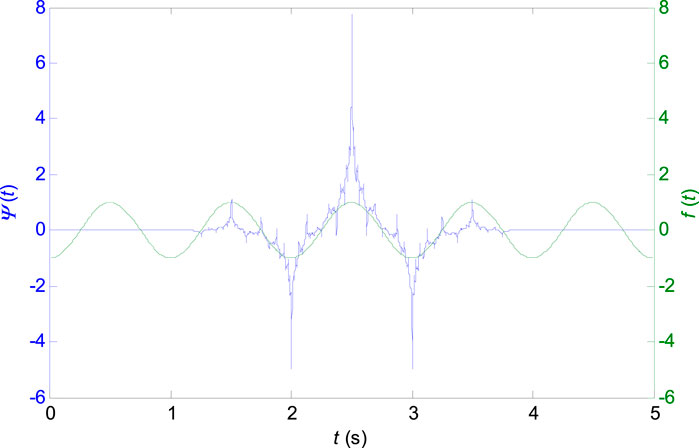
FIGURE 1. Biorthogonal wavelet 2.2 with the central frequency
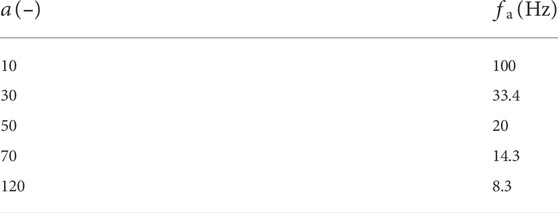
TABLE 1. Pseudofrequencies for the scales
Scalogram and coefficients of the continuous wavelet transform
In Figure 2 there is the scalogram of continuous wavelet transform for biorthogonal wavelet 2.2 which is used in this work. The input signal is one VCG lead of healthy control patient (HC), a patient with inferior myocardial infarction (MI) and a patient with the left bundle branch block (LBBB).
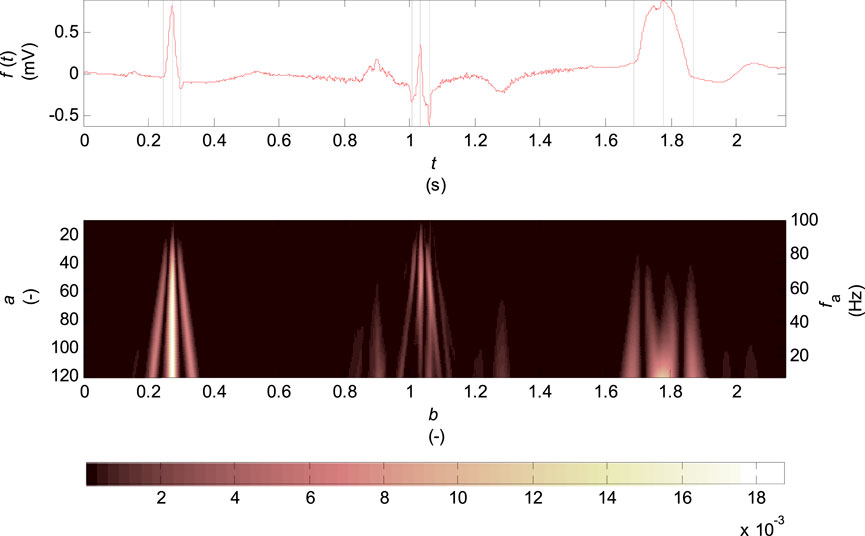
FIGURE 2. Scalogram of the continuous wavelet transform for biorthogonal wavelet 2.2, scale parameter
The scalogram represents the percentage of energy of wavelet coefficients at the given scale
where
The scaling parameter is selected in the range of
where
Among the scale and frequency there is only an approximate relationship since the wavelet contains other frequency components in addition to the calculated central frequency
The scalogram (see Figure 2) shows the highest percentage of energy of coefficients concentrated at the R wave and Q, S wave times for the record of healthy patient in the entire range of scales
The coefficients of wavelet transform for discrete scale values
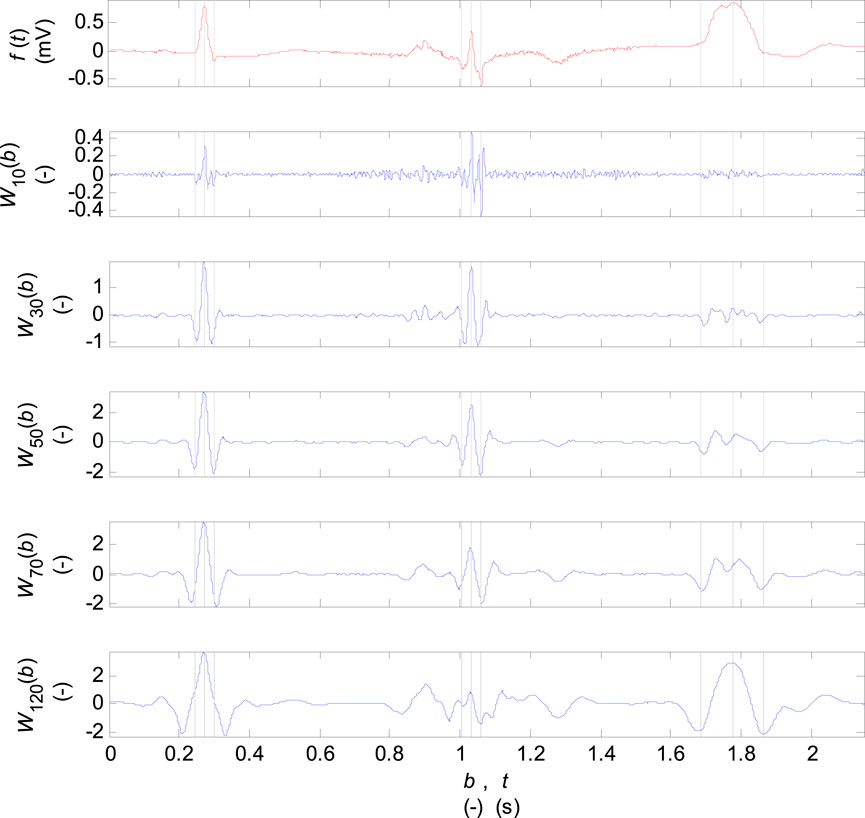
FIGURE 3. Coefficients of the wavelet transform for the scale parameter
Algorithm description
A flowchart of the algorithm is shown in Figure 4. Individual parts of the algorithm are described in figures from Figures 5–10. The input signals of the algorithm are VCG leads (
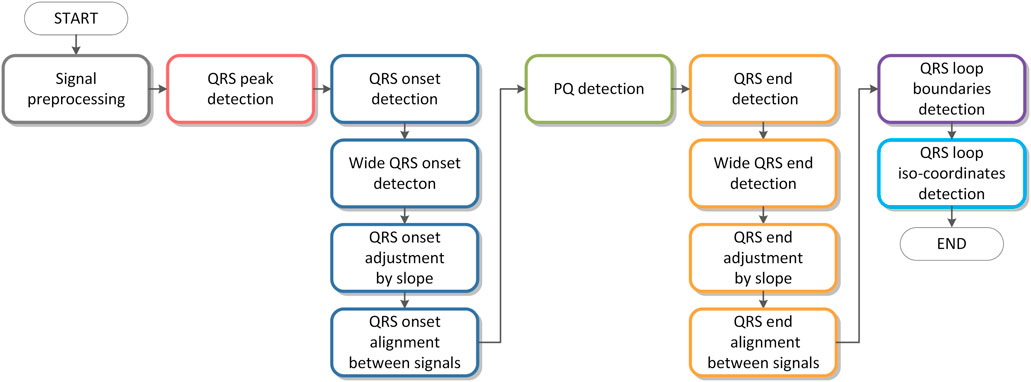
FIGURE 4. Algorithm flowchart.
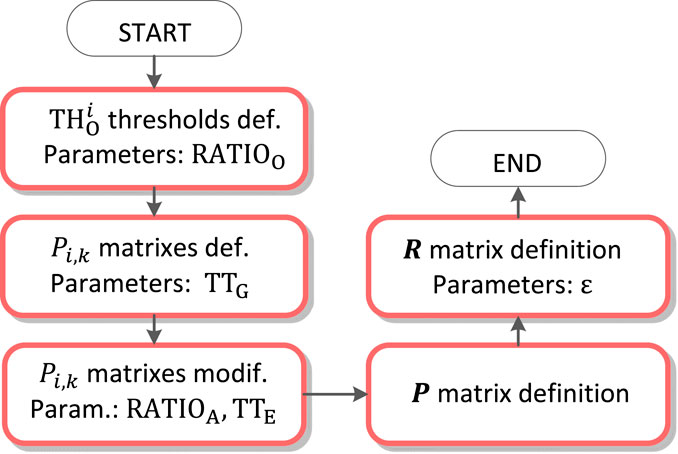
FIGURE 5. QRS detection flowchart.
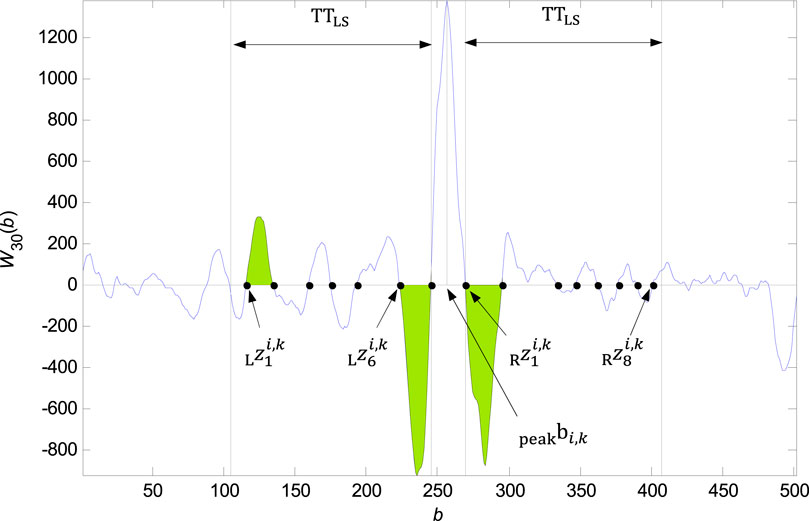
FIGURE 6. Founded zero points
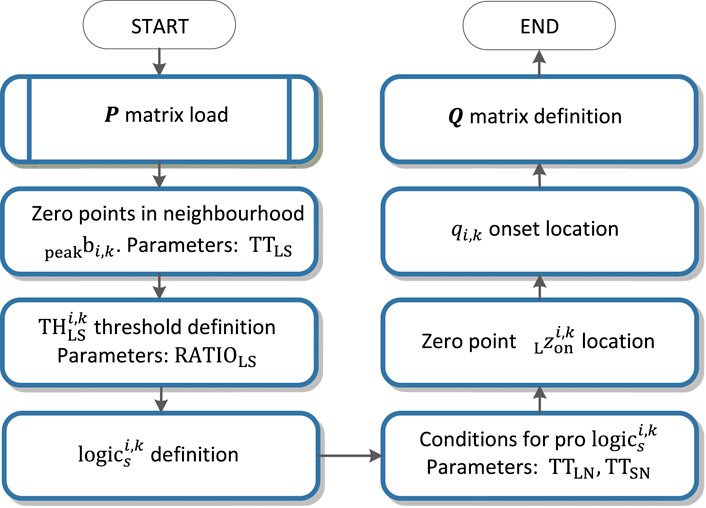
FIGURE 7. QRS onset detection flowchart.
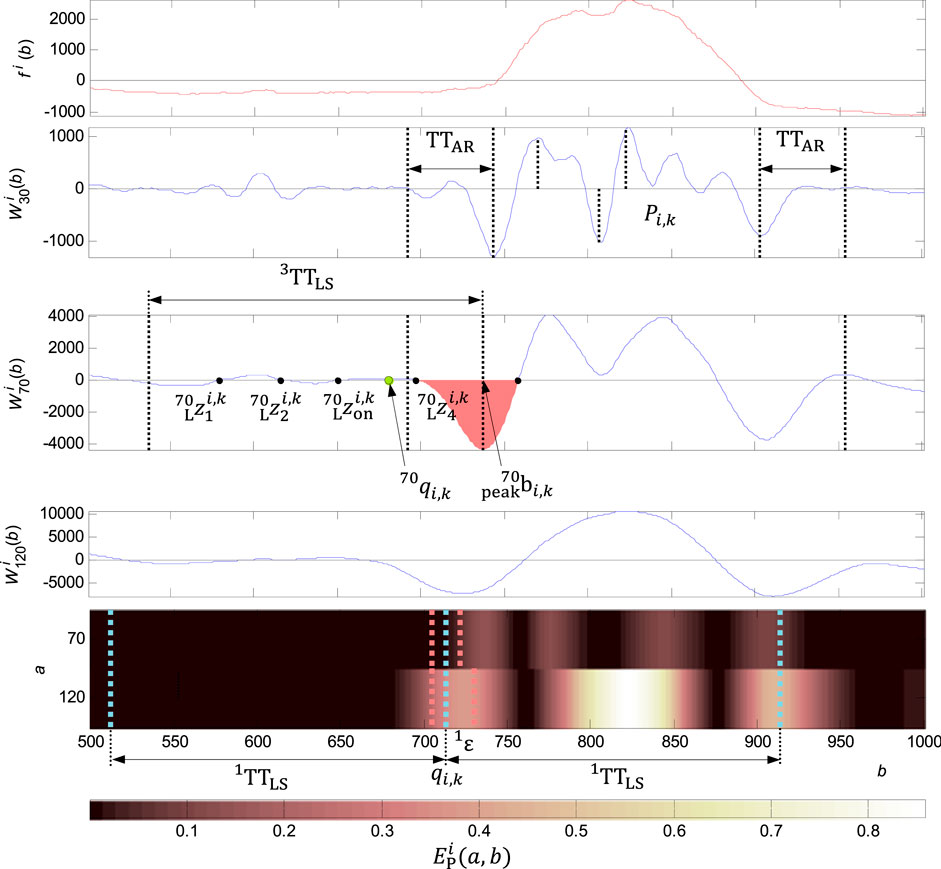
FIGURE 8. Adjusting the QRS onset for a wide QRS. In the first graph from the top: the original signal
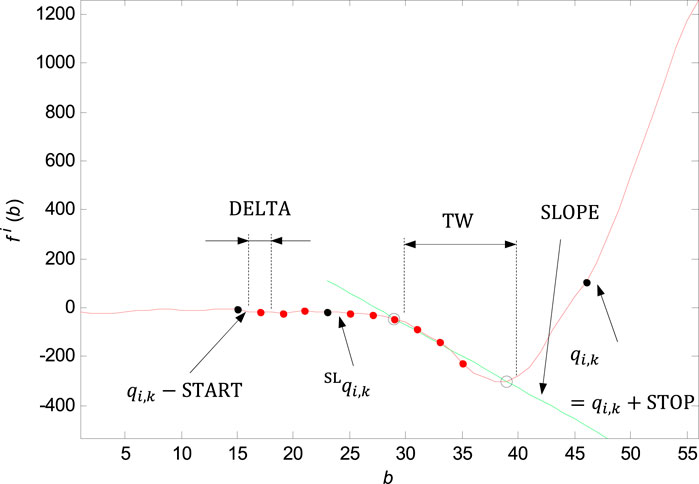
FIGURE 9. Marking of the shifting window with the width of
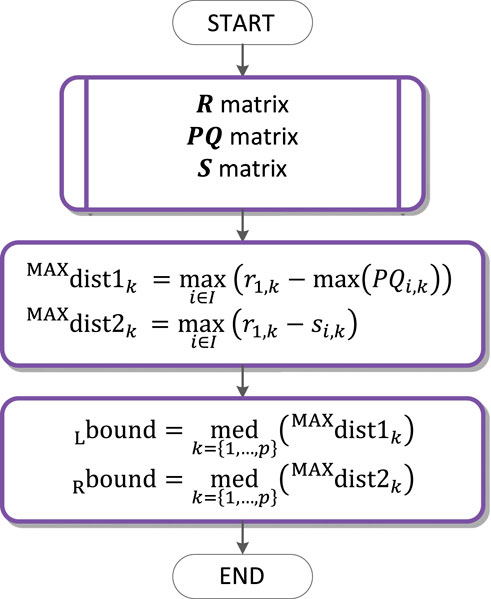
FIGURE 10. QRS loop boundaries detection flow chart.
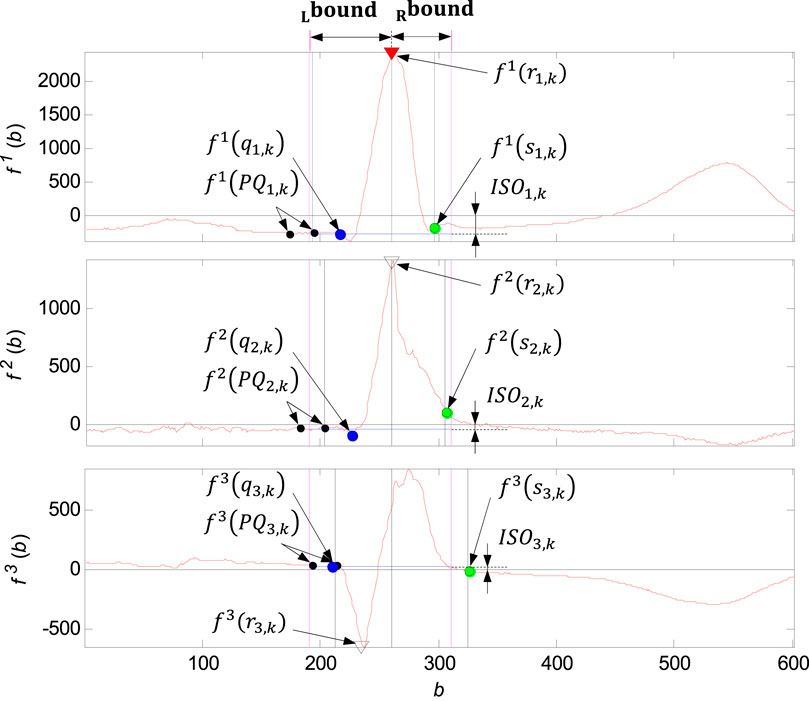
FIGURE 11. Illustration of the QRS loop boundaries detection and the individual time instants
Signal preprocessing
The VCG leads (
QRS peak detection
QRS detection is based on waletet transform of input signals on scale
QRS onset and QRS end detection
Detection of the QRS onset and QRS end is based on the zero crossing of the function
For the QRS onset detection, there is the partial function
An example of zero points in the
• If the length of one last non suitable interval is lower then
• As the zero point
The QRS onset is than accurately traced in the interval between the zero points
The QRS end is detected by analogy in the right neighbourhood of the
Wide QRS onset and QRS end detection
Adjusting the QRS onset or QRS end is performed in the case of meet the condition of exceeding the percentage of energy of the wavelet coefficients 2) in the QRS onset or QRS end neighbourhood. It is compared the energy percentage at scales
QRS onset and QRS end adjustment by slope
QRS onset and QRS end adjustment by slope is based on the linear regression method and line slope calculation on the time window of the input signal in the section before the QRS onset (
For the QRS onset adjusting there are some parameters set: the window width
Finding the slope in the right neighbourhood of the
QRS onset and QRS end alignment between signals
Aligning of the QRS onsets or QRS ends between the three VCG leads is performed in case of exceeding the distances between the
PQ detection
PQ isoelectric interval detection is based on linear regression and line slope evaluation on the temporal search window of the input signal in the neighbourhood of the QRS onset point
QRS loop boundaries detection
The QRS loop boundaries detection is performed based on the QRS peak detected (
QRS loop isoelectric coordinates detection
Isoelectric coordinates are evaluated for each of the QRS loop
where
Results
Validation of the QRS detector and QRS onset and QRS end time instants was performed on CSE multilead database dataset 3 with 12 standard leads and 3 Frank leads of 125 biological ECGs. All recordings are 10 s long sampled at 500 Hz with 1 µV resolution. Patients with various diagnoses including bundle branch blocks and aspecific conduction defects with significant changes in ECG image causing a wide QRS (>120 ms) was observed in 21 of total of 125 cases. Number of cases for four main groups of diagnoses can be seen in Table 2 (Goldberger et al., 2000), (Zhao et al., 2004), (Willems et al., 1990).
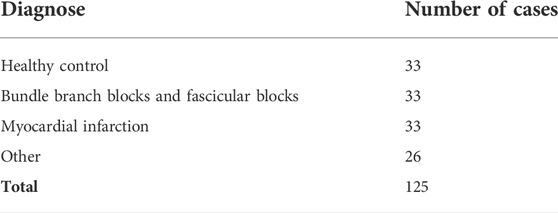
TABLE 2. Preview of CSE validation database diagnoses.
To use the records sampled a at 500 Hz, the records were firstly resampled to 1,000 Hz in the context of preserving original filters and frequency scales of wavelet transform. Form the total of 125 records, one record with an artificial pacemaker was excluded.
Median referee annotation based on five referee cardiologists and median program annotation based on nine different ECG analysis programs are provided in CSE database together with ECG waveforms in digital data file format. The cardiologists only analysed every fifth record and additionally some waves, for which a set of analysis programs differed significantly. For this study, the records were divided into two groups, where in the first group the results were compared with median referee annotation, while for the second group only the median program annotation was available. However, the median wave recognition results of the nine ECG analysis programs are almost identical to the final visual estimates obtained by the referees and thus can be used as a substitute of the reference annotation (Zhao et al., 2004).
In the CSE database we obtained 3 different sets of annotations, one for each channel
To evaluate the QRS peak detector, we use the sensitivity (
where
For total of 1,467 beats, we obtained a sensitivity of
To assess QRS onset and QRS end time delineation performance, mean value
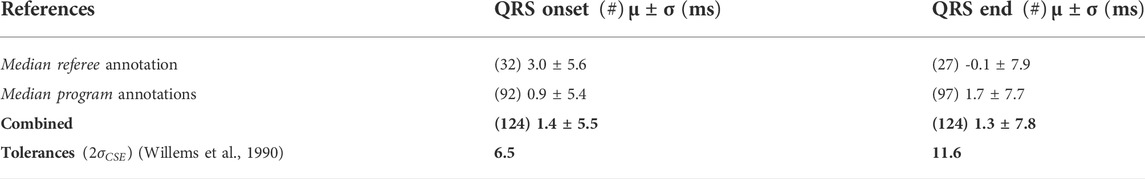
TABLE 3. ORS onset and QRS end delineation performance.
To evaluate the isoelectric PQ segments detection accuracy, a condition was established: The PQ interval of the temporal 20 ms window must be located between the end of the P wave and the beginning of the QRS onset annotated by a referee. The condition was met for all the 124 records.
Requirements for the global
Conclusion
Designed QRS loop detector evaluates zero crosses of the wavelet transform, linear regression and percentage of energy of the wavelet coefficients on specified scales and uses the experimentally set logical terms to select an appropriate interval between zero crossings to QRS onset and QRS end evaluation. To provide a finer resolution an accurate localisation in time, a continuous WT and biorthogonal wavelet versus quadratic spline in other studies is used. To adjust fiducial points, the problem is transferred to time-domain on pre-defined temporal windows. The PQ isoelectric interval is found on temporal search window as the flattest part of the PQ segment.
Detected isoelectric coordinates of the individual QRS loops of a VCG record allows the spatiotemporal QRS loops alignment synchronized by QRS peaks with the length of QRS determined by automatically detected QRS bounds of the record. The spatiotemporal QRS loops alignment allows the QRS loops comparison, averaging, ectopic QRS loops evaluation and intra-individual variability assessment which was addressed in the previous study.
Compared to other algorithms, the proposed solution combines both WT as a robust method in the presence of noise as well as in baseline wander situations, and time-domain techniques for better performance in intricate ECG morphologies to adjust QRS onset, QRS end, and isoelectric PQ interval detected on temporal search window. Special care is given to wide pathological QRS, where fiducial points are evaluated on different scale for experimentally set conditions. The algorithm uses multilead approach, where three VCG leads are used simultaneously for detection of QRS onset and QRS end.
The results of QRS peak, QRS onset and QRS end detection was compared with other published approaches and have shown that the developed algorithm provides a reliable and accurate delineation of the ECG signal better or comparable with other algorithms with standard deviation complying
Data availability statement
Publicly available datasets were analyzed in this study. This data can be found in the PTB Diagnostic ECG Database: https://physionet.org/content/ptbdb/1.0.0/. Requests to access the CSE database should be directed to cHJ1YmVsLmx5b25AZ21haWwuY29t.
Author contributions
JK developed signal processing algorithm on input data. The processed VCG signals and results were assesed and consulted by physicians PV and PZ under the guidance of research work MP.
Funding
This publication has been produced with the support of the Integrated Infrastructure Operational Program for the project: Creation of a Digital Biobank to support the systemic public research infrastructure, ITMS: 313011AFG4, co-financed by the European Regional Development Fund.
Conflict of interest
The authors declare that the research was conducted in the absence of any commercial or financial relationships that could be construed as a potential conflict of interest.
Publisher’s note
All claims expressed in this article are solely those of the authors and do not necessarily represent those of their affiliated organizations, or those of the publisher, the editors and the reviewers. Any product that may be evaluated in this article, or claim that may be made by its manufacturer, is not guaranteed or endorsed by the publisher.
References
Altmann J. (1996). Wavelet basics. online]. [cit. 2015-05-11]: http://www.wavelet.org/tutorial/wbasic.htm.
Arzeno N. M., Poon C. S., Deng Z. D. (2006). Quantitative analysis of QRS detection algorithms based on the first derivative of the ECG. New York, USA: International Conference of the IEEE Engineering in Medicine and Biology Society, 1788–1791. doi:10.1109/IEMBS.2006.260051
Bousseljot R., Kreiseler D., Schnabel A. (1995). Nutzung der EKG-Signaldatenbank CARDIODAT der PTB über das Internet. Biomed. Technik/Biomedical Eng. 1, 317–318. doi:10.1515/bmte.1995.40.s1.317
Burch G. E. (1985). The history of vectorcardiography. Med. Hist. 29, 103–131. doi:10.1017/S002572730007054X
Chazal P., Celler B. (1996). “Automatic measurement of the QRS onset and offset in individual ECG leads,” in Presented at the 18th Ann. Int. Conf.. (Amsterdam, Netherlands: IEEE Eng. Med. Biol. Soc.).
CSE WORKING PARTY (1985). Recommendations for measurement standards in quantitative electrocardiography. The CSE Working Party. Eur. Heart J. 6, 815
Dinh H. A. N., Kumar D. K., Pah N. D., Burton P. (2001). “Wavelets for QRS detection,” in Conference Proceedings of the 23rd Annual International Conference of the IEEE Engineering in Medicine and Biology Society, Istanbul, Turkey, October 25–28, 2001, 207–211. doi:10.1109/iembs.2001.1020593
Dokur Z., Olmez T., Yazgan E., Ersoy O. K. (1997). Detection of ECG waveforms by neural networks. Med. Eng. Phys. 198, 738–741. doi:10.1016/s1350-4533(97)00029-5
Gatzoulis K. A., Arsenos P., Trachanas K., Dilaveris P., Antoniou C., Tsiachris D., et al. (2018). Signal‐averaged electrocardiography: Past, present, and future. J. Arrhythm. 343, 222–229. doi:10.1002/joa3.12062
Goldberger A. L., Amaral L. A. N., Glass L., Hausdorff J. M., Ivanov P. Ch., Mark R. G., et al. (2000). PhysioBank, PhysioToolkit, and PhysioNet: Components of a new research resource for complex physiologic signals. Circulation 101 (23), e215–e220. doi:10.1161/01.cir.101.23.e215
Guven O., Eftekhar A., Hoshyar R., Frattini G., Kindt W., Constandinou T. G. (2014). “Realtime ECG baseline removal: An isoelectric point estimation approach,” in 2014 IEEE Biomedical Circuits and Systems Conference (BioCAS) Proceedings, Lausanne, Switzerland, October 22–24, 2014, 29–32. doi:10.1109/BioCAS.2014.6981637
Klingfield P., Gettes L. S., Bailey J. J., Childers R., Deal B. J., Hancock E. W., et al. (2007). Recommendations for the standardization and interpretation of the electrocardiogram: Part I: The electrocardiogram and its technology: A scientific statement from the American heart association electrocardiography and arrhythmias committee, council on clinical cardiology; the American college of cardiology foundation; and the heart rhythm society: Endorsed by the international society for computerized electrocardiology. Circulation 115 (10), 1306–1324. doi:10.1161/CIRCULATIONAHA.106.180200
Kumar A., Berwal D., Kumar Y. (2018). Design of high-performance ECG detector for implantable cardiac pacemaker systems using biorthogonal wavelet transform. Circuits Syst. Signal Process. 379, 3995–4014. doi:10.1007/s00034-018-0754-3
Laguna P., Jané R., CanimaL P. (1994). Automatic detection of wave boundaries in multilead ECG signals: Validation with the CSE database. Comput. Biomed. Res. 27 (1), 45–60. doi:10.1006/cbmr.1994.1006
Mahmoodabadi S. Z., Ahmadian A., Abolhasani M. D., Eslami M., Bidgoli H J. (2005). “ECG feature extraction based on multiresolution wavelet transform,” in 2005 IEEE Engineering in Medicine and Biology 27th Annual Conference, Shanghai, China, September 1–4, 2005, 3902–3905. doi:10.1109/IEMBS.2005.1615314
Malmivuo J., Plonsey R. (1995). Bioelectromagnetism: Principles and applications of bioelectric and biomagnetic fields, XXII. New York: Oxford University Press, 482.
Martínez J., Almeida R., Olmos S., Rocha A. P., Laguna P. (2004). A wavelet-based ECG delineator: Evaluation on standard databases. IEEE Trans. Biomed. Eng. 514, 570–581. doi:10.1109/TBME.2003.821031
Matveev M., Krasteva V., Naydenov S., Donova Ta (2007). Possibilities of signal-averaged orthogonal and vector electrocardiography for locating and evaluating the size of acute myocardial infarction. J. Electrocardiol. 40, S62–S63. doi:10.1016/j.jelectrocard.2007.03.059,
Mazomenos E. B. (2012). “A time-domain morphology and gradient based algorithm for ECG feature extraction,” in Industrial Technology (ICIT), 2012 IEEE International Conference (IEEE), 117–122.
Medteq (2022). ECG filters. [cit. 2022-05-10]. Available at: http://www.medteq.info/med/ECGFilters
Pan J., Tompkins W. J. (1985). A real-time QRS detection algorithm. IEEE Trans. Biomed. Eng. 3, 230–236. doi:10.1109/TBME.1985.325532
Pavlov Z., Abel H. (1975). Physiological correlations of the heart generator system, the electrical properties of the heart and body structures. Theory of cardioelectric space. Adv. Cardiol. 19, 10–11. doi:10.1159/000399609
Penhaker M., Darebníková M., Jurek F., Augustynek M. (2014). “Evaluation of electrocardiographic leads and establishing significance intra-individuality,” in Innovations in bio-inspired computing and applications. Advances in intelligent systems and computing, Cham, Germany. Editors A. Abraham, P. Krömer, and V. Snášel, 237
Sahambi J. S., Tandon S., Bhatt R. K. P. (1997). Using wavelet transforms for ECG characterization. An on-line digital signal processing system. IEEE Eng. Med. Biol. Mag. 16 (1), 77–83. doi:10.1109/51.566158
Sivannarayana N., Reddy D. C. (1999). Biorthogonal wavelet transforms for ECG parameters estimation. Med. Eng. Phys. 213, 167–174. doi:10.1016/s1350-4533(99)00040-5
Soria-Olivas E., Martinez-SoberM. , Calpe-Maravilla J., Guerrero-Martinez J. F., Chorro-Gasco J., Espi-Lopez J. (1998). Application of adaptive signal processing for determining the limits of P and T waves in an ECG. IEEE Trans. Biomed. Eng. 45, 1077–1080. doi:10.1109/10.704877
Vila J., Gang Y., Presedo J., Fernandez-Delgado M., Malik M. (2000). A new approach for TU complex characterization. IEEE Trans. Biomed. Eng. 47, 764–772. doi:10.1109/10.844227
Vullings H., Verhaegen M., Verbruggen H. (1998). “Automated ECG segmentation with dynamic time warping,” in Proc. 20th ann. Int. Conf. IEEE engineering in medicine and biology soc.. Hong Kong, China: (Hong Kong), 163
Willems J. L., Arnaud P., Jan H., Bourdillon P. J., Degani R., Denis B., et al. (1985). Establishment of a reference library for evaluating computer ECG measurement programs. Comput. Biomed. Res. 18, 439–457. doi:10.1016/0010-4809(85)90021-7
Willems J. L., Arnaud P. V., Jan H., Degani R., Macfarlane P. W., Zywietz C. (1990). Common standards for quantitative electrocardiography: Goals and main results. Methods Inf. Med. 29 (4), 263–271. doi:10.1055/s-0038-1634793
Keywords: vectorcardiography, QRS detection, segmentation, wavelet transform, isoelectric line detection
Citation: Kijonka J, Vavra P, Zonca P and Penhaker M (2022) A wavelet-based VCG QRS loop boundaries and isoelectric coordinates detector. Front. Physiol. 13:941827. doi: 10.3389/fphys.2022.941827
Received: 12 May 2022; Accepted: 04 October 2022;
Published: 21 October 2022.
Edited by:
Rajesh Kumar Tripathy, Birla Institute of Technology and Science, IndiaReviewed by:
Sibghatullah Khan, Sreenidhi Institute of Science and Technology, IndiaRishi Raj Sharma, Defence Institute of Advanced Technology (DIAT), India
Copyright © 2022 Kijonka, Vavra, Zonca and Penhaker. This is an open-access article distributed under the terms of the Creative Commons Attribution License (CC BY). The use, distribution or reproduction in other forums is permitted, provided the original author(s) and the copyright owner(s) are credited and that the original publication in this journal is cited, in accordance with accepted academic practice. No use, distribution or reproduction is permitted which does not comply with these terms.
*Correspondence: Jan Kijonka, amFuLmtpam9ua2FAdnNiLmN6