 Xiangyu Ren1,2,3*
 Mathieu Henry4
 Simon Boisbluche4Kilian Philippe5Mathieu Demy1,4
 Shuzhe Ding1,2
 Jacques Prioux1,2,3
- 1Sino-French Joint Research Center of Sport Science, Key Laboratory of Adolescent Health Assessment and Exercise Intervention of Ministry of Education, College of Physical Education and Health, East China Normal University, Shanghai, China
- 2Movement, Sport, Health Laboratory, Rennes 2 University, Bruz, France
- 3Department of Sports Sciences and Physical Education, École Normale Supérieure de Rennes, Bruz, France
- 4Rugby Club Vannes, French Rugby Federation, Vannes, France
- 5Laboratory of Movement, Balance, Performance and Health (MEPS, EA-4445), University of Pau and Pays de l’Adour, Tarbes, France
Introduction: Professional rugby union players can improve their performance by engaging in small-sided games (SSGs), which simulate the movement patterns of the game. This study collected metrics related to running performance and mechanical workload and their relative values from both forward and back positions, aiming to explore the impact of different SSGs factors on athlete workload, as well as the workload difference between official games (OGs) and SSGs.
Methods: The monitored GPS data were collected from SSGs with different player numbers and pitch sizes (five sessions), SSG rules (5 weeks, four sessions per week), and OGs conducted throughout the year. Additionally, the study compared changes in players’ sprinting performance before and after two SSG sessions.
Results: Backs had greater workload than forwards. Less space and number of players SSG (4 vs. 4, 660 m2) was conducive to facilitating training for players in acceleration and deceleration. Conversely, larger spaces were associated with improved running performance. However, the introduction of a floater had no significant impact on performance improvement. Additionally, the 7 vs. 4 model (seven players engaged with four opponents) resulted in the greatest workload during medium-hard accelerations (F = 52.76–88.23, p < 0.001, ηp2 = 0.19–0.28). Japan touch model allowed for more high-speed running training (F = 47.93–243.55, p < 0.001, ηp2 = 1.52). The workload performed by SSGs can almost cover that of OGs (F = 23.36–454.21, p < 0.05, ηp2 = 0.03–0.57). In the context of ηp2, values around 0.01, 0.06 and 0.14 indicate small, medium and large effects respectively.
Discussion: However, given the significantly higher workload of SSGs and the slight decrease in sprinting performance, further research is required to examine the training patterns of SSGs. This study provided insight into the impact of player numbers, pitch size, and rules on rugby-specific SSGs. Coaches should optimize SSG setups for enhanced training outcomes, ensuring the long-term development of physical capacity, technical and tactical skills.
Introduction
Rugby union (RU) is a dynamic, field-based team sport that combines high-intensity (collisions, accelerations, and changes of direction) with low-intensity (jogging and walking) activity (Duthie et al., 2003a). This multifaceted movement requires players to detain a vast and varied skill set. It is therefore essential that the training strategy is optimized and organized to focus on the development of technical (tackling, rucks, mauls) and tactical (game situation adaptability) skills. Moreover, the development of physical attributes such as maximal strength, power, cardiovascular capacity and tendomuscular robustness is a crucial aspect of a RU player’s preparation. These attributes greatly influence a team’s performance as they engage in various running activities throughout the game (Gabbett et al., 2007). Repeated high-intensity and skill exercises are typical training methods in RU, but they are insufficient to satisfy the demands of the professional setting. To date, strength and endurance training rarely expose athletes to on-field situations. This omission may hinder the players’ opportunity to develop decision-making skills in a dynamic environment (Gabbett et al., 2012; Davids et al., 2013), which is essential to achieve gameplay performance outcomes. In RU training where time dedicated to physical enhancement is scarce, the necessity for concurrent training methods has led to the inclusion of small-sided games (SSGs).
Over the last 20 years, coaches have adopted SSGs as a training method for team sports (Gamble, 2004; Gabbett, 2006; Dellal et al., 2011a). Indeed, SSGs provide a dynamic environment that is simple to adapt to, requiring fewer players and smaller pitch sizes than traditional games. The aim is to create sub-environments that imitate the stress and fatigue players experience during games, while developing an athlete’s stamina, muscular strength, mental fortitude, and game-play abilities (Gabbett et al., 2009). Coaches can manipulate the impact of SSGs on players’ physiological and perceptual responses.
Workload quantification is essential for a more profound comprehension of the dose-response relationship between stress and internal responses. It requires meticulously recording the demands of both training and competition (Meir et al., 1993; Bourdon et al., 2017; Impellizzeri et al., 2023). This quantification can manifest as external load, representing the work completed by an athlete independently of their internal characteristics (Wallace et al., 2009), or internal load, encompassing all psychophysiological responses occurring during the execution of exercise prescribed by the coach (Impellizzeri et al., 2019). To date, many research investigations have analyzed the workload of different SSG models by manipulating pitch size, player density, rules, and other variables. Specifically, most studies have demonstrated that larger playing pitch size was correlated with increased heart rate (HR) (Atlı et al., 2013), lactate concentration and subjective ratings of perceived exertion (RPE) (Kennett et al., 2012b). Furthermore, reducing the amount of participating players could raise HR reserves (Dellal et al., 2011b). Recent advancements in global positioning systems (GPS) technology have made it possible to obtain valid and reliable assessments of external load (Teixeira et al., 2021; Clavel et al., 2022; Crang et al., 2022). In this regard, recent studies in soccer and rugby have indicated that the SSG models involving reduced player numbers or larger fields led to the highest time-motion variables (Hill-Haas et al., 2010; Kennett et al., 2012a). In addition, when the rules changed (e.g., the number of ball contacts allowed was reduced), the high-speed running distance (HSR) increased (Castellano et al., 2013).
When utilizing GPS data collection, the primary focus often centers around speed zone distances, with a particular emphasis on HSR as crucial metrics for performance assessment. Total distance (TD) is the second most commonly captured metric, followed by sprints and meters per minute (West et al., 2019). These parameters are closely associated with the skill level of athletes and the scores in match play (Dalton-Barron et al., 2020). Players with excellent repeated sprinting abilities demonstrate higher rates of running at speeds greater than 5 m.s−1 per minute in match play (7.9 ± 1.0 m.min−1). Players with long-duration and high-intensity intermittent running capabilities exhibit longer TD covered (6,800 ± 1,969 m), with distances for speeds between 0 and 5 m·s−1 (6,309 ± 1,582 m) and exceeding 5 m.s−1 (490 ± 141 m) being greater (Gabbett et al., 2013). Among winning teams, displacement variables are notably high, encompassing TD, low-speed running distance, acceleration (Gabbett, 2013) and decelerations times (Kempton et al., 2017). The purpose of the acceleration-based external load indicator therein is to provide an estimate of whole-body mechanical load (Hollville et al., 2021) (i.e., external forces applied to the body/biomechanical loading experienced by the musculoskeletal system) (Vanrenterghem et al., 2017). In addition to fundamental motion analysis measurements, player load (PL) is an index based on acceleration measurements that can be effectively utilized to quantify running demands (Roe et al., 2016), with relative values reaching 7.2 to 10.4 (SD: 0.8–2.0) during the match (Gabbett, 2015). Repeated high-intensity effort (RHIE), as a composite matric of contact, acceleration, or sprint, were associated with higher HR and perceived exertion (Johnston and Gabbett, 2011), occurring in proximity to key events (11 ± 6) (Gabbett and Gahan, 2016; Sheehan et al., 2022). Relevant professionals can utilize the above information to devise strategies for physical training of sufficient intensity and implement recovery protocols.
However, it might be challenging for coaches to plan the optimal training framework and to manage the exercise’s overall intensity as physical and technical demands are highly sensitive when SSGs settings change (Dellal et al., 2008; Owen et al., 2012). Additionally, poorly designed drills, such as those with inappropriately sized width, too many participants or inappropriate rules, can also have detrimental effects by raising the possibility of contact injuries (Clemente, 2020). To address these limitations, training goals must be accurately and thoroughly established when SSG sessions are designed and implemented. Moreover, there is a lack of comparative research between the external load of SSGs and official games (OGs) in RU. Hence, more research is required to establish the validity of these training methods and to explore their potential in provoking specific physiological, technical, and tactical adaptations.
The aims of this study were twofold, first we wanted to quantify performance outcome by investigating the effects of different numbers of players (4 vs.4 to 8 vs. 8), pitch sizes (660, 900, 1,080, 2,500 m2), and rules during SSGs. Secondly, we aimed to describe and compare the external load of OGs and SSG models in relation to their goals. Given that a RU player’s physical demands differ according to their position (Darrall-Jones et al., 2015), it is critical to analyze these effects on the forwards and backs groups as independent populations. Thus, we hypothesized that changing different settings in SSGs would result in varying workload differences among forwards and backs (Dudley et al., 2023), and that the physical demands of external load indicators in SSGs would fulfil the requirements observed during games (Sarmento et al., 2018).
Methods
Participants
Forty professional RU players (age: 25.07 ± 4.82 years; height 1.85 ± 0.09 m, with forwards 1.88 ± 0.09 m and backs 1.84 ± 0.09 m; body mass 102.48 ± 15.7 kg, with forwards 111.07 ± 14.79 kg and backs 90.29 ± 5.74 kg) from the same team (French second division rugby championship, Pro D2) participated voluntarily in the research. A minimal sample size was estimated a priori with G*Power software3.1.9.7 (University of Dusseldorf, Dusseldorf, Germany). The estimation was performed using a small-to-medium effect size (ES) f = 0.25, partial eta squared (ηp2) = 0.06, α error prob = 0.05, power (1-β error prob) = 0.8, numerator df = 3. The result showed a suitable total sample size of 22 players for actual high power (80.03%). Before the start of the protocol, subjects attended a presentation to receive information outlining the experimental procedures. All players were provided informed consent, aligning with the principles outlined in the Declaration of Helsinki. They retained the freedom to discontinue their involvement in the study at any point without facing any adverse consequences. The execution of the study protocol received assistance from both the medical and technical personnel affiliated with the professional team. Finally, the study respected the ethical guidelines of Rennes University and the research laboratory associated with this study.
Study design and settings
This research was based on two main categories of SSG models that investigate the impact of modifying pitch size, player numbers and different game rules on external workload in RU. Data collection occurred during the 31 OGs in an entire season. 7 days separated each game (Figure 1). All SSG models and OGs were conducted on the same field and under similar temperature and relative humidity (Varley et al., 2012). All SSGs assessment protocols were completed after a 15-minute warm-up (i.e., dynamic stretching, mobility, and muscle activation). The coach supervised and ensured, through verbal encouragement, that athletes provided maximal exertion. During the study phase, every player was required to standardize their caloric intake and hydration status at least 24 h before each test day.
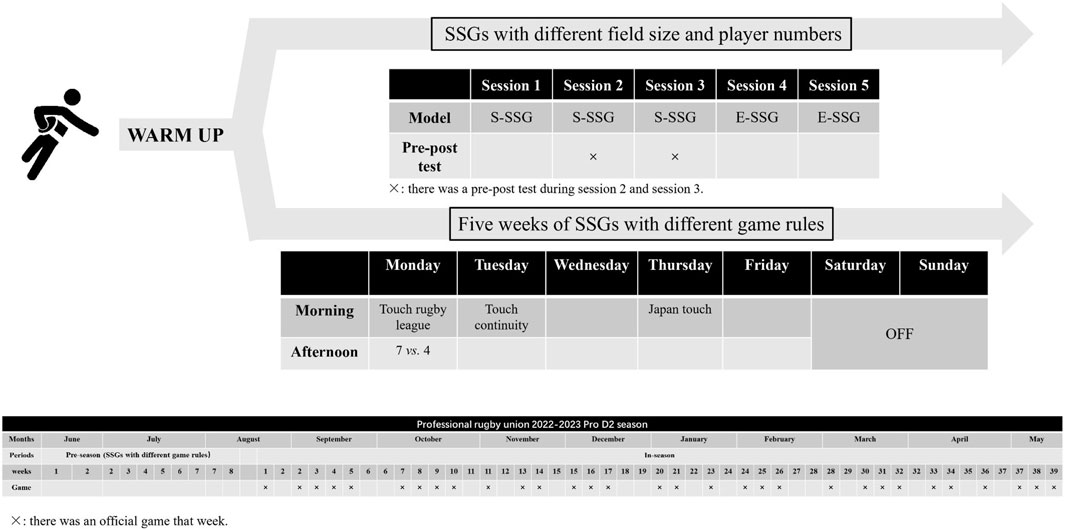
FIGURE 1. The arrangement of SSGs and organization of the 2022–2023 Pro D2 season.
Procedures
Performance monitoring
The application of GPS devices, for quantifying physical attributes (the player’s speed, acceleration, distance covered, etc.) in team sports, demonstrates remarkable effectiveness and reliability (Houy, 2020). GPS signals provide information about speed, distance, position, and acceleration of player movements during drills and official matches. Training sessions on different SSG models were recorded using GPS and Global Navigation Satellite System (GLONASS) technology (Vector Stadium Receiver, Optimeye X7 sensors, Catapult Sports®, Australia). When compared to cells sampled at lower frequencies, the 10 Hz cell produces the most efficient and reliable data (Akenhead et al., 2014). The GPS unit also includes a tri-axial accelerometer and gyroscope sampled at 100 Hz to provide higher velocity and acceleration accuracy, physical collision, and RHIE data. Each GPS sensor is equipped with a stretch vest that all players wear between their shoulder blades. These devices were activated 30 min before each training session to ensure a clear satellite reception. The GPS data were exported by applying specialist software (Openfield Console 3.7) for subsequent analysis.
10-m and 20-m sprint test
Given that RU typically involves short sprints of 10 m with player’ average sprint distance ranging between 15 and 21 m (Gabbett, 2012), we conducted 10-m and 20-m sprint test. These tests were employed both before and after two training sessions using S-SSG model to assess each player’s acceleration ability and their performance changes.
Sprint speed was assessed by 10- and 20-m sprint times using dual beam electronic timing gates (Swift Performance Equipment, New South Wales, Australia). All running tests were conducted on a rugby pitch (natural turf). After a standardized warm-up, players performed two sprint trials interspersed with 1-min rest periods. Light gates were positioned at the 10 m and 20 m marks to evaluate the time taken to reach each distance. All players started with the front foot positioned 0.5 m behind the starting line, and players were instructed to run as fast as possible for a distance of 20 m from standing. The best score for each distance was recorded as the test score (Gabbett et al., 2008; Comfort et al., 2012; Zabaloy et al., 2021). The within-trial validity and reliability of the above procedure have been established (Chiwaridzo et al., 2017).
Task design of SSGs
Effects of modifying pitch size and player numbers
SSG models included free play with a focus on ball possession. In this category of models, SSGs played on strength training days were described as strength SSG (S-SSG) models, whereas SSGs performed on endurance training days were referred as endurance SSG (E-SSG) models. The SSGs training protocols were specially prescribed and implemented by the team coaches. In the framework of the team’s tactical approach, players were involved in five SSG models: Three S-SSG models (4 vs. 4, 4 vs. 5, and 5 vs. 5) and two E-SSG models (7 vs. 7, and 8 vs. 8) (Table 1). Where 4 vs. 5 employs the 4 vs. 4 + 1 floater format, which essentially represented the coach’s attempt to introduce a variant based on the 4 vs. 4 SSG. In this session, both the pitch size and the rules of the SSG remained consistent with the 4 vs. 4 SSG.
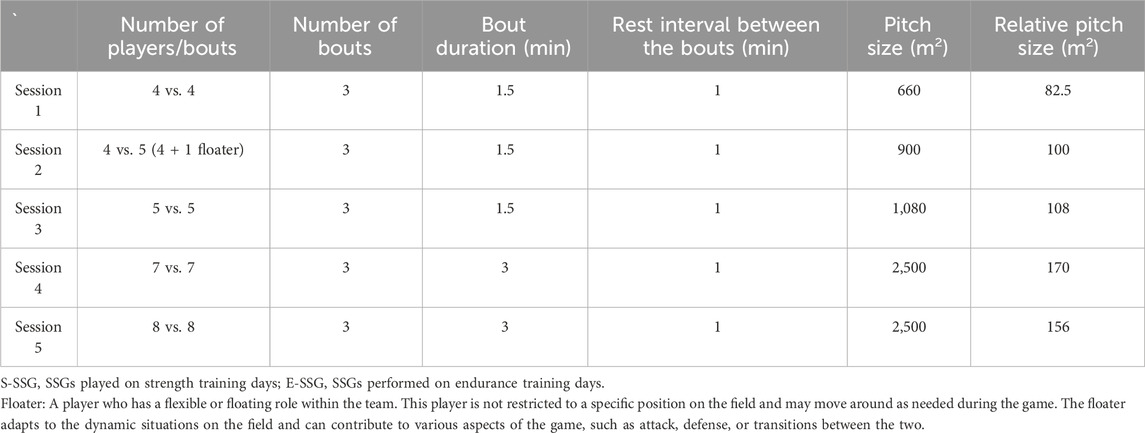
TABLE 1. Training organization of five small-sided games models in eight sessions.
Effects of modifying game rules
The SSG models were structured around four distinct rules (Table 2). With the aim of enhancing endurance and acceleration, touch rugby league (TRL) sessions were conducted on Monday mornings. 7 vs. 4 sessions were employed on Monday afternoons to target small-space acceleration. Touch continuity (TC) sessions took place on Tuesday mornings to achieve high intensity. Japan touch (JT) sessions were held on Thursday mornings with the purpose of emphasizing speed. The changes in pitch size and number of players in 7 vs.4 SSGs were made within the constraints of the rules. There were inherent correlations between these changes, and therefore they can be considered as a whole for comparison with SSGs of other rules. The four models were carried out over a period of 5 weeks, with four training sessions per week.
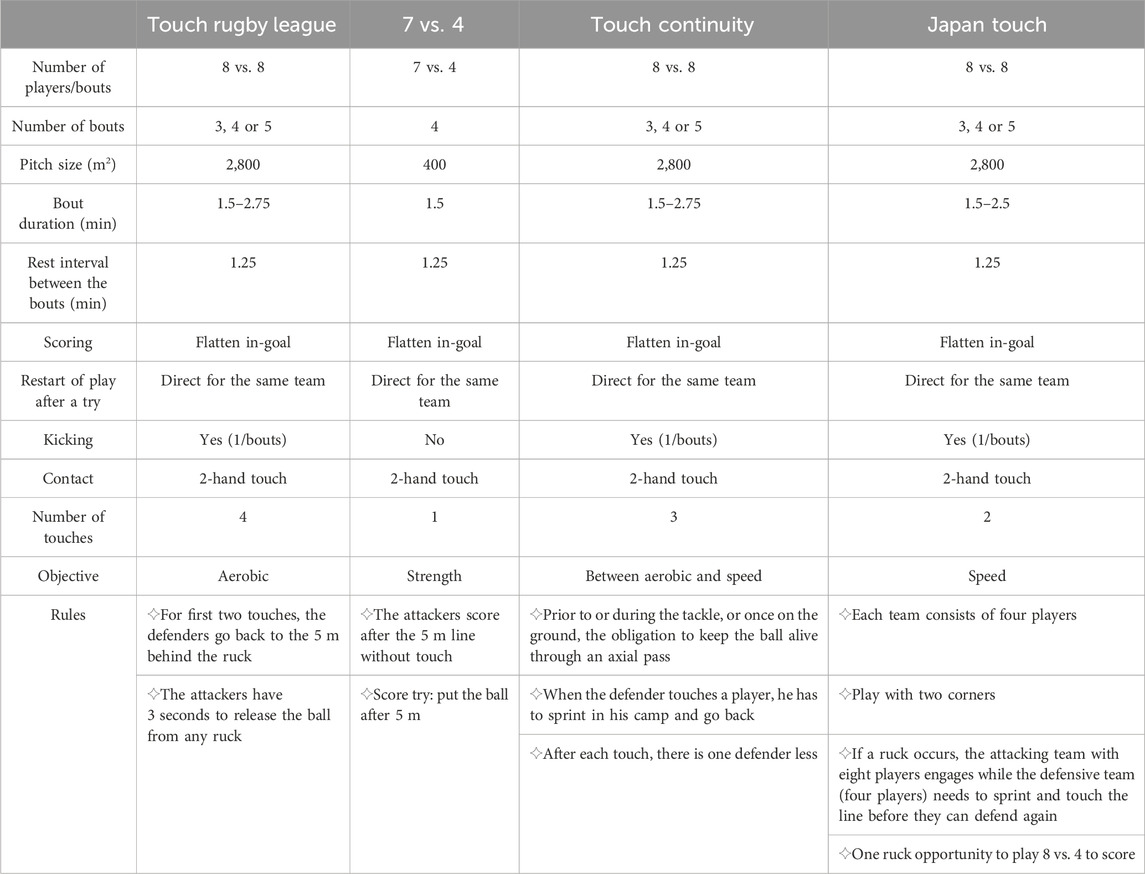
TABLE 2. Small-sided games models with four sets of rules.
Study variables
The metrics of running capability were reported as TD covered, maximum running velocity (Vmax), HSR (>15 km.h−1) (Waldron et al., 2011; Kempton et al., 2014), very high-speed running (VHSR) (>21 km.h−1) (Waldron et al., 2011; Kempton et al., 2014), and sprint running (SR) (>25 km.h−1) (Dubois et al., 2017; Vachon et al., 2022) distance. Mechanical workload metrics were reported as PL (arbitrary unit, AU), the number of medium acceleration (MA) (>2 m.s−2), distance of medium acceleration (D-MA) (>2 m.s−2), the number of hard acceleration (HA) (>2.5 m.s−2), distance of hard acceleration (D-HA) (>2.5 m.s−2), the number of medium deceleration (MD) (>2 m.s−2), the number of hard deceleration (HD) (>2.5 m.s−2) and RHIE. These metrics were expressed in absolute (ball in play) values. To allow for comparison between SSGs and OGs, these metrics were reported as per minute values.
Statistical analysis
A total of 900 SSG data points were evaluated during the S-SSG and E-SSG training sessions. The number of participating players in S-SSG models was twenty-seven, with fourteen for forwards and thirteen for backs. E-SSG models involved thirty-three participating players, including sixteen for forwards and seventeen for backs. The SSGs with the rules of TRL, 7 vs. 4, TC, and JT were examined on a total of 9604 SSG data points. To describe the workload requirements of SSG models and OGs, a descriptive analysis was performed using the data as mean and standard deviation (mean ± SD). The coefficient of variation (CV) for SSG models was calculated to determine the variability of performance indicators. Before initiating the analysis of variance, we used the Shapiro-Wilk test and Levene’s test to determine the normality and homogeneity of variance in all of the data. When the data exhibited normal distribution and homogeneity of variance, Student’s t-test was employed to compare the differences between S-SSG model and E-SSG model. Considering the varying training participants and pitch sizes, this study employed a two-way analysis of variance (ANOVA) to investigate the interactions among these factors. A least significant difference (LSD) post hoc test was performed after significant main effects and factor interactions (Perneger, 1998). The paired samples t-test is employed to compare the differences in 10 m and 20 m sprint performance before and after training sessions using four S-SSG models. The Mann-Whitney U test, Kruskal-Wallis H-test and its subsequent post hoc comparison procedure (Dunn’s post hoc analysis) were applied due to the non-normal distribution of the GPS metrics, the heterogeneity of the variance and the comparison of SSG models and OGs. The statistical significance was set at p < 0.05. ES was evaluated using Cohen’s d and partial eta squared (ηp2) along with a 95% confidence interval. Cohen’s d = 0.2, 0.5, and 0.8, ηp2 = 0.01, 0.06 and 0.14 correspond to small, medium and large effects respectively (Cohen, 1992).
Results
Effects of modifying pitch size and player numbers
High variability was observed in the metrics of VHSR (CV = 0.63) and SR (CV = 1.10). Conversely, mechanical workload and TD exhibited low variability (CV = 0.11–0.41) (Table 3). When evaluating the running performance, our results show that the TD of backs and HSR of both positions in E-SSG models outperformed S-SSG models (Figures 2A, B, p < 0.01, ES = 1.52, 1.14 and 1.58). This trend was further supported by the statistical results presented in Table 3, where the p-values and Cohen’s d effect sizes highlighted significant differences. For example, the ES for the absolute value of TD was −1.3, and it was −1.13 for HSR. Similarly, with respect to mechanical workload, S-SSG models usually outperformed higher values compared to E-SSG models (Figure 2C, p < 0.05, ES = 0.01–0.91). These trends were also corroborated by the results presented in Table 3, where the corresponding p-values and Cohen’s d values emphasized substantial effect sizes. The relative values of MA+MD and HA+HD were specifically noticeable, with effect sizes of 1.33 and 1.41, respectively. Figure 2D illustrates the differences between the pre-performance and post-performance tests on neuromuscular function, and the results show no significant difference in sprint performance.
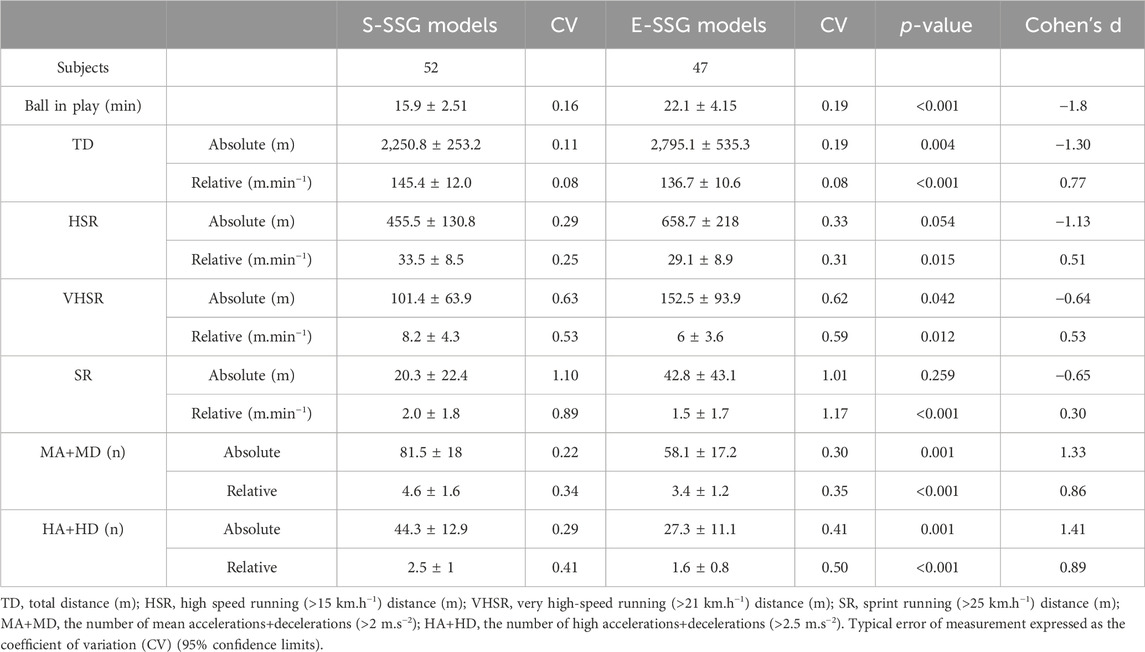
TABLE 3. Mean ± SD values of metrics taken from S-SSG and E-SSG models.
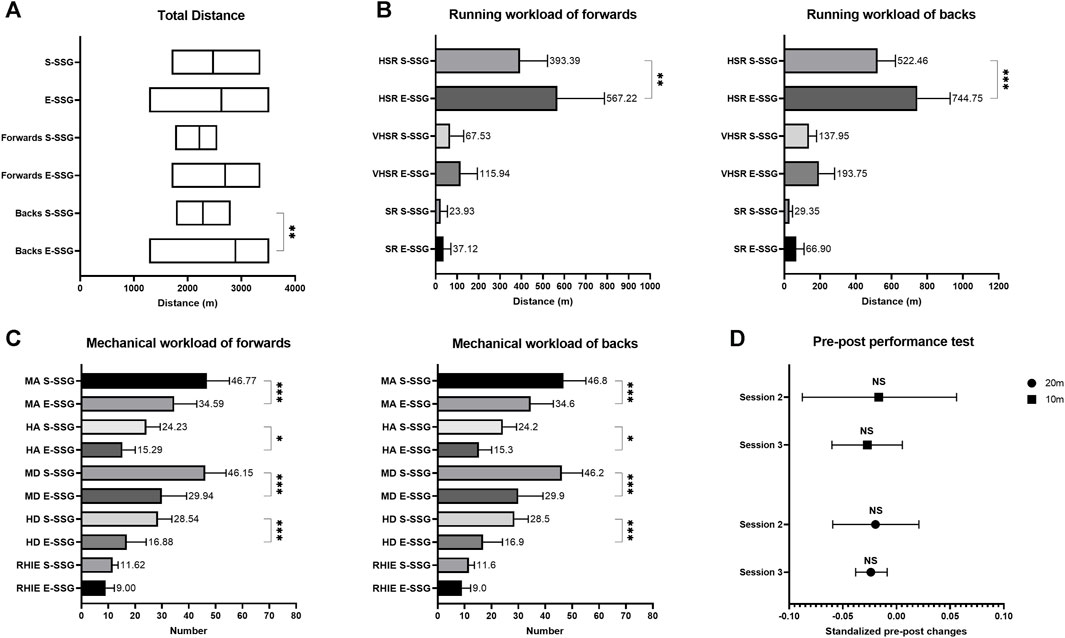
FIGURE 2. Comparison of workload and performance changes in S-SSG and E-SSG models. (A) Comparison of TD for forwards and backs. (B) Running workload comparison for forwards and backs. (C) Mechanical workload comparison for forwards and backs. (D) Difference between pre-and post-performance test on neuromuscular function in 10 m and 20 m. S-SSG, small-sided game played on strength training day; E-SSG, small-sided game performed on endurance training day; HSR, high-speed running (>15 km.h−1); VHSR, very high-speed running (>21 km.h−1); SR, sprint running (>25 km.h−1); MA, the number of medium accelerations (>2 m.s−2); HA, the number of hard accelerations (>2.5 m.s−2); MD, the number of medium decelerations (>2 m.s−2); HD, the number of hard decelerations (>2.5 m.s−2); RHIE, repetitive high-intensity exercise. *p < 0.05, **p < 0.01, ***p < 0.001.
Figure 3 highlights the impact of varying player numbers within the SSG models on performance outcomes as a function of position. In Figures 3A, B, the TD and HSR covered by forwards was highest (p < 0.05, ηp2 = 0.46 and 0.44) in the 7 vs. 7 model. Among backs, the 4 vs. 5 model demonstrate a notably lower (p < 0.05, ES = 0.95) D-MA performance compared to the 4 vs. 4 model (Figure 3C). Furthermore, the D-HA metric values within the 4 vs. 5 model were the lowest (p < 0.05, ηp2 = 0.40) among all S-SSG models (Figure 3D).
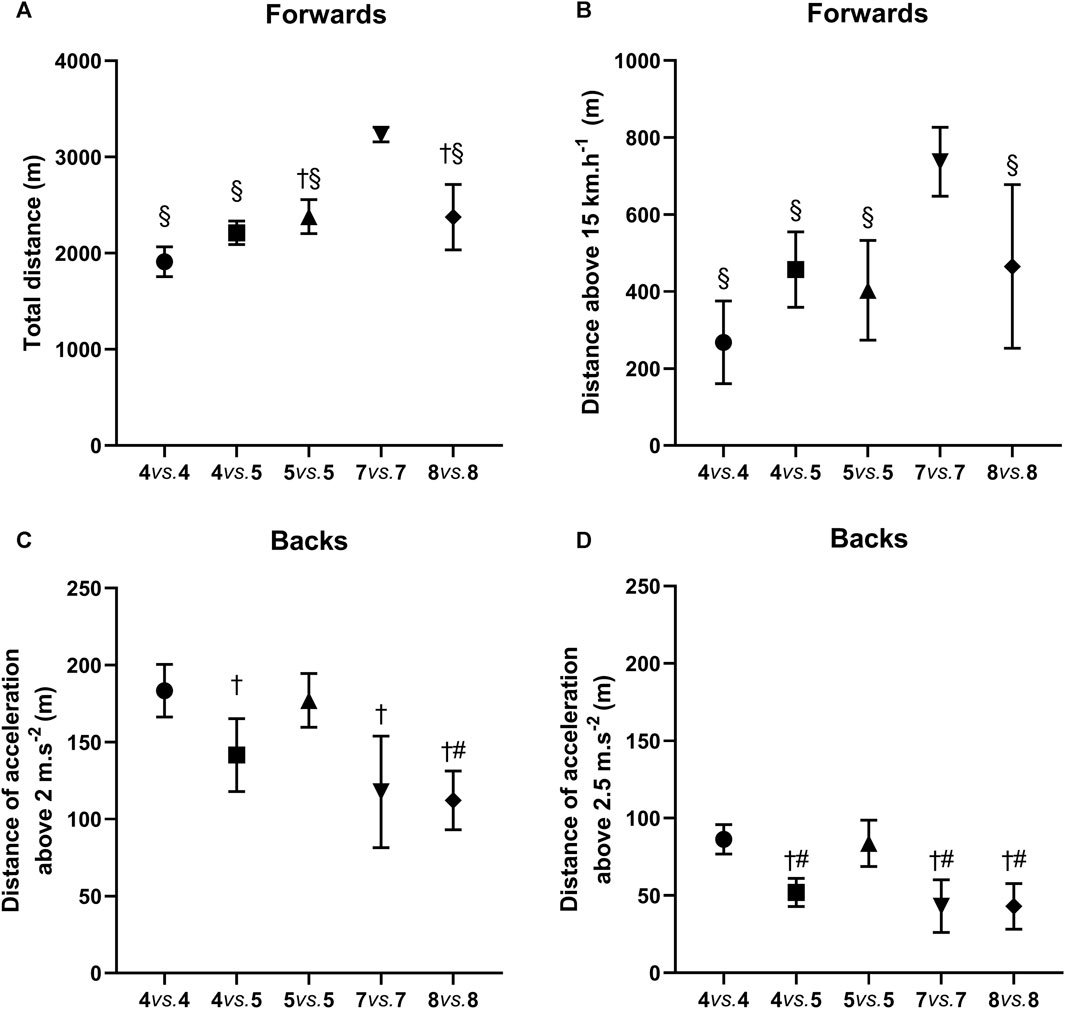
FIGURE 3. Effect of player numbers on performance in SSG models for forwards and backs. (A) Impact of the number of players on TD performance for forwards. (B) Impact of the number of players on HSR performance for forwards. (C) Impact of the number of players on D-MA performance for backs. (D) Impact of the number of players on D-HA performance for backs. §: Compared to 7 vs. 7, p < 0.05; †: Compared to 4 vs. 4, p < 0.05; #: Compared to 5 vs. 5, p < 0.05.
Effects of modifying game rules
The results provided in Table 5 present the distinctions among the four SSG models. In the 7 vs. 4 model, TD, Vmax, HSR, VHSR, SR, and PL showed the minimum values (F = 47.93–243.55, p < 0.001, ηp2 = 0.17–0.52). On the contrary, players performed the best (F = 52.76–88.23, p < 0.001, ηp2 = 0.19–0.28) in terms of both distance covered and times during acceleration and deceleration in this model. Maximum velocity, HSR and VSHR represented the biggest workload (F = 99.12–243.55, p < 0.05, ηp2 = 0.22–0.52) than the other three SSG models during JT, while players in the TRL model had the lowest (F = 10.08, p < 0.05, ηp2 = 0.04) RHIE. In the TC model, the player’s workload covered maximum TD and PL. Besides, differences (p < 0.05, ES = 1.3) in PL were observed between 7 vs. 4 and TRL models, as well as RHIE (p < 0.05, ES = 0.42) in the forwards and not in the backs. No significant differences were observed between TRL, TC, and JT models for acceleration and deceleration-related metrics (Table 5).
Comparison between forwards and backs
In both the S-SSG and E-SSG models, the workload of the backs consistently remained higher (Table 4, p < 0.01) than that of the forwards, with the exception of TD. Meanwhile, as for the SSG models with four different rules, forwards had lower values (p < 0.01, ES = 0.17–0.54) compared to backs, except for TD in the 7 vs. 4, TC, and JT models and PL across all models. Also, the SR metric did not exhibit a significant difference (Table 5, p = 0.15, ES = 0.13) between forwards and backs in the 7 vs. 4 model.
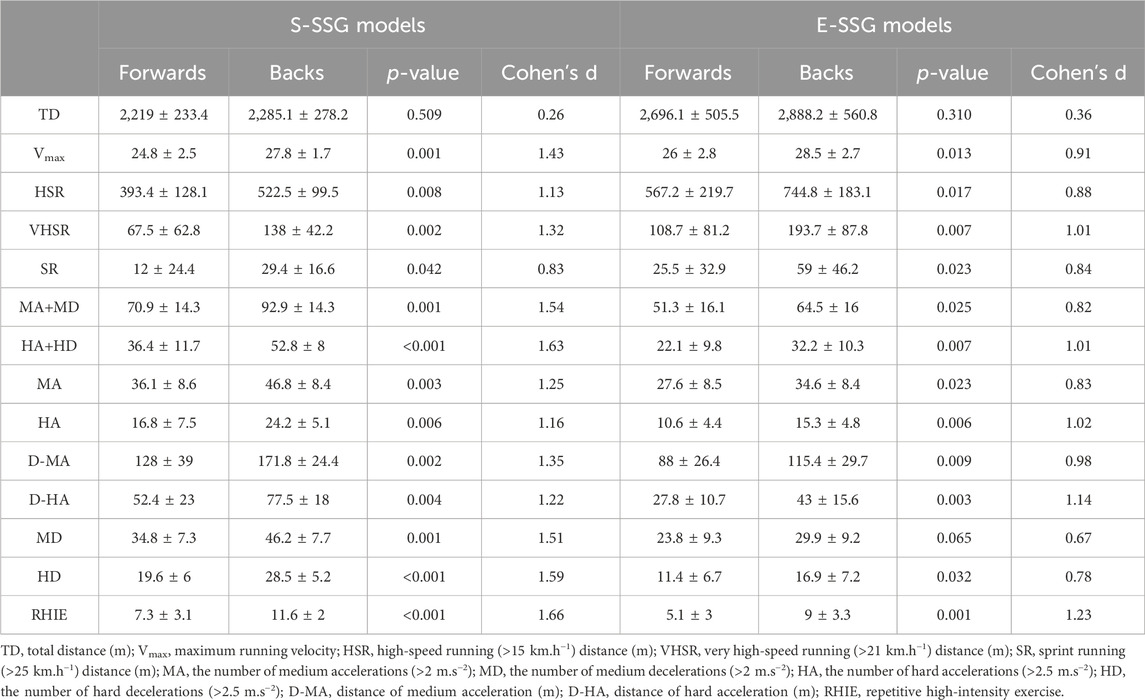
TABLE 4. Comparison between forwards and backs workload (mean ± SD) in S-SSG and E-SSG models.
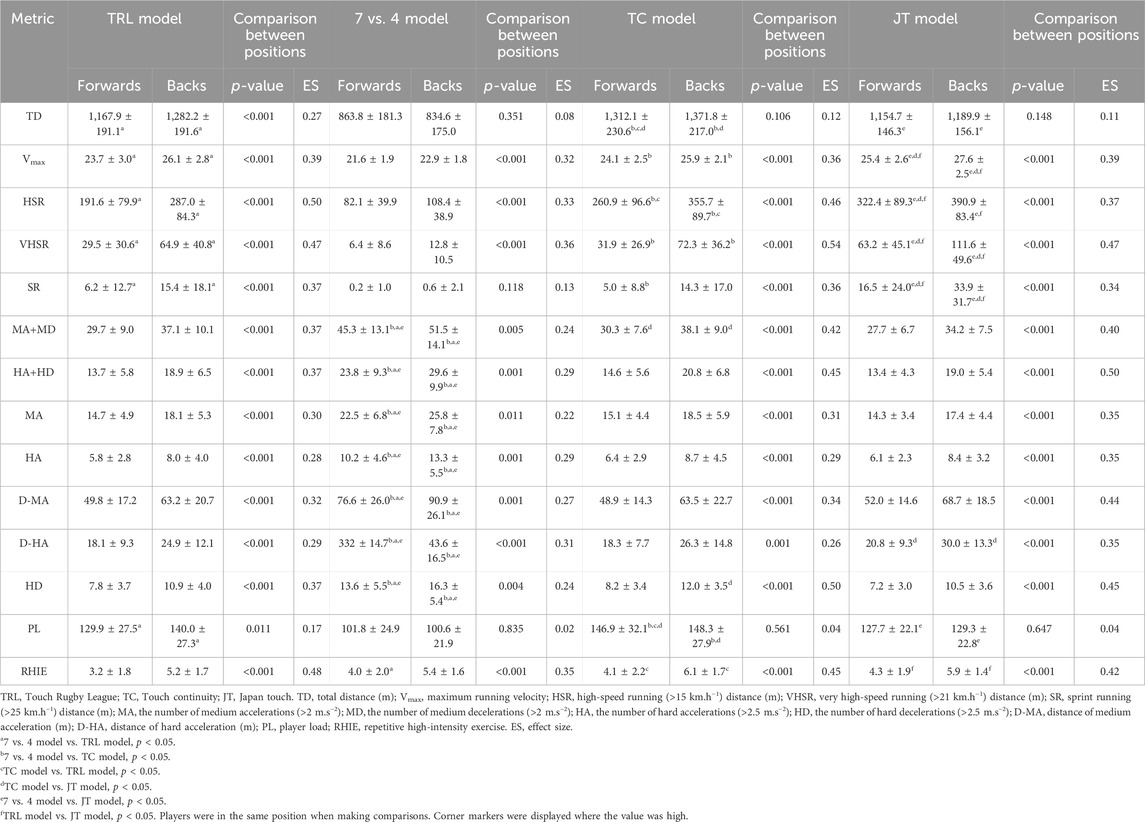
TABLE 5. Descriptive statistics (mean ± standard deviation) for the workload characteristics for SSG models with four rules.
Comparison between SSGs and OGs
In terms of OGs demand profiles, players had a relative distance (m.min−1) of 121.47 ± 22.08, a relative PL (PL.min−1) of 14.42 ± 2.71, and a relative RHIE (RHIE.min−1) of 0.54 ± 0.24. The relative workload of TD in S-SSG and E-SSG models exceeded the OGs requirements (Figures 4A, B, p < 0.001, ES = 1.45 and 1.44). However, E-SSGs did not cover the workload of OGs in RHIE.min−1 metrics (Figure 4C, p < 0.001, ES = 1.13). Besides, the 7 vs. 7 and 8 vs. 8 SSG models did not fulfill the RHIE.min−1 requirements of OGs (Figure 4D, p < 0.05, ES = 0.18 and 0.51).
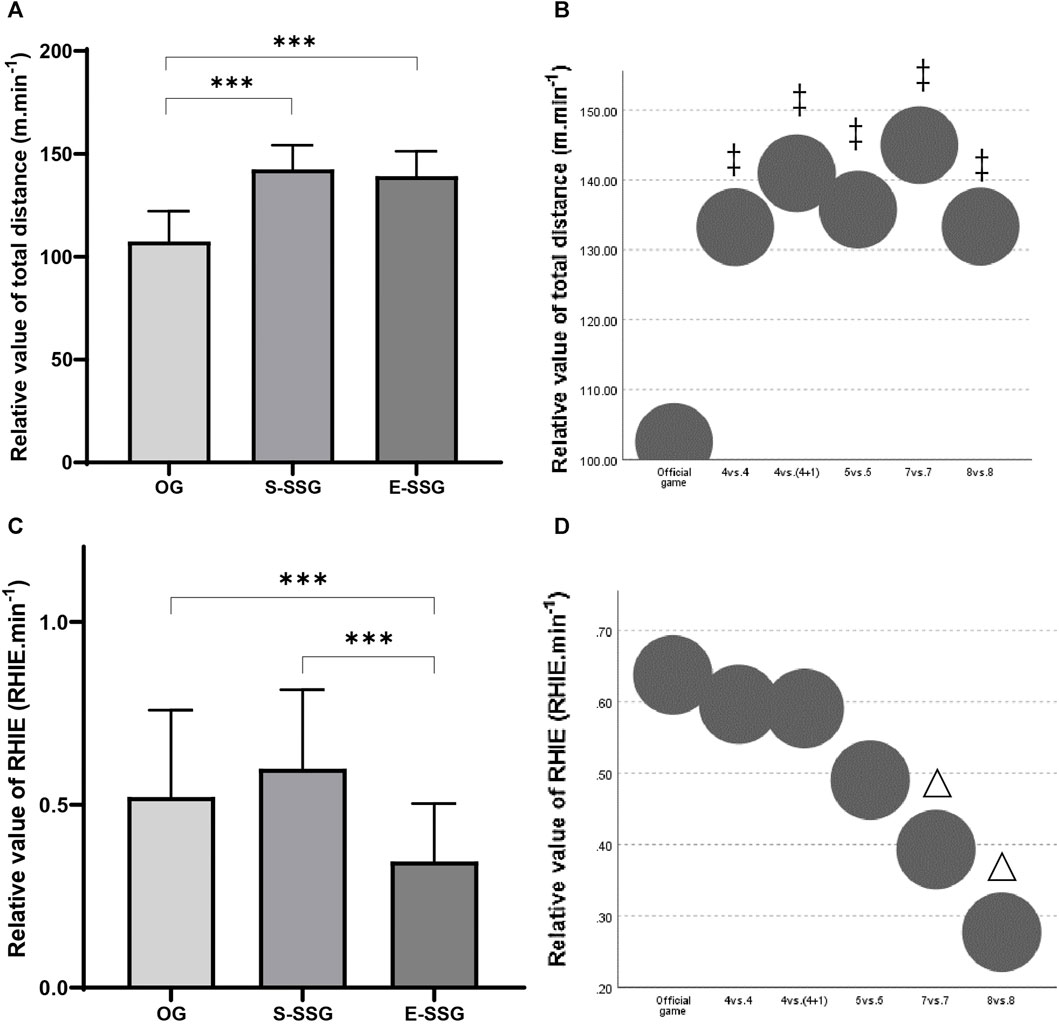
FIGURE 4. Comparison of relative performance metrics between SSG models and OGs. (A) Comparison of TD relative values (m.min−1) for S-SSG models, E-SSG models, and OGs. (B) Comparison of TD relative values (m.min−1) for different player numbers in SSG models and OGs. (C) Comparison of RHIE relative values (RHIE.min−1) for S-SSG, E-SSG, and OGs. (D) Comparison of RHIE relative values (RHIE.min−1) for different player numbers in SSG models and OGs. S-SSG, small-sided game played on strength training day; E-SSG, small-sided game performed on endurance training day; OG, official game. ‡: Compared to OG, p < 0.001; △: Compared to OG, p < 0.05.
As for SSGs with different rules, overall, the relative workload of TC was the highest. Common to all SSG models, m.min−1 for forwards and backs were all more required than OGs (Figures 5A, B, p < 0.05, ηp2 = 0.57). Only the forwards in the 7 vs. 4 model had a lower PL.min−1 than the OG (Figure 5C, p < 0.05, ES = 0.03), the rest of the models met the game requirements in backs (Figure 5D, p < 0.05, ηp2 = 0.14). For both forwards and backs, OG had a higher RHIE.min−1 requirement than the JT model (Figures 5E, F, p < 0.05, ES = 0.29), and that value of backs was also lower than OG in the TRL model (Figure 5F, p < 0.05, ES = 0.06).
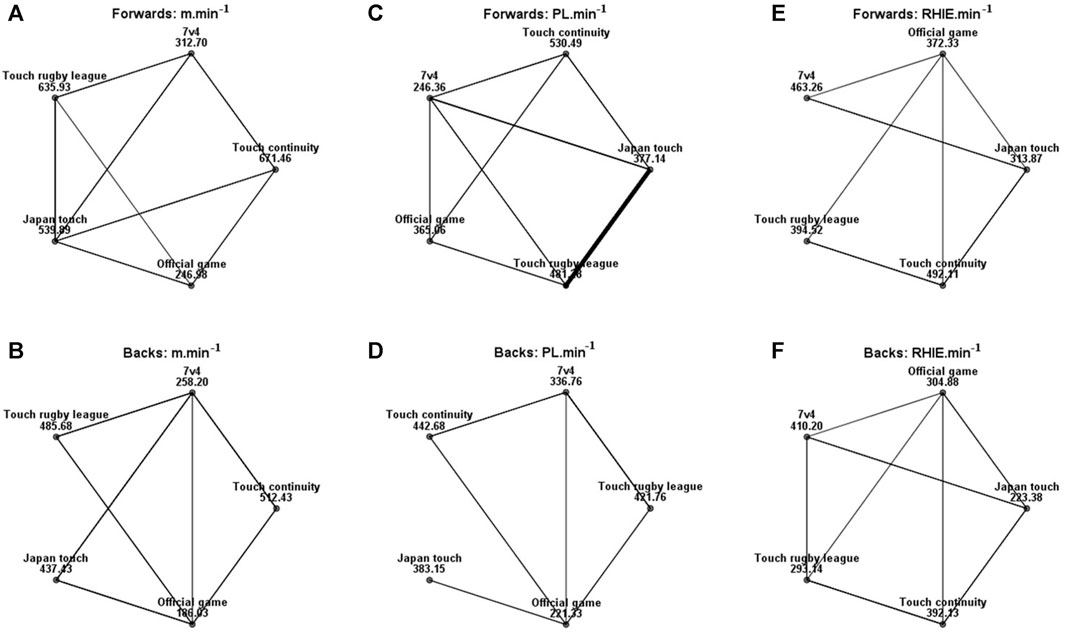
FIGURE 5. Pairwise comparison for forwards and backs in (A, B) m.min−1, (C, D) PL.min−1, and (E, F) RHIE.min−1 about SSGs and OGs analyzed. Each node showed the sample average rank of SSGs and OGs. The black line represented significant differences among groups (p < 0.05). m.min−1: relative value of total distance, PL.min−1: relative value of player load, RHIE.min−1: relative value of repetitive high-intensity exercise.
Discussion
This study conducted a comprehensive workload analysis of different SSG models and their effects on male professional RU players whilst taking playing positions in consideration. Specifically, the research examined SSG workload with different numbers of players and pitch sizes on strength and endurance training days. It also investigated the differences in workload between SSGs using four different rules. In addition, the study checked whether all SSGs complied with OG requirements. The primary findings of this study provide evidence that running-related metrics of SSGs were higher on endurance days, whereas mechanical workload was higher on strength training days. When comparing the effect of different numbers of players on SSGs, the TD of the players was greatest in the 7 vs. 7 S-SSG model. Furthermore, SSG models with four rules show that forwards usually have lower workload values than backs with respect to position. Among these SSG models, acceleration and deceleration related metrics were highest in the 7 vs. 4 model. The Vmax, HSR, VSHR, and RHIE were all observed with JT model. Players had the highest TD and PL during TC model. Moreover, the relative TD of both S-SSG and E-SSG models, as well as the SSGs set by four rules, fully meet or significantly exceeded the OGs requirements, thereby confirming our initial working hypothesis.
Data variabilities
One of the objectives of this study throughout the data evaluation process was to investigate the repeatability of the data due to the limited sample size of the data from S-SSG and E-SSG models. TD and mechanical metrics had low variability, suggesting that coaches can confidently establish similar distance and acceleration-deceleration training programs for SSGs. However, the reproducibility of running performance cannot be guaranteed. Given this, coaches must be aware that high- and very high-speed running should be suitably formed in dedicated or specialized training sessions, or that conditions need to be modified to make these metrics replicable (Clemente et al., 2019). For instance, when comparing players within similar positional groups, the significant variability issue should be taken into consideration. We encourage future research to further refine the categorization of players within the forward and back positions (e.g., “front row,” “inside backs,” etc.) in training interventions (Quarrie et al., 2013; McLaren et al., 2016).
Comparison between forwards and backs
There has always been a difference in the workload of forwards and backs (Cahill et al., 2013), so the data should be processed in accordance with the characteristics of each position. Typically, when conducting rugby training or games, backs are subject to higher external workload than forwards (McLellan et al., 2011; Hu et al., 2023). The same tendency was observed in this study. This is due to the fact that players in different positions were required to comply with the characteristics of the game in daily training. Backs spend more time performing strenuous running activities, acceleration and deceleration movements because of the nature of their role which requires them to cover longer distances to reach their opponents. Additionally, they must sprint while carrying out additional duties like kick chases and returns. These factors inevitably lengthen their running distance (King et al., 2009). Forwards should prioritize training acceleration due to the comparatively shorter average distance covered in high-intensity running reported for this positional group (Austin and Kelly, 2013).
Effects of modifying pitch size and player numbers
Manipulating the number of players and the pitch sizes in SSGs affects the skills and performance of RU players (Fleay et al., 2018; Zanin et al., 2021). Foster et al. (2010) compared the effects of 4 vs. 4 and 6 vs. 6 and three pitch sizes (15 × 25 m, 20 × 30 m, and 25 × 30 m) on the HR responses of rugby league players. Their findings revealed that a suitable method for raising SSG intensity was to reduce the number of players while maintaining the same pitch size. Research by Kennett et al. (2012b) also supported this, claiming that the time-motion demands were higher in smaller SSG models (4 vs. 4). In our study, the workload of players during 7 vs. 7 was greater than during 8 vs. 8 when pitch size was set at 2,500 m2. Our study also showed that a combination of 4 vs. 4 and 660 m2 had most demands in accelerations and decelerations, hence the findings were consistent. However, among elite youth junior rugby league players, pitch size had no effect on their physical demands (Dudley et al., 2023). Moreover, Hill-Haas et al. (2010) demonstrated that adding a floater (3 vs. 3 + 1 floater) during SSGs could offer a training stimulus that was more favorable to aerobic adaptation. However, the presence of a floater in the 4 vs. 4 model did not play a positive role in this study. When programming SSGs to address different training objectives, these findings may have practical implications. For instance, on endurance training days, specifying larger pitch dimensions or a greater number of players (7 vs. 7, 2500 m2, 178.57 m2 per player) can maximize distance and high-speed running training. Conversely, on speed training days, prescribing smaller pitch dimensions or fewer players (4 vs. 4, 660 m2, 82.5 m2 per player) can achieve optimal acceleration training. Therefore, these recommendations can assist coaches in adjusting SSGs more purposefully to meet various training needs (Tee et al., 2018).
Effects of modifying game rules
An interesting result of this study is that the 7 vs. 4 model resulted in the highest workload on the players during medium-to-hard-acceleration movements because of the smallest pitch size used. This increased workload can be attributed to the players’ necessity to change direction quickly and perform acceleration and deceleration movements over shorter distances. From a practical standpoint, it informs the implementation of SSGs designed to expose players to the strength demands such as explosiveness, agility and acceleration of games (Baker and Newton, 2008). Besides, players can obtain more HSR training by practicing the JT model. TRL model with its primary focus on aerobic training, was designed to be more moderate in workload. As a result, given its avoidance of extreme high-intensity training, it was often used at the beginning of the training week to avoid excessive workload and aligns more closely with the demands of RU. The objective of the TC model was to enhance stamina and power capabilities through a combination of aerobic and speed training; hence its intensity was likewise quite modest. Consequently, SSGs can be chosen or altered based on the training objective.
Comparison between SSGs and OGs
Another objective of this study was to use several relative metrics to compare the movement patterns of SSGs and OGs in RU, indicating that SSGs can partly meet game expectations. Similar studies have been reported in other team sports. For instance, field hockey has shown that acceleration counts were higher in SSGs than in games when normalized to 70 min of game time (Gabbett, 2010). Moreover, all SSG models (5 min; 2 vs. 2, 3 vs. 3, and 4 vs. 4; on pitches of 30 × 20, 35 × 25, and 40 × 30 m) in field hockey had higher mean acceleration, deceleration, and change-of-direction events than the maximum average over a 5-min period of game. However, the average speed was significantly lower during SSG models (Duthie et al., 2022). In football research, only 4 vs. 4 SSG showed the same PL and accelerations as OGs, whose values were obtained by calculating the rolling average over a 5-minute period and selecting the highest ones (Dalen et al., 2021). Additionally, Casamichana et al. (2012) found that VHSR and all RHIE variable metrics were observed to be higher in friendly games compared to SSGs. By contrast, only SSGs exhibited higher values compared to friendly games in VHSR and RHIE/min. In this study, when the SSG models did not satisfy the OGs, it was mainly due to differences in model functionality. For example, the TRL model was primarily used to recover or restart training due to the lower workload it encompasses. The differences in these results are limited by the different sports and metrics, necessitating additional research on RU (e.g., development and modification of SSG models., integrating video analysis or physiological indicators into research).
Limitations
There have been a few limitations to this study. Considering the training demands of players’ actual preparation for matches, we did not conduct a controlled experiment. When designing the protocol, we considered controlling the number of players to change the pitch size, as well as controlling the pitch size to change the number of players, but then this experimental design would be very long and take a lot of time. This would not be supported as it would put a lot of extra burden on the professional players (the same situation for pre-post performance tests on the S-SSG models). In addition, most of the SSGs research in rugby is controlling the pitch size to change the number of players or controlling the number of players to change the pitch size (Halouani et al., 2014). This study could be a new attempt at the format of SSGs for the purpose of using SSGs on strength training days and endurance training days. In our study, no improvement in performance was found after training, and also extremely significant differences between SSGs and OGs warrants consideration of overtraining (Gómez-Carmona et al., 2018), implying that future studies should take this into account. Furthermore, due to the training schedules and testing feasibility for professional players, we had no chance of obtaining internal workload data (such as sRPE, blood lactate, and HR values). Moreover, since forwards tend to have heavier physical tasks as they engage in mauls, rucks, and scrums (Duthie et al., 2003b), only the high-intensity work of backs can be reflected in the GPS data, we should have assessed metrics that are more reflective of the workload on the forwards (such as sRPE and sprint momentum). Finally, considering all of the players were from the same team, it is uncertain whether the results can be extrapolated to other teams and other playing levels.
Conclusion
This study served as a practical reference for coaches to develop training regimens for SSGs and provided evidence to quantify the differences in workload between SSGs and OGs for male professional RU players. SSGs usually showed higher requirements in external workload metrics and can therefore cover the workload of games. In the context of consistent training strategies, coaches can optimize different SSGs to meet physical and game goals. To guarantee that players will receive adequate stimulation for training, it is also necessary to maintain a suitable number of players, maintain the proper size of the field, and select appropriate rules according to the characteristics of the position. Further studies utilizing the methods described here are warranted due to the interest in this topic for rugby training.
Data availability statement
The raw data supporting the conclusion of this article will be made available by the authors, without undue reservation.
Ethics statement
Ethical approval was not required for the studies involving humans because The data for this study were collected through regular monitoring by the players, eliminating the need for permission from the ethics committee (Winter and Maughan, 2009). We conducted the study in accordance with the Helsinki Declaration and adhered to your journal’s ethical guidelines. The studies were conducted in accordance with the local legislation and institutional requirements. The participants provided their written informed consent to participate in this study.
Author contributions
XR: Formal Analysis, Methodology, Visualization, Writing–original draft, Writing–review and editing. MH: Data curation, Methodology, Writing–review and editing. SB: Methodology, Resources, Writing–review and editing. KP: Validation, Writing–review and editing. MD: Data curation, Methodology, Software, Writing–review and editing. SD: Supervision, Writing–review and editing. JP: Supervision, Writing–original draft, Writing–review and editing.
Funding
The author(s) declare that no financial support was received for the research, authorship, and/or publication of this article.
Acknowledgments
The authors would like to acknowledge the coaching staff and the players for their collaboration in this study.
Conflict of interest
The authors declare that the research was conducted in the absence of any commercial or financial relationships that could be construed as a potential conflict of interest.
Publisher’s note
All claims expressed in this article are solely those of the authors and do not necessarily represent those of their affiliated organizations, or those of the publisher, the editors and the reviewers. Any product that may be evaluated in this article, or claim that may be made by its manufacturer, is not guaranteed or endorsed by the publisher.
References
Akenhead R., French D., Thompson K. G., Hayes P. R. (2014). The acceleration dependent validity and reliability of 10Hz GPS. J. Sci. Med. Sport 17 (5), 562–566. doi:10.1016/j.jsams.2013.08.005
Atlı H., Köklü Y., Alemdaroğlu U., Koçak F. (2013). A comparison of heart rate response and frequencies of technical actions between half-court and full-court 3-a-side games in high school female basketball players. J. Strength Cond. Res. 27 (2), 352–356. doi:10.1519/JSC.0b013e3182542674
Austin D. J., Kelly S. J. (2013). Positional differences in professional rugby league match play through the use of global positioning systems. J. Strength & Cond. Res. 27 (1), 14–19. doi:10.1519/JSC.0b013e31824e108c
Baker D. G., Newton R. U. (2008). Comparison of lower body strength, power, acceleration, speed, agility, and sprint momentum to describe and compare playing rank among professional rugby league players. J. Strength Cond. Res. 22 (1), 153–158. doi:10.1519/JSC.0b013e31815f9519
Bourdon P. C., Cardinale M., Murray A., Gastin P., Kellmann M., Varley M. C., et al. (2017). Monitoring athlete training loads: consensus statement. Int. J. sports physiology Perform. 12 (2), S2161–170. doi:10.1123/IJSPP.2017-0208
Cahill N., Lamb K., Worsfold P., Headey R., Murray S. (2013). The movement characteristics of English Premiership rugby union players. J. Sports Sci. 31 (3), 229–237. doi:10.1080/02640414.2012.727456
Casamichana D., Castellano J., Castagna C. (2012). Comparing the physical demands of friendly matches and small-sided games in semiprofessional soccer players. J. Strength & Cond. Res. 26 (3), 837–843. doi:10.1519/JSC.0b013e31822a61cf
Castellano J., Casamichana D., Dellal A. (2013). Influence of game format and number of players on heart rate responses and physical demands in small-sided soccer games. J. Strength & Cond. Res. 27 (5), 1295–1303. doi:10.1519/JSC.0b013e318267a5d1
Chiwaridzo M., Oorschot S., Dambi J. M., Ferguson G. D., Bonney E., Mudawarima T., et al. (2017). A systematic review investigating measurement properties of physiological tests in rugby. BMC Sports Sci. Med. Rehabilitation 9 (1), 24. doi:10.1186/s13102-017-0081-1
Clavel P., Leduc C., Morin J.-B., Owen C., Samozino P., Peeters A., et al. (2022). Concurrent validity and reliability of sprinting force–velocity profile assessed with gps devices in elite athletes. Int. J. Sports Physiology Perform. 17 (10), 1527–1531. doi:10.1123/ijspp.2021-0339
Clemente F. M. (2020). The threats of small-sided soccer games: a discussion about their differences with the match external load demands and their variability levels. Strength & Cond. J. 42 (3), 100–105. doi:10.1519/ssc.0000000000000526
Clemente F. M., Rabbani A., Kargarfard M., Nikolaidis P. T., Rosemann T., Knechtle B. (2019). Session-to-session variations of external load measures of youth soccer players in medium-sided games. Int. J. Environ. Res. Public Health 16 (19), 3612. doi:10.3390/ijerph16193612
Cohen J. (1992). Quantitative methods in psychology: a power primer. Psychol. Bull. 112, 1155–1159. doi:10.1037//0033-2909.112.1.155
Comfort P., Bullock N., Pearson S. J. (2012). A comparison of maximal squat strength and 5-10-and 20-meter sprint times, in athletes and recreationally trained men. J. Strength & Cond. Res. 26 (4), 937–940. doi:10.1519/JSC.0b013e31822e5889
Crang Z. L., Duthie G., Cole M. H., Weakley J., Hewitt A., Johnston R. D. (2022). The inter-device reliability of global navigation satellite systems during team sport movement across multiple days. J. Sci. Med. Sport 25 (4), 340–344. doi:10.1016/j.jsams.2021.11.044
Dalen T., Sandmæl S., Stevens T. G. A., Hjelde G. H., Kjøsnes T. N., Wisløff U. (2021). Differences in acceleration and high-intensity activities between small-sided games and peak periods of official matches in elite soccer players. J. Strength & Cond. Res. 35 (7), 2018–2024. doi:10.1519/jsc.0000000000003081
Dalton-Barron N., Whitehead S., Roe G., Cummins C., Beggs C., Jones B. (2020). Time to embrace the complexity when analysing GPS data? A systematic review of contextual factors on match running in rugby league. J. Sports Sci. 38 (10), 1161–1180. doi:10.1080/02640414.2020.1745446
Darrall-Jones J. D., Jones B., Till K. (2015). Anthropometric and physical profiles of English academy rugby union players. J. Strength & Cond. Res. 29 (8), 2086–2096. doi:10.1519/JSC.0000000000000872
Davids K., Araújo D., Correia V., Vilar L. (2013). How small-sided and conditioned games enhance acquisition of movement and decision-making skills. Exerc Sport Sci. Rev. 41 (3), 154–161. doi:10.1097/JES.0b013e318292f3ec
Dellal A., Chamari K., Pintus A., Girard O., Cotte T., Keller D. (2008). Heart rate responses during small-sided games and short intermittent running training in elite soccer players: a comparative study. J. Strength Cond. Res. 22 (5), 1449–1457. doi:10.1519/JSC.0b013e31817398c6
Dellal A., Hill-Haas S., Lago-Penas C., Chamari K. (2011a). Small-sided games in soccer: amateur vs. professional players' physiological responses, physical, and technical activities. J. Strength & Cond. Res. 25 (9), 2371–2381. doi:10.1519/JSC.0b013e3181fb4296
Dellal A., Jannault R., Lopez-Segovia M., Pialoux V. (2011b). Influence of the numbers of players in the heart rate responses of youth soccer players within 2 vs. 2, 3 vs. 3 and 4 vs. 4 small-sided games. J. Hum. Kinet. 28, 107–114. doi:10.2478/v10078-011-0027-8
Dubois R., Paillard T., Lyons M., McGrath D., Maurelli O., Prioux J. (2017). Running and metabolic demands of elite rugby union assessed using traditional, metabolic power, and heart rate monitoring methods. J. Sports Sci. Med. 16 (1), 84–92.
Dudley C., Johnston R., Jones B., Hacking T., McCafferty R., Weakley J. (2023). An investigation into the variability of rugby union small-sided game demands and the effect of pitch size and player number manipulation. Int. J. Sports Sci. Coach. 2023, 17479541231220288. doi:10.1177/17479541231220288
Duthie G., Pyne D., Hooper S. (2003a). Applied physiology and game analysis of rugby union. Sports Med. 33 (13), 973–991. doi:10.2165/00007256-200333130-00003
Duthie G., Pyne D., Hooper S. (2003b). Applied physiology and game analysis of rugby union. Sports Med. 33, 973–991. doi:10.2165/00007256-200333130-00003
Duthie G. M., Thomas E. J., Bahnisch J., Thornton H. R., Ball K. (2022). Using small-sided games in field hockey: can they be used to reach match intensity? J. Strength Cond. Res. 36 (2), 498–502. doi:10.1519/JSC.0000000000003445
Fleay B., Joyce C., Banyard H., Woods C. T. (2018). Manipulating field dimensions during small-sided games impacts the technical and physical profiles of australian footballers. J. Strength & Cond. Res. 32 (7), 2039–2044. doi:10.1519/JSC.0000000000002423
Foster C. D., Twist C., Lamb K. L., Nicholas C. W. (2010). Heart rate responses to small-sided games among elite junior rugby league players. J. Strength Cond. Res. 24 (4), 906–911. doi:10.1519/JSC.0b013e3181aeb11a
Gabbett T., Jenkins D., Abernethy B. (2009). Game-based training for improving skill and physical fitness in team sport athletes. Int. J. Sports Sci. Coach. 4 (2), 273–283. doi:10.1260/174795409788549553
Gabbett T., Kelly J., Pezet T. (2007). Relationship between physical fitness and playing ability in rugby league players. J. Strength Cond. Res. 21 (4), 1126–1133. doi:10.1519/r-20936.1
Gabbett T. J. (2006). Skill-based conditioning games as an alternative to traditional conditioning for rugby league players. J. Strength Cond. Res. 20 (2), 309–315. doi:10.1519/r-17655.1
Gabbett T. J. (2010). GPS analysis of elite women's field hockey training and competition. J. Strength Cond. Res. 24 (5), 1321–1324. doi:10.1519/JSC.0b013e3181ceebbb
Gabbett T. J. (2012). Sprinting patterns of national rugby league competition. J. Strength Cond. Res. 26 (1), 121–130. doi:10.1519/JSC.0b013e31821e4c60
Gabbett T. J. (2013). Influence of the opposing team on the physical demands of elite rugby league match play. J. Strength & Cond. Res. 27 (6), 1629–1635. doi:10.1519/JSC.0b013e318274f30e
Gabbett T. J. (2015). Relationship between accelerometer load, collisions, and repeated high-intensity effort activity in Rugby League players. J. Strength & Cond. Res. 29 (12), 3424–3431. doi:10.1519/jsc.0000000000001017
Gabbett T. J., Gahan C. W. (2016). Repeated high-intensity-effort activity in relation to tries scored and conceded during rugby league match play. Int. J. sports physiology Perform. 11 (4), 530–534. doi:10.1123/ijspp.2015-0266
Gabbett T. J., Jenkins D. G., Abernethy B. (2012). Physical demands of professional rugby league training and competition using microtechnology. J. Sci. Med. Sport 15 (1), 80–86. doi:10.1016/j.jsams.2011.07.004
Gabbett T. J., Kelly J. N., Sheppard J. M. (2008). Speed, change of direction speed, and reactive agility of Rugby League players. J. Strength & Cond. Res. 22 (1), 174–181. doi:10.1519/JSC.0b013e31815ef700
Gabbett T. J., Stein J. G., Kemp J. G., Lorenzen C. (2013). Relationship between tests of physical qualities and physical match performance in elite rugby league players. J. Strength & Cond. Res. 27 (6), 1539–1545. doi:10.1519/JSC.0b013e318274f236
Gamble P. (2004). A skill-based conditioning games approach to metabolic conditioning for elite rugby football players. J. strength Cond. Res./ Natl. Strength & Cond. Assoc. 18, 491–497. doi:10.1519/1533-4287(2004)18<491:ASCGAT>2.0.CO;2
Gómez-Carmona C. D., Gamonales J. M., Pino-Ortega J., Ibáñez S. J. (2018). Comparative analysis of load profile between small-sided games and official matches in youth soccer players. Sports (Basel) 6 (4), 173. doi:10.3390/sports6040173
Halouani J., Chtourou H., Gabbett T., Chaouachi A., Chamari K. (2014). Small-sided games in team sports training: a brief review. J. Strength & Cond. Res. 28 (12), 3594–3618. doi:10.1519/JSC.0000000000000564
Hill-Haas S. V., Coutts A. J., Dawson B. T., Rowsell G. J. (2010). Time-motion characteristics and physiological responses of small-sided games in elite youth players: the influence of player number and rule changes. J. Strength Cond. Res. 24 (8), 2149–2156. doi:10.1519/JSC.0b013e3181af5265
Hollville E., Couturier A., Guilhem G., Rabita G. (2021). A novel accelerometry-based metric to improve estimation of whole-body mechanical load. Sensors 21 (10), 3398. doi:10.3390/s21103398
Houy N. (2020). Optimizing training programs for athletic performance: a Monte-Carlo Tree Search variant method. medRxiv. Availavle at: https://doi.org/10.1101/2020.10.31.20223768.
Hu X., Boisbluche S., Philippe K., Maurelli O., Li S., Xu B., et al. (2023). Effects of tactical periodization on workload, physical fitness, and well-being in professional Rugby Union players during a preseason period. J. Strength & Cond. Res. 38, 105–115. doi:10.1519/jsc.0000000000004607
Impellizzeri F. M., Marcora S. M., Coutts A. J. (2019). Internal and external training load: 15 years on. Int. J. Sports Physiol. Perform. 14 (2), 270–273. doi:10.1123/ijspp.2018-0935
Impellizzeri F. M., Shrier I., McLaren S. J., Coutts A. J., McCall A., Slattery K., et al. (2023). Understanding training load as exposure and dose. Sports Med. 53 (9), 1667–1679. doi:10.1007/s40279-023-01833-0
Johnston R. D., Gabbett T. J. (2011). Repeated-sprint and effort ability in rugby league players. J. Strength Cond. Res. 25 (10), 2789–2795. doi:10.1519/JSC.0b013e31820f5023
Kempton T., Sirotic A. C., Coutts A. J. (2014). Between match variation in professional rugby league competition. J. Sci. Med. Sport 17 (4), 404–407. doi:10.1016/j.jsams.2013.05.006
Kempton T., Sirotic A. C., Coutts A. J. (2017). A comparison of physical and technical performance profiles between successful and less-successful professional Rugby League teams. Int. J. Sports Physiology Perform. 12 (4), 520–526. doi:10.1123/ijspp.2016-0003
Kennett D. C., Kempton T., Coutts A. J. (2012a). Factors affecting exercise intensity in rugby-specific small-sided games. J. Strength Cond. Res. 26 (8), 2037–2042. doi:10.1519/JSC.0b013e31823a3b26
Kennett D. C., Kempton T., Coutts A. J. (2012b). Factors affecting exercise intensity in rugby-specific small-sided games. J. Strength & Cond. Res. 26 (8), 2037–2042. doi:10.1519/JSC.0b013e31823a3b26
King T., Jenkins D., Gabbett T. (2009). A time-motion analysis of professional rugby league match-play. J. Sports Sci. 27 (3), 213–219. doi:10.1080/02640410802538168
McLaren S. J., Weston M., Smith A., Cramb R., Portas M. D. (2016). Variability of physical performance and player match loads in professional rugby union. J. Sci. Med. Sport 19 (6), 493–497. doi:10.1016/j.jsams.2015.05.010
McLellan C. P., Lovell D. I., Gass G. C. (2011). Performance analysis of elite Rugby League match play using global positioning systems. J. Strength & Cond. Res. 25 (6), 1703–1710. doi:10.1519/JSC.0b013e3181ddf678
Meir R., Arthur D., Forrest M. (1993). Time and motion analysis of professional rugby league: a case study. Strength Cond. Coach 1, 24–29. doi:10.1080/02640410802538168
Owen A. L., Wong D. P., Paul D., Dellal A. (2012). Effects of a periodized small-sided game training intervention on physical performance in elite professional soccer. J. Strength & Cond. Res. 26 (10), 2748–2754. doi:10.1519/JSC.0b013e318242d2d1
Perneger T. V. (1998). What's wrong with Bonferroni adjustments. Bmj 316 (7139), 1236–1238. doi:10.1136/bmj.316.7139.1236
Quarrie K. L., Hopkins W. G., Anthony M. J., Gill N. D. (2013). Positional demands of international rugby union: evaluation of player actions and movements. J. Sci. Med. Sport 16 (4), 353–359. doi:10.1016/j.jsams.2012.08.005
Roe G., Halkier M., Beggs C., Till K., Jones B. (2016). The use of accelerometers to quantify collisions and running demands of rugby union match-play. Int. J. Perform. Analysis Sport 16 (2), 590–601. doi:10.1080/24748668.2016.11868911
Sarmento H., Clemente F. M., Harper L. D., Costa I. T. d., Owen A., Figueiredo A. J. (2018). Small sided games in soccer–a systematic review. Int. J. Perform. analysis sport 18 (5), 693–749. doi:10.1080/24748668.2018.1517288
Sheehan A., Malone S., Walters A., Gabbett T., Collins K. (2022). Match-play profile of elite rugby union, with special reference to repeated high-intensity effort activity (RHIE). Sport Sci. Health 18 (3), 947–956. doi:10.1007/s11332-021-00879-9
Tee J. C., Ashford M., Piggott D. (2018). A tactical periodization approach for rugby union. Strength & Cond. J. 40 (5), 1–13. doi:10.1519/ssc.0000000000000390
Teixeira J. E., Forte P., Ferraz R., Leal M., Ribeiro J., Silva A. J., et al. (2021). Monitoring accumulated training and match load in football: a systematic review. Int. J. Environ. Res. Public Health 18 (8), 3906. doi:10.3390/ijerph18083906
Vachon A., Berryman N., Mujika I., Paquet J.-B., Bosquet L. (2022). Preconditioning activities to enhance repeated high-intensity efforts in elite rugby union players. Int. J. Sports Physiology Perform. 17 (6), 871–878. doi:10.1123/ijspp.2021-0270
Vanrenterghem J., Nedergaard N. J., Robinson M. A., Drust B. (2017). Training load monitoring in team sports: a novel framework separating physiological and biomechanical load-adaptation pathways. Sports Med. 47, 2135–2142. doi:10.1007/s40279-017-0714-2
Varley M. C., Fairweather I. H., Aughey R. J. (2012). Validity and reliability of GPS for measuring instantaneous velocity during acceleration, deceleration, and constant motion. J. Sports Sci. 30 (2), 121–127. doi:10.1080/02640414.2011.627941
Waldron M., Twist C., Highton J., Worsfold P., Daniels M. (2011). Movement and physiological match demands of elite rugby league using portable global positioning systems. J. Sports Sci. 29 (11), 1223–1230. doi:10.1080/02640414.2011.587445
Wallace L. K., Slattery K. M., Coutts A. J. (2009). The ecological validity and application of the session-RPE method for quantifying training loads in swimming. J. Strength & Cond. Res. 23 (1), 33–38. doi:10.1519/JSC.0b013e3181874512
West S. W., Williams S., Kemp S. P. T., Cross M. J., Stokes K. A. (2019). Athlete monitoring in rugby union: is heterogeneity in data capture holding us back? Sports 7 (5), 98. doi:10.3390/sports7050098
Zabaloy S., Pareja Blanco F., Carlos-Vivas J., Gálvez González J. (2021). Determinant factors of physical performance in rugby specific playing positions. Sci. Sports 36 (4), 308.e1–308.e10. doi:10.1016/j.scispo.2020.06.011
Keywords: constraints-led approach, external load, global positioning system, team sports, intermittent exercise
Citation: Ren X, Henry M, Boisbluche S, Philippe K, Demy M, Ding S and Prioux J (2024) Optimization of training for professional rugby union players: investigating the impact of different small-sided games models on GPS-derived performance metrics. Front. Physiol. 15:1339137. doi: 10.3389/fphys.2024.1339137
Received: 15 November 2023; Accepted: 26 January 2024;
Published: 12 February 2024.
Edited by:
Vincenzo Bonaiuto, University of Rome Tor Vergata, ItalyReviewed by:
Alexandre Dellal, Consultant, Lyon, FranceJosé Eduardo Teixeira, Polytechnic Institute of Bragança (IPB), Portugal
Jasper Verheul, Cardiff Metropolitan University, United Kingdom
Copyright © 2024 Ren, Henry, Boisbluche, Philippe, Demy, Ding and Prioux. This is an open-access article distributed under the terms of the Creative Commons Attribution License (CC BY). The use, distribution or reproduction in other forums is permitted, provided the original author(s) and the copyright owner(s) are credited and that the original publication in this journal is cited, in accordance with accepted academic practice. No use, distribution or reproduction is permitted which does not comply with these terms.
*Correspondence: Xiangyu Ren, eGlhbmd5dS5yZW5AZW5zLXJlbm5lcy5mcg==