 Daoliang Zhang1
 Yang De Marinis
 Zhi-Ping Liu
 Rui Gao
- 1School of Control Science and Engineering, Shandong University, Jinan, China
- 2Department of Rehabilitation Medicine, Affiliated Hospital of Jining Medical University, Jining, China
- 3Department of Clinical Sciences, Lund University, Malmö, Sweden
Background: Stroke is one of the major chronic non-communicable diseases (NCDs) with high morbidity, disability and mortality. The key to preventing stroke lies in controlling risk factors. However, screening risk factors and quantifying stroke risk levels remain challenging.
Methods: A novel prediction model for stroke risk based on two-level feature selection and deep fusion network (SRPNet) is proposed to solve the problem mentioned above. First, the two-level feature selection method is used to screen comprehensive features related to stroke risk, enabling accurate identification of significant risk factors while eliminating redundant information. Next, the deep fusion network integrating Transformer and fully connected neural network (FCN) is utilized to establish the risk prediction model SRPNet for stroke patients.
Results: We evaluate the performance of the SRPNet using screening data from the China Stroke Data Center (CSDC), and further validate its effectiveness with census data on stroke collected in affiliated hospital of Jining Medical University. The experimental results demonstrate that the SRPNet model selects features closely related to stroke and achieves superior risk prediction performance over benchmark methods.
Conclusions: SRPNet can rapidly identify high-quality stroke risk factors, improve the accuracy of stroke prediction, and provide a powerful tool for clinical diagnosis.
1 Introduction
Stroke is a global public health issue, ranking as the second leading cause of death and the third leading cause of disability worldwide (Owolabi et al., 2022). Moreover, the incidence of stroke is increasing in recent years, and the burden of stroke poses a huge challenge to low- and middle-income countries (Owolabi et al., 2021). However, the complexity, suddenness, and significant differences in clinical manifestations of stroke have brought great difficulties to treatment. It is widely acknowledged that stroke is preventable and controllable (Johnson et al., 2019). Therefore, active intervention on risk factors of stroke and accurate prediction of stroke risk through early screening can assist doctors and patients in implementing appropriate preventive and therapeutic measures, significantly reducing the harm caused by stroke.
So far, some studies employed traditional medical statistical methods to predict stroke risk (Wang et al., 2022; Abraham et al., 2021). These methods typically relied on a series of risk factors to construct mathematical models for calculating risk scores. However, these methods were time-consuming and labor-intensive, and ignored the complex nonlinear relationships and interactions among features, resulting in limited prediction performances (Obermeyer and Emanuel, 2016). With the rapid development of artificial intelligence, machine learning methods provide new solutions for stroke risk prediction. The machine learning methods can process complex screening data, and reveal patterns and associations hidden within large-scale data, thereby enhancing the accuracy of stroke risk prediction.
A better understanding of risk factors is critical for stroke diagnostic evaluation and treatment decision. In fact, controlling the risk factors (such as hypertension and diabetes) can reduce the risk of stroke. Qi et al. (2020) used multi-variable Cox regression analysis to obtain the features associated with the occurrence of stroke and its subtypes in China by introducing socioeconomic and other related factors. Abraham et al. (2019) employed elastic-net logistic regression to screen for genetic risk factors of stroke. Hunter and Kelleher (2023) used data from NHLBI Biologic Specimen and cardiac studies as risk factors, and studied the effect of age on stroke risk factors through a logistic regression algorithm. Maalouf et al. (2023) developed the regression model to find that negative emotions could increase stroke risk. Generally, stroke is a complex disease, and it is difficult to predict stroke risk via a single feature. However, having too many types of features may lead to redundant information and increase diagnostic costs. Furthermore, different risk factors contribute differently to stroke occurrence. More importantly, considering the association relationship among features is expected to be beneficial for the early stroke screening. Therefore, there is an urgent need to develop effective feature selection methods for predicting stroke risk.
Currently, numerous studies have been devoted to stroke risk prediction using machine learning techniques. For example, Li et al. (2019b) applied the Bayesian network model to estimate the incidence of stroke, revealing the relationship between combinations of multiple risk factors and stroke. Nwosu et al. (2019) analyzed the electronic health records of patients using neural networks, decision trees, and random forests to determine the impact of risk factors on stroke prediction. Arafa et al. (2022) developed a stroke risk prediction method for urban Japanese based on the Cox proportional hazards model, incorporating cardiovascular risk factors. Dritsas and Trigka (2022) designed an ensemble learning method for long-term stroke risk prediction. Liu et al. (2019) first adopted the random forest regression algorithm to impute missing data, and then used the deep neural network (DNN) to predict stroke on imbalanced physiological data. Although the above methods achieved promising results, the model structures they employed are relatively disconnected between features and algorithms, and the generalization ability of these models needs to be improved.
Here we propose a novel prediction model based on two-level feature selection and deep fusion network, termed SRPNet, for inferring stroke risk. In particular, two-level feature selection can comprehensively search for significant features related to stroke risk. We first apply multiple methods including Pearson correlation, chi-square test, Lasso and elastic net to select risk factors respectively, and combine the obtained risk factors as a candidate feature set. We then traverse all candidate risk factor combinations in the feature set by seven machine learning methods, such as support vector machine (SVM), k-nearest neighbor (KNN), decision tree (DT), gradient boosting decision tree (GBDT), random forest (RF), Gaussian Naive Bayes (GaussianNB) and AdaBoost, to identify the most important features associated with stroke. This enables evaluating the correlations between features and eliminating redundant information, providing reliable risk factors for stroke screening program. Next, the proposed deep fusion network integrates Transformer (Vaswani et al., 2017) and fully connected neural network (FCN) (Long et al., 2015) to establish a risk prediction model for stroke patients. This prediction model utilizes the attention mechanism of Transformer to explore hidden relationships among risk factors, and adopts FCN to better capture the nonlinear relationships among features. The experimental results indicate that SRPNet improves the accuracy and efficiency of stroke screening, and its performance is superior to existing benchmark methods. This work provides assistance for clinical diagnosis, and alleviates the burden of stroke.
2 Materials and methods
2.1 Datasets
The CSDC database covers 6 provinces, 41 hospitals and 12 population cohorts in China (Yu et al., 2016). The CSDC database facilitates stroke-related decision-making, research, and public health services through a comprehensive system. It collects and analyzes patient data, including risk factors, medical history, and sociodemographic information, ensuring that each subject has a unique record. A two-stage stratified cluster sampling method was employed during the data screening process (Li et al., 2019a). First, more than 200 screening areas were selected based on the local population size and the total number of counties. Then, urban communities and townships were used as the primary sampling units (PSUs) according to the geographical location and the recommendations from the local hospitals. In each PSU, all residents aged 40 and above were surveyed using cluster sampling during the initial screening period. Doctors assessed each patient’s condition, categorizing them as low risk, medium risk, high risk, transient ischemic attack (TIA), or stroke. The CSDC dataset comprises 862,244 middle-aged residents. Table 1 shows the detailed features of the CSDC dataset.
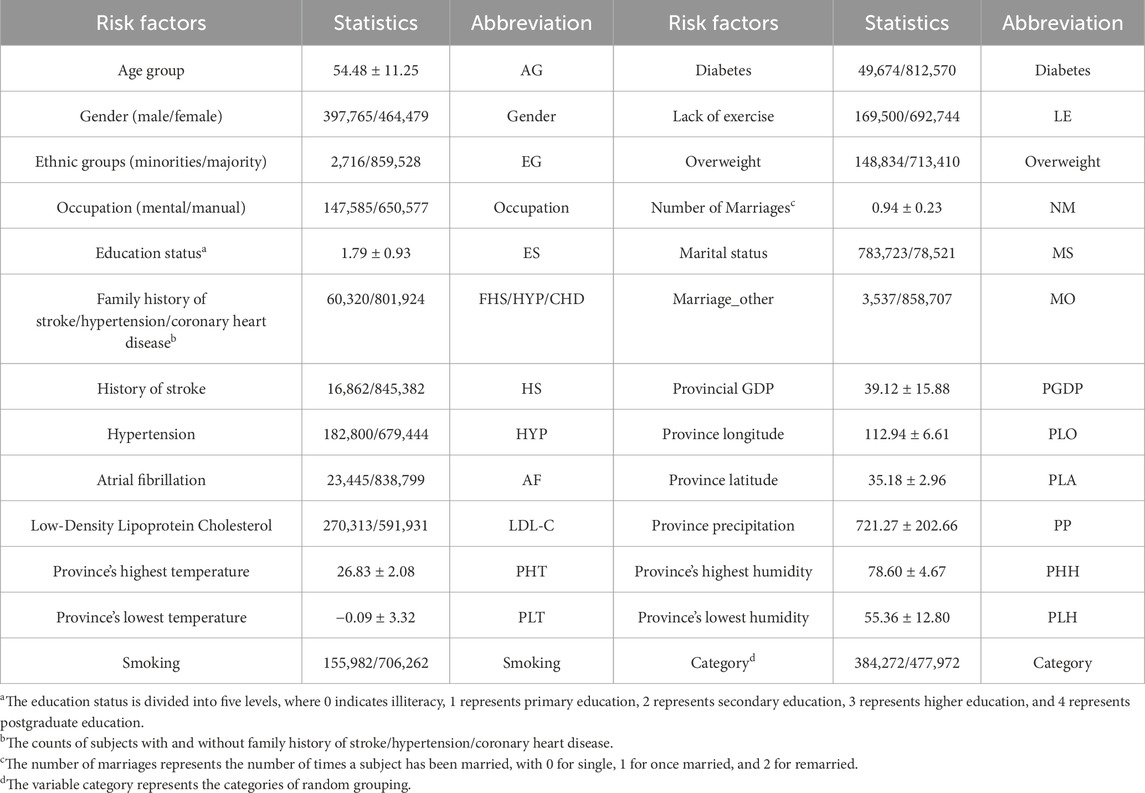
Table 1. Summary of specific features in the CSDC dataset.
The in-house data is sourced from the medical records of 49 patients at affiliated hospital of Jining Medical University in 2023. It includes 14 features such as gender, age group, ethnic groups, marital status, occupation, education level, hypertension, atrial fibrillation, smoking, hyperlipidemia, diabetes, overweight, and family history of stroke. Each patient has been diagnosed by a physician and classified as either having suffered a stroke or being in good health. The summary information for these two datasets is listed in Table 2.

Table 2. The detailed information of datasets.
2.2 Overview of SRPNet
The SRPNet model mainly consists of two modules: two-level feature selection, and deep fusion network. The overall framework is illustrated in Figure 1. Since the dataset contains text information, the SRPNet firstly performs data preprocessing, which involves digitizing the textual information and normalizing the data. To eliminate low-correlation and redundant features, the two-level feature selection method is employed to identify comprehensive features associated with stroke. Finally, the deep fusion network, which adaptively fuse Transformer and FCN by attention mechanism, takes the obtained significant features as input to provide accurate stroke risk prediction results for stroke patients.
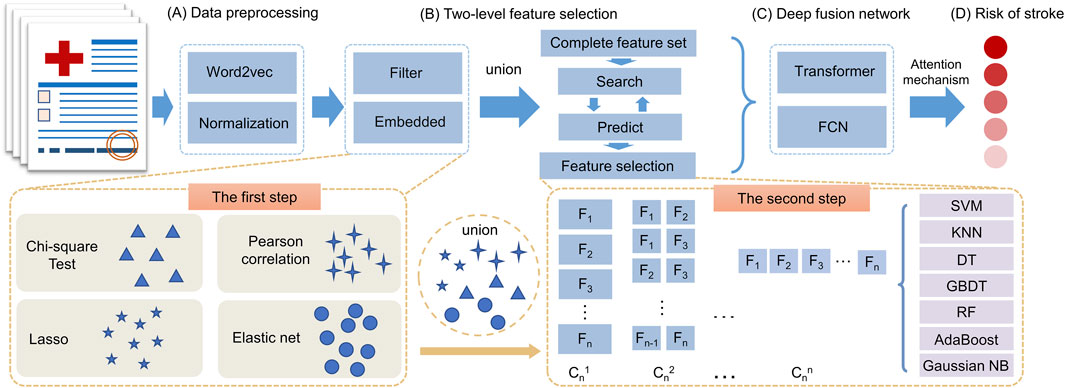
Figure 1. The entire framework of SRPNet. (A) Preprocess the input data. (B) Select significant features using the two-level feature selection. (C) Predict stroke risk based on the deep fusion network. (D) Output the stroke prediction results.
2.3 Data preprocessing
Based on the stroke risk researches (Tian et al., 2019; Guan et al., 2019), we used text information digitization to convert non-numeric features into numeric vectors suitable for machine learning or deep learning methods. Occupations are divided into mental workers and manual workers. For the marital status, we characterize it by whether the respondent is currently married and the number of marriage times. Based on the location information of the respondents, we convert it to the local climate, such as maximum temperature, minimum temperature, precipitation, humidity, etc. All of which are closely related to stroke. For the remaining features, we also use similar knowledge-based feature engineering for feature representation. Data normalization (Park et al., 2022) is used to scale data elements to the (0,1) interval, which helps improve the effectiveness and reliability of model training. The normalization formula is defined as follows Equation 1:
2.4 Two-level feature selection
In this section, the two-level feature selection method that contains two-step feature selection processes will be introduced. The first step of feature selection involves four distinct methods, which are Pearson correlation, chi-square test, Lasso, and elastic net. The union of selected features from each method forms a set of candidate features. In the second step, based on the seven machine learning models, such as SVM, KNN, GBDT, RF, DT, AdaBoost and GaussianNB, we evaluate all possible combinations of candidate features via grid search. Each combination is scored based on its performance in the given models. It allows us to determine the optimal combination of features that are most predictive of stroke risk.
The two-step approach provides a rigorous feature selection process by multiple machine learning methods. The first step reduces the number of features based on statistical tests of relevance. The second step further refines the features by evaluating prediction performance in representative machine learning models. This ensures that the most informative and generalizable features have been selected for predicting stroke risk.
2.4.1 The first step of feature selection
We employ four feature selection methods, including chi-square test, Pearson correlation, Lasso and elastic net, to assess the correlation between features and disease risk from different perspectives. The chi-square test and Pearson correlation prefer to filter out features, which have the advantage of high computational efficiency while not being prone to overfitting. However, their over-reliance on filter thresholds may overlook many important features. On the other hand, Lasso and elastic net are embedded feature selection methods that select salient features while accounting for feature correlations by calculating feature weights. Therefore, we combined the filter and embedded methods to comprehensively screen for the important features related to stroke risk factors. For details, we provide brief introductions to the chi-square test, Pearson correlation, Lasso, elastic net.
Chi-square test (Sharpe, 2015). The chi-square test is used to check the correlation of the independent variable with the dependent variable. We use the chi-square test to delete the features with small changes. The formula of chi-square test is described as Equation 2:
where
Pearson correlation (Cohen et al., 2009). We use Pearson correlation coefficient to measure the linear correlation between features and disease risk. When all the features have been scaled to (0,1), the most important feature should have the highest coefficient, and the irrelevant feature should have a coefficient whose value is close to zero. The Pearson correlation coefficient can be determined by Equation 3:
where
Lasso (Nusinovici et al., 2020). Lasso built upon logistic regression analysis techniques, serves to select the most crucial features while reducing model complexity through the shrinkage of feature weights. Specifically, lasso introduces
where
Elastic net (Zhang et al., 2017). Since Lasso regression sometimes performs poorly in inter-correlated features, the elastic net was proposed to overcome this limitation. Elastic net regularization combines
where
2.4.2 The second step of feature selection
Although we have selected the important risk factors at the first step feature selection, the filter and embedded methods have the shortcomings of excessive threshold reliance and simply correlation consideration. To capture the deep correlation between features, we use seven machine learning methods to conduct the second step feature selection, which traverse all candidate features combinations based on the result of first step feature selection.
The candidate feature combinations consist of all possible permutations of the features selected during the process of feature selection. Assume there are
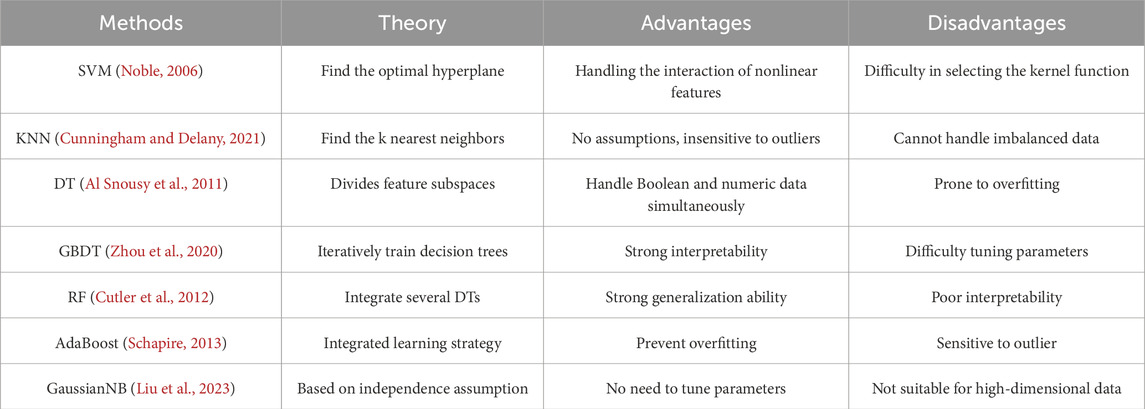
Table 3. The overview of seven machine learning methods.
2.5 Deep fusion network
The complexity and diversity of stroke data require predicting stroke risk from multiple perspectives to enhance model robustness. Common predictive models, such as the Transformer, exhibit complex structures and excel at adapting to high-dimensional data, thus improving prediction performance. However, it often suffers from overfitting issues when dealing with small-scale datasets. In contrast, the FCN model has a simple structure and fast training speed, yielding exceptional performance on small-scale datasets. We utilize the advantages of both above predictive models and propose a deep fusion network method that can provide accurate the stroke risk prediction. As shown in Figure 2, deep fusion network integrates the Transform and the FCN, in which the dependencies between stroke risk factors are captured by the attention mechanism of the Transformer, and the complex nonlinear relationship is fitted by deep network structure of the FCN.
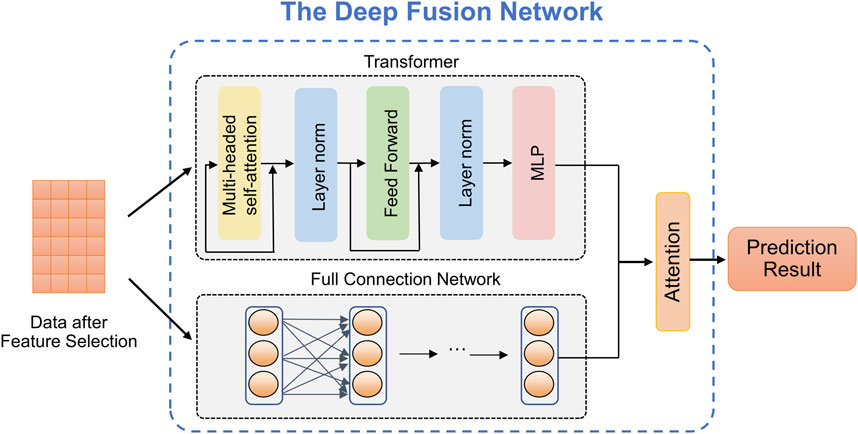
Figure 2. The structure of the proposed deep fusion network.
Transformer (Vaswani et al., 2017). Due to the powerful representation ability, Transformer can realize the outstanding performance in prediction tasks which is based on the self-attention mechanism. As observed in Figure 2, given an input
where
Fully connected neural network. The FCN, also known as a Multilayer Perceptron (MLP), is a widely used artificial neural network structure in medical data analysis. It offers the advantages of fast training speed and robust modeling capabilities as the network depth increases. The stroke risk prediction model we designed includes one input layer, one hidden layer and one output layer. The calculation formula of each layer of network is defined by Equation 7:
where
Attention mechanism. In the stroke risk prediction task, the Transformer and the FCN extract clinical features at different levels and make distinct contributions to the prediction. Therefore, we introduce an attention mechanism to adaptively learn the importance of latent embeddings. Specifically, for the feature
where
where
2.6 Evaluation metrics
Here we employ four evaluation metrics to assess the predictive performance of the model, including micro precision, micro F1-score, macro precision, and Cohen’s Kappa coefficient (Younas et al., 2023). The definitions of these metrics are given as follows.
The micro average approach amalgamates performance measures across all samples. Specifically, for each class
where TP represents the number of positive samples correctly predicted to be positive samples, FP represents the number of negative samples incorrectly predicted to be positive samples, FN represents the number of positive samples incorrectly predicted to be negative samples.
Micro average tends to provide misleading results in the case of imbalanced data, as it doesn’t take the predictive performance of each specific class into account. In contrast, macro average computes averages through the individual performance of each class. The macro precision is defined as Equation 12:
Cohen’s Kappa Coefficient is employed for assessing performance in situations of imbalanced class distribution, which is denoted by Equation 13:
where
2.7 Implementation details
The stroke risk prediction model was built and trained using the PyTorch. Experiments were conducted on a PC with Intel(R) Xeon(R) Gold 6258R CPU @ 2.70 GHz and NVIDIA QuADro GV100 GPU. We trained the model with the Adam optimizer (Kingma and Ba, 2014) with default parameters and a fixed learning rate of 0.001. And we randomly select 80% of the samples from whole dataset for training, and the remaining 20% for testing. The maximum number of epochs employed for training is 100. The datasets and source codes are publicly available on GitHub: https://github.com/zhangdaoliang/SRPNet.
3 Results and discussion
3.1 Two-level feature selection results
We utilized a dataset from the CSDC database, consisting of 862,244 samples, with each sample originally having 26 distinct features. The proposed two-level feature selection method was used to screen out significant stroke features, which has a positive effect on improving the performance of the prediction model. In the first step of feature selection, we employed Lasso, elastic net, chi-square test and Pearson correlation methods for the initial screening of stroke-related factors. Here, we consider using
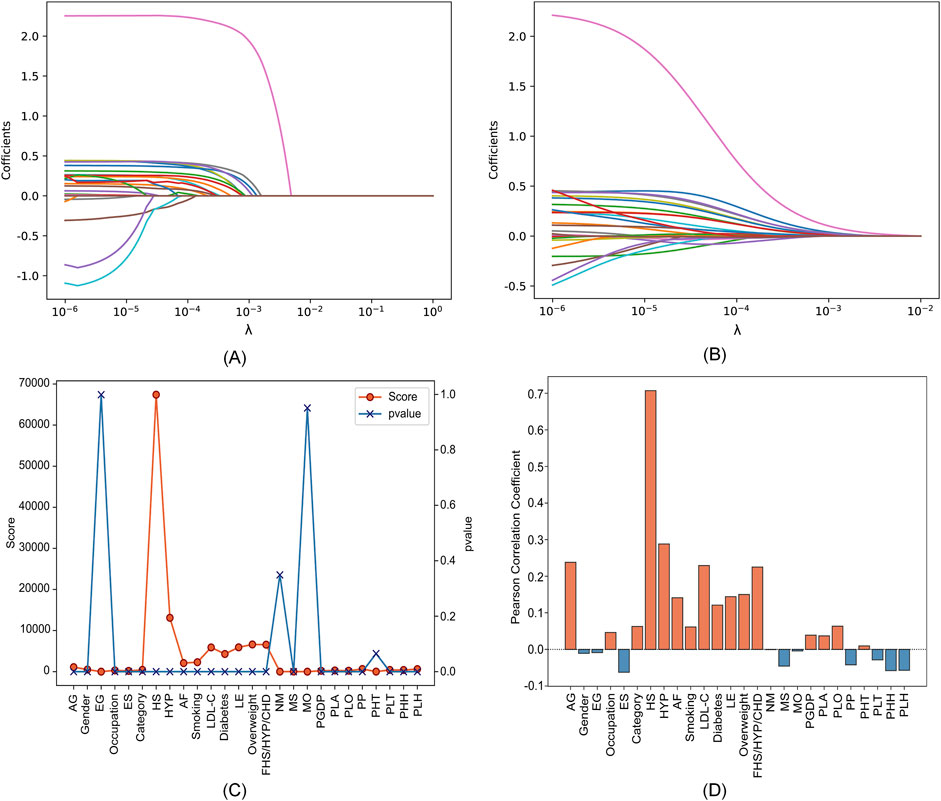
Figure 3. Feature selection results with different parameters in four feature selection methods. (A) Lasso. (B) Elastic net. (C) Chi-square test. (D) Pearson correlation.
The specific feature selection results of each method are shown in Table 4. Subsequently, we took the union of features selected by the four methods as the robust candidate feature set, which includes 16 features, i.e., AG, Gender, Smoking, MS, Occupation, ES, HS, HYP, AF, LDL-C, Diabetes, LE, Overweight, FHS/HYP/CHD, PLT, and PLH. The receiver operating characteristic (ROC) curves (Fan et al., 2006) corresponding to different feature sets are shown in Figure 4. We find that using the candidate feature set achieves better prediction results than features selected by individual methods. It illustrates that the first step of feature selection is of great significance for stroke risk diagnosis.

Table 4. Feature selection results of four methods.
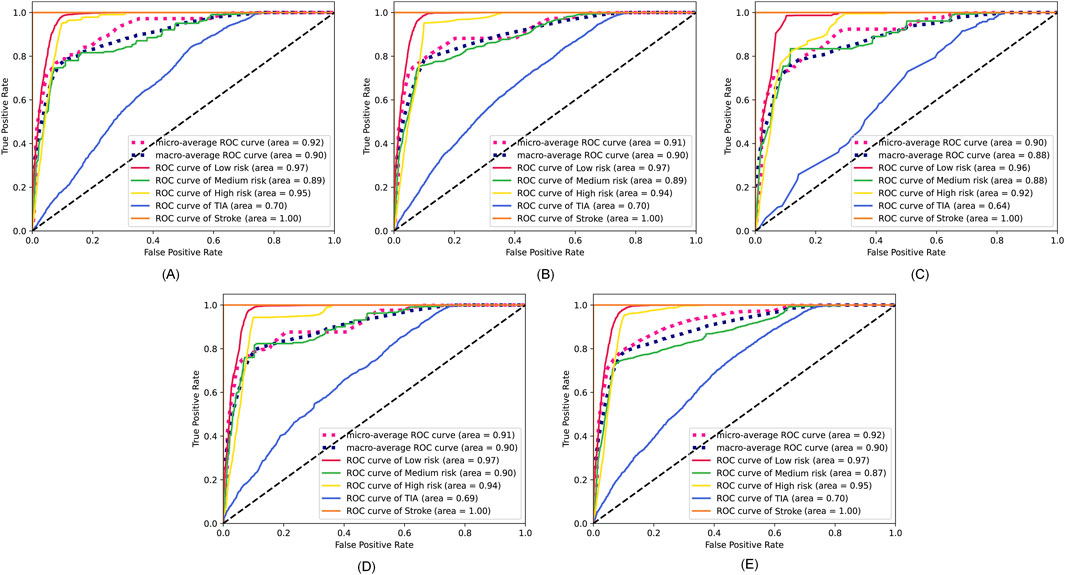
Figure 4. ROC curves corresponding to the feature sets selected by the four methods and the candidate feature set. (A) Lasso. (B) Elastic net. (C) Chi-square test. (D) Pearson correlation. (E) The robust candidate feature set.
In the second step of feature selection, we eliminate risk factors with strong correlation between features. Based on the results of the first step of feature selection, we iterate through all candidate feature combinations. All feature combinations are evaluated under different machine learning methods as classifiers. The optimal feature combinations for different number of features are determined with respect to the evaluation results. Figure 5 shows the performance of the method with different numbers of feature variables. We see that as the number of features increases, the micro precision of most machine learning methods gradually improves and tends to stabilize. However, the performance of the DT and AdaBoost methods decreases significantly when the number of features is 9 and 15 respectively. When the number of features reaches 12, all seven machine learning methods overall achieve the best performance. Finally, we obtained risk factors that are highly relevant to stroke patients and have no redundant information among features, including Smoking, Occupation, ES, HS, HYP, AF, LDL-C, Diabetes, LE, Overweight, FHS/HYP/CHD, and PLT. It is worth noting that traditional methods consider age and gender to be strongly correlated with stroke risk (Howard et al., 2023; Ospel et al., 2023). However, two-level feature selection has removed them due to their redundancy with occupation and other risk factors. In contrast, the PLT features reflecting the climate of the patient’s location are preserved, and it has been confirmed that low temperatures are associated with an increased risk of stroke (Chen et al., 2013). This indicates that SRPNet could provide new insights for future risk screening.
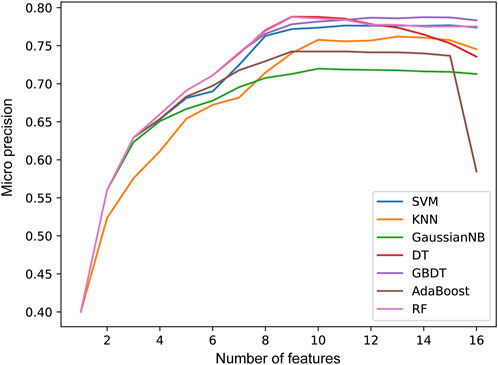
Figure 5. The prediction performance micro precision in seven machine learning methods with different number of features.
3.2 Stroke risk prediction results
In this section, we validate the effectiveness of the SRPNet model on the CSDC dataset. Decision tree C5.0 (C5.0) (Ahmadi et al., 2018), random forests (RF) (Breiman, 2001),FCN, one-dimensional convolutional neural network (CNN), long short-term memory network (LSTM) and Transformer are used as comparison methods to predict stroke risk. Table 5 shows the prediction performance of the seven methods on the original CSDC data (all features) and the data after two-level feature selection (selected features). We can find that SRPNet model obtains the best prediction results in terms of the four evaluation metrics. The performance of all predictors after two-level feature selection is significantly better than their performance when using all features. This demonstrates that the two-level feature selection can effectively filter weak and redundant information, thus improving the results of all predictors. On the selected feature data, SRPNet outperformes FCN and Transformer by approximately 1.4%, 1.4%, 12% and 3.2% on metrics micro F1-score, micro precision, macro precision, Cohen’s Kappa coefficient. This reflects that deep fusion network can better explore potential relationships between risk factors. In summary, the proposed SRPNet model is reasonable and effective for predicting stroke risk.

Table 5. Comparison of stroke risk prediction results for the seven methods.
Furthermore, to make the results more convincing, we evaluated six predictors on in-house data from affiliated hospital of Jining Medical University. The experimental results are recorded in Table 6. We can draw the similar conclusion that the proposed SRPNet model is an ideal and effective prediction tool of stroke risk. To explore the features that play a dominant role in precise classification, we removed each feature and obtained the prediction results for stroke risk. We found that after removing the hypertension (HYP) feature resulted in micro F1-score, micro precision, macro precision, and Cohen’s Kappa coefficient of 0.7, 0.7, 0.83, and 0.28 respectively, which had the greatest impact on stroke prediction performance. Secondly, gender and age also significantly influenced stroke classification, while they are identified as redundant features in the CSDC dataset. The reason is that the analysis conducted on the CSDC dataset involves complex stroke risk prediction, focusing on differences between multiple risk levels, whereas the in-house dataset only focuses on whether someone has a stroke, conducting a simple stroke prediction analysis. Understanding these risk factors can assist doctors in making quick and accurate stroke diagnoses.
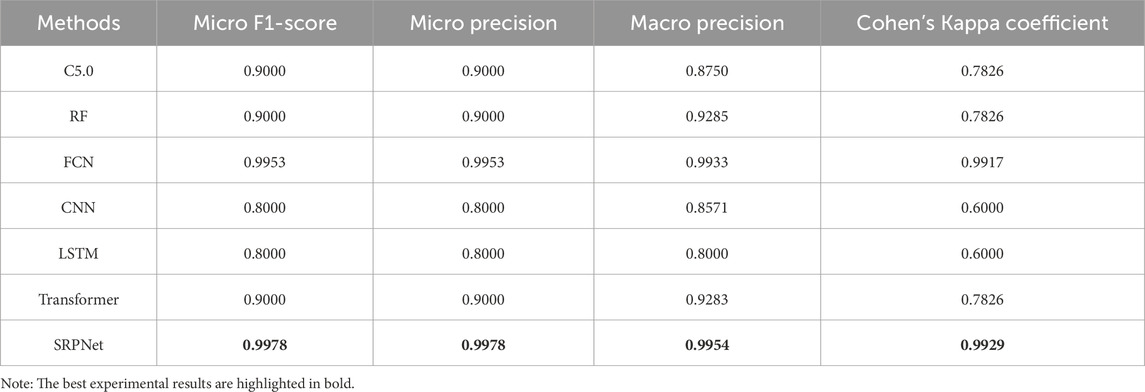
Table 6. Prediction results based on our in-house dataset.
To further evaluate the superiority of SRPNet, we visualize the confusion matrices obtained by the six methods on the CSDC dataset and the in-house dataset in Figures 6, 7, where the columns and rows are the predicted labels and true labels, respectively. It shows that compared to other methods, The SRPNet method wins in all categories in terms of prediction accuracy. Additionally, we discover that the history of stroke (HS) feature and the hypertension (HYP) feature significantly enhance the ability of almost all algorithms in Figure 6 to detect stroke effectively.
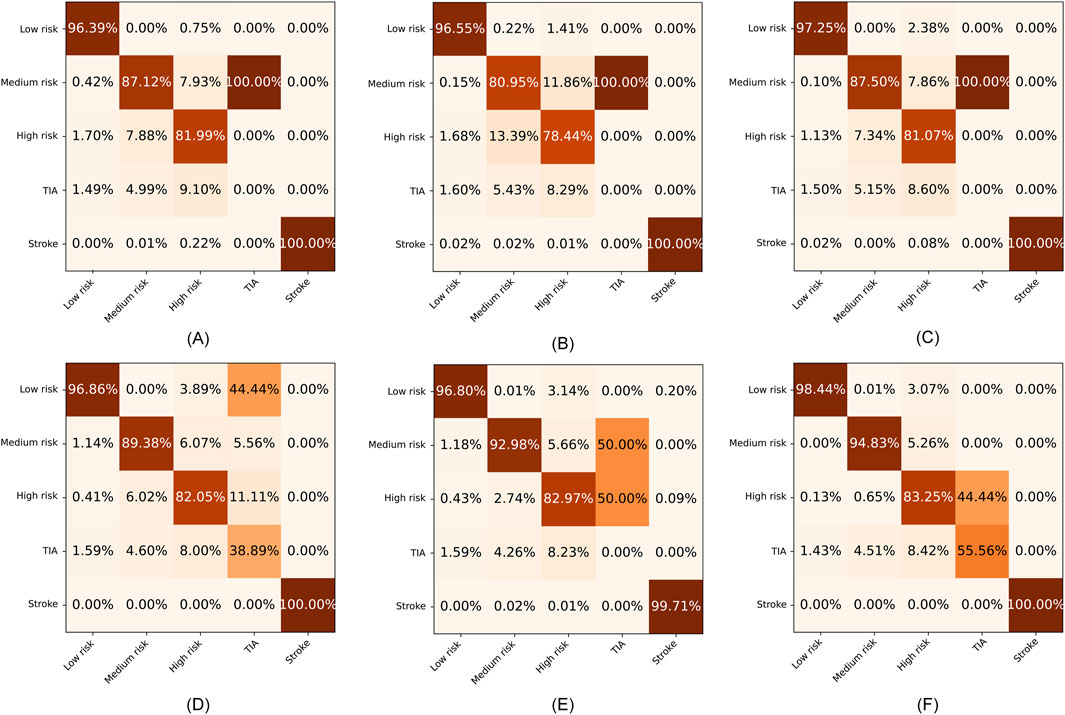
Figure 6. The confusion matrices for the six methods on the CSDC dataset. (A) C5.0. (B) FCN. (C) CNN. (D) LSTM. (E) Transformer. (F) SRPNet.
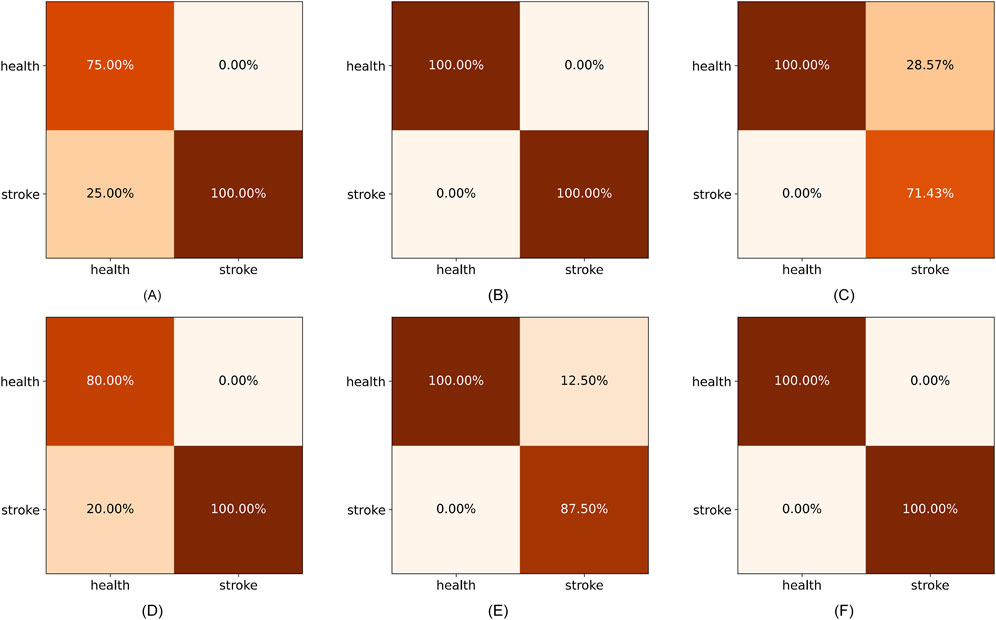
Figure 7. The confusion matrices for the six methods on the in-house dataset. (A) C5.0. (B) FCN. (C) CNN. (D) LSTM. (E) Transformer. (F) SRPNet.
4 Conclusion
In this paper, a novel prediction model based on two-level feature selection and deep fusion network is proposed for stroke risk prediction. Compared with traditional feature selection methods, the proposed two-level feature selection method not only focuses on the importance of individual these features, but also eliminates redundant information among important features. Furthermore, the proposed deep fusion network harnesses Transformer and fully connected networks to capture feature dependencies and model the non-linear relationships among features, respectively. Experimental results on the CSDC database and in-house dataset demonstrate that our proposed prediction model outperforms other representative methods. This prediction model can rapidly identify high-quality stroke risk factors and improve the accuracy of stroke prediction for patients, thereby effectively assisting doctors in formulating rational diagnosis and treatment plans.
The features included in the CSDC database and in-house dataset are limited. In the future, we will collect more clinical indicator features related to stroke for model training and testing. And we will also work on applying the proposed model to predict other diseases, demonstrating its generalizability. It's worth noting that researchers have the flexibility to substitute the feature selection method used in SRPNet with other methods that are frequently applied in the context of medical information, tailored to their specific requirements.
Data availability statement
The datasets presented in this study can be found in online repositories. The names of the repository/repositories and accession number(s) can be found below: https://github.com/zhangdaoliang/SRPNet.
Author contributions
DZ: Conceptualization, Data curation, Methodology, Software, Validation, Writing–original draft, Writing–review and editing. NY: Conceptualization, Investigation, Validation, Writing–review and editing. XY: Conceptualization, Data curation, Validation, Writing–review and editing. YD: Funding acquisition, Validation, Writing–review and editing. Z-PL: Conceptualization, Funding acquisition, Supervision, Validation, Writing–review and editing. RG: Conceptualization, Funding acquisition, Project administration, Supervision, Validation, Writing–review and editing.
Funding
The author(s) declare that financial support was received for the research, authorship, and/or publication of this article. This research was supported by the National Natural Science Foundation of China (NSFC) (Grant Nos U1806202, 62373216), the Fundamental Research Funds for the Central Universities (2022JC008), and the Program of Qilu Young Scholars of Shandong University.
Conflict of interest
The authors declare that the research was conducted in the absence of any commercial or financial relationships that could be construed as a potential conflict of interest.
The author(s) declared that they were an editorial board member of Frontiers, at the time of submission. This had no impact on the peer review process and the final decision.
Publisher’s note
All claims expressed in this article are solely those of the authors and do not necessarily represent those of their affiliated organizations, or those of the publisher, the editors and the reviewers. Any product that may be evaluated in this article, or claim that may be made by its manufacturer, is not guaranteed or endorsed by the publisher.
References
Abraham G., Malik R., Yonova-Doing E., Salim A., Wang T., Danesh J., et al. (2019). Genomic risk score offers predictive performance comparable to clinical risk factors for ischaemic stroke. Nat. Commun. 10, 5819. doi:10.1038/s41467-019-13848-1
Abraham G., Rutten-Jacobs L., Inouye M. (2021). Risk prediction using polygenic risk scores for prevention of stroke and other cardiovascular diseases. Stroke 52, 2983–2991. doi:10.1161/STROKEAHA.120.032619
Ahmadi E., Weckman G. R., Masel D. T. (2018). Decision making model to predict presence of coronary artery disease using neural network and C5. 0 decision tree. J. Ambient Intell. Humaniz. Comput. 9, 999–1011. doi:10.1007/s12652-017-0499-z
Al Snousy M. B., El-Deeb H. M., Badran K., Al Khlil I. A. (2011). Suite of decision tree-based classification algorithms on cancer gene expression data. Egypt. Inf. J. 12, 73–82. doi:10.1016/j.eij.2011.04.003
Arafa A., Kokubo Y., Sheerah H. A., Sakai Y., Watanabe E., Li J., et al. (2022). Developing a stroke risk prediction model using cardiovascular risk factors: the Suita Study. Cerebrovasc. Dis. 51, 323–330. doi:10.1159/000520100
Chen R., Wang C., Meng X., Chen H., Thach T. Q., Wong C.-M., et al. (2013). Both low and high temperature may increase the risk of stroke mortality. Neurology 81, 1064–1070. doi:10.1212/WNL.0b013e3182a4a43c
Cohen I., Huang Y., Chen J., Benesty J., Benesty J., Chen J., et al. (2009). Pearson correlation coefficient. Noise Reduct. speech Process., 1–4. doi:10.1007/978-3-642-00296-0_5
Cunningham P., Delany S. J. (2021). K-nearest neighbour classifiers-a tutorial. ACM Comput. Surv. (CSUR) 54, 1–25. doi:10.1145/3459665
Cutler A., Cutler D. R., Stevens J. R. (2012). Random forests. Editors C. Zhang, and Y. Q. Ma (Springer, New York: Ensemble Machine Learning), 157–175. doi:10.1007/978-1-4419-9326-7_5
Dritsas E., Trigka M. (2022). Stroke risk prediction with machine learning techniques. Sensors 22, 4670. doi:10.3390/s22134670
Fan J., Upadhye S., Worster A. (2006). Understanding receiver operating characteristic (ROC) curves. Can. J. Emerg. Med. 8, 19–20. doi:10.1017/s1481803500013336
Guan W., Clay S. J., Sloan G. J., Pretlow L. G. (2019). Effects of barometric pressure and temperature on acute ischemic stroke hospitalization in Augusta, GA. Transl. Stroke Res. 10, 259–264. doi:10.1007/s12975-018-0640-0
Howard G., Banach M., Kissela B., Cushman M., Muntner P., Judd S. E., et al. (2023). Age-related differences in the role of risk factors for ischemic stroke. Neurology 100, e1444-e1453. doi:10.1212/WNL.0000000000206837
Hunter E., Kelleher J. D. (2023). Determining the proportionality of ischemic stroke risk factors to age. J. Cardiovasc. Dev. Dis. 10, 42. doi:10.3390/jcdd10020042
Johnson C. O., Nguyen M., Roth G. A., Nichols E., Alam T., Abate D., et al. (2019). Global, regional, and national burden of stroke, 1990–2016: a systematic analysis for the Global Burden of Disease Study 2016. Lancet Neurology 18, 439–458. doi:10.1016/S1474-4422(19)30034-1
Kingma D. P., Ba J. (2014). Adam: a method for stochastic optimization. arXiv Prepr. arXiv:1412.6980.
Li X., Bian D., Yu J., Li M., Zhao D. (2019a). Using machine learning models to improve stroke risk level classification methods of China national stroke screening. BMC Med. Inf. Decis. Mak. 19, 261–267. doi:10.1186/s12911-019-0998-2
Li X., Pang J., Li M., Zhao D. (2019b). Discover high-risk factor combinations using Bayesian network from cohort data of National Stoke Screening in China. BMC Med. Inf. Decis. Mak. 19, 67–68. doi:10.1186/s12911-019-0753-8
Liu D., Lin Z., Jia C. (2023). NeuroCNN_GNB: an ensemble model to predict neuropeptides based on a convolution neural network and Gaussian naive Bayes. Front. Genet. 14, 1226905. doi:10.3389/fgene.2023.1226905
Liu T., Fan W., Wu C. (2019). A hybrid machine learning approach to cerebral stroke prediction based on imbalanced medical dataset. Artif. Intell. Med. 101, 101723. doi:10.1016/j.artmed.2019.101723
Long J., Shelhamer E., Darrell T. (2015). “Fully convolutional networks for semantic segmentation,” in Proceedings of the IEEE conference on computer vision and pattern recognition, 3431–3440.
Maalouf E., Hallit S., Salameh P., Hosseini H. (2023). Depression, anxiety, insomnia, stress, and the way of coping emotions as risk factors for ischemic stroke and their influence on stroke severity: a case–control study in Lebanon. Front. psychiatry 14, 1097873. doi:10.3389/fpsyt.2023.1097873
Mchugh M. L. (2012). Interrater reliability: the kappa statistic. Biochem. medica 22, 276–282. doi:10.11613/bm.2012.031
Noble W. S. (2006). What is a support vector machine? Nat. Biotechnol. 24, 1565–1567. doi:10.1038/nbt1206-1565
Nusinovici S., Tham Y. C., Yan M. Y. C., Ting D. S. W., Li J., Sabanayagam C., et al. (2020). Logistic regression was as good as machine learning for predicting major chronic diseases. J. Clin. Epidemiol. 122, 56–69. doi:10.1016/j.jclinepi.2020.03.002
Nwosu C. S., Dev S., Bhardwaj P., Veeravalli B., John D. (2019). “Predicting stroke from electronic health records,” in 2019 41st Annual International Conference of the IEEE Engineering in Medicine and Biology Society (EMBC) (IEEE), 5704–5707.
Obermeyer Z., Emanuel E. J. (2016). Predicting the future—big data, machine learning, and clinical medicine. N. Engl. J. Med. 375, 1216–1219. doi:10.1056/NEJMp1606181
Ospel J., Singh N., Ganesh A., Goyal M. J. J. O. S. (2023). Sex and gender differences in stroke and their practical implications in acute care. J. Stroke 25, 16–25. doi:10.5853/jos.2022.04077
Owolabi M. O., Thrift A. G., Mahal A., Ishida M., Martins S., Johnson W. D., et al. (2022). Primary stroke prevention worldwide: translating evidence into action. Lancet Public Health 7, e74–e85. doi:10.1016/S2468-2667(21)00230-9
Owolabi M. O., Thrift A. G., Martins S., Johnson W., Pandian J., Abd-Allah F., et al. (2021). The state of stroke services across the globe: report of world stroke organization–world health organization surveys. Int. J. Stroke 16, 889–901. doi:10.1177/17474930211019568
Pandis N. (2016). The chi-square test. Am. J. Of Orthod. And Dentofac. Orthop. 150, 898–899. doi:10.1016/j.ajodo.2016.08.009
Park H. W., Pitti T., Madhavan T., Jeon Y.-J., Manavalan B. (2022). MLACP 2.0: an updated machine learning tool for anticancer peptide prediction. Comput. Struct. Biotechnol. J. 20, 4473–4480. doi:10.1016/j.csbj.2022.07.043
Qi W., Ma J., Guan T., Zhao D., Abu-Hanna A., Schut M., et al. (2020). Risk factors for incident stroke and its subtypes in China: a prospective study. J. Am. Heart Assoc. 9, e016352. doi:10.1161/JAHA.120.016352
Schapire R. E. (2013). “Explaining adaboost,” in Empirical inference: festschrift in honor of vladimir N. Vapnik (Springer Berlin Heidelberg), 37–52.
Sharpe D. (2015). Chi-square test is statistically significant: now what? Pract. Assess. Res. Eval. 20, 8. doi:10.7275/tbfa-x148
Tian Y., Liu H., Si Y., Cao Y., Song J., Li M., et al. (2019). Association between temperature variability and daily hospital admissions for cause-specific cardiovascular disease in urban China: a national time-series study. PLoS Med. 16, e1002738. doi:10.1371/journal.pmed.1002738
Vaswani A., Shazeer N., Parmar N., Uszkoreit J., Jones L., Gomez A. N., et al. (2017). Attention is all you need. Adv. neural Inf. Process. Syst. 30.
Wang Q., Zhang L., Li Y., Tang X., Yao Y., Fang Q. (2022). Development of stroke predictive model in community-dwelling population: a longitudinal cohort study in Southeast China. Front. Aging Neurosci. 14, 1036215. doi:10.3389/fnagi.2022.1036215
Younas F., Usman M., Yan W. Q. (2023). A deep ensemble learning method for colorectal polyp classification with optimized network parameters. Appl. Intell. 53, 2410–2433. doi:10.1007/s10489-022-03689-9
Yu J., Mao H., Li M., Ye D., Zhao D. (2016). “CSDC—a nationwide screening platform for stroke control and prevention in China,” in 2016 38th Annual International Conference of the IEEE Engineering in Medicine and Biology Society (EMBC) (IEEE), 2974–2977.
Zhang Z., Lai Z., Xu Y., Shao L., Wu J., Xie G.-S. (2017). Discriminative elastic-net regularized linear regression. IEEE Trans. Image Process. 26, 1466–1481. doi:10.1109/TIP.2017.2651396
Keywords: stroke risk prediction, feature selection, deep fusion network, transformer, stroke risk factors
Citation: Zhang D, Yu N, Yang X, De Marinis Y, Liu Z-P and Gao R (2024) SRPNet: stroke risk prediction based on two-level feature selection and deep fusion network. Front. Physiol. 15:1357123. doi: 10.3389/fphys.2024.1357123
Received: 20 December 2023; Accepted: 23 October 2024;
Published: 11 November 2024.
Edited by:
Raimond L. Winslow, Northeastern University, United StatesCopyright © 2024 Zhang, Yu, Yang, De Marinis, Liu and Gao. This is an open-access article distributed under the terms of the Creative Commons Attribution License (CC BY). The use, distribution or reproduction in other forums is permitted, provided the original author(s) and the copyright owner(s) are credited and that the original publication in this journal is cited, in accordance with accepted academic practice. No use, distribution or reproduction is permitted which does not comply with these terms.
*Correspondence: Zhi-Ping Liu, enBsaXVAc2R1LmVkdS5jbg==; Rui Gao, Z2FvcnVpQHNkdS5lZHUuY24=