 Hui Yu
 Zhenyang Li
 Joseph Yimiletey
 Chunmei Wan
 Sandra Velleman
- Department of Animal Sciences, The Ohio State University, Columbus, OH, United States
Satellite cells (SCs) are myogenic stem cells responsible for post hatch muscle growth and the regeneration of muscle fibers. Satellite cells are not a homogenous population of cells within a muscle and have variable rates of proliferation and differentiation even within a single fiber type muscle like the turkey pectoralis major muscle. In this study, the single satellite cell clones derived from the same turkey pectoralis major muscle with different proliferation rates were compared. The clones were classified as either fast-growing (early clone) or slow-growing (late clone) SCs. To thoroughly examine the molecular differences between these two groups, RNA sequencing was conducted to compare their transcriptomes following 72 h of proliferation. Principal Component Analysis confirmed that the transcriptomic profiles of early- and late-clones are markedly distinct. Differential gene expression analysis identified over 5,300 genes that were significantly differentially expressed between the two groups of cells. Gene ontology analysis showed that genes highly expressed in early clones are responsible for the fundamental aspects of muscle biology, including muscle tissue development and structural maturation. Conversely, genes upregulated in late clones are involved in cell-cell communication, extracellular matrix interactions, signal ligand activity, and cytokine activity—key components for forming an extracellular niche essential for functional satellite cells maintenance. Further examination of specific gene ontology categories such as muscle structure development and extracellular matrix components indicated significant differences in gene expression patterns between early- and late-clones. These findings highlight the genetic and functional diversity of SCs in turkeys. The distinct roles of these satellite cell populations indicate that a balance between them is necessary for preserving the normal physiological functions of SCs.
1 Introduction
In food animal agriculture, it is crucial to identify mechanisms that can enhance the efficiency of muscle growth to meet human nutritional needs. In the United States, poultry is the most consumed type of meat, with consumption rates steadily increasing. Turkey meat, valued at approximately $6.57 billion, accounts for 10% of the poultry meat revenue, according to the United States Department of Agriculture (Poultry - Production and Value 2023 Summary) (NASS, 2023). Maintaining sustainability in our food supply chains is necessary for ensuring continuous food availability and improving the health and wellbeing of current and future populations. Sustainable production of animal protein is vital for meeting meat consumption demands (Duggan et al., 2023). In the commercial turkey industry, the breast muscle (pectoralis major muscle; p. major) is the most economically valuable muscle. Efficient development of the p. major muscle remains a primary focus in turkey breeding strategies.
In poultry, the mechanism that drive skeletal muscle development differ between the embryonic and post-hatch stages. During the embryonic stage, skeletal muscle develops through the proliferation and differentiation of myoblasts, which fuse to develop multinucleated myotubes. These myotubes then differentiate into mature muscle fibers, producing muscle-specific contractile proteins. Myofiber formation is complete at hatch (Smith, 1963), and further growth occurs through the addition of nuclei to existing fibers from satellite cells (SCs), the adult myoblasts, leading to the enlargement of fibers via hypertrophic growth (Moss and Leblond, 1971; Cardasis and Cooper, 1975). Once growth is complete, SCs enter a quiescent state (Schultz et al., 1978), remaining in their niche until they are activated to repair and regenerate damaged muscle fibers (Yin et al., 2013).
Initially identified by Mauro (1961), SCs are located between the sarcolemma and the basal lamina of myofibers and comprise a heterogenous population of muscle stem cells (Schultz, 1974; Biressi and Rando, 2010; Tierney and Sacco, 2016). Khodabukus and Baar (Khodabukus and Baar, 2015) observed that SCs originating from slow and fast myofibers express corresponding slow and fast contractile proteins and retain the metabolic characteristics of their original myofibers. Even within the same regenerating muscle fiber, SCs divide asymmetrically, producing two distinct daughter cells—one that retains the capacity for stem cell self-renewal and another that commits to proliferation and differentiation (Kuang et al., 2007; Ono et al., 2010). SCs isolated from turkey lines with different growth rates show distinct responses to thermal stress and exhibit altered transcriptomic profiles (Reed et al., 2022a; Reed et al., 2022b). Notably, selective breeding for enhanced growth and increased breast muscle yield in turkeys has transformed the satellite cell (SC) population in the p.major muscle into cells with higher proliferation and differentiation rates, along with an elevated adipogenic potential (Clark et al., 2017; Velleman and Coy, 2020; Xu et al., 2021b).
The turkey p.major muscle consists homogeneous Type IIb fibers; however, even within this single fiber-type muscle, McFarland et al. (1995). identified significant heterogeneity among SCs. In this study, 73 distinct SCs were isolated from the p. major muscle of a 6-week-old Nicholas tom turkey. Each single-cell clone was cultured, expanded, and categorized based on its proliferation rate. The fastest-growing cells reached 65% confluency within 17 days (early clones), whereas the slowest-growing cells required 30 days to reach the same confluency level (slow clones), highlighting substantial variability in growth rates among the isolated cells. Subsequent biological analyses revealed that the early clones exhibited greater responsiveness to fibroblast growth factor 2 stimulation and expressed higher levels of fibroblast growth factor receptor 1 at the onset of proliferation. During differentiation, these cells also showed elevated production of heparan sulfate proteoglycan (McFarland et al., 2003). Furthermore, a follow-up study demonstrated that the early clones were more sensitive to the inhibitory effects of transforming growth factor beta on both proliferation and differentiation compared to the slower-growing late cells (Yun et al., 1997). Based on these previous findings, we hypothesized that early and late clones represent two genetically distinct populations characterized by fundamentally different transcriptomic profiles. These intrinsic genetic differences likely drive their varied responses to biological stimuli, influencing key processes such as proliferation, differentiation, and responsiveness to growth factors and signaling molecules. To test this hypothesis, we compared the transcriptional differences between the early and late clones after 72 h proliferation. Gene functional analysis was conducted to characterize the key molecular pathways and mechanisms that differentiate the 2 cell populations. Uncovering the satellite cell-mediated mechanisms involved in the development of the p. major muscle will facilitate the development of strategies to promote animal growth and meat production.
2 Materials and methods
2.1 Turkey myogenic satellite cells
The satellite cell clones utilized in the current study were previously developed by McFarland et al. (1995). Briefly, SCs were isolated from the pectoralis major muscle of a 6-week-old Nicholas tom turkey, sourced from a local producer raising them for consumption purposes. These SCs were suspended in McCoy’s 5A medium, and individual cells were selected and transferred to a 96-well cell culture plate using the Quixell cell manipulator robotic system (Stoelting Co., Wood Dale, IL). This instrument utilizes a micropipette to isolate individual suspended SCs and place them into wells to growth cell clones. These clones were categorized based on their proliferation rates. Clones that reached confluency within 17–19 days in a 25 cm2 tissue culture flask were considered as early clones, reflecting their fast growth/proliferation rates. In contrast, clones requiring 28–29 days to achieve confluency were classified as slow clones, indicative of slower growth/proliferation rates. All clones were preserved in liquid nitrogen for future use.
The early and late clones were cultured as described previously (Reed et al., 2017; Xu et al., 2021b). Briefly, the same number of cells were plated and incubated at 38°C for 24 h in plating medium consisting of Dulbecco’s Modified Eagle’s Medium (D5523, Sigma Aldrich, St. Louis, MO), 10% chicken serum (C5405, Sigma Aldrich, St. Louis, MO), 5% horse serum (H1270, Sigma Aldrich, St. Louis, MO), 1% antibiotics-antimycotics (30004CI, Corning, New York, NY), and 0.1% gentamicin (GT-10, Omega Scientific, Tarzana, CA). After 24 h, the cells were changed to a feeding medium consisting of McCoy’s 5A Medium (M4892, Sigma Aldrich, St. Louis, MO), 10% chicken serum, 5% horse serum, 1% antibiotics-antimycotics, and 0.1% gentamicin, and cultured at 38°C for an additional 72 h. The growth medium was refreshed every 24 h during this 72-h proliferation period. At harvest, the cell medium was removed, and the cells were washed twice with phosphate-buffered saline before being collected into TRIzol Reagent (15596018, ThermoFisher, Waltham, WA) and stored at −80°C until RNA isolation.
2.2 RNA isolation and sequencing
Total RNA was isolated from each sample using TRIzol Reagent, following the manufacturer’s instructions. RNA integrity and quantification were assessed at The Genomics Shared Resource, The Ohio State University, using the Agilent 2,100 Bioanalyzer. Only RNA samples with an RNA Integrity Number (RIN) greater than 9 were sent to Innomics Inc. (Sunnyvale, CA). for sequencing. Sequencing was performed on the DNBSEQ platform with stranded paired-end 150 bp reads. Four replicates were included for each cell line.
2.3 RNAseq data analysis
Quality control checks on raw sequence data from each sample were performed with FastQC (v0.12.1) (Andrews, 2010). Reads were aligned to reference turkey genome (UMD 5.1, ENSEMBL Annotation 111) using STAR (v2.7.11b) with default parameters (Dobin et al., 2013). All samples passed the post-alignment quality check (QualiMap v.2.3) (Okonechnikov et al., 2016). The DEseq2 (Love et al., 2014) method was used for differential expression analysis comparing early and late clones. The adjusted p-value was calculated using the default “BH” setting in DESeq2, which controls the false discovery rate (FDR)—the expected proportion of false discoveries among the rejected hypotheses. The FDR is a less stringent condition than the family-wise error rate, making these methods more powerful compared to others (Benjamini and Hochberg, 1995).
Gene identifiers for annotated genes were obtained through an iterative process from multiple sources. Primarily, these identifiers were sourced directly from the ENSEMBL annotations. For genes lacking corresponding ENSEMBL IDs, annotations were obtained from Dr. Kent M. Reed and relevant publications from his research group (Reed et al., 2017; Barnes et al., 2019; Reed et al., 2022a; Reed et al., 2022b). Gene ontology analysis was performed using g: Profiler (available at https://biit.cs.ut.ee/gprofiler/gost) (Kolberg et al., 2023). The input consisted of genes with a log fold change (logFC) greater than 2 and a P < 0.01. Meleagris gallopavo (Turkey) was selected as the reference genome for the analysis. The g: SCS algorithm was used for computing multiple testing correction for p-values gained from GO and pathway enrichment analysis. The top five Gene Ontology (GO) terms were presented in Figure 3. The specific gene ontology terms related to muscle structure development, extracellular matrix, signaling receptor activator activity, and cytoskeletal protein binding were retrieved from EBI QuickGO database (https://www.ebi.ac.uk/QuickGO/). The PANTHER Overrepresentation Test (Protein Analysis Through Evolutionary Relationships, Version 19.0, released on 2024–06–20) was conducted using the PANTHER database (https://pantherdb.org/). Gallus gallus was selected as the reference organism and reference gene list. The analysis employed Fisher’s Exact Test with Bonferroni correction for multiple testing. The top five GO terms identified are presented in Tables 1, 2. The input genes were selected based on a Log2FC greater than 2 and a P < 0.05.
3 Results
3.1 Summary of overall gene expression
Total RNA was extracted from both early clones (n = 4) and late clones (n = 4), with each sample comprising pooled material from 3 wells to construct individual barcoded libraries. Sequencing generated over 257 million 150 bp paired-end reads (SRA BioProject: PRJNA1196520). The number of reads per library ranged from 28.6 to 35.3 million, with an average of 32.2 million (Table 1). The average proportion of nucleotides with a quality score above 20 (Q20) was over 98.5%, and those with a quality score above 30 (Q30) averaged 95.5%. The results from replicate libraries were consistent.
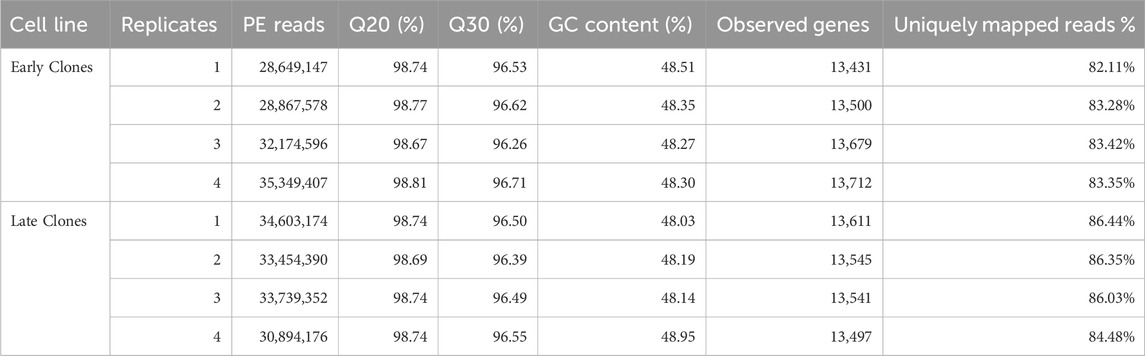
Table 1. Summary of RNAseq data for 72 h proliferation experiment. For each library the total number of raw reads, Q20 (%), Q30 (%), the number of observed genes (mapped reads >1) by library and the percentage of uniquely mapped reads are given.
Evidence of expression (at least one mapped read per library) was observed for an average of 13,565 genes, with a nearly equal distribution between early clones (13,581) and late clones (13,549). Over 82% of the reads uniquely mapped to the turkey genome (Table 1). We conducted Bartlett’s test of sphericity, with a result of p < 0.0001, and the Kaiser-Meyer-Olkin (KMO) test, with an overall KMO of 0.91. These results suggest that the data is suitable for factor analysis. Subsequently, we carried out principal component analysis (PCA), which revealed distinct clustering of early and late clones along the first two principal components based on normalized read counts, as visualized in Figure 1A. This analysis highlights the substantial variations between the 2 cell populations. Technical replicates clustered closely as nearest neighbors within the PCA space, confirming the validity of pooling replicates for expression analysis. Heatmaps, organized by early and late clones, revealed a distinct separation between the two groups while preserving the relationships within each group of cells (Figure 1B), further supporting the significant differences between early and late clones.
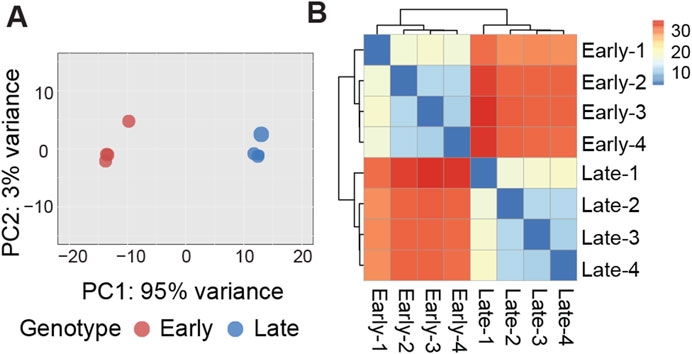
Figure 1. (A) Graphical representation of the first (PC1) and second (PC2) principal components (PC) affecting gene expression patterns in early and late cell clones. (B) Heatmap of sample-to-sample distance matrix showing the dissimilarities between early clones and late clones and the similarity between samples within each clone.
3.2 Differential gene expression
Differences in gene expression between the 2 cell populations are illustrated by the distribution of unique and shared expressed genes, as shown in the Bland-Altman plot (MA plot) in Figure 2A. The MA plot displays the log ratio (M) of gene expression against the average expression (A) to visualize differences between the two groups. A total of 5,347 genes were identified as differentially expressed genes (DEGs) with an adjusted p < 0.05; of these, 2,675 genes were upregulated in late clones and 2,672 genes were upregulated in early clones. A more detailed analysis of these DEGs, using a stringent fold change threshold of |Log2FC| >2 and an adjusted p < 0.001, identified 181 genes upregulated in late clones and 199 genes upregulated in early clones. This finding highlights the substantial differences between early and late clones, despite both exhibiting a similar number of differentially expressed genes (Figure 2B).
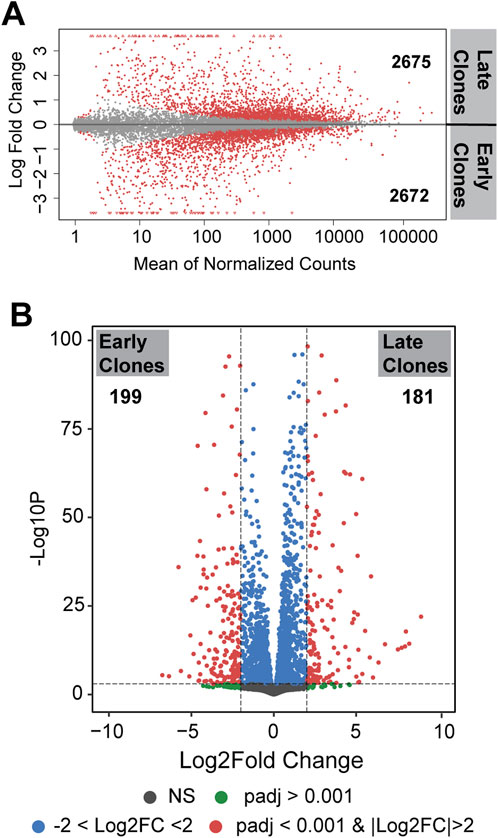
Figure 2. (A) MA plot (Bland-Altman plot) depicting differentially expressed genes on a logarithmic scale. Genes with p < 0.05 are labeled in red. The number indicated the upregulated genes in each clones. (B) Volcano plot presenting differentially expressed genes. Genes with p < 0.001 and |Log2FC| >2 are labeled in red.
3.3 Gene functional analysis
Gene functional enrichment analysis was conducted on differentially expressed genes using two resources: the PATHER (Protein Analysis Through Evolutionary Relationships) knowledgebase and g:Profiler (g: GOSt Functional Profiling). The PATHER overrepresentation test applied genes mapped to chicken (Gallus gallus) gene sets, while g:Profiler analysis used turkey (M. gallopavo) as the input organism. The use of both resources ensured that the functional analysis results were validated against orthologous chicken gene sets, providing consistency and robust validation of the findings. For the analysis, DEGs with a fold change threshold of |Log2FC| >2 and an adjusted p < 0.05 were included in the PATHER analysis, while a more stringent adjusted p < 0.01 with the same fold change threshold was applied in the g:Profiler analysis.
The analysis of upregulated genes in late clones using g:Profiler (Figure 3A) revealed significant enrichment across various categories. In the GO Molecular Functions category, the most significant enrichments were observed for cell receptor ligand activity (-log10 (adjusted p-value) = 5.38), signaling receptor activator activity (-log10 (adjusted p-value) = 5.35), cytokine activity (-log10 (adjusted p-value) = 4.72), and molecular function activator activity (-log10 (adjusted p-value) = 3.04). For the GO Cellular Components category, the highest enrichment scores were found for the extracellular region (-log10 (adjusted p-value) = 15.04), extracellular space (-log10 (adjusted p-value) = 5.28), and cellular anatomical entity (-log10 (adjusted p-value) = 1.64). These findings align with results from the KEGG pathways, where extracellular-receptor interaction featured prominently (-log10 (adjusted p-value) = 5.79). In the GO Biological Processes category, notable enrichments were linked to functions such as cell communication (-log10 (adjusted p-value) = 5.29), signaling (-log10 (adjusted p-value) = 5.10), tube development (-log10 (adjusted p-value) = 4.68), and vasculature development (-log10 (adjusted p-value) = 4.50).
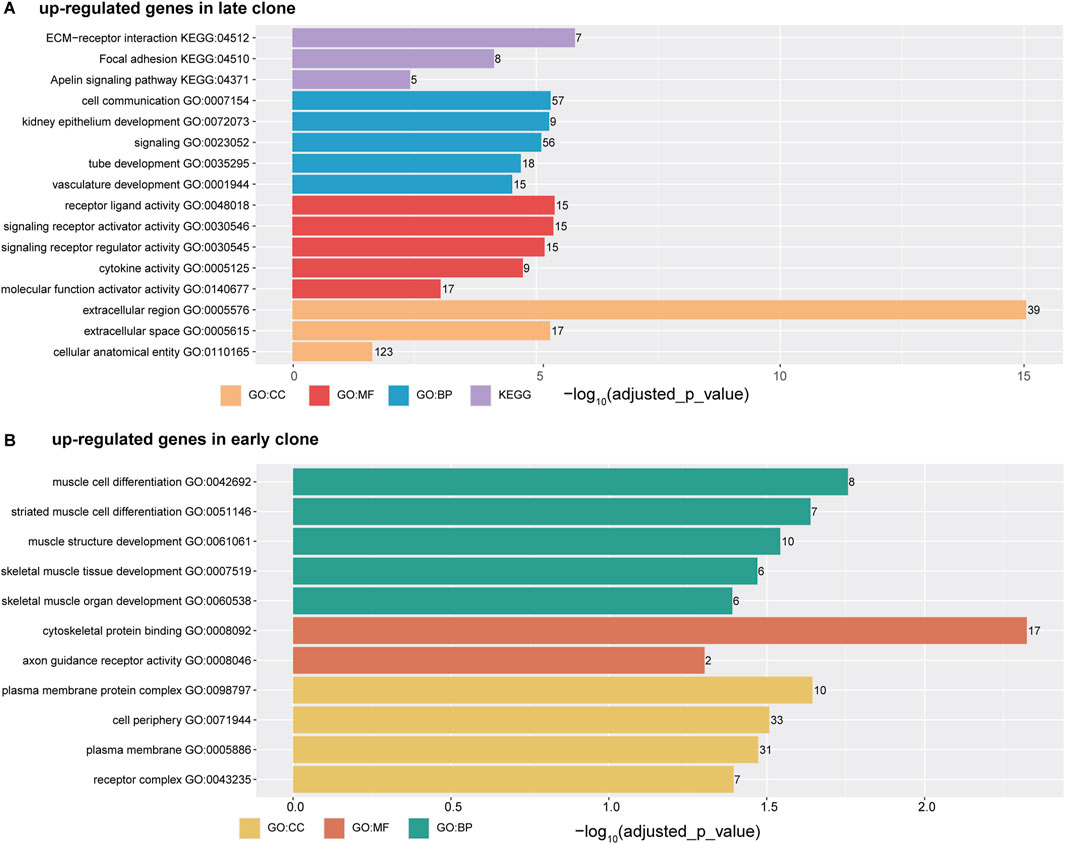
Figure 3. The horizontal bar chart illustrates the top five ontology terms, categorized into CC (Cellular Components), MF (Molecular Functions), BP (Biological Processes), and KEGG (Kyoto Encyclopedia of Genes and Genomes) pathways. The x-axis represents the -log10 (adjusted p-value), while the numbers displayed on each bar indicate the number of genes associated with each term. (A) Functional analysis of genes upregulated in late clones. (B) Functional analysis of genes upregulated in early clones.
In contrast to the gene enrichment profile observed in late clones, the early clones exhibit a distinct pattern of enrichment (Figure 3B). The top enrichments in the GO Biological Processes category are primarily associated with muscle cell function and development, including muscle cell differentiation (-log10 (adjusted p-value) = 1.76), muscle structure development (-log10 (adjusted p-value) = 1.54), and skeletal muscle organ development (-log10 (adjusted p-value) = 1.47). In the GO Molecular Function category, notable enrichments include cytoskeletal protein binding (-log10 (adjusted p-value) = 2.32) and axon guidance receptor activity (-log10 (adjusted p-value) = 1.30). Meanwhile, the GO Cellular Components category shows significant enrichment in cell periphery (-log10 (adjusted p-value) = 1.51), plasma membrane (-log10 (adjusted p-value) = 1.47), and receptor complex (-log10 (adjusted p-value) = 1.39).
The examination of upregulated genes in late clones (146 IDs mapped to the G. gallus gene set, Table 2) using PATHER revealed significant enrichments in the GO Molecular Function category. The top enrichments included extracellular matrix structural constituent conferring tensile strength (27.33-fold, p = 9.13E-06), extracellular matrix structural constituent (17.49-fold, p = 3.08E-05), growth factor activity (12.58-fold, p = 6.56E-08), integrin binding (12.34-fold, p = 2.92E-03), and cytokine activity (8.97-fold, p = 8.06E-05). Within the GO Biological Processes category, extracellular matrix organization (9.70-fold, p = 8.30E-05) and skeletal system development (6.25-fold, p = 2.17E-02) emerged as the top two most highly expressed terms. For the GO Cellular Components category, significant enrichments were observed in the basement membrane (11.93-fold, p = 1.07E-02) and extracellular space (5.36-fold, p = 3.79E-16).
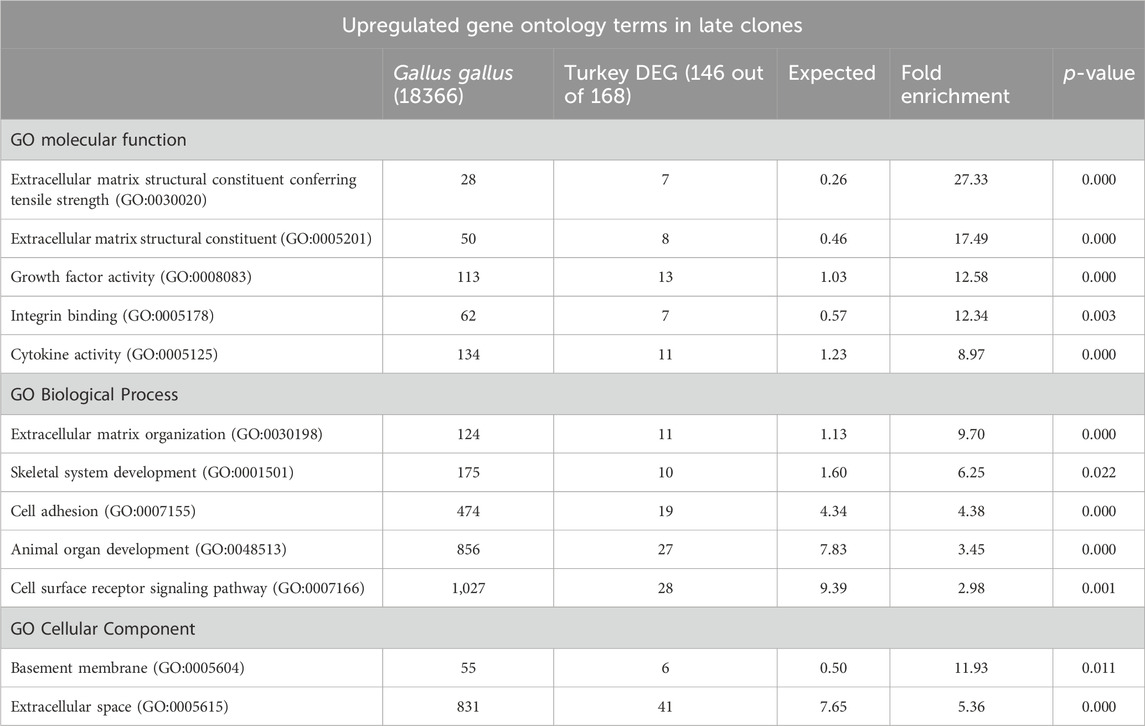
Table 2. PANTHER Overrepresentation test of upregulated DEGs in the late clones after 72 h of proliferation. Shown are the gene ontology categories with the greatest fold enrichment in the GO biological process category.
The analysis of upregulated genes in early clones (133 IDs mapped to the G. gallus gene set, Table 3) using PATHER revealed a different pattern compared to late clones. In the GO Cellular Components category, the top enrichments were associated with muscle structure, specifically myofilament (26.33-fold, p = 1.36E-02) and sarcomere (8.13-fold, p = 2.50E-02). These findings align with the muscle development functions identified in the g:Profiler analysis (Figure 3B). However, the GO Molecular Function and Biological Process categories in PATHER highlighted a unique emphasis on nervous system establishment. In the GO Molecular Function category, the top enrichments included axon guidance receptor activity (71.09-fold, p = 1.12E-02) and acetylcholine-gated monoatomic cation-selective channel activity (25.39-fold, p = 2.03E-04). Similarly, in the GO Biological Processes category, the terms with the highest expression were excitatory postsynaptic potential (18.85-fold, p = 3.48E-04) and chemical synaptic transmission (18.03-fold, p = 4.79E-04).

Table 3. PANTHER Overrepresentation test of upregulated DEGs in the early clones after 72 h of proliferation. Shown are the gene ontology categories with the greatest fold enrichment in the GO biological process category.
Given the significant differences observed in the functional annotation of DEGs between early and late clones, we conducted a detailed analysis of individual gene ontology terms to further validate our findings. Using results from g:Profiler, we focused on gene ontology categories associated with upregulated genes in late clones, including the extracellular matrix (GO:0031012) and signaling receptor pathway (GO:0030546). Among the 1,502 genes associated with the extracellular matrix, 291 were identified in our dataset, and their expression patterns, as visualized in a heatmap, revealed clear distinctions between early and late clones (Supplementary Figure S1A). Similarly, of the 1,530 genes related to the signaling receptor pathway, 163 were mapped in our dataset, with their heatmap also showing distinct patterns between the two groups (Supplementary Figure S1B). In parallel, we examined two gene ontology terms associated with upregulated genes in early clones: muscle structure development (GO:0061061) and cytoskeletal protein binding (GO:008092). From the muscle structure development category, 229 out of 1,793 genes were detected in our dataset. The corresponding heatmap (Supplementary Figure S2A) highlighted distinct expression differences between early and late clones (Supplementary Figure S2A). Likewise, of the 2,484 genes associated with cytoskeletal protein binding, 665 were mapped in our dataset. The heatmap for these genes (Supplementary Figure S2B) further highlighted the divergent expression patterns between the two clones.
3.4 Top expressed genes in the 2 cell populations
The 40 most significant differentially expressed genes with the greatest expression differences between the 2 cell populations are presented in Figure 4. Among these, the most highly upregulated gene in late clones (Log2FC = 8.60) was identified as an ortholog of avian beta-defensin 4 (AvBD4). In chickens, this gene is part of a 14-member family of antimicrobial peptides known for their broad-spectrum activity and critical role in the innate immune system (Sugiarto and Yu, 2004). Also upregulated was homeobox B3 (HOXB3, Log2FC = 7.88), a member of the HOX gene family, which is linked to embryonic development, as well as the progression of diseases and cancers (Chan et al., 2005; Alharbi et al., 2013; Chen et al., 2013). Another upregulated gene, Platelet-Derived Growth Factor C (PDGFC, Log2FC = 7.68), plays a key role in tissue remodeling, angiogenesis, and embryonic development (Reigstad et al., 2005). The Prostaglandin Endoperoxide Synthase 2, also known as Cyclooxygenase 2 (PTGS2/COX2, Log2FC = 5.37), plays a crucial role in inflammatory signaling pathologies. Its induction leads to the production of Prostaglandin E2, essential for effective skeletal muscle stem cell function, enhancing regeneration and muscle strength (Ho et al., 2017; Martin-Vazquez et al., 2023).
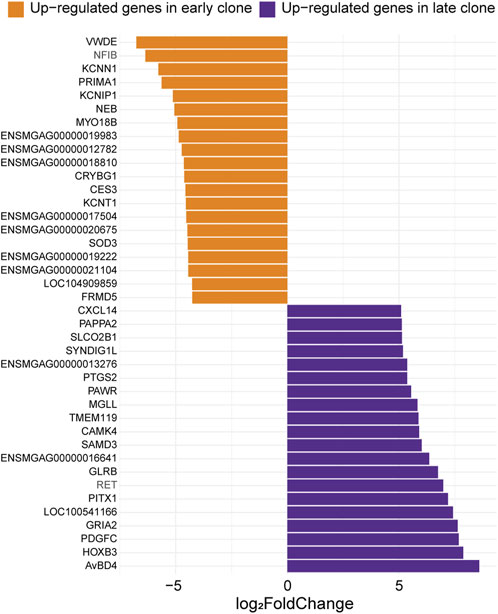
Figure 4. Expression levels of the top 20 genes with the most significant differences between early and late clones. The Log2FC for each gene is shown (adjusted p-value <0.05).
The top upregulated gene in early clones is an ortholog of Von Willebrand Factor D and EGF Domain-Containing Protein (VWDE, Log2FC = −6.77), which is predicted to facilitate signaling receptor binding activity and play a role in anatomical structure development (Alliance of Genome Resources, 2024). Additionally, several upregulated genes in early clones are linked to neuronal excitability and synaptic function. These include Potassium Calcium-Activated Channel Subfamily N Member 1 (KCNN1, Log2FC = −5.78), Potassium Voltage-Gated Channel Interacting Protein 1 (KCNIP1, Log2FC = −5.12), and Potassium Sodium-Activated Channel Subfamily T Member 1 (KCNT1, Log2FC = −4.55). The upregulation of the muscle-specific gene Myosin 18B (MYO18B, Log2FC = −4.93) suggests a role for early clones in sarcomere integrity and assembly (Berger et al., 2017). Furthermore, the association of MYO18B with certain myopathies highlights the potential involvement of early clones in both normal muscle function and disease (Alazami et al., 2015; Malfatti et al., 2015).
3.5 Expression of genes associated with muscle growth and SC function
Since the two SC populations were categorized by distinct cell proliferation rates, and McFarland et al. (2003) reported that early clones are more responsive to fibroblast growth factor 2 (FGF2), showing higher gene expression levels of FGF2 and FGF receptor-1 (FGFR1) at the onset of proliferation compared to slower-growing cells, we specifically examined the expression of FGF2 and FGFR1. While there was no significant difference in FGF2 expression (Log2FC = 0.12), fast-growing SCs exhibited marked higher expression of FGFR1 (Log2FC = −1.74), consistent with the earlier report. Additionally, we analyzed the expression of other FGF family genes, including FGF10, FGF12, FGF13, FGF16, FGF19, and FGF22, and found no significant differences between the 2 cell populations. Intriguingly, FGFBP1, a secreted molecule that functions to chaperone FGF ligands from the extracellular matrix to cognate receptors—thereby enhancing the biological activity of FGF ligands—was significantly elevated in slow-growing SCs (Log2FC = 4.45), suggesting a possible alternative pathway in slow-growing cells to mediate FGF signaling (Abuharbeid et al., 2006; Briones et al., 2006).
In addition to the FGF gene family, we also explored the expression of receptors associated with insulin-like growth factors (IGFs), including the IGF1 receptor (IGF1R) and the IGF-binding protein (IGFBP) family. IGFs are known for their diverse roles as endocrine, paracrine, and autocrine factors that are crucial for cell growth, proliferation, differentiation, and survival (Allard and Duan, 2018). Although the changes were statistically significant, late clones exhibited an increase in IGF1R expression (Log2FC = 0.29) and a more pronounced upregulation of IGFBP5 (Log2FC = 1.69). Notably, overexpression of Igfbp5 has been shown to induce delayed muscle development in mice (Salih et al., 2004), suggesting that the significant elevation of IGFBP5 in slow-growing SCs may play a role in their reduced proliferation rates.
Notch signaling is crucial for regulating SC functions such as proliferation, differentiation, and self-renewal. Activation of HES1 through this pathway modulates the transcription of the myogenic transcription factor MYOD1 and the Notch ligand DLL1, thereby modulating the activation state of SCs (Gioftsidi et al., 2022; Vargas-Franco et al., 2022). Our analysis of key genes involved in Notch signaling revealed increased levels of HES1 (Log2FC = −2.19), MYOD1 (Log2FC = −0.64), and DLL1 (Log2FC = −2.10) in fast-growing SCs, indicating constitutive activation of the Notch signaling pathway in these cells. Additionally, an elevated expression of the MYOG (myogenin, Log2FC = −1.51) gene, one of the key factors regulating myogenesis, was observed in the fast-growing SCs. However, the expression of the transcription factor PAX7 (Log2FC = 0.04), a marker associated with SC proliferation, remained similar between the two SC populations. Taken together, the activation of Notch signaling and the increased expression of MYOD1 and MYOG likely contribute to the enhanced proliferation and differentiation capabilities of fast-growing satellite cells.
4 Discussion
Over the past several decades, selective breeding for accelerated growth performance in poultry has produced faster-growing lines with enhanced breast muscle development compared to non-selected slow-growing lines (Havenstein et al., 2007). Growth-selected turkeys exhibit increased myofiber diameter and reduced connective tissue spacing in the p.major muscle compared to non-selected counterparts (Velleman et al., 2003). However, alongside this selection, reports of undesirable muscle fiber damages, such as deep pectoral myopathy and focal myopathy (Siller, 1985; Wilson et al., 1990), have emerged. These observed alterations in p.major muscle development, growth trajectory and morphological characteristics possibly correlate with changes in the SC populations intrinsic to the p.major muscle (Ferreira et al., 2020; Pejskova et al., 2024). Indeed, previous comparative investigations between faster-growing Nicholas Commercial (NC) turkeys and random-bred populations demonstrated that SCs derived from NC turkeys exhibit enhanced proliferative and differentiation capacities, elevated intracellular lipid content, and increased susceptibility to thermal stress (Xu et al., 2021a; Xu et al., 2021b).
Satellite cells are not a homogenous population of cells (Feldman and Stockdale, 1991; Kuang et al., 2007; Ono et al., 2010). McFarland et al. (1995) identified substantial intrinsic heterogeneity among SC populations derived from the same p.major muscle, demonstrating variability in proliferative and differentiative rates as well as differential growth factor responsiveness. Building on the SCs isolated in McFarland et al. (1995) study, the current research investigated the transcriptomic differences between the SC populations with different proliferation rate. The results indicated substantial transcriptomic differences between the 2 cell populations. Specifically, over 5,000 genes exhibited differential expression, with 2,675 genes upregulated in late clones and 2,672 genes upregulated in early clones. Gene ontology analysis from two independent sources highlighted substantial differences. Pathways prevalent in early clones were primarily associated with the establishment of fundamental muscle structure and cytoskeletal development. Conversely, the functional analysis of late clones revealed pathways involved in extracellular receptor interactions, cell communication, signaling, and cytokine activity. These functional annotations suggest that SCs exhibit considerable functional diversity. The maintenance of normal muscle homeostasis depends on a balance between these distinct SC populations. The current study is the first to genetically characterize two distinct SC populations from the same turkey p. major muscle.
Nutrient availability influences SC activity, which in turn affects muscle development and structural changes. Studies have demonstrated that reduced nutrient availability diminishes SC proliferation and differentiation, resulting in lower body weight and p. major muscle mass (Halevy et al., 2000; Mozdziak et al., 2002; Halevy et al., 2003; Powell et al., 2013; Harthan et al., 2014). Furthermore, the p. major muscles from chicks subjected to feed restriction during the first week post-hatch exhibit increased muscle fiber necrosis and adipose deposition, along with altered expression of myogenic transcriptional regulatory factors that control SC proliferation and differentiation (Velleman et al., 2010; Velleman et al., 2014a). Interestingly, if nutrient restriction is initiated in the second week post-hatch, these adverse effects on myogenic gene expression, muscle fat content, and morphological structure are not observed (Velleman et al., 2014a; Velleman et al., 2014b). These findings suggested that nutrition affects SC biology and that this effect is time sensitive. Therefore, a future direction of the current study is to investigate whether nutrition could affect early and late clones differently. While the current studies have genetically characterized two populations of SCs, we believe there are additional distinct populations of SCs, as suggested by numerous publications from human biomedical research (Dell'Orso et al., 2019; Barruet et al., 2020; Sousa-Victor et al., 2022). Consequently, it is crucial to identify and characterize more SC populations in turkey p. major muscles. A further step is to explore whether specific nutritional supplements can enhance the growth of particular SC populations. Moreover, it is important to assess the overall contribution of SC heterogeneity to muscle growth and development. By understanding these dynamics, we can potentially develop nutritional strategies to optimize muscle growth in livestock, thereby improving meat quality and production efficiency.
The Organization for Economic Co-operation and Development (OECD) and the Food and Agricultural Organization (FAO) of the United Nations, (2023) predicts that the global population will grow by 11% from 7.9 billion in 2022 to 8.6 billion in 2032. Concurrently, global meat production is projected to increase by 15% by 2032, with poultry meat anticipated to represent 48% of this growth over the next decade (OECD/FAO, 2023). This underscores the poultry industry’s need to enhance animal growth and meat production. Given the critical role of SCs in driving muscle growth, future nutrition and breeding strategies should incorporate considerations of SC dynamics to optimize these processes effectively.
5 Conclusion
This study has identified specific genes and gene pathways that differentiate fast-growing and slow-growing satellite cells, isolated from single-cell colony expansions. Our RNA-seq analysis offers a snapshot of gene expression changes along a continuum, which may correspond to functional variations in gene products. The transcriptomic profiles of early and late clones show significant differences, associated with distinct functional annotations. We hypothesize that normal muscle function and homeostasis are sustained by delicate balances among different SC populations. Disruption of this equilibrium could hamper muscle growth and may lead to reduced meat production. Further research is needed to definitively determine how SC heterogeneity contributes to the overall muscle growth.
Data availability statement
The data presented in the study are deposited in BioProject repository, accession number PRJNA1196520. The data has released to public and can be accessed at https://www.ncbi.nlm.nih.gov/bioproject/PRJNA1196520.
Ethics statement
The animal study was approved by the South Dakota State University Animal Care and Use Committee. The study was conducted in accordance with the local legislation and institutional requirements.
Author contributions
HY: Conceptualization, Formal Analysis, Funding acquisition, Investigation, Methodology, Project administration, Resources, Software, Supervision, Validation, Visualization, Writing–original draft, Writing–review and editing. ZL: Data curation, Writing–original draft. JY: Data curation, Resources, Writing–original draft. CW: Data curation, Resources, Writing–original draft. SV: Conceptualization, Resources, Writing–review and editing.
Funding
The author(s) declare that financial support was received for the research, authorship, and/or publication of this article. This research was supported through Start-Up funding provided by The Ohio State University (Department of Animal Sciences) to HY
Acknowledgments
The authors thank Cindy Coy for technical assistance in culturing the satellite cells used in this study. The authors thank Kent M. Reed for help with gene annotation.
Conflict of interest
The authors declare that the research was conducted in the absence of any commercial or financial relationships that could be construed as a potential conflict of interest.
The author(s) declared that they were an editorial board member of Frontiers, at the time of submission. This had no impact on the peer review process and the final decision.
Generative AI statement
The authors declare that no Generative AI was used in the creation of this manuscript.
Publisher’s note
All claims expressed in this article are solely those of the authors and do not necessarily represent those of their affiliated organizations, or those of the publisher, the editors and the reviewers. Any product that may be evaluated in this article, or claim that may be made by its manufacturer, is not guaranteed or endorsed by the publisher.
Supplementary material
The Supplementary Material for this article can be found online at: https://www.frontiersin.org/articles/10.3389/fphys.2025.1547188/full#supplementary-material
References
Abuharbeid S., Czubayko F., Aigner A. (2006). The fibroblast growth factor-binding protein FGF-BP. Int. J. Biochem. Cell Biol. 38 (9), 1463–1468. doi:10.1016/j.biocel.2005.10.017
Alazami A. M., Kentab A. Y., Faqeih E., Mohamed J. Y., Alkhalidi H., Hijazi H., et al. (2015). A novel syndrome of Klippel-Feil anomaly, myopathy, and characteristic facies is linked to a null mutation in MYO18B. J. Med. Genet. 52 (6), 400–404. doi:10.1136/jmedgenet-2014-102964
Alharbi R. A., Pettengell R., Pandha H. S., Morgan R. (2013). The role of HOX genes in normal hematopoiesis and acute leukemia. Leukemia 27 (5), 1000–1008. doi:10.1038/leu.2012.356
Allard J. B., Duan C. (2018). IGF-binding proteins: why do they exist and why are there so many? Front. Endocrinol. (Lausanne) 9, 117. doi:10.3389/fendo.2018.00117
Alliance of Genome Resources, C (2024). Updates to the alliance of genome resources central infrastructure. Genetics 227 (1), iyae049. doi:10.1093/genetics/iyae049
Barnes N. E., Mendoza K. M., Strasburg G. M., Velleman S. G., Reed K. M. (2019). Thermal challenge alters the transcriptional profile of the breast muscle in Turkey poults. Poult. Sci. 98 (1), 74–91. doi:10.3382/ps/pey401
Barruet E., Garcia S. M., Striedinger K., Wu J., Lee S., Byrnes L., et al. (2020). Functionally heterogeneous human satellite cells identified by single cell RNA sequencing. Elife 9, e51576. doi:10.7554/eLife.51576
Benjamini Y., Hochberg Y. (1995). Controlling the false discovery rate: a practical and powerful approach to multiple testing. J. R. Stat. Soc. Ser. B Methodol. 57 (1), 289–300. doi:10.1111/j.2517-6161.1995.tb02031.x
Berger J., Berger S., Li M., Currie P. D. (2017). Myo18b is essential for sarcomere assembly in fast skeletal muscle. Hum. Mol. Genet. 26 (6), 1146–1156. doi:10.1093/hmg/ddx025
Biressi S., Rando T. A. (2010). Heterogeneity in the muscle satellite cell population. Semin. Cell Dev. Biol. 21 (8), 845–854. doi:10.1016/j.semcdb.2010.09.003
Briones V. R., Chen S., Riegel A. T., Lechleider R. J. (2006). Mechanism of fibroblast growth factor-binding protein 1 repression by TGF-beta. Biochem. Biophys. Res. Commun. 345 (2), 595–601. doi:10.1016/j.bbrc.2006.04.052
Cardasis C. A., Cooper G. W. (1975). An analysis of nuclear numbers in individual muscle fibers during differentiation and growth: a satellite cell-muscle fiber growth unit. J. Exp. Zool. 191 (3), 347–358. doi:10.1002/jez.1401910305
Chan K. K., Chen Y. S., Yau T. O., Fu M., Lui V. C., Tam P. K., et al. (2005). Hoxb3 vagal neural crest-specific enhancer element for controlling enteric nervous system development. Dev. Dyn. 233 (2), 473–483. doi:10.1002/dvdy.20347
Chen J., Zhu S., Jiang N., Shang Z., Quan C., Niu Y. (2013). HoxB3 promotes prostate cancer cell progression by transactivating CDCA3. Cancer Lett. 330 (2), 217–224. doi:10.1016/j.canlet.2012.11.051
Clark D. L., Strasburg G. M., Reed K. M., Velleman S. G. (2017). Influence of temperature and growth selection on Turkey pectoralis major muscle satellite cell adipogenic gene expression and lipid accumulation. Poult. Sci. 96 (4), 1015–1027. doi:10.3382/ps/pew374
Dell'Orso S., Juan A. H., Ko K. D., Naz F., Perovanovic J., Gutierrez-Cruz G., et al. (2019). Single cell analysis of adult mouse skeletal muscle stem cells in homeostatic and regenerative conditions. Development 146 (12), dev174177. doi:10.1242/dev.174177
Dobin A., Davis C. A., Schlesinger F., Drenkow J., Zaleski C., Jha S., et al. (2013). STAR: ultrafast universal RNA-seq aligner. Bioinformatics 29 (1), 15–21. doi:10.1093/bioinformatics/bts635
Duggan B. R. J., Avendaño S., Neeteson A.-M., Burnside T., Koerhuis A. (2023). Decades of breeding for welfare and sustainability,.).
Feldman J. L., Stockdale F. E. (1991). Skeletal muscle satellite cell diversity: satellite cells form fibers of different types in cell culture. Dev. Biol. 143 (2), 320–334. doi:10.1016/0012-1606(91)90083-f
Ferreira T. Z., Kindlein L., Flees J. J., Shortnacy L. K., Vieira S. L., Nascimento V. P., et al. (2020). Characterization of pectoralis major muscle satellite cell population heterogeneity, macrophage density, and collagen infiltration in broiler chickens affected by wooden breast. Front. Physiol. 11, 529. doi:10.3389/fphys.2020.00529
Gioftsidi S., Relaix F., Mourikis P. (2022). The Notch signaling network in muscle stem cells during development, homeostasis, and disease. Skelet. Muscle 12 (1), 9. doi:10.1186/s13395-022-00293-w
Halevy O., Geyra A., Barak M., Uni Z., Sklan D. (2000). Early posthatch starvation decreases satellite cell proliferation and skeletal muscle growth in chicks. J. Nutr. 130 (4), 858–864. doi:10.1093/jn/130.4.858
Halevy O., Nadel Y., Barak M., Rozenboim I., Sklan D. (2003). Early posthatch feeding stimulates satellite cell proliferation and skeletal muscle growth in Turkey poults. J. Nutr. 133 (5), 1376–1382. doi:10.1093/jn/133.5.1376
Harthan L. B., McFarland D. C., Velleman S. G. (2014). The effect of nutritional status and myogenic satellite cell age on Turkey satellite cell proliferation, differentiation, and expression of myogenic transcriptional regulatory factors and heparan sulfate proteoglycans syndecan-4 and glypican-1. Poult. Sci. 93 (1), 174–186. doi:10.3382/ps.2013-03570
Havenstein G. B., Ferket P. R., Grimes J. L., Qureshi M. A., Nestor K. E. (2007). Comparison of the performance of 1966- versus 2003-type turkeys when fed representative 1966 and 2003 Turkey diets: growth rate, livability, and feed conversion. Poult. Sci. 86 (2), 232–240. doi:10.1093/ps/86.2.232
Ho A. T. V., Palla A. R., Blake M. R., Yucel N. D., Wang Y. X., Magnusson K. E. G., et al. (2017). Prostaglandin E2 is essential for efficacious skeletal muscle stem-cell function, augmenting regeneration and strength. Proc. Natl. Acad. Sci. U. S. A. 114 (26), 6675–6684. doi:10.1073/pnas.1705420114
Khodabukus A., Baar K. (2015). Contractile and metabolic properties of engineered skeletal muscle derived from slow and fast phenotype mouse muscle. J. Cell Physiol. 230 (8), 1750–1757. doi:10.1002/jcp.24848
Kolberg L., Raudvere U., Kuzmin I., Adler P., Vilo J., Peterson H. (2023). g:Profiler-interoperable web service for functional enrichment analysis and gene identifier mapping (2023 update). Nucleic Acids Res. 51 (W1), W207–W212. doi:10.1093/nar/gkad347
Kuang S., Kuroda K., Le Grand F., Rudnicki M. A. (2007). Asymmetric self-renewal and commitment of satellite stem cells in muscle. Cell 129 (5), 999–1010. doi:10.1016/j.cell.2007.03.044
Love M. I., Huber W., Anders S. (2014). Moderated estimation of fold change and dispersion for RNA-seq data with DESeq2. Genome Biol. 15 (12), 550. doi:10.1186/s13059-014-0550-8
Malfatti E., Bohm J., Lacene E., Beuvin M., Romero N. B., Laporte J. (2015). A premature stop codon in MYO18B is associated with severe nemaline myopathy with cardiomyopathy. J. Neuromuscul. Dis. 2 (3), 219–227. doi:10.3233/JND-150085
Martin-Vazquez E., Cobo-Vuilleumier N., Lopez-Noriega L., Lorenzo P. I., Gauthier B. R. (2023). The PTGS2/COX2-PGE(2) signaling cascade in inflammation: pro or anti? A case study with type 1 diabetes mellitus. Int. J. Biol. Sci. 19 (13), 4157–4165. doi:10.7150/ijbs.86492
Mauro A. (1961). Satellite cell of skeletal muscle fibers. J. Biophys. Biochem. Cytol. 9 (2), 493–495. doi:10.1083/jcb.9.2.493
McFarland D., Gilkerson K., Pesall J., Walker J., Yun Y. (1995). Heterogeneity in growth characteristics of satellite cell populations. Cytobios 82 (328), 21–27.
McFarland D. C., Liu X., Velleman S. G., Zeng C., Coy C. S., Pesall J. E. (2003). Variation in fibroblast growth factor response and heparan sulfate proteoglycan production in satellite cell populations. Comp. Biochem. Physiol. C Toxicol. Pharmacol. 134 (3), 341–351. doi:10.1016/s1532-0456(02)00272-7
Moss F. P., Leblond C. P. (1971). Satellite cells as the source of nuclei in muscles of growing rats. Anat. Rec. 170 (4), 421–435. doi:10.1002/ar.1091700405
Mozdziak P. E., Walsh T. J., McCoy D. W. (2002). The effect of early posthatch nutrition on satellite cell mitotic activity. Poult. Sci. 81 (11), 1703–1708. doi:10.1093/ps/81.11.1703
OECD/FAO (2023). OECD-FAO agricultural outlook 2023–2032. Paris, France: OECD Publishing, 20–76+184–201.
Okonechnikov K., Conesa A., Garcia-Alcalde F. (2016). Qualimap 2: advanced multi-sample quality control for high-throughput sequencing data. Bioinformatics 32 (2), 292–294. doi:10.1093/bioinformatics/btv566
Ono Y., Boldrin L., Knopp P., Morgan J. E., Zammit P. S. (2010). Muscle satellite cells are a functionally heterogeneous population in both somite-derived and branchiomeric muscles. Dev. Biol. 337 (1), 29–41. doi:10.1016/j.ydbio.2009.10.005
Pejskova L., Pisconti A., Lunde M., Ho K. Y., Solberg N. T., Koga S., et al. (2024). Wooden breast myopathy is characterized by satellite cell dysfunction and syndecan-4 shedding. Front. Physiol. 15, 1513311. doi:10.3389/fphys.2024.1513311
Powell D. J., McFarland D. C., Cowieson A. J., Muir W. I., Velleman S. G. (2013). The effect of nutritional status on myogenic satellite cell proliferation and differentiation. Poult. Sci. 92 (8), 2163–2173. doi:10.3382/ps.2013-03107
Reed K. M., Mendoza K. M., Abrahante J. E., Barnes N. E., Velleman S. G., Strasburg G. M. (2017). Response of Turkey muscle satellite cells to thermal challenge. I. transcriptome effects in proliferating cells. BMC Genomics 18 (1), 352. doi:10.1186/s12864-017-3740-4
Reed K. M., Mendoza K. M., Strasburg G. M., Velleman S. G. (2022a). Transcriptome response of proliferating muscle satellite cells to thermal challenge in commercial Turkey. Front. Physiol. 13, 970243. doi:10.3389/fphys.2022.970243
Reed K. M., Mendoza K. M., Xu J., Strasburg G. M., Velleman S. G. (2022b). Transcriptome response of differentiating muscle satellite cells to thermal challenge in commercial Turkey. Genes (Basel) 13 (10), 1857. doi:10.3390/genes13101857
Reigstad L. J., Varhaug J. E., Lillehaug J. R. (2005). Structural and functional specificities of PDGF-C and PDGF-D, the novel members of the platelet-derived growth factors family. FEBS J. 272 (22), 5723–5741. doi:10.1111/j.1742-4658.2005.04989.x
Salih D. A., Tripathi G., Holding C., Szestak T. A., Gonzalez M. I., Carter E. J., et al. (2004). Insulin-like growth factor-binding protein 5 (Igfbp5) compromises survival, growth, muscle development, and fertility in mice. Proc. Natl. Acad. Sci. U. S. A. 101 (12), 4314–4319. doi:10.1073/pnas.0400230101
Schultz E. (1974). A quantitative study of the satellite cell population in postnatal mouse lumbrical muscle. Anat. Rec. 180 (4), 589–595. doi:10.1002/ar.1091800405
Schultz E., Gibson M. C., Champion T. (1978). Satellite cells are mitotically quiescent in mature mouse muscle: an EM and radioautographic study. J. Exp. Zool. 206 (3), 451–456. doi:10.1002/jez.1402060314
Siller W. G. (1985). Deep pectoral myopathy: a penalty of successful selection for muscle growth. Poult. Sci. 64 (8), 1591–1595. doi:10.3382/ps.0641591
Smith J. H. (1963). Relation of body size to muscle cell size and number in the chicken,. Poult. Sci. 42 (2), 283–290. doi:10.3382/ps.0420283
Sousa-Victor P., Garcia-Prat L., Munoz-Canoves P. (2022). Control of satellite cell function in muscle regeneration and its disruption in ageing. Nat. Rev. Mol. Cell Biol. 23 (3), 204–226. doi:10.1038/s41580-021-00421-2
Sugiarto H., Yu P. L. (2004). Avian antimicrobial peptides: the defense role of beta-defensins. Biochem. Biophys. Res. Commun. 323 (3), 721–727. doi:10.1016/j.bbrc.2004.08.162
Tierney M. T., Sacco A. (2016). Satellite cell heterogeneity in skeletal muscle homeostasis. Trends Cell Biol. 26 (6), 434–444. doi:10.1016/j.tcb.2016.02.004
Vargas-Franco D., Kalra R., Draper I., Pacak C. A., Asakura A., Kang P. B. (2022). The Notch signaling pathway in skeletal muscle health and disease. Muscle Nerve 66 (5), 530–544. doi:10.1002/mus.27684
Velleman S. G., Anderson J. W., Coy C. S., Nestor K. E. (2003). Effect of selection for growth rate on muscle damage during Turkey breast muscle development. Poult. Sci. 82 (7), 1069–1074. doi:10.1093/ps/82.7.1069
Velleman S. G., Coy C. S. (2020). Research Note: effect of selection for body weight on the adipogenic conversion of Turkey myogenic satellite cells by Syndecan-4 and its covalently attached N-glycosylation chains. Poult. Sci. 99 (2), 1209–1215. doi:10.1016/j.psj.2019.12.029
Velleman S. G., Coy C. S., Emmerson D. A. (2014a). Effect of the timing of posthatch feed restrictions on broiler breast muscle development and muscle transcriptional regulatory factor gene expression. Poult. Sci. 93 (6), 1484–1494. doi:10.3382/ps.2013-03813
Velleman S. G., Coy C. S., Emmerson D. A. (2014b). Effect of the timing of posthatch feed restrictions on the deposition of fat during broiler breast muscle development. Poult. Sci. 93 (10), 2622–2627. doi:10.3382/ps.2014-04206
Velleman S. G. N. K. E. C. C. S., Harford I., Anthony N. B. (2010). Effect of posthatch feed restriction on broiler breast muscle development and muscle transcriptional regulatory factor gene and heparan sulfate proteoglycan expression. Int. J. Poult. Sci. 9 (5), 417–425. doi:10.3923/ijps.2010.417.425
Wilson B. W., Nieberg P. S., Buhr R. J., Kelly B. J., Shultz F. T. (1990). Turkey muscle growth and focal myopathy. Poult. Sci. 69 (9), 1553–1562. doi:10.3382/ps.0691553
Xu J., Strasburg G. M., Reed K. M., Velleman S. G. (2021a). Effect of temperature and selection for growth on intracellular lipid accumulation and adipogenic gene expression in Turkey pectoralis major muscle satellite cells. Front. Physiol. 12, 667814. doi:10.3389/fphys.2021.667814
Xu J., Strasburg G. M., Reed K. M., Velleman S. G. (2021b). Response of Turkey pectoralis major muscle satellite cells to hot and cold thermal stress: effect of growth selection on satellite cell proliferation and differentiation. Comp. Biochem. Physiol. A Mol. Integr. Physiol. 252, 110823. doi:10.1016/j.cbpa.2020.110823
Yin H., Price F., Rudnicki M. A. (2013). Satellite cells and the muscle stem cell niche. Physiol. Rev. 93 (1), 23–67. doi:10.1152/physrev.00043.2011
Keywords: satellite cells, heterogeneity, Turkey, pectoralis major muscle, RNAsequencing
Citation: Yu H, Li Z, Yimiletey J, Wan C and Velleman S (2025) Molecular characterization of the heterogeneity of satellite cell populations isolated from an individual Turkey pectoralis major muscle. Front. Physiol. 16:1547188. doi: 10.3389/fphys.2025.1547188
Received: 17 December 2024; Accepted: 03 February 2025;
Published: 20 February 2025.
Edited by:
Krystyna Pierzchała-Koziec, University of Agriculture in Krakow, PolandReviewed by:
Kate Kosmac, Augusta University, United StatesMałgorzata Gumułka, University of Agriculture in Krakow, Poland
Paul Siegel, Virginia Tech, United States
Copyright © 2025 Yu, Li, Yimiletey, Wan and Velleman. This is an open-access article distributed under the terms of the Creative Commons Attribution License (CC BY). The use, distribution or reproduction in other forums is permitted, provided the original author(s) and the copyright owner(s) are credited and that the original publication in this journal is cited, in accordance with accepted academic practice. No use, distribution or reproduction is permitted which does not comply with these terms.
*Correspondence: Hui Yu, eXUuMzg1OUBvc3UuZWR1