 Weirong Xue1†
 Bing Xu2†Hui Wang3
 Xiaoxiao Zhu1Jiajia Qin1Guangshuang Zhou1
 Peilin Yu1
 Shengli Li4*
 Yingliang Jin5*
- 1School of Public Health, Xuzhou Medical College, Xuzhou, China
- 2Department of Otorhinolaryngology, Affiliated Hospital of Xuzhou Medical University, Xuzhou, Jiangsu, China
- 3Department of Hepatobiliary Surgery, Xuzhou Central Hospital, Xuzhou, Jiangsu, China
- 4Clinical Research Institute, The Affiliated Hospital of Xuzhou Medical University, Xuzhou, China
- 5Department of Biostatistics, Center for Medical Statistics and Data Analysis, School of Public Health, Key Laboratory of Human Genetics and Environmental Medicine Xuzhou Medical College, Xuzhou, China
Background: Budd-Chiari syndrome (BCS) is a rare global condition with high recurrence rates. Existing prognostic scoring models demonstrate limited predictive efficacy for BCS recurrence. This study aims to develop a novel machine learning model based on multiple kernel learning to improve the prediction of 3-year recurrence in BCS patients.
Methods: Data were collected from BCS patients admitted to the Affiliated Hospital of Xuzhou Medical University between January 2015 and July 2022. The dataset was divided into training, validation, and test sets in a 6:2:2 ratio. Models were constructed by evaluating all combinations of four kernel functions in the training set. Hyperparameters for each model were optimized using the particle swarm optimization (PSO) algorithm on the validation set. The test set was used to compare kernel function combinations, with the area under the curve (AUC), sensitivity, specificity, and accuracy as evaluation metrics. The optimal model, identified through the best-performing kernel combination, was further compared with three classical machine learning models.
Result: A kernel combination integrating all four basic kernels achieved the highest average AUC (0.831), specificity (0.772), and accuracy (0.780), along with marginally lower but more stable sensitivity (0.795) compared to other combinations. When benchmarked against classical machine learning models, our proposed MKSVRB (Multi-Kernel Support Vector Machine Model for Three-Year Recurrence Prediction of Budd-Chiari Syndrome) demonstrated superior performance. Additionally, it outperformed prior studies addressing similar objectives.
Conclusion: This study identifies risk factors influencing BCS recurrence and validates the MKSVRB model as a significant advancement over existing prediction methods. The model exhibits strong potential for early detection, risk stratification, and recurrence prevention in BCS patients.
Introduction
Budd-Chiari syndrome (BCS) is defined as the obstruction of hepatic venous outflow at any level ranging from the small hepatic venules to the junction of the inferior vena cava and right atrium, caused by factors other than hepatic venous occlusive disease and cardiac disease (Janssen et al., 2003). Common causes typically include hypercoagulable states, infections, and malignant tumors (Goel et al., 2015). This obstruction leads to increased hepatic sinusoidal pressure and portal venous pressure, reduced blood flow, resulting in hepatic congestion and ascites formation. Prolonged hepatocyte hypoxia can result in hepatocellular injury, potentially leading to cirrhosis and portal hypertension (Menon et al., 2004; Valla, 2002).Budd–Chiari syndrome, is globally rare and exhibits significant geographical variations in etiology, incidence, and clinical presentation. Chronic cases are more prevalent, while acute occurrences are uncommon. Typical features include abdominal pain, ascites, hepatomegaly, and subcutaneous vascular dilatation in the abdominal wall and trunk (Shukla et al., 2021). Advances in endovascular therapies have significantly improved patient prognosis, with a sustained decrease in mortality rates. However, The phenomenon of recurrence still occurs frequently (Shukla et al., 2021). Various prognostic scoring models exist including Child–Pugh score, Model for end-stage liver disease (MELD), Clichy PI, Rotterdam score, New Clichy PI, and BCS-TIPS score, while these models have shown limited predictive efficacy for recurrence of Budd–Chiari syndrome (Wang et al., 2023).
In a study by Zhongkai Wang et al., a model for predicting BCS recurrence based on logistic regression (LR) and nomograms demonstrated superior performance compared to traditional scoring models (Wang et al., 2023). With the rapid development of machine learning technology, its application in various industries has expanded significantly. In the field of medicine, using machine learning techniques to predict the diagnosis, mortality, and prognosis of various diseases has become feasible. The potential machine learning in predicting Budd-Chiari syndrome recurrence as a more accurate and efficient predictive tool is promising (Deo, 2015).
In the field of machine learning, common algorithms used for predicting disease mortality or recurrence include random forest (RF), support vector machine (SVM), extreme gradient boosting (XGBoost), and LR models. These algorithms generally perform well when the dataset exhibits relatively simple structural relationships or minimal internal noise (Handelman et al., 2018; Jamin et al., 2021). However, when the internal complexity of the dataset is high, there are many noise and outliers, or the relationships between datasets are difficult to represent with a single logical relationship, these machine learning algorithms typically fail to achieve satisfactory performance.For SVM, its performance largely depends on the choice of kernel (Amari and Wu, 1999), while multiple kernel learning (MKL) is a machine learning method that combines multiple kernel functions or selects the optimal kernel function to enhance the performance and generalization ability of the model. Compared to traditional machine learning models, MKL can utilize multiple kernel functions to measure the similarity between samples, aiming to describe the internal relationships within the dataset as comprehensively as possible. This approach better captures the complexity inherent in the dataset, thereby improving the utilization of data (Sonnenburg et al., 2006),When confronted with classification and regression problems involving heterogeneous datasets from various sources, multiple kernel learning has been proven to be an effective solution. It finds wide applications in many fields, including visual object recognition (Bucak et al., 2014), early disease identification (Collazos-Huertas et al., 2019), disease prognosis prediction (Wilson et al., 2019) and more.
Budd-Chiari syndrome is characterized by its rarity, making it challenging to obtain ample sample sizes in most studies. Moreover, there are significant regional differences and complex etiologies involved, most obstructions occur in the hepatic veins and the segment of the inferior vena cava above their openings can lead to the syndrome (Menon et al., 2004). The characteristics of Budd-Chiari syndrome outlined above necessitate a broader consideration when establishing predictive models, especially for features not universally common due to rare causative factors. Baseline data explained solely by a single-kernel model often fails to provide reliable guidance on recurrence. MKL, as a method capable of effectively handling heterogeneous data sources and noisy datasets, should yield satisfactory results when applied to predicting recurrence in Budd-Chiari syndrome (Pavlidis et al., 2001; Kingsbury et al., 2005).
However, up to this point, MKL as a powerful descriptive tool has not been applied to predict recurrence in Budd-Chiari syndrome. Therefore, in this paper, we will establish a new supported vector machine model with MKL for feature learning and particle swarm optimization (PSO) algorithm for hyperparameter selection, in the purpose of predicting recurrence in Budd-Chiari syndrome within 3 years.
Methods
Data source and study population
The dataset was obtained from patients diagnosed with BCS admitted to the Affiliated Hospital of Xuzhou Medical University between January 2015 and July 2022. Inclusion criteria were based on symptoms, signs, and imaging examinations indicating primary BCS, including magnetic resonance imaging (MRI), computed tomography (CT), color Doppler ultrasound (CDUS), and venography. Exclusion criteria were as follows: (1) patients with secondary BCS caused by various reasons, including parasitic invasion, abscess, cyst, malignant tumor compression, or venous injury after surgery; (2) patients with concurrent liver diseases, including viral hepatitis, autoimmune hepatitis, alcoholic hepatitis, and liver fibrosis; (3) patients with severe cardiac, hepatic, or renal failure, or other reasons unable to undergo interventional or surgical treatment; (4) patients who failed in revascularization due to complete vascular occlusion or concomitant old thrombosis; (5) patients with improper anticoagulation therapy; (6) patients with significant missing information in medical records; (7) patients with follow-up time less than 12 months. According to these criteria, a total of 522 patients were included in this study, with complete data availability and no missing values.
This study was approved by the Institutional Review Board of the Affiliated Hospital of Xuzhou Medical University. All methods were performed in accordance with the relevant guidelines and regulations.
Model framework
Before construsting the model, the feature data of Budd-Chiari syndrome patients is required to be represented in the following form:
A composite kernel function is then established based on the weights of different kernel functions:
In Equation 1
Then the EasyMKL algorithm, proposed by Fabio Aiolli and Michele Donini in 2015, was used to obtain the weights of each base kernel in the kernel set by solving a simple QP problem with the learning strategy that considering the balance between the minimum and average values of the boundary (Aiolli and Donini, 2015; Donini et al., 2019; Aiolli et al., 2008):
In the above equation, a trade-off parameter
Then, for Equation 2, a iteration process is employed to optimize the objective function. In each optimization step, the algorithm selects a pair of variables
In Equation 3,
In Equation 4, the solution for
In our study, four common kernel functions were selected as alternative options for support vector machines. The kernel functions are as follows:
In these functions,
Finally considering how to optimize the aforementioned parameters and trade-off parameter
After predefining a set of kernel combinations as inputs, the position of the
In the particle swarm optimization process, the distance and direction of movement for the
The direction and distance of movement in Equation 6 in each iteration are determined by three factors: the direction and distance from the previous iteration, the particle’s historical best position, and the swarm’s global historical best position:
The first part in Equation 7 is the inertial component, which encourages particles to retain their previous motion state, governed by the inertia weight
The optimization objective focused on maximizing the validation set AUC. For each particle in every iteration, hyperparameters were systematically recorded, and the configuration yielding the highest AUC was selected as the optimal hyperparameter set for the corresponding kernel combination.
Study design
Budd-Chiari syndrome patients included in the study were randomly divided into training, validation, and testing sets in a 6:2:2 ratio. The training set was utilized for the model to learn the data features. After determining a suitable set of hyperparameters using the PSO algorithm, a model associated with these hyperparameters was constructed, and the validation set was used to evaluate the model’s performance to select the best hyperparameter combination.
In many previous studies on multi-kernel learning, specifying kernel combinations was typically empirical. Jian Hou et al. proposed that a linear combination of more kernels may not necessarily be superior to the average combination of single strong kernels or base kernels (Hou et al., 2018). To clearly observe the measuring ability of different kernel functions for sample similarity and determine the best kernel combination, we arranged combinations of four base kernels. The testing set was used to compare the performance of a total of four single-kernel support vector machine models and eleven multi-kernel models. Additionally, three classical machine learning models, including RF, XGBoost, and KNM, were also considered. Ultimately, a total of eighteen models were included in this study for the evaluation of predictive performance for BCS patient recurrence. Ten rounds of validation were conducted on each of the aforementioned models, and the evaluation was performed using the average performance metrics and standard deviation, including AUC (area under the curve), sensitivity, specificity and accuracy.The flowchart depicted in Figure 1.
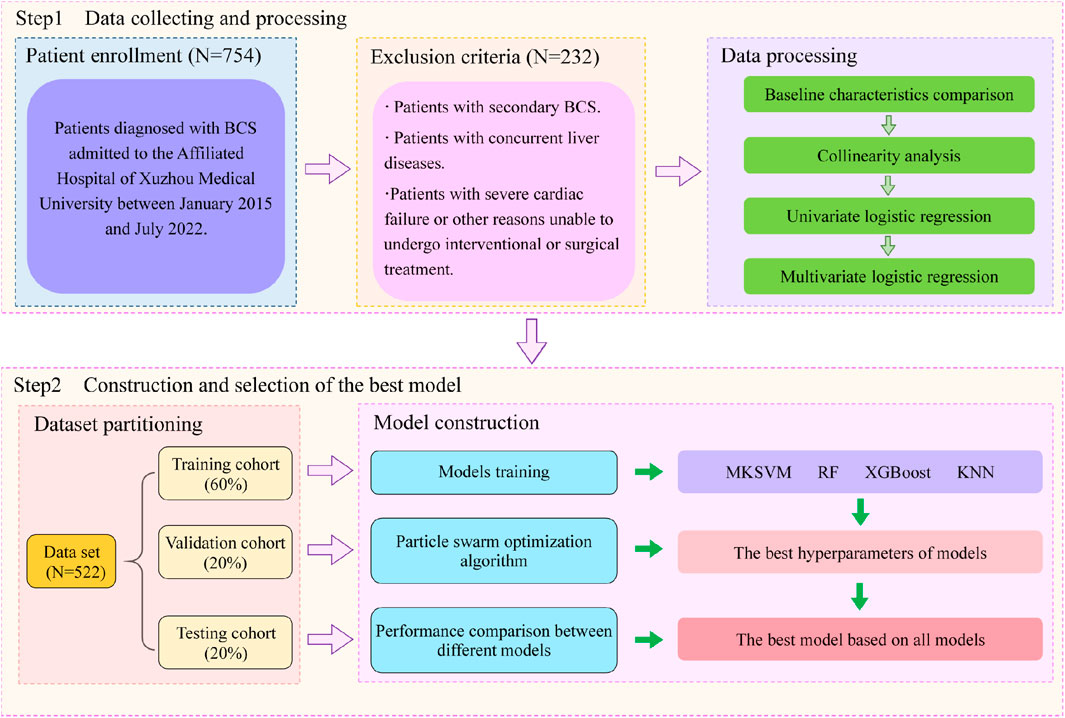
Figure 1. Flow chart of study design.
Statistical analysis
In the statistical analysis stage, we conducted baseline analysis of the dataset to detect baseline feature differences between BCS patients who experienced recurrence during the observation period and those who did not. For categorical variables, we described the number and composition of each category in the recurrence and non-recurrence groups, and employed the chi-square test to identify differences between the two groups. For continuous variables, we first conducted tests for normality in both groups. For variables following a normal distribution, we described them using mean and standard deviation and then used independent samples t-test to identify differences. For variables not following a normal distribution, we described them in terms of median and IQR and then conducted the non-parametric Mann-Whitney U test.
After determining the variables with statistically significant differences in baseline analysis, a univariate logistic regression analysis was conducted to examine the relationship between various data features and the recurrence of BCS, and to identify factors that may affect patient recurrence. Subsequently, a multivariate logistic analysis was performed to determine the independent risk factors affecting recurrence and their corresponding risk levels. In this study, all statistical analyses were considered statistically significant at P < 0.05. The software used for analysis included R (version 4.4.1) and Python (Version 3.10.9).
Results
Baseline characteristics
Among all 522 Budd-Chiari syndrome patients included in the study, 169 experienced recurrence during the observation period, while 353 did not (1:2.09). Valid data obtained in this study include patients’ age, gender, occupation, Budd-Chiari syndrome subtype, and other information, as detailed in Figure 2 and Figure 3.
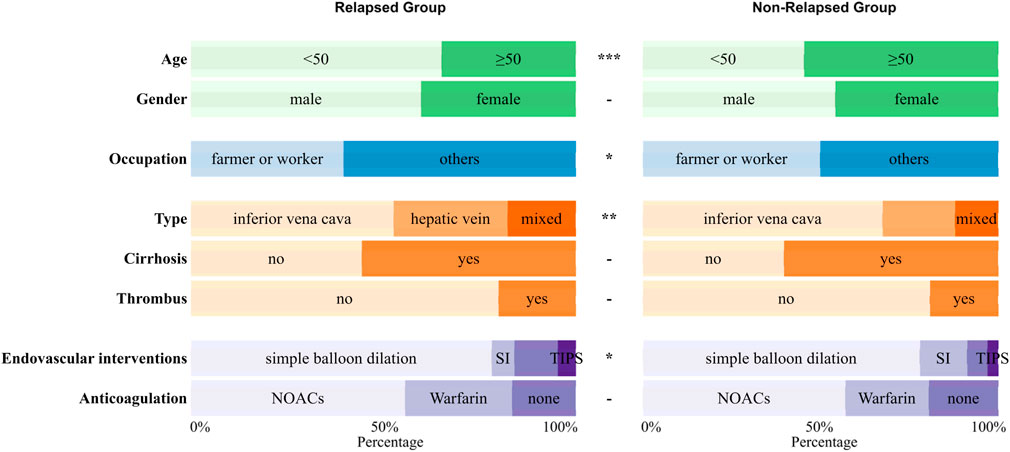
Figure 2. The distribution of qualitative variables between the relapsed group and the non-relapsed group with significance marked between the two groups (p ≥ 0.05 -; p < 0.05 *; p < 0.01 **; p < 0.001 ***).
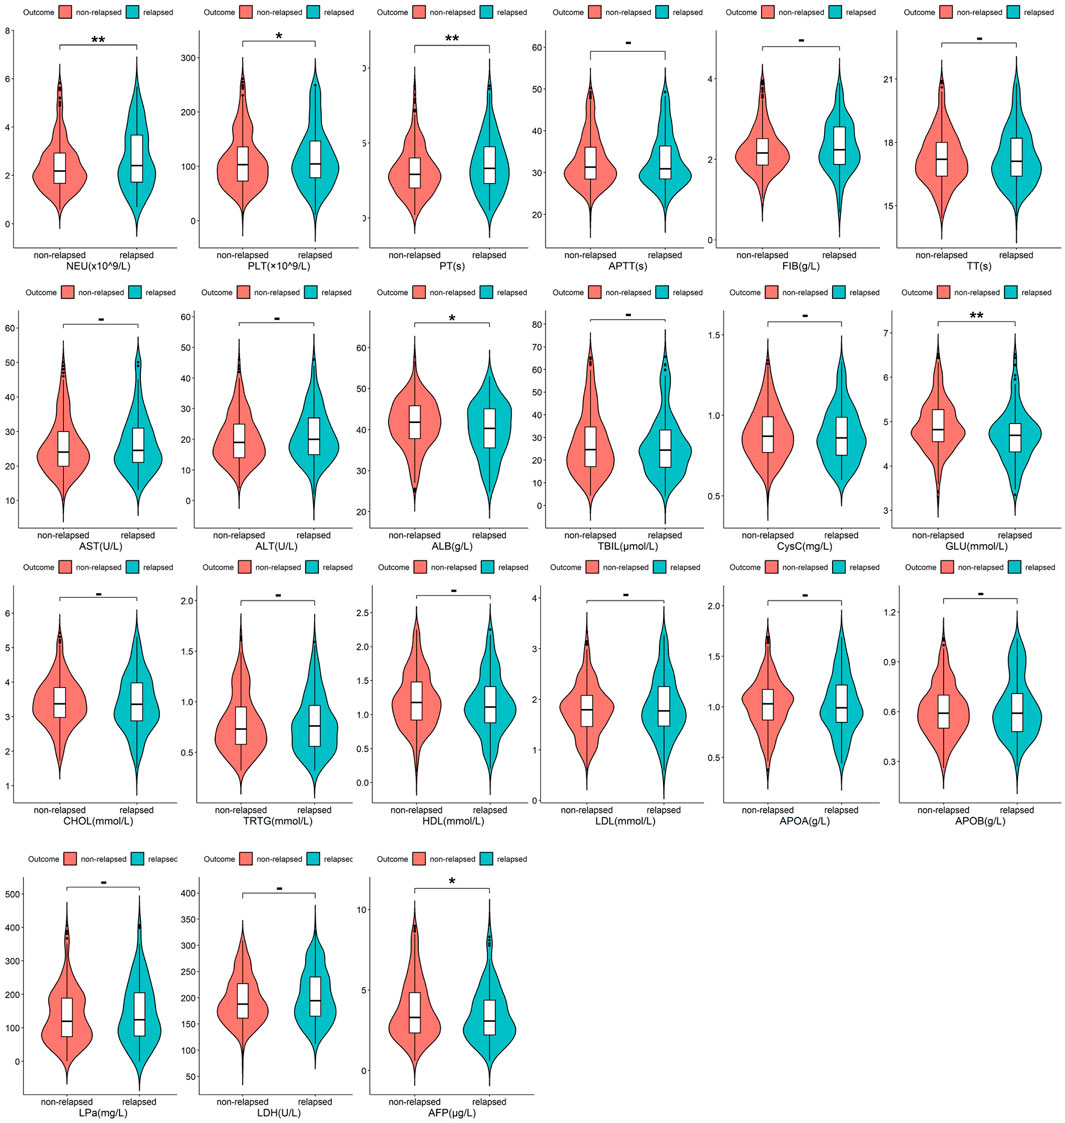
Figure 3. The distribution of quantitative variables between the relapsed group and the non-relapsed group with significance marked between the two groups (p ≥ 0.05 -; p < 0.05 *; p < 0.01 **; p < 0.001 ***).
As shown in Figure 2 and Figure 3, Budd-Chiari syndrome patients who experienced recurrence during the observation period differed significantly from those who did not in terms of age (P < 0.001), occupation (P = 0.029), type (P = 0.005), endovascular intervention (P = 0.01), Neutrophils (NEU) levels (P = 0.002), Platelets (PLT) levels (P = 0.044), Prothrombin Time (PT) levels (P = 0.007), Albumin (ALB) levels (P = 0.02), Glucose (GLU) levels (P = 0.004), and Alpha-Fetoprotein (AFP) levels (P = 0.032). We conducted collinearity analysis among these variables in Figure 4, revealing strong collinearity between NEU and PLT, while no significant collinearity was found among the other variables. Considering the significance of the differences, we decided to exclude PLT.

Figure 4. The Correlation Matrix of quantitative variables after baseline analysis.
Feature selection
The results of univariate and multivariate screening are presented in Table 1. In the univariate screening, eight variables were identified, including age (P < 0.001), occupation (P = 0.029), type (compared to inferior vena cava type, hepatic vein type with P = 0.005, mixed type with P = 0.02), endovascular intervention (compared to simple balloon dilation, stent implantation with P = 0.025, catheter-directed thrombolysis with P = 0.043), NEU (P = 0.001), PT (P = 0.031), ALB (P = 0.01), and AFP (P = 0.022).
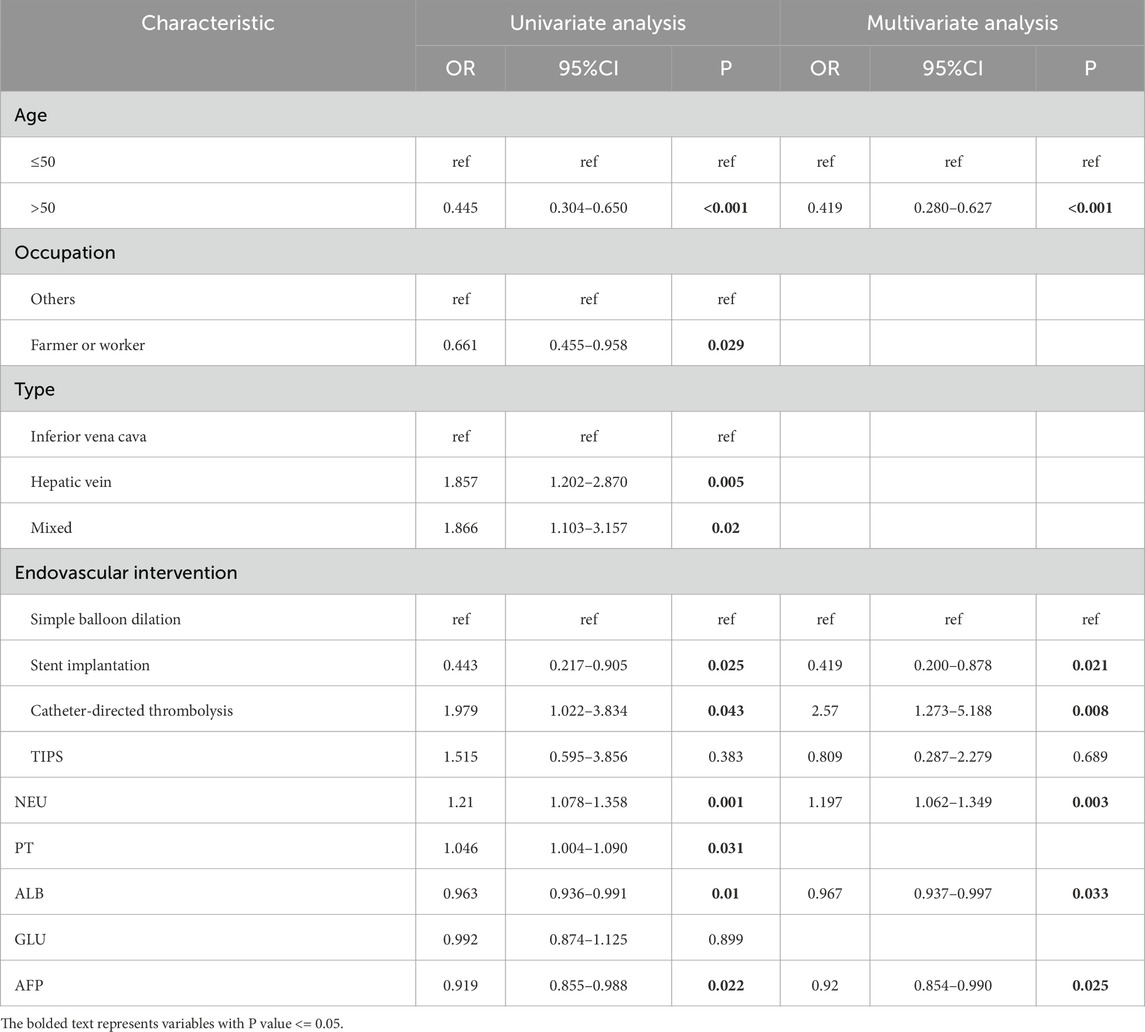
Table 1. Univariate and multivariate regression analysis of risk factors for recurrence of Budd-Chiari syndrome.
The results of multivariable logistic regression screening indicated that age ≥50 years may be a protective factor for Budd-Chiari syndrome patients compared to age <50 years (P < 0.001, OR = 0.419), which is consistent with the findings of Wang et al. (2023). Higher NEU levels were identified as an independent risk factor for Budd-Chiari syndrome recurrence (P = 0.003, OR = 1.197), while higher levels of ALB (P = 0.033, OR = 0.967) and AFP (P = 0.025, OR = 0.92) were found to have protective effects against Budd-Chiari syndrome recurrence.Among the various endovascular interventions for Budd-Chiari syndrome, patients undergoing stent implantation seemed to have a lower risk of recurrence compared to those undergoing simple balloon dilation (P = 0.021, OR = 0.419). However, patients undergoing catheter-directed thrombolysis showed a higher tendency for recurrence (P = 0.008, OR = 2.57).
Selection of the best combination of kernel functions
In our study, we constructed support vector machine models based on fifteen combinations of four types of kernel functions, including four single-kernel models and eleven multi-kernel models. The combinations of kernel functions are listed in Table 2. Each combination model underwent ten rounds of validation and the evaluation was based on the average and standard deviation of ten results, including metrics such as AUC, sensitivity, specificity, and accuracy, as detailed in Figure 5 and Table 2. It can be observed that among all four base kernels, the Linear Kernel demonstrated the best fit for our Budd-Chiari syndrome patient data and achieved the highest average AUC, sensitivity, specificity, and accuracy while Gaussian Kernel having the poorest average performance.Surprisingly, in terms of kernel combinations, Config 9, which combines the Polynomial Kernel with the Gaussian Kernel—the two weaker kernels among the four base kernels—outperformed Config 6, which combines the Linear Kernel and the Sigmoid Kernel, both of which had higher individual performances among the single kernels. This finding demonstrates the effectiveness of our study, suggesting that combinations of multiple weaker kernels may outperform single strong kernels. For configurations with more kernels, the three-kernel classifier combinations of Config 12 and Config 14 exhibited stronger performance and stability. However, the four-kernel classifier was deemed optimal, as it demonstrated the most comprehensive data descriptive and learning capabilities. Despite Config 9 surpassing Config 15 in average sensitivity, considering overall stability, the four-kernel classifier was deemed to have the most robust performance.
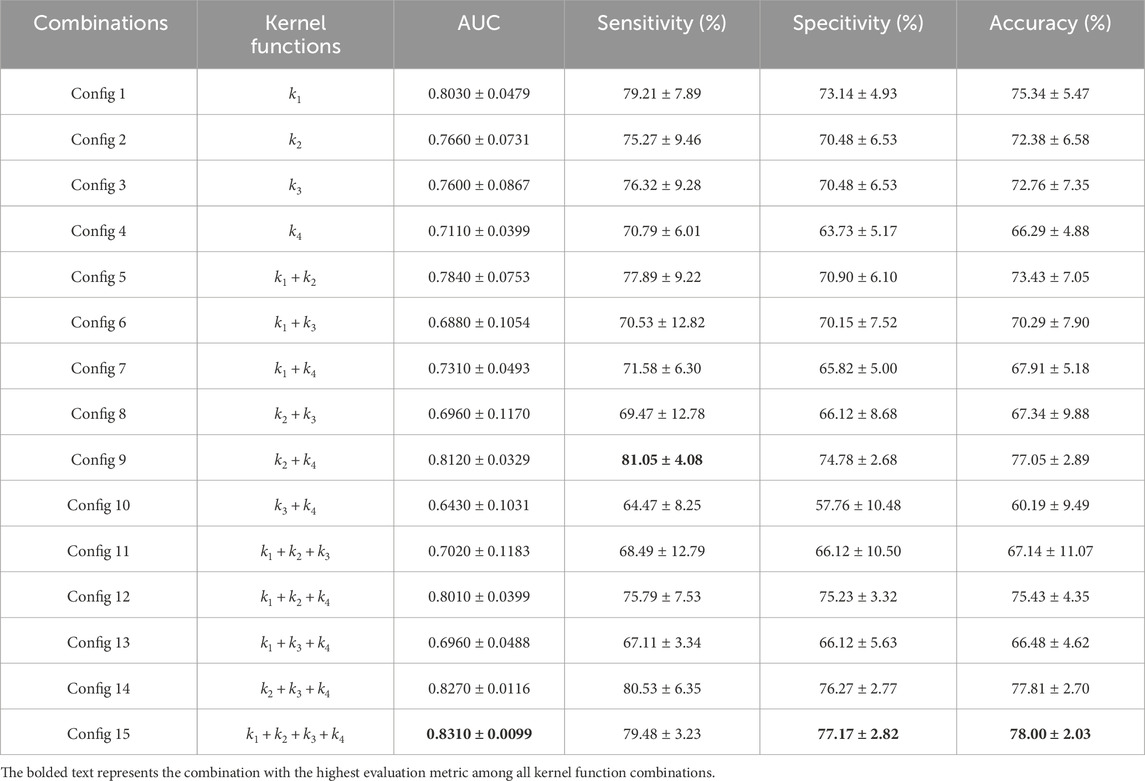
Table 2. The Fifteen combinations of kernel functions and mean and standard deviation of indexs of fifteen kernel function combinations in ten rounds of validation.
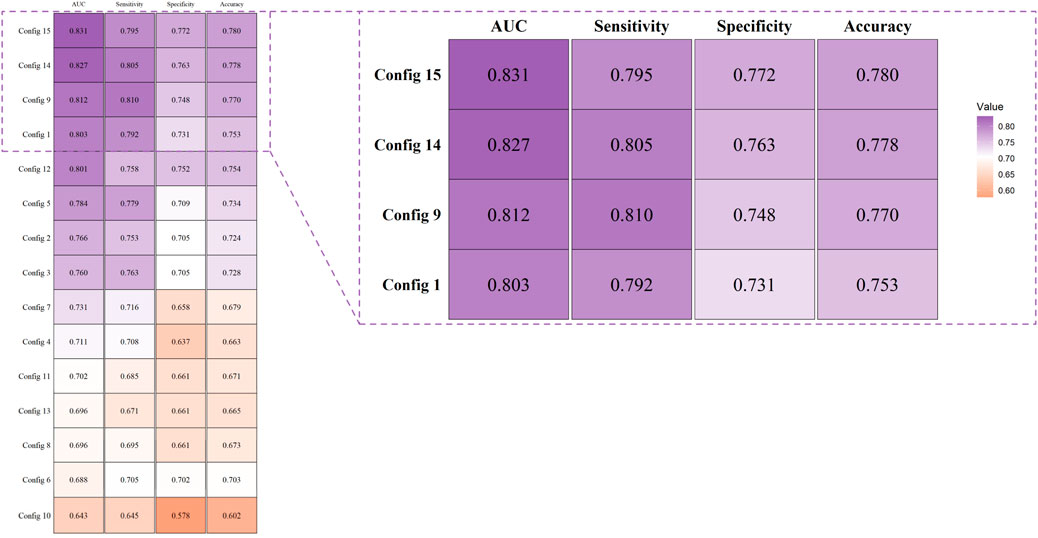
Figure 5. Evaluation and comparison of models were conducted using AUC, accuracy, sensitivity, and specificity.
From Figure 5 and Table 2, it can be observed that the four-kernel classifier simultaneously achieved the highest average AUC, specificity, and accuracy, with slightly inferior but more stable sensitivity. Therefore, we consider the four-kernel combination based on the Linear Kernel, Polynomial Kernel, Sigmoid Kernel, and Gaussian Kernel as the optimal kernel combination we sought. This classification model has been named MKSVRB (Multi-Kernel Support Vector Machine Model for Three-Year Recurrence Prediction of Budd-Chiari Syndrome) by us.
Model performance evaluation
After we selected the four-kernel classifier as our optimal model, we compared it with other commonly used machine learning models, including RF, XGBoost, and KNN, using the same ten rounds of validation approach to further validate its performance. The performance was evaluated based on the average and standard deviation of AUC, sensitivity, specificity, and accuracy of the ten results.
Figures 6a–e depicts the trend lines of the evaluation metrics for the four models across the ten validation rounds. From the figure, it is evident that compared to RF, XGBoost, and KNN, our model achieved better results in each metric in every validation round. Table 3 presents the average values and standard deviations of the evaluation metrics for the four models across the ten validation rounds. We can observe that our model exhibits greater advantages over all commonly used machine learning models. Figure 6f displays the ROC curves of the four machine learning models during the first validation round, while Figure 6g shows the confusion matrix of the MKSVRB model during the same validation round, further demonstrating the effectiveness of our approach.
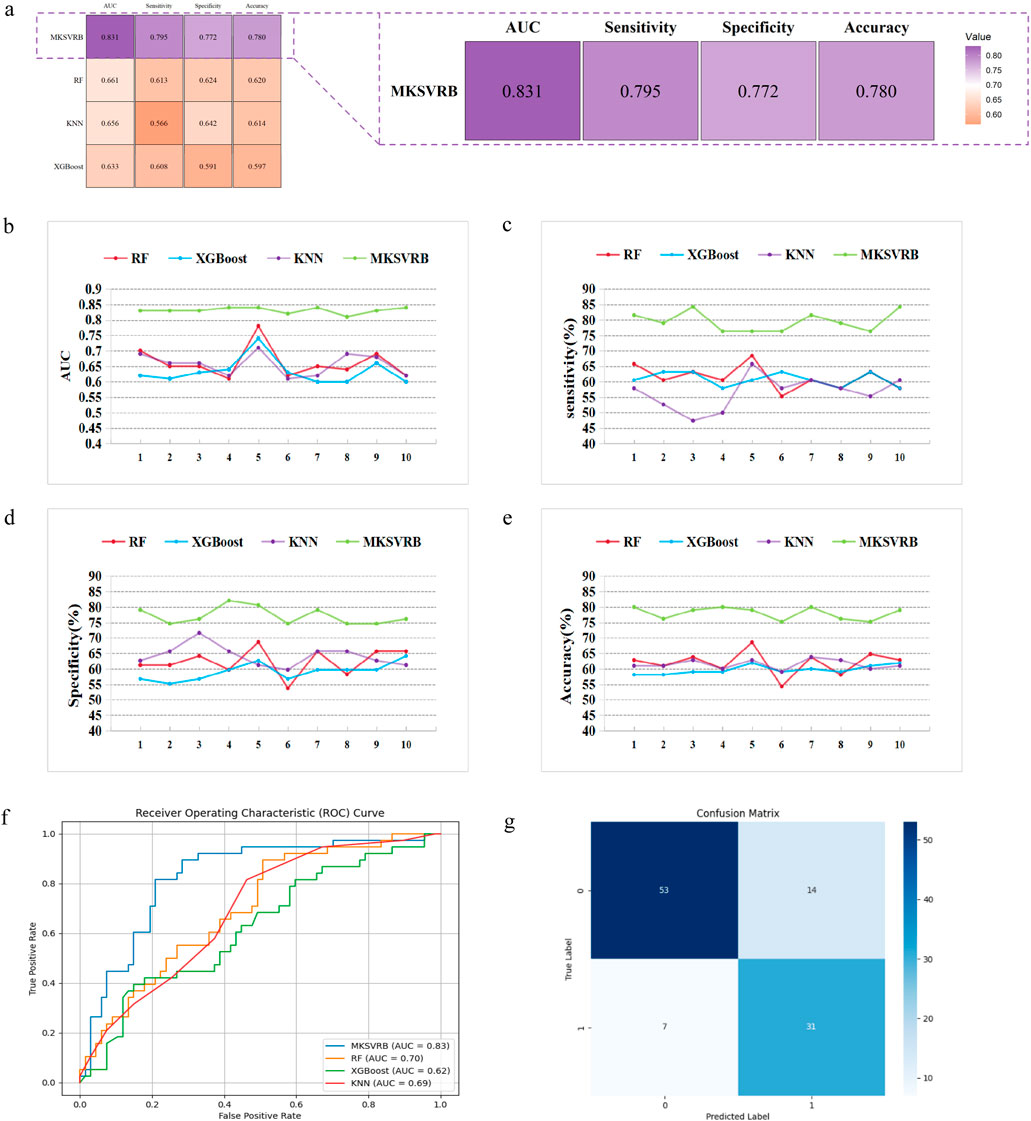
Figure 6. Model performance evaluation. (a) Evaluation and comparison of models were conducted using AUC, accuracy, sensitivity, and specificity. (b–e) Variations of index of MKSVRB Model and three other machine learning models in ten rounds of validation. (f) ROC curves for four machine learning models. (g) Confusion Matrix of MKSVRB Model.
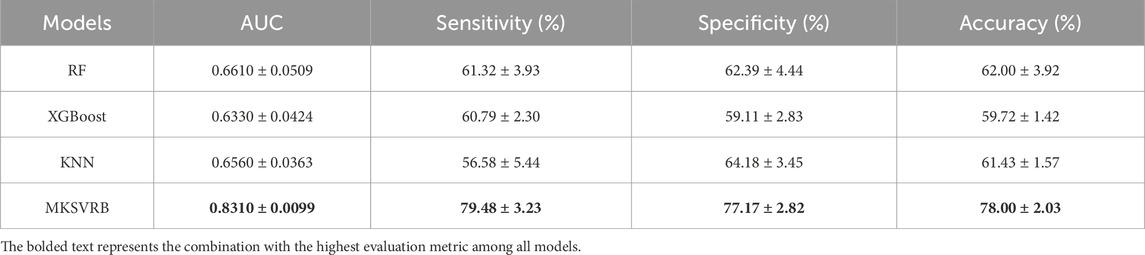
Table 3. Mean and standard deviation of index of four models.
To the best of our knowledge, prior to this study, the model constructed by Zhongkai Wang et al. was considered the optimal model in the field of predicting recurrence of Budd-Chiari syndrome. It outperformed traditional scoring models with an AUC of 0.82. Our model achieved an average performance of 0.831 across the ten validation rounds, indicating that our model can be regarded as a more reliable predictor for the recurrence of Budd-Chiari syndrome.
Meanwhile, compared to the AUCs of several prognostic scoring models in previous studies, such as the Child-Pugh score of 0.70, Clichy PI of 0.55, MELD score of 0.67, and Rotterdam score of 0.73, our model also demonstrates advantages (Wang et al., 2023).
Interpretability of feature importance
Kernel machines, as black-box models, can be effectively interpreted using SHAP values, a method proposed by Lundberg and Lee (2017). In Figure 7a, the mean SHAP values of the MKSVRB model are ranked in descending order to illustrate feature contributions in the test set. The analysis revealed that age exerted the strongest influence on model predictions, followed by ALB, NEU, AFP, and endovascular intervention type. Figure 7b further visualizes the impact of each feature on individual patients in the test cohort. The color gradient of data points reflects feature magnitudes, with red and blue representing values near the maximum and minimum, respectively, and intermediate values in purple. The corresponding SHAP values indicate both the direction and magnitude of each feature’s effect.
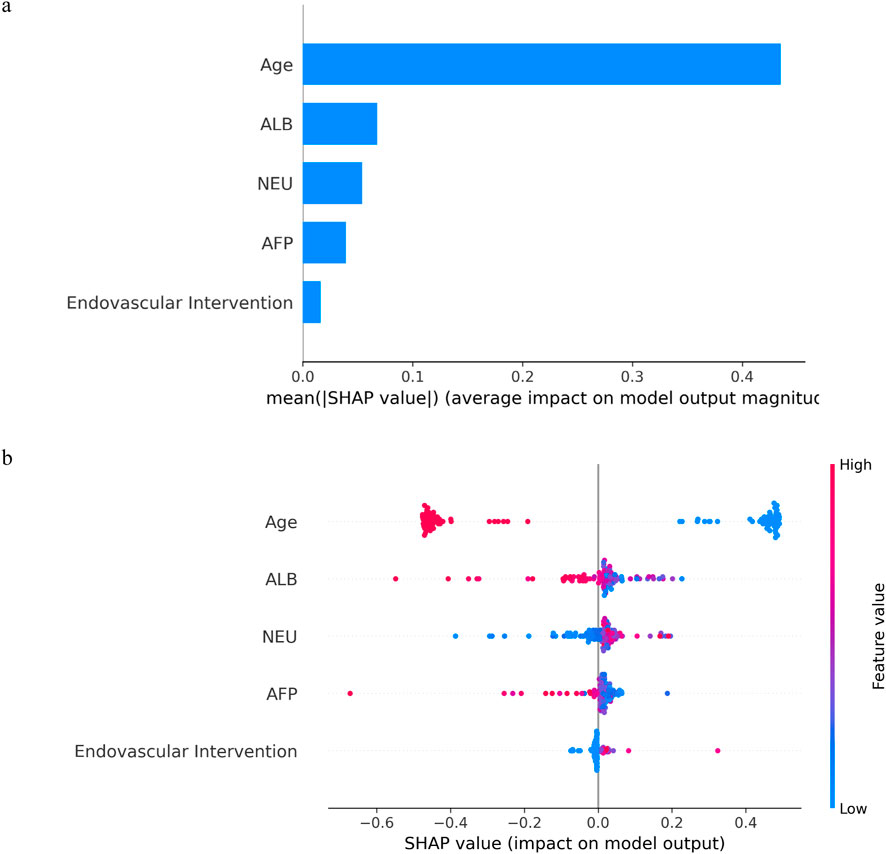
Figure 7. The model’s interpretation: (a) The importance ranking of variables according to the mean (|SHAP value|); (b) SHAP beeswarm summary plot for impact of each feature in each patient on model output.
As illustrated in the figures, advanced age and elevated ALB levels were identified as protective factors against recurrence in BCS patients, whereas higher NEU levels correlated with an increased likelihood of recurrence. Notably, lower AFP levels also showed a statistical association with recurrence risk. Among endovascular interventions, catheter-directed thrombolysis was associated with a higher recurrence rate compared to simple balloon dilation or stent implantation. The mechanistic underpinnings of these associations are discussed in detail in the second paragraph of the Discussion section.
Benefits of model application
Decision Curve Analysis (DCA) is a method for evaluating the clinical utility of predictive models in actual clinical decision-making scenarios. In contrast to metrics such as sensitivity, specificity, and the AUC, which measure the diagnostic accuracy of predictive models but fail to account for their clinical utility, DCA offers the advantage of integrating patient or decision-maker preferences into the analysis. It compares the net benefit of different predictive models at specific clinical decision thresholds, including treating all patients or treating none. Net benefit refers to the overall effect considering the benefits and harms of false positives and false negatives (Vickers and Elkin, 2006).
In Figure 8, we present the decision curves of our proposed model alongside three other machine learning models. It is evident that our model provides the highest net benefit for decisions regarding recurrence in patients with BCS across the widest range of probability thresholds, demonstrating its significant clinical decision-making utility.
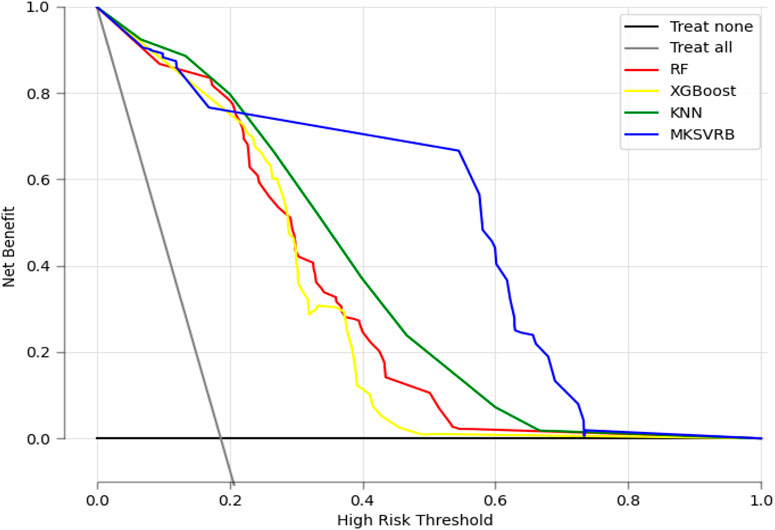
Figure 8. Decision curve analysis of the four prediction models. X-axis indicates the threshold probability for recurrence of BCS and y-axis represents the net benefit gained from intervening on patients with a risk of recurrence at or above the threshold probability. The curve “Treat all” represents the net benefit gained from intervening on all patients while he curve “Treat none” represents the net benefit gained from not intervening on any patients.
Deployment of the model
Our model can be accessed at https://mksvrb-5as8kyh4zie.streamlit.app/. It is divided into three sections. Firstly, Figure 9a illustrates the relationship plot between model scores and the risk of recurrence within 3 years, with a risk threshold set at 0.59. Figure 9b functions as a prediction module where patients sequentially input Age, Endovascular interventions, NEU level (x10^9/L), ALB level (g/L), and AFP level (ug/L). By clicking the predict button, the module assesses the risk of recurrence, categorizing it as high risk if above the risk threshold or low risk if below. Due to limitations in the study sample and considerations for accuracy, the predictor currently supports only simple balloon dilation, stent implantation, catheter-directed thrombolysis, and TIPS procedures, excluding others. Figure 9c displays the SHAP Force Plot after risk assessment for each patient, showing how each feature contributes to the risk of Budd-Chiari syndrome recurrence. A red arrow indicates a feature increases recurrence risk, while a blue arrow indicates a decrease. Bar length represents the magnitude of each feature’s effect on recurrence.
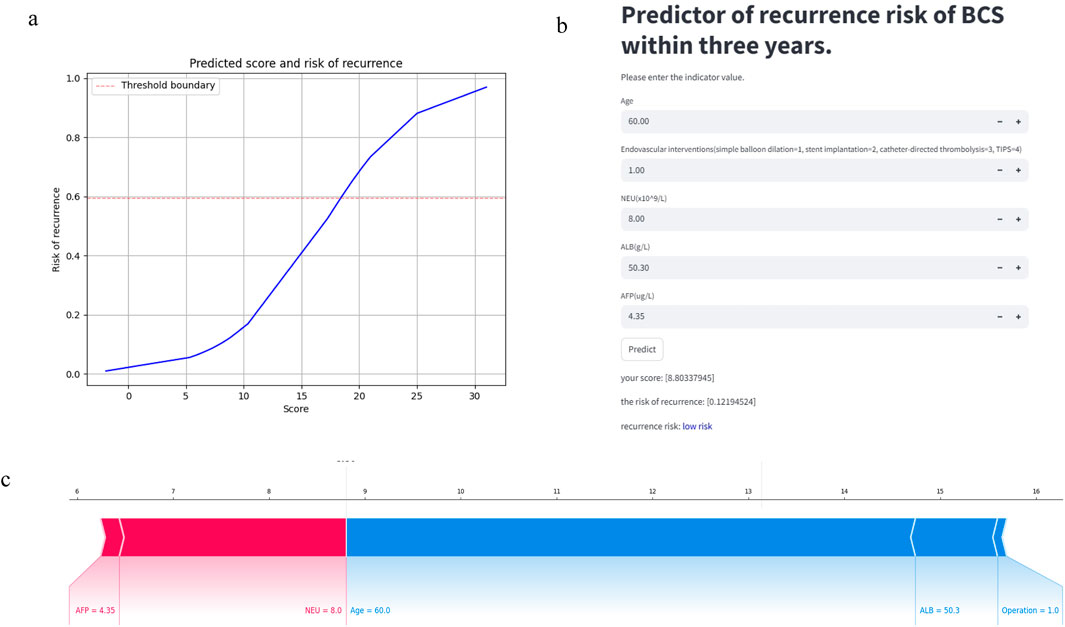
Figure 9. The predictor of recurrence risk of BCS within 3 years: (a) The relationship plot between predicted scores and recurrence risk. (b) The main part of predictor: Calculate the recurrence risk based on input values. (c) The SHAP Force Plot shows the contribution of each patient feature to the risk of recurrence of Budd-Chiari syndrome.
Discussion
In this article, our research introduced the MKSVRB model for predicting the recurrence of Budd-Chiari syndrome with 3 years. Through the detailed experiments encompassing kernel function combinations within our model and comparisons with other machine learning models, we demonstrated its superior performance.
Budd-Chiari syndrome is characterized by its rarity, significant regional variations, and complex etiology, leading to high variability in features (Menon et al., 2004). In terms of model variables, we found that older age may be a protective factor for disease recurrence, which could be related to the fact that Budd-Chiari syndrome is more common in middle-aged individuals (Macnicholas et al., 2012). ALB and NEU are traditional and classical indicators that are widely used in predicting the disease prognosis of liver disease patients. Many studies have confirmed that higher ALB levels are associated with liver function recovery (Su et al., 2019). Liver dysfunction typically causes an increase in AFP levels; however, in extreme cases, such as severe liver failure, the synthesis and release of AFP may decrease. In terms of endovascular interventions, our study found that compared to simple balloon dilation, stent implantation had a lower likelihood of recurrence, while catheter-directed thrombolysis showed a higher risk. The result is similar to a study comparing the long-term prognosis of acute venous thrombosis patients who underwent pharmacomechanical catheter-directed thrombolysis (PCDT) or no PCDT. In this study, there was no significant difference in the recurrence rate between the PCDT group and the no PCDT group within 24 months (Kearon et al., 2019). In another experiment comparing the recurrence rates of catheter-directed thrombolysis and balloon-occluded thrombolysis in patients with Budd-Chiari syndrome, catheter-directed thrombolysis also showed a higher recurrence rate. This higher recurrence rate may be related to the persistent microthrombi on the stent wall, which could serve as a focus for recurrence (Mukund et al., 2024).
Consequently, common machine learning models, including RF, XGBoost, and KNN, struggle to provide accurate predictions for recurrence of Budd-Chiari syndrome. The EasyMKL algorithm,as proposed by Fabio Aiolli and Michele Donini, proves effective for making predictions on small, noisy datasets (Aiolli and Donini, 2015). It aligns well with our data compared to other MKL algorithms. By jointly optimizing internal parameters for kernel functions and the balance parameter in EasyMKL, we combined the PSO algorithm with EasyMKL algorithm, and finally achieved satisfactory results.
On the other hand, we have explored the selection of internal kernel function combinations in SVM for predicting recurrence of Budd-Chiari syndrome.By comparing combinations of four common kernel functions, we found that the Linear Kernel performed best among single-kernel SVMs, but a composite kernel function based on all four base kernels was more suitable for the interrelation of features in Budd-Chiari syndrome data. In terms of combining multiple kernels, our research found that convex combinations of multiple kernels are not always effective. The Linear Kernel performed the best among all base kernels, but the performance of the combination with the Sigmoid Kernel, Config 6, was far worse than either kernel alone, nearly achieving the lowest rating among all kernel combinations. Similarly, Config 8 and Config 10 also performed much worse than their constituent base kernels. This phenomenon was also observed in three-kernel combinations: Config 11 and Config 13 performed lower than any single base kernel in their composition.
However, this does not imply that multi-kernel learning itself is flawed. Config 9, Config 12, Config 14, and ultimately our desired four-kernel classifier are excellent success cases of multi-kernel learning, where combinations of base kernels have created more effective new hybrid kernels. Additionally, Config 5 and Config 7 produced more moderate performance between the two base kernels.The question of why strong kernel combinations can pruduce weak hybrid kernels, as well as potentially stronger kernels, and why the same is true for weak kernel combinations, remains an unsolved problem in machine learning. Internal kernel machines are still considered a black box, making this issue difficult to explain. Kernel tricks cleverly calculate the inner product of data features in an infinite-dimensional feature space, which we typically cannot fully imagine or position (Johnson et al., 2020).
In addition, we have conducted clinical decision analysis to assess the practical clinical utility of the model. After we have determined that the model would contribute to clinical decision-making, we deployed it online for use by all doctors and patients in need. We aim for our model to assist in evaluating Budd-Chiari syndrome patients with high-risk recurrence factors, supporting personalized treatment and prognosis decisions for each patient.
Conclusion
In this paper, we have explored risk factors influencing relapse of BCS patients and proposed a MKSVRB model that effectively predicts the recurrence of BCS patients within 3 years. Experimental results demonstrate that our model outperforms previous prediction methods and other machine learning models, demonstrating significant potential for clinical application. We hope that our model will contribute to prognosis decision support and recurrence prevention for Budd-Chiari syndrome patients.
Data availability statement
The original contributions presented in the study are included in the article/supplementary material, further inquiries can be directed to the corresponding authors.
Ethics statement
The study was approved by the Institutional Review Board of the Affiliated Hospital of Xuzhou Medical University (Jiangsu, China; XYFY2023-KL188-01), with a waiver for informed consent. The studies were conducted in accordance with the local legislation and institutional requirements. Written informed consent for participation was not required from the participants or the participants’ legal guardians/next of kin in accordance with the national legislation and institutional requirements.
Author contributions
WX: Data curation, Formal Analysis, Methodology, Validation, Visualization, Writing – original draft, Writing – review and editing. BX: Data curation, Formal Analysis, Investigation, Methodology, Supervision, Validation, Visualization, Writing – review and editing, Funding acquisition, Resources. HW: Data curation, Investigation, Methodology, Supervision, Validation, Writing – review and editing, Funding acquisition, Project administration, Resources. XZ: Data curation, Formal Analysis, Project administration, Supervision, Validation, Writing – review and editing, Investigation, Methodology. JQ: Data curation, Formal Analysis, Supervision, Validation, Investigation, Methodology, Writing – review and editing. GZ: Data curation, Formal Analysis, Project administration, Supervision, Validation, Visualization, Writing – review and editing. PY: Data curation, Formal Analysis, Resources, Supervision, Validation, Writing – review and editing. SL: Data curation, Formal Analysis, Funding acquisition, Investigation, Methodology, Project administration, Resources, Software, Supervision, Validation, Writing – review and editing. YJ: Conceptualization, Data curation, Formal Analysis, Funding acquisition, Investigation, Methodology, Project administration, Resources, Software, Supervision, Validation, Visualization, Writing – review and editing.
Funding
The author(s) declare that financial support was received for the research and/or publication of this article. This work has been supported by grants from the Medical Technology Innovation Project of Xuzhou Municipal Health Commission (XWKYHT20230072), Construction Project of High Level Hospital of Jiangsu Province (GSPSJ20240805) and the Postgraduate Research & Practice Innovation Program of Jiangsu Province (SJCX22_1276).
Acknowledgments
We would like to extend our sincere gratitude to the authors of the EasyMKL algorithm, which is an open-source project published on GitHub. We express our heartfelt appreciation for their efforts in making advanced algorithms accessible to the research community.
Conflict of interest
The authors declare that the research was conducted in the absence of any commercial or financial relationships that could be construed as a potential conflict of interest.
Generative AI statement
The author(s) declare that no Generative AI was used in the creation of this manuscript.
Publisher’s note
All claims expressed in this article are solely those of the authors and do not necessarily represent those of their affiliated organizations, or those of the publisher, the editors and the reviewers. Any product that may be evaluated in this article, or claim that may be made by its manufacturer, is not guaranteed or endorsed by the publisher.
References
Aiolli F., Donini M. (2015). EasyMKL: a scalable multiple kernel learning algorithm. Neurocomputing 169, 215–224. doi:10.1016/j.neucom.2014.11.078
Aiolli F., San Martino G., Sperduti A. (2008). A kernel method for the optimization of the margin distribution. Icann '08, 305–314. doi:10.1007/978-3-540-87536-9_32
Ali Ahmadi M., Zendehboudi S., Lohi A., Elkamel A., Chatzis I. (2013). Reservoir permeability prediction by neural networks combined with hybrid genetic algorithm and particle swarm optimization. Geophys. Prospect. 61, 582–598. doi:10.1111/j.1365-2478.2012.01080.x
Amari S., Wu S. (1999). Improving support vector machine classifiers by modifying kernel functions. Neural Netw. 12 (6), 783–789. doi:10.1016/s0893-6080(99)00032-5
Bucak S. S., Rong J., Jain A. K. (2014). Multiple kernel learning for visual object recognition: a review. IEEE Trans. Pattern Anal. Mach. Intell. 36 (7), 1354–1369. doi:10.1109/TPAMI.2013.212
Carneiro M. G., Cheng R., Zhao L., Jin Y. (2019). Particle swarm optimization for network-based data classification. Neural Netw. 110, 243–255. doi:10.1016/j.neunet.2018.12.003
Collazos-Huertas D., CáRDENAS-PeñA D., Castellanos-Dominguez G. (2019). Instance-based representation using multiple kernel learning for predi cting conversion to alzheimer disease. Int. J. Neural Syst. 29 (2), 1850042. doi:10.1142/S0129065718500429
Deo R. C. (2015). Machine learning in medicine. Circulation 132 (20), 1920–1930. doi:10.1161/CIRCULATIONAHA.115.001593
Donini M., Monteiro J. M., Pontil M., Hahn T., Fallgatter A. J., Shawe-Taylor J., et al. (2019). Combining heterogeneous data sources for neuroimaging based diagnosis [J]. Nueroimage. 15 (20), 195–215.
Goel R. M., Johnston E. L., Patel K. V., Wong T. (2015). Budd-Chiari syndrome: investigation, treatment and outcomes. Postgrad. Med. J. 91, 692–697. doi:10.1136/postgradmedj-2015-133402
Handelman G. S., Kok H. K., Chandra R. V., Razavi A. H., Lee M. J., Asadi H. (2018). eDoctor: machine learning and the future of medicine. J. Intern Med. 284 (6), 603–619. doi:10.1111/joim.12822
Hou J., Gao H., Li X. (2018). Feature combination via clustering. IEEE Trans. neural Netw. Learn. Syst. 29 (4), 896–907. doi:10.1109/TNNLS.2016.2645883
Jamin A., Abraham P., Humeau-Heurtier A. (2021). Machine learning for predictive data analytics in medicine: a review i llustrated by cardiovascular and nuclear medicine examples. Clin. Physiol. Funct. Imaging 41 (2), 113–127. doi:10.1111/cpf.12686
Janssen H. L., Garcia-Pagan J. C., Elias E., Mentha G., Hadengue A., Valla D. C., et al. (2003). Budd-Chiari syndrome: a review by an expert panel. J. hepatology 38 (3), 364–371. doi:10.1016/s0168-8278(02)00434-8
Johnson J. E., Laparra V., PéREZ-Suay A., Mahecha M. D., Camps-Valls G. (2020). Kernel methods and their derivatives: concept and perspectives for the earth system sciences [J]. PLoS One 15 (10), e0235885. doi:10.1371/journal.pone.0235885
Kearon C., Gu C.-S., Julian J. A., Goldhaber S. Z., Comerota A. J., Gornik H. L., et al. (2019). Pharmacomechanical catheter-directed thrombolysis in acute femoral-pop liteal deep vein thrombosis: analysis from a stratified randomized tri al. Thromb. Haemost. 119 (4), 633–644. doi:10.1055/s-0039-1677795
Kennedy J., Eberhart R. (1995). “Particle swarm optimization,” in Proceedings of the proceedings of ICNN'95 - international conference on neural networks.
Kingsbury N., Tay D. B. H., Palaniswami M. (2005). “Multi-scale kernel methods for classification,” in Proceedings of the 2005 IEEE workshop on machine learning for signal processing, F 28-28 sept, 2005.
Lanckriet G. R. G., Cristianini N., Bartlett P., Ghaoui L. E., Jordan M. I. (2004). Learning the kernel matrix with semidefinite programming [J]. J. Mach. Learn Res. 5, 27–72.
Lundberg S. M., Lee S.-I. (2017). A unified approach to interpreting model predictions. Nips 17, 4768–4777. doi:10.48550/arXiv.1705.07874
Macnicholas R., Olliff S., Elias E., Tripathi D. (2012). An update on the diagnosis and management of Budd-Chiari syndrome. Expert Rev. Gastroenterol. Hepatol. 6 (6), 731–744. doi:10.1586/egh.12.56
Menon K. V. N., Shah V., Kamath P. S. (2004). The Budd-Chiari syndrome. N. Engl. J. Med. 350, 578–585. doi:10.1056/NEJMra020282
Mukund A., Yadav T., Singh S. P., Shasthry S. M., Maiwall R., Patidar Y., et al. (2024). Comparison of balloon-occluded thrombolysis with catheter-directed thr ombolysis in patients of budd-chiari syndrome with occluded direct int rahepatic portosystemic shunt. Indian J. Radiol. Imaging 34 (1), 25–31. doi:10.1055/s-0043-1770343
Pace F., Santilano A., Godio A. (2021). A review of geophysical modeling based on particle swarm optimization. Surv. Geophys 42 (3), 505–549. doi:10.1007/s10712-021-09638-4
Pavlidis P., Weston J., Cai J., Grundy W. N. (2001). Gene functional classification from heterogeneous data [J]. Recomb. '01, 249–255. doi:10.1145/369133.369228
Scholkopf B., Mika S., Burges C. J. C., Knirsch P., Müller K. R., Rätsch G., et al. (1999). Input space versus feature space in kernel-based methods. IEEE Trans. Neural Netw. 10 (5), 1000–1017. doi:10.1109/72.788641
Shukla A., Shreshtha A., Mukund A., Bihari C., Eapen C. E., Han G., et al. (2021). Budd-Chiari syndrome: consensus guidance of the Asian Pacific Associat ion for the study of the liver (APASL). Hepatol. Int. 15 (3), 531–567. doi:10.1007/s12072-021-10189-4
Sonnenburg S., Rätsch G., Schäfer C., Schölkopf B. (2006). Large scale multiple kernel learning [J]. J. Mach. Learn Res. 7, 1531–1565. doi:10.1007/s10450-006-0008-8
Su L., Hu L., Liang P., Wu Y., Sun Q., Gao J. (2019). Clinical efficacy of spectral computed tomography for evaluating liver function in patients with budd-chiari syndrome. Acad. Radiol. 26 (4), 461–466. doi:10.1016/j.acra.2018.05.003
Valla D.-C. (2002). Hepatic vein thrombosis (Budd-Chiari syndrome). Semin. Liver Dis. 22, 5–14. doi:10.1055/s-2002-23202
Vickers A. J., Elkin E. B. (2006). Decision curve analysis: a novel method for evaluating prediction mode ls. Med. Decis. Mak. 26 (6), 565–574. doi:10.1177/0272989X06295361
Wang Z., Wang Z., Zhang Z., Li J., Pan Z., Liu A., et al. (2023). Establishment and validation of a prediction model for the first recurrence of Budd-Chiari syndrome after endovascular treatment: a large sample size. single-center Retrosp. study [J]. 1936–0541. doi:10.1007/s12072-022-10464-y
Keywords: Budd-Chiari syndrome, recurrence, machine learning, multiple kernel learning, predict
Citation: Xue W, Xu B, Wang H, Zhu X, Qin J, Zhou G, Yu P, Li S and Jin Y (2025) Development and validation of a machine learning model based on multiple kernel for predicting the recurrence risk of Budd-Chiari syndrome. Front. Physiol. 16:1589469. doi: 10.3389/fphys.2025.1589469
Received: 10 March 2025; Accepted: 12 May 2025;
Published: 30 May 2025.
Edited by:
Ahsan H. Khandoker, Khalifa University, United Arab EmiratesCopyright © 2025 Xue, Xu, Wang, Zhu, Qin, Zhou, Yu, Li and Jin. This is an open-access article distributed under the terms of the Creative Commons Attribution License (CC BY). The use, distribution or reproduction in other forums is permitted, provided the original author(s) and the copyright owner(s) are credited and that the original publication in this journal is cited, in accordance with accepted academic practice. No use, distribution or reproduction is permitted which does not comply with these terms.
*Correspondence: Yingliang Jin, c3Bhcms5ODA5QDEyNi5jb20=; Shengli Li, bGlzaGVuZ2xpNDAxQDE2My5jb20=
†These authors share first authorship