 Vishaal Dhamotharan1
 Hao-Min Cheng2
 Shih-Hsien Sung2
 Chen-Huan Chen2
 Cederick Landry3Mark Freithaler1
 Aman Mahajan1,4
 Sanjeev G. Shroff1
 Jin-Oh Hahn5
 Ramakrishna Mukkamala1,4*
- 1Department of Bioengineering, University of Pittsburgh, Pittsburgh, PA, United States
- 2School of Medicine, National Yang Ming Chiao Tung University, Taipei, Taiwan
- 3Department of Mechanical Engineering, University of Sherbrooke, Sherbrooke, QC, Canada
- 4Department of Anesthesiology and Perioperative Medicine, University of Pittsburgh, Pittsburgh, PA, United States
- 5Department of Mechanical Engineering, University of Maryland, College Park, MD, United States
Objective: Oscillometry is the most popular blood pressure (BP) measurement method. Conventionally, BP is computed from the oscillation height versus cuff pressure function (“height oscillogram”). However, the oscillation shape also changes with cuff pressure. The objectives were to mathematically model oscillation shape and height variations as a function of cuff pressure and analyze these models using patient data.
Methods: The patient data comprised oscillometric arm cuff pressure and invasive brachial BP waveforms from 109 patients with diverse BPs. The data were analyzed to show that the oscillation area versus cuff pressure function (“area oscillogram”) in particular could be reliably constructed while offering distinct information to the height oscillogram. An analytical model of the area oscillogram was developed with four unknown parameters representing the widths of the brachial artery compliance curve over positive and negative transmural pressure ranges and systolic and diastolic BPs. With invasive systolic and diastolic BPs as inputs, this model and a previous height oscillogram model with the same four parameters, were evaluated in terms of fitting individual patient oscillograms. The impact of key assumptions of the models was evaluated as well.
Results: The area and height oscillogram models fitted the patient data well with errors of 6.9% ± 0.3% and 8.7% ± 0.4%, respectively. Cuff-arm-artery viscoelasticity affected the height oscillogram model fitting, while cuff-arm system nonlinearity may affect area oscillogram model parameter estimates.
Conclusion: Despite simplifying assumptions, the proposed area and previous height oscillogram models can reproduce measured patient oscillograms well. These models may ultimately help improve oscillometric BP measurement accuracy.
1 Introduction
Oscillometry has become the preferred non-invasive method for measuring systemic arterial BP, as it is the easiest to use, low in cost, and relatively accurate. Oscillometric arm cuff BP monitors are widely employed in home, office, bedside, and ambulatory settings (Nitzan, 2011). Moreover, oscillometry holds the potential for cuffless BP measurement using everyday devices (Chandrasekhar et al., 2018a; Landry et al., 2024a; Xuan et al., 2023; Panula et al., 2020; Chandrasekhar et al., 2018b).
The oscillometric principle measures BP by exploiting the sigmoidal relationship between blood volume and transmural pressure in arteries, where transmural pressure is the internal BP minus the external pressure. A typical oscillometric device operates by rapidly inflating a cuff around the upper arm to supra-systolic pressures to occlude the underlying brachial artery. The device then deflates the cuff slowly at a rate of 2–4 mmHg/s to a pressure below the diastolic level. As the cuff deflates, the transmural pressure increases, altering the blood volume pulsations. These variable blood volume oscillations proportionally change the volume enclosed by the cuff, thereby inducing oscillations in the cuff pressure. The recorded cuff pressure measurement during the deflation is processed as follows: (i) band-pass filtering to extract the cuff pressure oscillations as a surrogate for the blood volume oscillations and (ii) low-pass filtering to obtain the applied external pressure. These data are then used to compute BP via an algorithm.
Conventional oscillometric algorithms focus on the variable peak-to-peak height of the cuff pressure oscillations relative to the applied cuff pressure (i.e., “height oscillogram”). Popular algorithms that use the height oscillogram to compute BP include the maximum amplitude (Drzewiecki et al., 1994; Mauck et al., 1980; Forouzanfar et al., 2015), fixed ratios (Drzewiecki et al., 1994; Forouzanfar et al., 2015; Geddes et al., 1982), and derivative (Forouzanfar et al., 2015; Drzewiecki and Bronzino, 2006) algorithms. These and other algorithms are population-based or susceptible to noise, leading to significant BP measurement inaccuracies especially beyond normal BP ranges (van Montfrans, 2001; Pickering et al., 2005). However, accurate BP measurement is crucial for reducing the global burden of cardiovascular disease (Mills et al., 2016; Padwal et al., 2019).
Figure 1A illustrates an exemplary oscillometric cuff pressure measurement showing variations in the morphology of the oscillometric pulses with decreasing external pressure beyond merely the height variations. The oscillations appear relatively narrow at higher cuff pressures and become wider as the cuff deflates to lower cuff pressures, as shown in Figure 1B. These changes suggest that there may be shape features beyond height that could facilitate the BP computation. We recently analyzed finger oscillometric measurements to show experimentally that analysis of oscillation width variations can yield accurate diastolic BP estimates (Freithaler et al., 2023). Other recent studies have also leveraged shape-based features of individual oscillometric pulses, including oscillation duration, area under the oscillation, and oscillation upstroke and downstroke characteristics, primarily in the context of machine learning-based BP computation (Argha et al., 2019; Celler et al., 2020; Lin et al., 2014).

Figure 1. (A) Exemplary cuff pressure oscillations and applied cuff pressure measured with an upper arm oscillometric device. (B) Variation in the shape of the oscillometric pulses at different cuff pressures.
Mathematical modeling of oscillometry can provide a deeper understanding of the underlying principle and aid in developing more accurate algorithms. Various models, ranging from simple to complex, have been developed (Drzewiecki et al., 1994; Mauck et al., 1980; Chandrasekhar et al., 2019; Raamat et al., 2011; Ursino and Cristalli, 1996; Babbs, 2012; Liu et al., 2016a; Liu et al., 2016b; Forouzanfar et al., 2012). Complex models allow for detailed understanding of all factors that influence the cuff pressure oscillations. However, simple models carry different advantages. We and others previously developed a simple analytical model for the height oscillogram using a parametric sigmoidal function that relates transmural pressure to arterial blood volume (Babbs, 2012; Dhamotharan et al., 2023). We used our parsimonious model to derive simple formulas for readily explaining the three aforementioned algorithms (Chandrasekhar et al., 2019). Furthermore, we and others determined BP and arterial properties by optimally fitting a parsimonious model to the measured height oscillogram, allowing for a patient-specific algorithm (Babbs, 2012; Liu et al., 2016a; Liu et al., 2016b; Forouzanfar et al., 2012; Balasingam et al., 2011). However, to our knowledge, all previous oscillometric modeling efforts have exclusively focused on the height oscillogram.
In this study, we investigated simple shape features of the oscillometric pulses obtained from patient arm cuff pressure measurements. We found that the area under the pulses, when plotted against external pressure, exhibited a consistent inverted U-shape similar to the height oscillogram but with a distinct and easily detectable maximum point. We then developed an analytical model for the “area oscillogram”. We evaluated this model and compared it to our previous height oscillogram model by fitting both models to the patient oscillometric data. Finally, we performed extensive analyses to quantify the impact of key model assumptions on the model fitting. This study may possibly be the first or at least amongst the first to present an analytical model of the area oscillogram or any shape oscillogram for that matter.
2 Methods
2.1 Patient data
We utilized previously collected high-fidelity data from 128 cardiac catheterization patients for this study. Detailed descriptions of the data and institutional review board (IRB)-approved data collection procedures are available elsewhere (Liu et al., 2016a; Liu et al., 2016b). Briefly, the de-identified patient data comprise single or two consecutive oscillometric cuff pressure waveforms obtained through fast inflation-slow deflation-constant cuff pressure (60 mmHg) cycles of an upper arm cuff device (Watch BP Office, Microlife AG, Switzerland or VP-1000, Omron Colin, Japan). The data include gold standard brachial artery BP waveforms simultaneously measured from the contralateral arm via a micromanometer tipped catheter (SPC-320, Millar Instruments, United States). The measurements were available at baseline conditions and after administration of sublingual nitroglycerin to reduce BP in a subset of the patients. The sampling rate for all waveforms was 250 Hz.
We inspected the data for: (i) inter-arm cuff BP differences of >10 mmHg (Orme et al., 1999), (ii) significant artifact or arrhythmias in the cuff pressure waveforms, (iii) significant brachial BP waveform artifacts, and (iv) oscillograms with incomplete inverted U-shape (>80% amplitude on either side of the maximum) due to insufficient cuff pressure range. After excluding these measurements, a total of 173 waveform pairs from 109 patients remained for analysis. The patient demographics were as follows: 76% male, 61 ± 13 (mean ± SD) years, 163 ± 8 cm, 72 ± 12 kg with arm circumferences of 29 ± 3 cm. The patients had clinical diagnoses of mainly hypertension (61%), coronary artery disease (48%), dyslipidemia (39%) and/or diabetes (24%) and were on various medications. The invasive BP values were 138 ± 20 mmHg for systolic BP, 72 ± 9 mmHg for diastolic BP, and 66 ± 19 mmHg for pulse pressure (PP).
2.2 Preliminary analysis to assess shape features of oscillometric pulses
We first qualitatively examined four simple features of the oscillometric pulses: (i) oscillation height, (ii) oscillation area, calculated by integrating the pulse amplitudes relative to a line that connects the leading and trailing feet of the pulse over its duration, (iii) oscillation area-to-height ratio, which represents the effective oscillation width, and (iv) ratio of the oscillation areas to the left and right of the systolic peak, which reflects pulse asymmetry. Figure 2A illustrates how these features are computed from an oscillometric pulse. As described below, we extracted clear oscillations from the cuff pressure waveforms; calculated the four features for each oscillation; and plotted them against the applied cuff pressure to generate their respective oscillograms. We aligned each of the oscillograms for the 173 measurements by shifting their fiducial points (maximum for the height, area, and area ratio oscillograms and minimum for the area-to-height ratio oscillogram) to 0 mmHg and superimposed all 173 shifted oscillograms on the same plot, as shown in Figure 2B. Similar to the height oscillogram, the area oscillogram exhibited inverted U-shape.
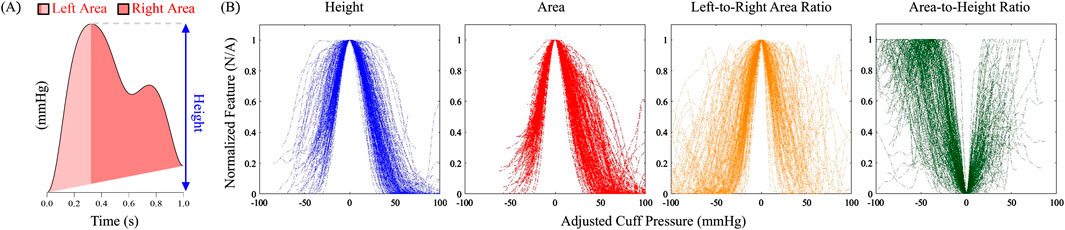
Figure 2. (A) Computation of simple shape features of an oscillometric pulse for which analytical modeling is feasible. (B) Four features plotted against adjusted cuff pressure for all 173 patient oscillometric measurements in the study. The cuff pressure was adjusted so that the main fiducial marker of all the plots for each feature occurred at 0 mmHg.
Both the height and area oscillograms demonstrated consistency across the data with relatively low scatter in the noise-prone low and high cuff pressure ranges, thereby allowing for robust construction. In contrast, the area ratio and area-to-height ratio oscillograms exhibited greater variability across the measurements, indicating that these ratios are more susceptible to signal artifacts and hence may not be reliably formed. Based on the relative quality of the oscillograms, we concluded that the area ratio and area-to-height ratio oscillograms are not ideal for modeling efforts and thus focused on the area oscillogram.
We compared the area and height oscillograms. As indicated in Figure 3A, the area oscillogram was typically left-shifted relative to the height oscillogram. The maximum amplitudes of the area and height oscillograms occurred at different cuff pressures denoted by
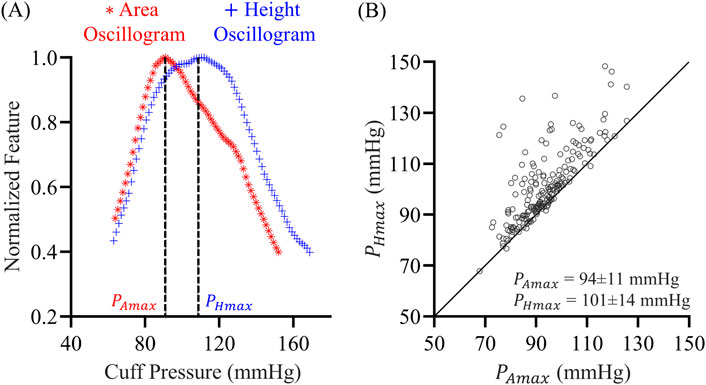
Figure 3. (A) Exemplary normalized area oscillogram (oscillation area vs. cuff pressure function) and normalized height oscillogram (oscillation height vs. cuff pressure function) measurements. These oscillograms were constructed from the cuff pressure measurements in Figure 1A.
2.3 Analytical modeling of the area oscillogram
Our modeling began with the sigmoidal relationship between transmural pressure (
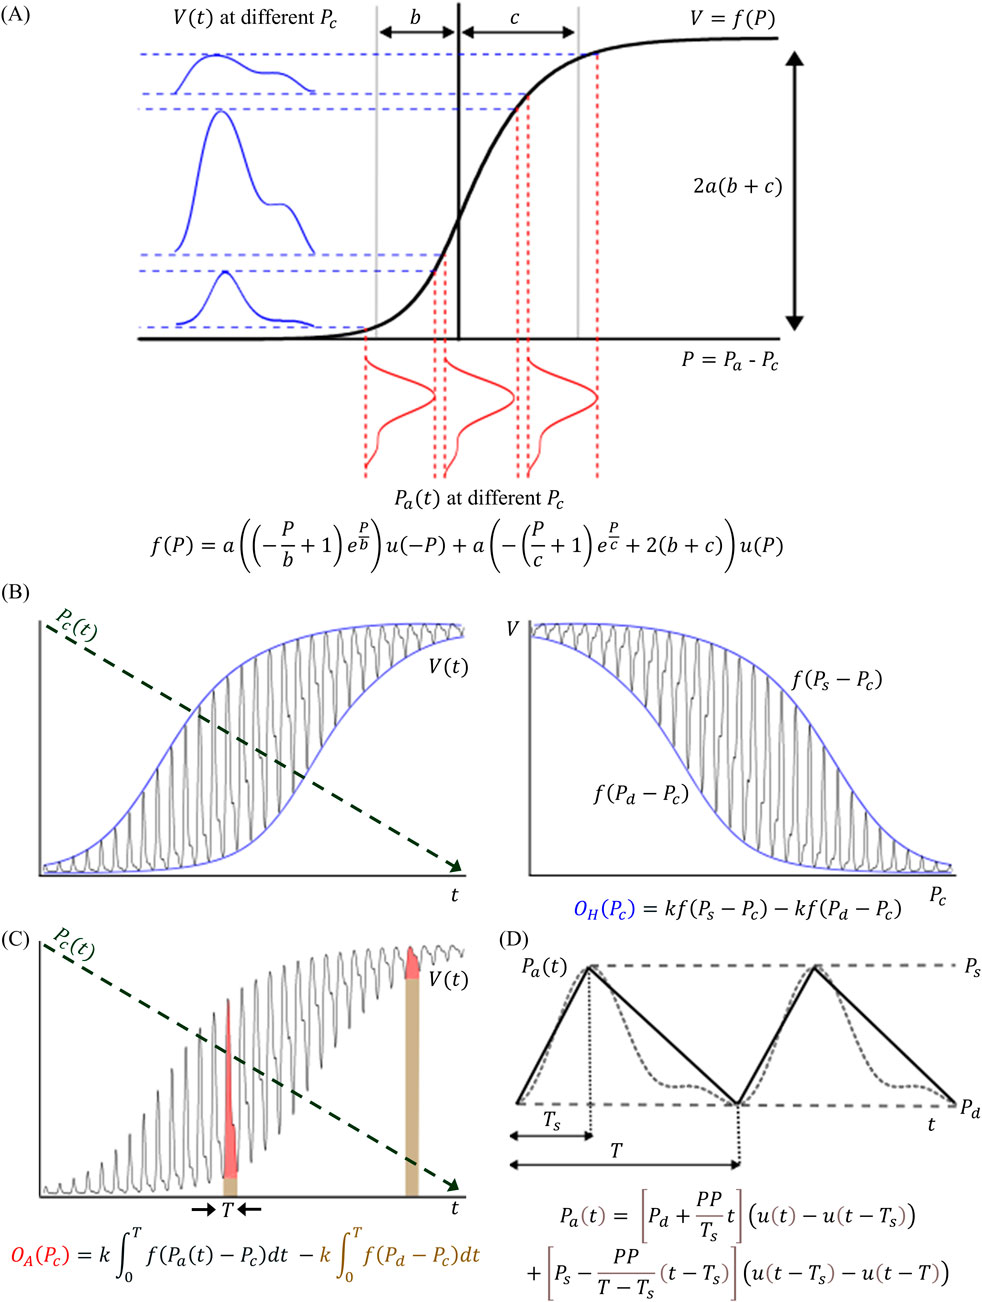
Figure 4. (A) The oscillometric models in this study are based on the sigmoidal relationship (f(∙)) from transmural pressure (
Here,
To arrive at our previous model of the height oscillogram (
The derivative of
where
where
To formulate a new analytical model of the area oscillogram (
The integral defined by Equation 6 with Equation 4 is of the form
where
Note that the parameter
Differentiating Equation 5 and Equation 8 with respect to
Equation 10 is not analytically solvable for
where
Equation 13 may likewise not be analytically solvable. However, under typical parameter values for
These final formulas for
2.4 Model evaluation
We evaluated the area and height oscillogram models in terms of their ability to fit the respective patient oscillograms. We constructed the oscillograms from the oscillometric measurements, as shown in Figure 5, using an automated algorithm (Babbs, 2012; Dhamotharan et al., 2023). This algorithm included trimming of the flat tails that can appear at either end of the oscillograms. These tails are not accounted for by our modeling and due to, for example, pulsations from proximal arteries to the cuff or lower pressure vessels under the cuff. We then normalized the trimmed oscillograms by their respective maximum amplitudes. We likewise normalized the oscillogram models of Equations 5, 8. This normalization step eliminated the
where
where

Figure 5. Automated algorithm to form the measured area oscillogram and height oscillogram from the cuff pressure waveform. The cuff pressure waveform, which is measured during fast cuff inflation and then slow cuff deflation followed by a constant cuff pressure of 60 mmHg is analyzed to form tail-trimmed oscillogram measurements. Important user-selected variables: Band-pass filter of 6th order with cut-off frequencies of 0.75 and 5 Hz (step 2); amplitude thresholds < 0.2 mmHg for peaks and > −0.1 mmHg for valleys and pulse interval variability < 0.65/PR and > 1.35/PR, where PR is FFT-based pulse rate (steps 3 and 4); and 5th order moving average filter (Step 6).
2.5 Evaluation of model assumptions
The oscillogram models of Equations 5, 8 rely on several key underlying assumptions including: (i) a triangular BP pulse for developing the area oscillogram model; (ii) a purely elastic cuff-arm-artery system; and (iii) a constant scale factor to relate blood volume oscillations to cuff pressure oscillations. These assumptions could potentially lead to inaccuracies in the model fits. As shown in Figure 6, we developed a framework to evaluate the impact of these assumptions on the model fitting errors and parameter estimates. The framework essentially involves comparing the fits of the proposed models and alternate models that do not invoke the assumptions to the patient oscillogram measurements.
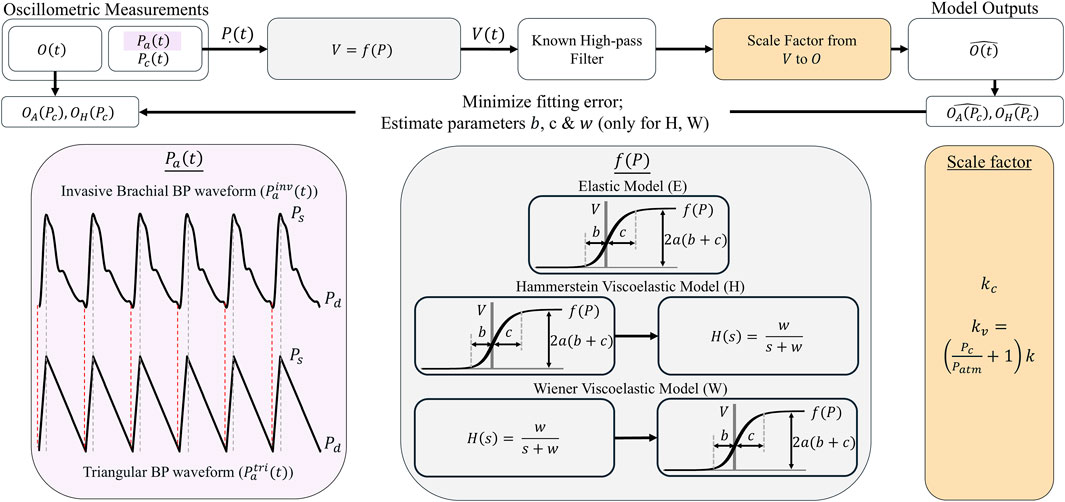
Figure 6. Framework for evaluating the impact of key assumptions of the models on the model fitting errors and parameter estimates. This framework assessed the impact of the triangular BP waveform (
To evaluate the triangular BP pulse assumption, we defined two BP waveforms
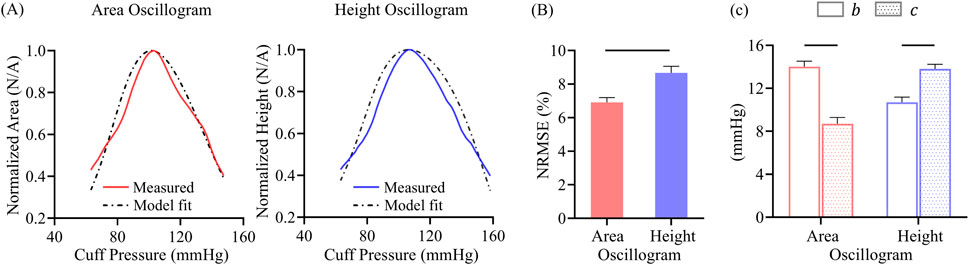
Figure 7. (A) Exemplary area oscillogram and height oscillogram model fits with normalized-root-mean-squared-errors (NRMSEs) of 7.5% and 9.1%, respectively. (B) NRMSEs and (C) parameter estimates of both model fits over all 173 measurements. Data presented as mean ± SE. Horizontal lines indicate significant difference at p < 0.05 level.
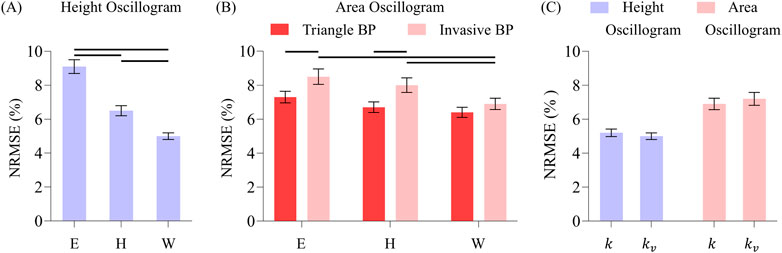
Figure 8. (A) Comparison of overall NRMSEs of the height oscillogram model fits for Elastic (E), Hammerstein viscoelastic (H), and Wiener viscoelastic (W) models. (B) Comparison of the overall NRMSEs of the area oscillogram model fits for the three models and invasive and triangle BP waveform inputs. Note that the triangle BP waveform input is not assumed by the height oscillogram model. (C) Comparison of the overall NRMSEs of both model fits for constant (
To evaluate the purely elastic cuff-arm-artery system assumption, we defined three systems (see grey panels in Figure 5). The first system was the proposed purely elastic model (E), which included only the static integral of the exponential-linear function
To examine the constant scale factor relating blood volume oscillations to cuff pressure oscillations assumption, we employed a previous physical model of the cuff-arm system (Drzewiecki et al., 1994) in which the nonlinear elasticity of the cuff and compressibility of air within the cuff (Boyle’s law) are incorporated. The model takes the blood volume waveform
where
For a standard cuff,
Here, the left term
Again referring to Figure 6, we fed each of the BP waveforms,
3 Results
3.1 Formulas for cuff pressure at the oscillogram maximum
The simplified formulas for the cuff pressure at which the height and area oscillograms reach their maximum,
3.2 Oscillogram model fits
Figure 7A shows representative examples of the area oscillogram and height oscillogram model fits with NRMSEs of 7.5% and 9.1% respectively. Figure 7B shows that the area oscillogram and height oscillogram models fit the 173 respective tail-trimmed oscillogram measurements with overall NRMSEs of 6.9% ± 0.3% and 8.7% ± 0.4%. The model fits for the area oscillogram were significantly better than for the height oscillogram. Figure 7C shows the average
3.3 Effect of assumptions on model fits
Figure 8 shows the overall impact of the different BP waveforms (triangle or invasive) along with the different nonlinear models (Elastic, Hammerstein, or Wiener) and scale factors (constant or variable) on the oscillogram model fitting errors.
For the height oscillogram model fits (see Figure 8A), the NRMSEs were 9.1% ± 0.4%, 6.5% ± 0.4%, and 5.0% ± 0.3% for the Elastic, Hammerstein and Wiener models, respectively. (Note that the triangular BP waveform is not a foundational assumption for the height oscillogram model.) The viscoelastic models yielded significant reductions in the fitting errors by approximately 45% for the Wiener model and about 30% for the Hammerstein model compared to the Elastic model. The substantial fitting error reductions suggest that the additional filter cutoff frequency parameter for the viscoelastic models is crucial for accurately modeling the cuff-arm-artery system response.
For the area oscillogram model fits (see Figure 8B), the NRMSEs for the Elastic, Hammerstein, and Wiener models were 7.3% ± 0.3%, 6.7% ± 0.3%, and 6.4% ± 0.3% for the triangular BP waveform and 8.6% ± 0.5%, 8.0% ± 0.4%, and 6.9% ± 0.3% for the invasive BP waveform. The triangular BP waveform actually yielded significantly better model fitting than the invasive BP waveform for the Elastic and Hammerstein models with an average NRMSE difference of 1.3%. The Wiener model produced significant reductions in NRMSE compared to the Elastic model and the Hammerstein model for the invasive BP waveform. The Wiener model here afforded improvement in the area oscillogram fitting accuracy by 16% on average compared to the Elastic model, which is notably lower than the improvements observed for the height oscillogram model fitting. Interestingly, there were no significant differences in the fitting errors between the Elastic and viscoelastic models for the triangular BP waveform, suggesting that the triangular pulses were not affected by the low-pass filtering effect of the viscoelastic models. These results indicate that the area oscillogram model is more robust to viscoelastic effects than the height oscillogram model.
Finally, the variable scale factor did not have significant impact on the area oscillogram and height oscillogram model fitting errors compared to the constant scale factor, regardless of the BP waveforms or nonlinear models employed. Consequently, only the model fitting errors produced by the Wiener model with the invasive BP waveform input for the two scale factors are shown (see Figure 8C), as these results are representative of the other errors.
The
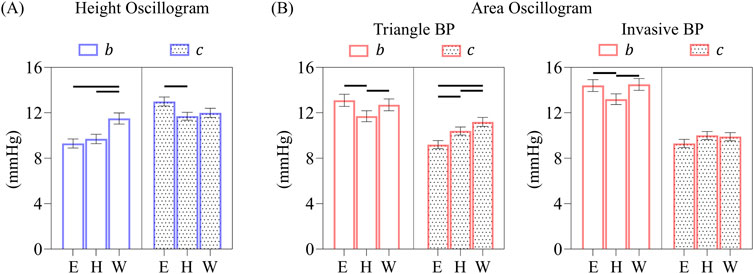
Figure 9. (A) Comparison of overall b and c parameter estimates of the height oscillogram model fits for the elastic and two viscoelastic models. (B) Comparison of overall b and c parameter estimates of the area oscillogram model fits for the different models and BP waveform inputs. Data presented as mean ± SE. Horizontal lines indicate significant differences at p < 0.005 level.
The corresponding
4 Discussion
4.1 Area oscillogram
In conventional oscillometry, BP is computed from the cuff pressure oscillation height versus applied cuff pressure function (“height oscillogram”). However, the shape of the oscillometric pulses is also known to change with the cuff pressure (see Figure 1). In this study, we employed an exquisite patient dataset to find that the cuff pressure oscillation area versus applied cuff pressure function (“area oscillogram”) can be robustly measured compared to other shape oscillograms in which analytical modeling is feasible (see Figure 2). Although both the area oscillogram and height oscillogram consistently exhibited inverted-U shape, there were notable differences between the two oscillograms (see Figure 3). With respect to the height oscillogram, the area oscillogram was typically (i) left-shifted (i.e., peaked at lower cuff pressure) and (ii) narrower in width. The oscillation width decreases as the cuff pressure increases, while the oscillation height rises and then falls with increasing cuff pressure. Therefore, the oscillation area increases and decreases more rapidly with increasing cuff pressure than the oscillation height, resulting in a left-shifted and narrower oscillogram.
4.2 Parsimonious area oscillogram and height oscillogram models
We then extended our previous work on a parsimonious model for the height oscillogram (Dhamotharan et al., 2023) to develop such a mathematical model for the area oscillogram in this study. Previous modeling efforts may have all exclusively focused on the height oscillogram.
We employed a sigmoid in the form of the integral of an exponential-linear function to relate transmural pressure of an artery to its blood volume and used a constant scale factor to convert blood volume oscillations to the observed cuff pressure oscillations. To obtain a closed-form expression (see Figure 4), we modeled the BP waveform with a triangular pulse parameterized by systolic duration, beat duration, and systolic and diastolic BPs. This approach yielded a model for the area oscillogram, which when normalized, includes four unknown parameters:
We also analyzed the models to derive interpretable formulas for the cuff pressure at which the area oscillogram and height oscillogram are maximal using a simpler sigmoid in the form of the integral of an exponential function. These formulas correctly predicted that the peak position of measured area oscillograms typically occurs to the left of the peak position of measured height oscillograms (see Figure 3). However, it is important to note that the area oscillogram model with the exponential-linear function fitted measured area oscillograms with 10% lower NRMSEs than the model with the exponential function on average (result not shown), similar to our earlier findings for the height oscillogram model (Dhamotharan et al., 2023). Therefore, we otherwise used the exponential-linear function for the oscillogram models.
4.3 Model fitting results
When we optimally fitted the height oscillogram and area oscillogram models, inputted with invasive brachial systolic and diastolic BPs for
The
The height oscillogram reaches maximal amplitude at a cuff pressure of
These observations led us to conclude that the parameter estimates from the height oscillogram model were more physiologically representative, while those from the area oscillogram model were compromised to achieve optimal data fitting. We hypothesized that violations to the model assumptions caused this discrepancy in the parameter estimates.
4.4 Model assumptions and impact on model fitting
We evaluated the impact of three key model assumptions on the model fitting errors and parameter estimates via a rigorous framework (see Figure 6).
4.4.1 Triangular BP waveform assumption
An obvious error source for the area oscillogram model fits is the assumption of a triangular BP waveform. To assess the impact of this assumption, we compared the fits of the area oscillogram model driven by the real invasive brachial BP waveform and by the presumptive triangular BP waveform (see purple in Figure 6). Interestingly, the model with the triangular BP waveform input yielded a lower area oscillogram model fitting error by 15% on average (see bars over E in Figure 8B). Blood volume oscillations, which manifest as cuff pressure oscillations, are essentially a low-pass filtered version of the BP pulsations due to viscoelastic effects (see below). So, viscoelasticity, which was ignored in this particular analysis, may explain why the smoother triangular BP waveform was able to yield superior fitting over the sharper invasive BP waveform. This analysis also revealed that the input BP waveform type had no impact on the
4.4.2 Elastic cuff-arm-artery system assumption
Another major source of model fitting error arises from the assumption that the system comprising the cuff material, arm, and brachial artery is purely elastic. In reality, each of these three components may exhibit viscoelastic behavior across the range of cuff pressures. To assess the impact of this assumption, we compared the fits using the assumed Elastic model (E) and by replacing this model with Wiener (W) or Hammerstein (H) viscoelastic models (see gray in Figure 6).
The Wiener and Hammerstein models afforded significantly more accurate fitting of the measured height oscillograms with error reductions of 45% and 30%, respectively, compared to the Elastic model (see Figure 8A). This finding suggests a significant level of viscoelasticity, as inclusion of just a single parameter
Overall, Wiener model provided more accurate fitting of the oscillometric data than both the Hammerstein and Elastic models. Similar results were observed in a previous study on finger oscillometric data (Landry et al., 2024b). Those results were expected, as small finger arteries are rich in smooth muscle and may exhibit a high degree of viscoelasticity. In contrast, brachial arteries are larger with less smooth muscle and should exhibit a lower degree of viscoelasticity. The viscoelastic effects observed in this study may thus also stem from the cuff material and/or arm. The cutoff frequency of the low-pass filter for the viscoelastic models, which indicates the extent of viscoelasticity, was 3.1 Hz on average. This frequency falls within the band-pass filter cutoff frequencies (0.5–5 Hz) used to extract the oscillations from the cuff pressure recordings and is close to typical heart rates (1–2 Hz). These findings highlight why viscoelastic effects cannot be removed by basic signal processing techniques and can significantly impact oscillometric measurements.
The
Interestingly, for the height oscillogram model fitting, the viscoelastic models had a more pronounced effect on the
4.4.3 Constant scale factor relating blood volume to cuff pressure oscillations assumption
A third key assumption of the model is that the blood volume oscillations and cuff pressure oscillations can be related via a constant scale factor. However, the cuff-arm system is known to exhibit significant nonlinearity.
To assess the impact of this assumption, we compared the model fits using the proposed constant scale factor and a variable scale factor of
4.4.4 What assumptions make the model parameters differ between the height oscillogram and area oscillogram?
Collectively, our analysis revealed that none of the studied assumptions significantly impacted the area oscillogram modeling fitting. The analysis further indicated that the assumption of a purely elastic system contributed to the discrepancy in the model parameters from the area oscillogram and height oscillogram modeling fitting. However, is there another assumption that could have caused or contributed to the discrepancy?
One major error source that we could not rigorously address due to a lack of necessary measurements in the patient dataset is the nonlinear compliance of the cuff-arm system. This nonlinearity is commonly exhibited by standard arm cuffs (Drzewiecki et al., 1994). For example, Figure 10A presents a representative pressure-volume relationship of a universal arm cuff (22–42 cm, Omron BP Monitor, Japan) wrapped around a rigid mandrel with a layer of foam simulating compressible arm tissue. The cuff pressure-volume relationship is highly nonlinear over the low cuff pressure range, becoming approximately linear only at cuff pressures exceeding 100 mmHg. The local slope of the relationship, which is again the reciprocal of the nonlinear cuff-arm compliance and essentially the actual scale factor relating blood volume to cuff pressure oscillations, increased by approximately 150% over the 50–200 mmHg range. Since the nonlinearity is more pronounced at lower cuff pressures, we hypothesized that it affects the area oscillogram more than the height oscillogram and may be responsible for the observed differences in parameter estimates.
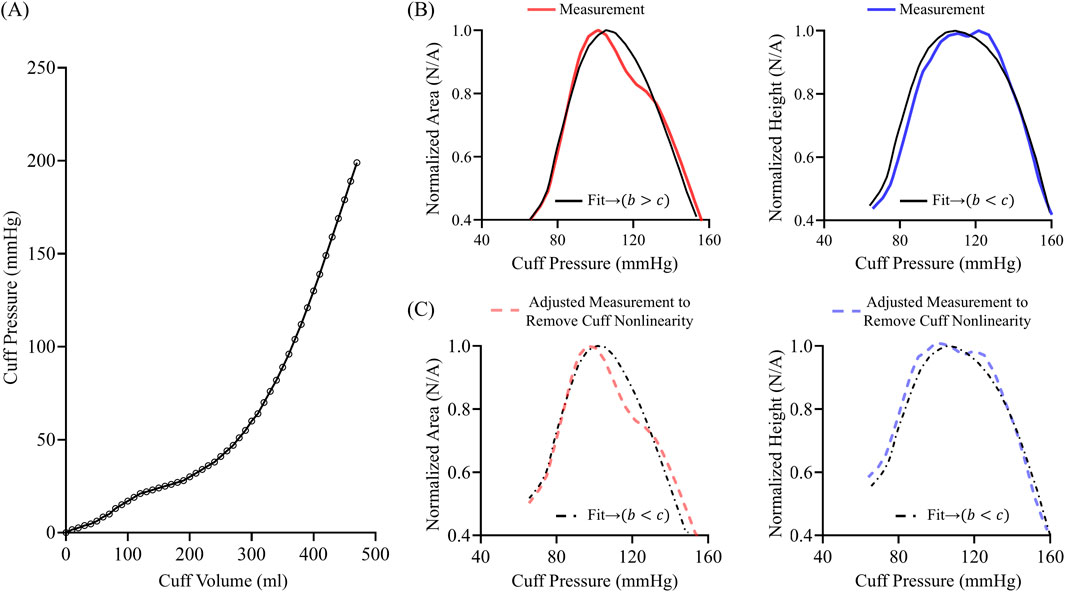
Figure 10. (A) Exemplary nonlinear pressure-volume relationship of a standard cuff on a mandrel wrapped with foam to simulate arm tissue. (B) Area oscillogram and height oscillogram model fits (black) to measurements (red and blue). (C) Area oscillogram and height oscillogram model fits (black) to mathematically adjusted measurements (red and blue) to approximately eliminate cuff nonlinearity in line with (A).
We conducted simulations to illustrate the potential impact of cuff-arm compliance nonlinearity on the oscillogram model fitting. We selected a representative oscillometric measurement in which the area oscillogram model fitting yielded
Due to the nature of the nonlinear compliance of the cuff-arm system, the area oscillogram model appreciably adjusted its parameters to achieve the best possible fit. The parameter estimates via the height oscillogram model fit were also impacted but without disrupting the expected trend of
4.5 Limitations
Our study has limitations. Firstly, while we rigorously evaluated the new area oscillogram and previous height oscillogram models in terms of how well they explain the respective oscillogram measurements, we have yet to investigate the models in terms of computing BP. Secondly, we ignored arm tissue compression to simplify the modeling. Thirdly, we were not able to rigorously investigate the nonlinear compliance of the cuff-arm system. As explained above, one reason was that necessary cuff volume measurements were not available. Another reason is that modeling the nonlinear compliance would have required adding at least two more parameters to the models, thereby complicating the analysis. Fourthly, while the viscoelastic models used in the study effectively quantified the overall extent of nonlinear dynamics, they did not reveal the individual viscoelastic contributions from the cuff, arm, and artery. Lastly, the findings of this study, based on upper arm cuff measurements, may not be generalizable to oscillometric measurement sites beyond the brachial artery or photoplethysmography measurements of blood volume oscillations.
4.6 Implications for oscillometric BP computation
Our study has implications for oscillometric BP computation. The popular fixed ratios algorithm and other conventional oscillometric algorithms only analyze the height oscillogram to compute BP. However, this study indicates that the area oscillogram, which peaks earlier and falls faster than the height oscillogram, offers additional BP information. In particular, the normalized area oscillogram reveals more about the four model parameters (systolic BP, diastolic BP, and the arterial compliance curve widths over negative and positive transmural pressures) than the normalized height oscillogram alone and could therefore potentially help in the BP computation. As a simple example, the peak position of each oscillogram, which may be especially easy to measure, is determined by the four unknown parameters. By analyzing both oscillograms, there would be two equations instead of just one. As a more general example, both models could be optimally fitted to their respective oscillograms, allowing for a patient-specific algorithm that may be more accurate than the conventional population-based algorithms and yield more reliable parameter estimates than patient-specific algorithms that only use the height oscillogram (Liu et al., 2016a; Liu et al., 2016b). Alternatively, the area oscillogram and height oscillogram models could potentially serve as a feature selection guide for machine learning algorithms to improve the BP measurement accuracy. The models may also improve understanding of oscillometric BP computation. For example, our study suggests that cuff-arm-artery system viscoelasticity could adversely impact the computation of systolic BP from the height oscillogram (see Figures 8A, 9A), whereas nonlinear compliance of the cuff-arm system resulting from tissue compression and cuff material may negatively affect the computation of diastolic BP from the area oscillogram (see Figure 10).
5 Conclusion
We systematically analyzed extensive and high-fidelity patient data to find that the area oscillogram can be robustly measured and offers complementary information to the conventional height oscillogram about BP and arterial properties. Subsequently, we developed an analytical model of the area oscillogram. We showed that this model fits the patient data well despite its simplifying assumptions. We also provided evidence that the parameter estimates of the area oscillogram model are susceptible to the nonlinear compliance of the cuff-arm system. While the height oscillogram model also provided good fitting to the patient data, we additionally showed here that it was significantly impacted by cuff-arm-artery system viscoelasticity. Our study therefore lays the groundwork for future studies to leverage the oscillogram models to improve oscillometric BP computation. Follow-up work to study the models in the context of tissue compression would also be worthwhile. Ultimately, such subsequent efforts may lead to more accurate oscillometric BP measurement via office, home, and ambulatory (wearable) devices and thereby help improve hypertension control.
Data availability statement
The data analyzed in this study is subject to the following licenses/restrictions: None. Requests to access these datasets should be directed to Chen-Huan Chen (Y2hlbmNoQHZnaHRwZS5nb3YudHc=).
Ethics statement
This study was a secondary analysis of deidentified patient data. The data were previously collected under IRB approval and with written informed consent from the study participants.
Author contributions
VD: Writing – original draft, Methodology, Formal Analysis, Validation, Visualization. H-MC: Data curation, Writing – review and editing. S-HS: Data curation, Writing – review and editing. C-HC: Data curation, Writing – review and editing. CL: Writing – review and editing, Methodology. MF: Methodology, Writing – review and editing. AM: Writing – review and editing. SS: Supervision, Writing – original draft. J-OH: Supervision, Writing – review and editing. RM: Supervision, Conceptualization, Investigation, Methodology, Writing – original draft.
Funding
The author(s) declare that financial support was received for the research and/or publication of this article. This work was supported by the National Institutes of Health under Grant HL163691.
Conflict of interest
The authors declare that the research was conducted in the absence of any commercial or financial relationships that could be construed as a potential conflict of interest.
Generative AI statement
The author(s) declare that no Generative AI was used in the creation of this manuscript.
Publisher’s note
All claims expressed in this article are solely those of the authors and do not necessarily represent those of their affiliated organizations, or those of the publisher, the editors and the reviewers. Any product that may be evaluated in this article, or claim that may be made by its manufacturer, is not guaranteed or endorsed by the publisher.
References
Argha A., Wu J., Su S. W., Celler B. G. (2019). Blood pressure estimation from beat-by-beat time-domain features of oscillometric waveforms using deep-neural-network classification models. IEEE Access 7, 113427–113439. doi:10.1109/access.2019.2933498
Babbs C. F. (2012). Oscillometric measurement of systolic and diastolic blood pressures validated in a physiologic mathematical model. Biomed. Eng. Online 11, 56. doi:10.1186/1475-925X-11-56
Balasingam B., Forouzanfar M., Bolic M., Dajani H., Groza V., Rajan S. (2011). “Arterial blood pressure parameter estimation and tracking using particle filters,” in 2011 IEEE international symposium on medical measurements and applications, 473–476.
Bos W. J. W., Verrij E., Vincent H. H., Westerhof B. E., Parati G., van Montfrans G. A. (2007). How to assess mean blood pressure properly at the brachial artery level. J. Hypertens. 25 (4), 751–755. doi:10.1097/HJH.0b013e32803fb621
Celler B. G., Le P. N., Argha A., Ambikairajah E. (2020). GMM-HMM-Based blood pressure estimation using time-domain features. IEEE Trans. Instrum. Meas. 69 (6), 3631–3641. doi:10.1109/tim.2019.2937074
Chandrasekhar A., Kim C. S., Naji M., Natarajan K., Hahn J. O., Mukkamala R. (2018a). Smartphone-based blood pressure monitoring via the oscillometric finger-pressing method. Sci. Transl. Med. 10 (431), eaap8674. doi:10.1126/scitranslmed.aap8674
Chandrasekhar A., Natarajan K., Yavarimanesh M., Mukkamala R. (2018b). An iPhone application for blood pressure monitoring via the oscillometric finger pressing method. Sci. Rep. 8 (1), 13136. doi:10.1038/s41598-018-31632-x
Chandrasekhar A., Yavarimanesh M., Hahn J. O., Sung S. H., Chen C. H., Cheng H. M., et al. (2019). Formulas to explain popular oscillometric blood pressure estimation algorithms. Front. Physiol. 10, 10. doi:10.3389/fphys.2019.01415
Dhamotharan V., Chandrasekhar A., Cheng H. M., Chen C. H., Sung S. H., Landry C., et al. (2023). Mathematical modeling of oscillometric blood pressure measurement: a complete, reduced oscillogram model. IEEE Trans. Biomed. Eng. 70 (2), 715–722. doi:10.1109/TBME.2022.3201433
Drzewiecki G. (2006). “Noninvasive arterial blood pressure and mechanics,” in The biomedical engineering handbook. Editor J. D. Bronzino 3rd ed. (Boca Raton: CPC Press LLC).
Drzewiecki G., Hood R., Applet H. (1994). Theory of the oscillometric maximum and the systolic and diastolic detection ratios. Ann. Biomed. Eng. 22, 88–96. doi:10.1007/BF02368225
Drzewiecki G., Pilla J. J. (1998). Noninvasive measurement of the human brachial artery pressure-area relation in collapse and hypertension. Ann. Biomed. Eng. 26 (6), 965–974. doi:10.1114/1.130
Forouzanfar M., Balasingam B., Dajani H. R., Groza V. Z., Bolic M., Rajan S., et al. (2012). “Mathematical modeling and parameter estimation of blood pressure oscillometric waveform,” in 2012 IEEE international symposium on medical measurements and applications proceedings, 1–6.
Forouzanfar M., Dajani H. R., Groza V. Z., Bolic M., Rajan S., Batkin I. (2015). Oscillometric blood pressure estimation: past, present, and future. IEEE Rev. Biomed. Eng. 8, 44–63. doi:10.1109/RBME.2015.2434215
Freithaler M., Chandrasekhar A., Dhamotharan V., Landry C., Shroff S. G., Mukkamala R. (2023). Smartphone-based blood pressure monitoring via the oscillometric finger pressing method: analysis of oscillation width variations can improve diastolic pressure computation. IEEE Trans. Biomed. Eng. 70 (11), 3052–3063. doi:10.1109/TBME.2023.3275031
Geddes L. A., Voelz M., Combs C., Reiner D., Babbs C. F. (1982). Characterization of the oscillometric method for measuring indirect blood pressure. Ann. Biomed. Eng. 10 (6), 271–280. doi:10.1007/BF02367308
Landry C., Dhamotharan V., Freithaler M., Hauspurg A., Muldoon M. F., Shroff S. G., et al. (2024a). A smartphone application toward detection of systolic hypertension in underserved populations. Sci. Rep. 14 (1), 15410. doi:10.1038/s41598-024-65269-w
Landry C., Freithaler M., Dhamotharan V., Daher H., Shroff S. G., Mukkamala R. (2024b). Nonlinear viscoelastic modeling of finger arteries: toward smartphone-based blood pressure monitoring via the oscillometric finger pressing method. IEEE Trans. Biomed. Eng. 71 (9), 2708–2717. doi:10.1109/TBME.2024.3388316
Lin H. C., Lowe A., Al-Jumaily A. (2014). Non-invasive blood pressure measurement algorithm using neural networks. Artif. Intell. Res. 3 (2). doi:10.5430/air.v3n2p16
Liu J., Cheng H. M., Chen C. H., Sung S. H., Moslehpour M., Hahn J. O., et al. (2016a). Patient-specific oscillometric blood pressure measurement. IEEE Trans. Biomed. Eng. 63 (6), 1220–1228. doi:10.1109/TBME.2015.2491270
Liu J., Cheng H. M., Chen C. H., Sung S. H., Hahn J. O., Mukkamala R. (2016b). Patient-specific oscillometric blood pressure measurement: validation for accuracy and repeatability. IEEE J. Transl. Eng. Health Med. 5 (1900110), 1900110. doi:10.1109/JTEHM.2016.2639481
Mauck G. W., Smith C. R., Geddes L. A., Bourl J. D. (1980). The meaning of the point of maximum oscillations in cuff pressure in the indirect measurement of blood pressure - Part II. J. Biomech. Eng. 102 (1), 28–33. doi:10.1115/1.3138195
Mills K. T., Bundy J. D., Kelly T. N., Reed J. E., Kearney P. M., Reynolds K., et al. (2016). Global disparities of hypertension prevalence and control: a systematic analysis of population-based studies from 90 countries. Circulation 134 (6), 441–450. doi:10.1161/CIRCULATIONAHA.115.018912
Nitzan M. (2011). Automatic noninvasive measurement of arterial blood pressure. IEEE Instrum. Meas. Mag. 14 (1), 32–37. doi:10.1109/mim.2011.5704808
Orme S., Ralph S. G., Birchall A., Lawson-Matthew P., McLean K., Channer K. S. (1999). The normal range for inter-arm differences in blood pressure. Age Ageing 28 (6), 537–542. doi:10.1093/ageing/28.6.537
Padwal R., Campbell N. R. C., Schutte A. E., Olsen M. H., Delles C., Etyang A., et al. (2019). Optimizing observer performance of clinic blood pressure measurement: a position statement from the lancet commission on hypertension group. J. Hypertens. 37 (9), 1737–1745. doi:10.1097/HJH.0000000000002112
Panula T., Koivisto T., Pänkäälä M., Niiranen T., Kantola I., Kaisti M. (2020). An instrument for measuring blood pressure and assessing cardiovascular Health from the fingertip. Biosens. Bioelectron. 167, 112483. doi:10.1016/j.bios.2020.112483
Pickering T. G., Hall J. E., Appel L. J., Falkner B. E., Graves J., Hill M. N., et al. (2005). Recommendations for blood pressure measurement in humans and experimental animals: Part 1: blood pressure measurement in humans - a statement for professionals from the subcommittee of professional and public education of the American heart association council on high blood pressure research. Circulation 111 (5), 697–716. doi:10.1161/01.CIR.0000154900.76284.F6
Raamat R., Talts J., Jagomägi K., Kivastik J. (2011). Errors of oscillometric blood pressure measurement as predicted by simulation. Blood Press Monit. 16 (5), 238–245. doi:10.1097/MBP.0b013e32834af752
Ursino M., Cristalli C. (1996). A mathematical study of some biomechanical factors affecting the oscillometric blood pressure measurement. IEEE Trans. Biomed. Eng. 43 (8), 761–778. doi:10.1109/10.508540
van Montfrans G. A. (2001). Oscillometric blood pressure measurement: progress and problems. Blood Press Monit. 6 (6), 287–290. doi:10.1097/00126097-200112000-00004
Keywords: arterial compliance, blood volume oscillations, cuff blood pressure, cuff-arm compliance, mathematical model, oscillometry, parameter estimation, viscoelasticity
Citation: Dhamotharan V, Cheng H-M, Sung S-H, Chen C-H, Landry C, Freithaler M, Mahajan A, Shroff SG, Hahn J-O and Mukkamala R (2025) Oscillometric blood pressure measurement: modeling and analysis of the area oscillogram and height oscillogram. Front. Physiol. 16:1611096. doi: 10.3389/fphys.2025.1611096
Received: 13 April 2025; Accepted: 19 May 2025;
Published: 18 June 2025.
Edited by:
Lik Chuan Lee, Michigan State University, United StatesReviewed by:
Xu Huang, Nanjing University of Science and Technology, ChinaSai Zhou, University of California, San Diego, United States
Copyright © 2025 Dhamotharan, Cheng, Sung, Chen, Landry, Freithaler, Mahajan, Shroff, Hahn and Mukkamala. This is an open-access article distributed under the terms of the Creative Commons Attribution License (CC BY). The use, distribution or reproduction in other forums is permitted, provided the original author(s) and the copyright owner(s) are credited and that the original publication in this journal is cited, in accordance with accepted academic practice. No use, distribution or reproduction is permitted which does not comply with these terms.
*Correspondence: Ramakrishna Mukkamala, cm11a2thbWFsYUBwaXR0LmVkdQ==