 D. Vijay Anand
1
D. Vijay Anand
1 Manuel Teixeira Cabeleira2
 Claire Black
3
Claire Black
3
 Vanessa Diaz-Zuccarini
2
Vanessa Diaz-Zuccarini
2
 Nicholas C. Ovenden
1*
Nicholas C. Ovenden
1*- 1 Department of Mathematics, University College London, London, United Kingdom
- 2 Department of Mechanical Engineering, University College London, London, United Kingdom
- 3 Therapies and Rehabilitation, University College London Hospitals NHS Foundation Trust (UCLH), London, United Kingdom
Introduction: A mechanistic compartmental model with a feedback-driven simulation framework was developed to investigate the impact of airway secretion accumulation and its removal on the respiratory dynamics of mechanically ventilated patients. Understanding these dynamics is essential for secretion management and improving respiratory care in the intensive care unit (ICU).
Methods: The model simulates pressure support ventilation by incorporating airway resistances, lung and chest wall compliances, and patient effort via a dynamic respiratory muscle pressure term, enabling realistic modelling of patient-ventilator interaction. To validate the model, simulated waveforms were compared against clinical waveform recordings. Waveform features sensitive to secretion-related changes, as indicated by the model, were then extracted from the patient waveform recordings. The Wasserstein distance metric was used to quantify shifts in pre- and post-suction feature distributions, and unsupervised clustering was applied to identify distinct patient groups corresponding to low, medium, and high secretion levels.
Results: The simulations revealed characteristic changes in ventilator waveforms associated with secretion accumulation, including reduced inspiratory flow and prolonged expiration. Analysis of patient data using clustering methods identified distinct groups corresponding to low, medium, and high levels of secretion. Further, we introduce a model-informed secretion index derived from the simulations and patient data, enabling non-invasive and continuous monitoring of secretion accumulation at the bedside.
Conclusions: This study demonstrates the potential of physiology-informed, model-based approaches for real-time assessment of secretion accumulation in mechanically ventilated patients. The proposed framework supports personalized respiratory care by providing clinicians with data-driven insights into secretion accumulation, paving the way for more precise secretion management strategies in the ICU.
1 Introduction
Mechanical ventilation is initiated to support or take over a patient’s breathing when they are unable to independently sustain adequate ventilation. However, the introduction of an artificial airway in order to deliver mechanical ventilation results in impairment of the normal mechanisms underpinning airway clearance; airway humidification, mucocilliary escalator and cough. Retention of airway secretions is a common and serious problem in ventilated patients. Retained mucus narrows or occludes the airways (Roe et al., 2025; Mietto et al., 2014), causes respiratory distress, provides a growth medium for bacteria, and if extensive, leads to atelectasis, gas exchange impairment, and ventilator-acquired pneumonia (VAP). VAP is the most common nosocomial infection affecting patients in critical care and is associated with increased mortality and antibiotic use (Howroyd et al., 2024). Excess secretions increase the effort to breathe, making it harder for patients to transition to spontaneous breathing, complicating the weaning process and increasing the risk of extubation failure (Branson, 2007; Volpe et al., 2020; Goetz et al., 2022). Typically, these sequelae prolong the duration of mechanical ventilation and, consequently, the patient’s stay in the ICU. Therefore, developing effective secretion clearance strategies, including automated detection and appropriately timed secretion removal, is critical for mechanically ventilated patients.
The effectiveness of mechanical ventilation is primarily determined by the interplay of airway resistance, lung compliance and patient-ventilator synchrony, which together regulate ventilation dynamics, airflow distribution, and the driving pressure required for adequate gas exchange. Several studies have demonstrated a significant increase in airway resistance when secretions accumulate in the airways, particularly in the trachea and smaller bronchioles (Hess, 2014; Jubran and Tobin, 1994; Guglielminotti et al., 2000). This increased resistance necessitates higher ventilator pressures, including elevated peak inspiratory pressure (PIP), and increases the work of breathing to achieve adequate tidal volumes (Hess, 2014). In addition, positive end-expiratory pressure (PEEP) may require adjustment to prevent airway collapse and maintain alveolar recruitment, leading to higher inflation pressures that elevate the risk of ventilator-induced lung injury (VILI), as noted in Jubran and Tobin (1994); Guglielminotti et al. (2000); Zamanian and Marini (2006). When secretions obstruct the airways, gas exchange efficiency declines, resulting in a ventilation-perfusion mismatch as oxygenated air fails to reach certain lung regions due to mucus plugging. This can result in hypoxemia (low blood oxygen) and hypercapnia (elevated CO2), both of which are detrimental to critically-ill patients (Hess, 2007). Airway mucus also alters the lung tissue’s elastic properties, making it stiffer and less compliant, thereby necessitating higher ventilator pressures to maintain adequate oxygenation (Hess, 2014). Hence, early detection of secretion accumulation and its clearance through methods such as suctioning, humidification, and airway clearance techniques (e.g., respiratory physiotherapy) are essential for successful weaning (Goetz et al., 2022). Conventional indicators of secretion accumulation, such as coughing and audible respiratory sounds, are often unreliable in mechanically ventilated patients, particularly those who are sedated or have impaired cough reflexes. Consequently, clinicians turn to ventilator waveforms (VWFs), which are time series of pressure, flow, and volume signals, along with their loops, for secretion detection (Jubran and Tobin, 1994; Guglielminotti et al., 2000; Zamanian and Marini, 2006; Albani et al., 2021b; a; Harris, 2005). Visual interpretation of these waveforms remains challenging, however, due to factors like lung co-morbidities and patient-ventilator asynchronies (Younes et al., 2007; De Wit, 2011), which can obscure secretion-related changes (Paratz and Ntoumenopoulos, 2014). These issues underscore the need for non-invasive secretion quantification techniques based on bedside measurements to improve timely detection and management of airway secretions. To address this, we adopt a structured approach that begins by characterising the impact of secretion accumulation on respiratory dynamics and identifying corresponding signatures in ventilator waveforms. Our methodology is organized into three main stages:
The remainder of this paper is organised as follows: Section 2 presents the development of a pressure support ventilator model incorporating non-linear resistance, compliance, and patient respiratory effort, along with details of its simulation, validation, and optimisation using clinical waveform data. Section 3 focuses on the application of this model for quantifying airway secretions, including analysis on both synthetic and real patient data, and introduces the secretion index as a novel metric for tracking secretion accumulation. Section 4 summarizes the key findings and discusses the translational potential of the proposed framework for real-time, non-invasive monitoring of secretion accumulation.
2 Mechanistic modelling for interpretability of ventilator waveforms
Mechanistic modelling of patient-ventilator dynamics plays a crucial role in understanding airway secretion clearance by capturing the interplay between airway resistance, lung compliance, and mode of ventilation. In addition, it provides information on VWF alterations associated with secretion accumulation. When calibrated with bedside data such as airway pressures, including peak inspiratory pressure (PIP) and plateau pressure (Pplat); tidal volume
Early attempts at ventilator modelling relied primarily on simple equation-based approaches, such as linear resistance-compliance (RC) models, described in Bates (2009), which model the airflow using basic relationships between pressure, flow, and volume. In these models, the respiratory system is often represented by the equation
where
Despite their utility, existing ventilator models struggle to accurately simulate advanced ventilator modes such as proportional assist ventilation (PAV) (Younes, 2002), continuous positive airway pressure with pressure support (CPAP-PS), and neurally adjusted ventilatory assist (NAVA), which depend on real-time patient feedback (Sinderby et al., 1999). Further, they often assume ideal synchronisation between the ventilator and the patient, overlooking asynchronies such as delayed triggering or breath stacking. Therefore, to better reflect real patient-ventilator interactions, it is essential to design models that incorporate dynamic feedback across various ventilator modes. Such physiology-informed models will also be crucial for enabling future advancements, including the integration of artificial intelligence for personalized ventilation, real-time secretion detection, patient effort monitoring, and prediction of ventilator asynchronies. These improvements necessitate models that continuously adapt to patient-ventilator interactions, enabling the simulation of diverse ventilator modes and accommodating a wide range of patient conditions.
In this study, we present a comprehensive ventilator model that incorporates airway resistance, lung compliance, chest wall mechanics, and patient-driven breath cycles to simulate pressure support ventilation. An event-based simulation strategy using callback functions enables real-time adjustment of ventilator pressure by tracking physiological transitions, such as peak inspiratory flow and its decline, allowing for realistic simulation of pressure support mode with dynamic feedback. Our model aims to uncover changes in VWFs in relation to underlying physiological parameters, particularly those influenced by secretion accumulation. Using the simulated waveforms, we extract key respiratory features such as peak inspiratory flow
2.1 Model formulation
The mechanistic model developed in this study is designed to generate ventilator waveforms that reflect both clear and secretion-accumulated airways by modulating airway resistance, lung compliance, and patient effort parameters. Our model employs a compartmental modelling approach, where the mechanical ventilation system is represented as a series of interconnected compartments, each corresponding to specific components such as the ventilator, endotracheal tube, upper airways (trachea and bronchi), and smaller airways (alveoli). The bronchi and alveoli compartments are enclosed within a larger compartment referred to as the chest cavity that undergoes pressure changes due to the motion of the diaphragm. (See Figure 1). In this approach, each compartment is assigned parameters, such as resistance and compliance, to account for pressure changes and air storage capacity, respectively, as air moves in and out of the lungs.
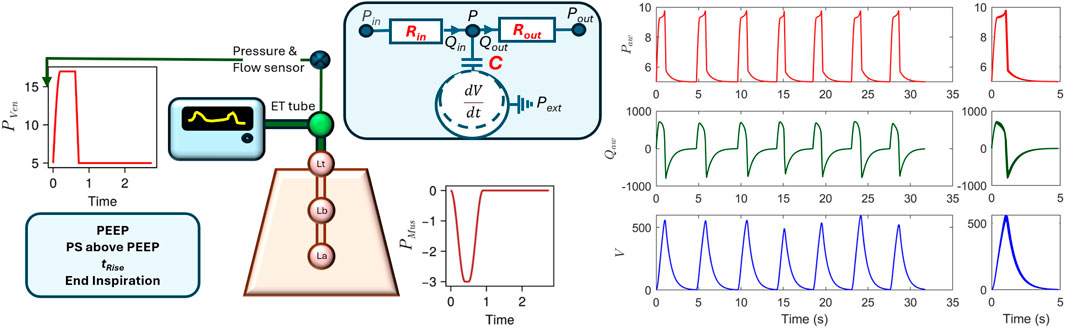
Figure 1. Left: The compartment model of pressure support mechanical ventilation. The model includes a feedback element that monitors inspiratory flow to guide the ventilator pressure profile. Right: A short recording of VWFs for 30 s and superimposition of individual breaths.
A typical compartment is composed of a capacitor connected to inflow and outflow resistances to simulate the inflow and outflow of air from a compartment. The underlying governing equations used to compute the compartment’s internal pressure
These equations are formulated based upon principles of conservation laws, constitutive equations, and phenomenological relations. Equation 2 is the conservation equation that describes the dynamics of air inflow, outflow, and accumulation within the system, maintaining the integrity of volume conservation. The flow in and out of a compartment is then calculated using Equation 3, which depends on the pressure difference between connected compartments and the associated resistances. Equation 4 is the constitutive equation that computes the pressure in a compartment, with reference to an external pressure
where
Here,
where compliance varies dynamically with alveolar pressure
where the time variable
The respiratory muscle pressure
This formulation simulates a smooth pressure profile for a spontaneous breath. During the inspiratory rise phase
2.2 Model simulation including feedback
Forward simulations were performed to generate VWFs for CPAP-PS ventilation. In this mode, the ventilator provides pressure support (PS) above positive end-expiratory pressure (PEEP) until the inspiratory flow in the airway decreases to a predefined threshold, typically set at
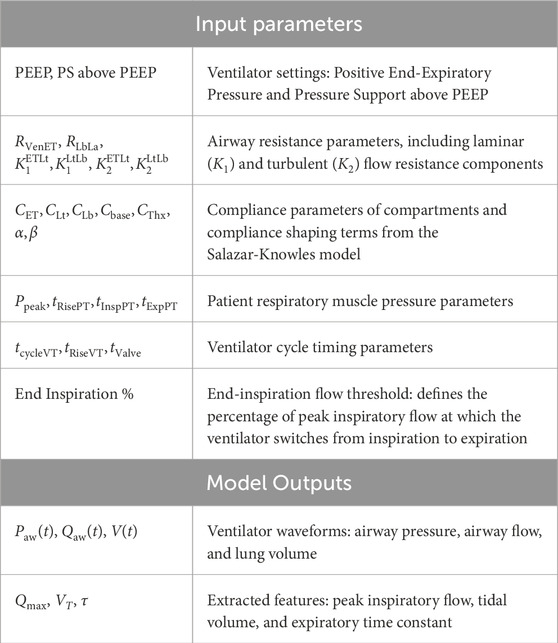
Table 1. Summary of model input parameters and output.
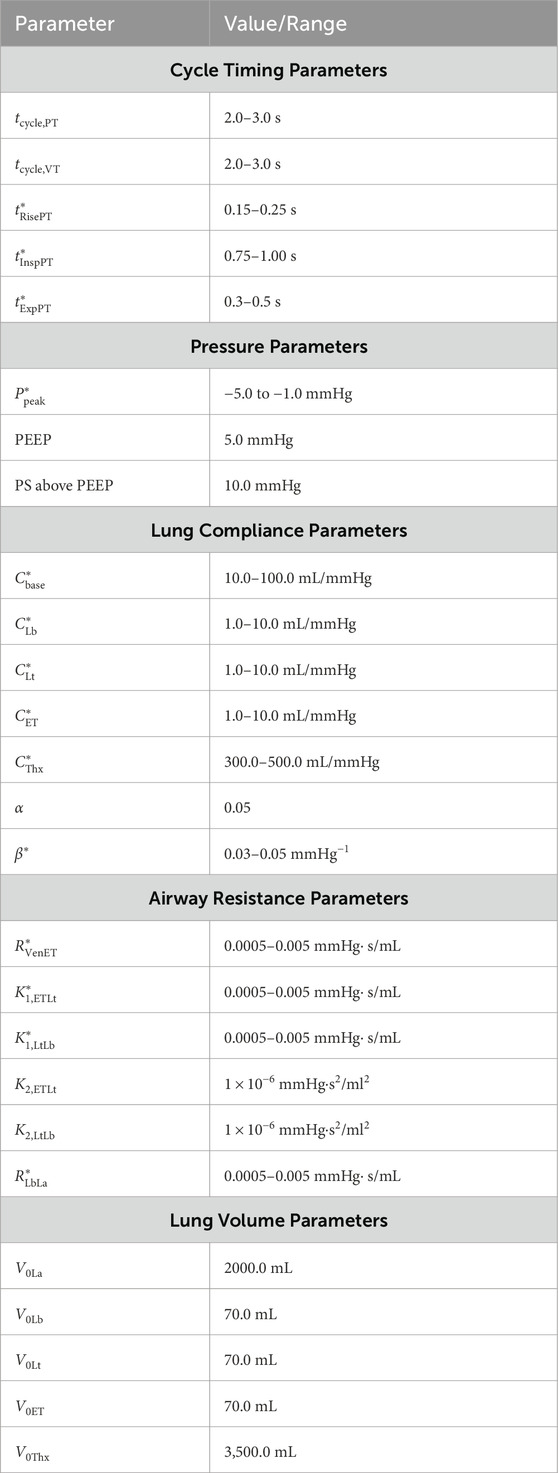
Table 2. Model parameters and their ranges used for simulating CPAP-PS mechanical ventilation. *Indicates parameters included in the 14-dimensional optimization vector.
The governing ODEs described in the model formulation section are implemented and solved using the Julia programming language, leveraging the efficiency and flexibility of Julia’s scientific computing ecosystem. The DifferentialEquations.jl package is used for numerical integration of the governing equations, ensuring robust time-dependent simulations (Rackauckas and Nie, 2017). Additionally, as in Pal et al. (2024), NLsolve.jl and Roots. jl are employed to solve the non-linear equations for resistance and compliance, allowing for a physiologically accurate representation of airway dynamics. We employ a fourth-order Runge–Kutta (RK4) method for time integration of the ventilator model, supplemented with event-driven callbacks to detect specific physiological transitions during the respiratory cycle. These callbacks are used to identify key features such as the peak inspiratory flow rate
2.3 Model validation and optimisation
To validate the CPAP-PS ventilator model, clinical VWF data was used to compare simulated and recorded patient waveforms. VWF data was obtained from the Getinge Servo-U ventilator (Göteborg, Sweden), which provides real-time monitoring and recording of flow, volume, and pressure waveforms. During routine airway clearance procedures, pre-suction waveform data was recorded using the ventilator’s built-in data acquisition system before performing an airway clearance procedure to remove excess secretions. The post suction waveform data was obtained at least 2 minutes post procedure to allow for resumption of the baseline respiratory rate under identical ventilator settings to ensure comparability. Both pre- and post-suction waveform datasets were exported and the data parsed and stored in a structured, human-readable format for further analysis. This structured data acquisition process ensured consistency in ventilator measurements, enabling reliable comparison of waveform changes associated with secretion removal. The secretion levels were assessed by an expert physiotherapist using standard clinical criteria during suctioning. These were initially recorded as five categories: none, small, moderate, large, and copious. For the purposes of analysis, these were aggregated into three broader categories by grouping none and small as low, moderate as medium, and large and copious as high secretion levels. Unfortunately, direct quantitative secretion volume measurements were not routinely available for all patients, but the categorization based on clinical judgement was consistent with routine ICU practice.
The ventilator model simulations were compared with clinical ventilator waveform data by running forward simulations and manually adjusting the model parameters to improve alignment with observed pressure, flow, and volume waveforms over time. Figure 2 presents ventilator waveforms from clinical cases, demonstrating the model’s ability to capture physiological changes and provide meaningful interpretations of patient-specific ventilator dynamics. In Figure 2 (top), a linear decrease in the flow curve is observed during the interval between peak flow and the end of inspiration, indicating a passive decay of inspiratory flow as pressure support is maintained constant. In contrast, Figure 2 (bottom) shows a sharp increase near the latter part of inspiration, suggesting that the patient’s breathing effort is dominating ventilator support. This is further evident in the concave shape of the flow curve during the transition from rise time to end of inspiration. To further illustrate the clinical relevance of the model, we present another example that reflects distinct patient–ventilator interaction patterns observed in clinical data. Figure 3 shows model-based simulations for two different patient effort scenarios. In the first case (top panel), the patient initiates a spontaneous breath which is promptly supported by the ventilator, demonstrating synchrony between patient effort and ventilator support. In the second case (bottom panel), a spontaneous breath is initiated by the patient before the mandatory ventilator breath could complete, resulting in patient–ventilator desynchrony and double triggering, which is clearly evident in the flow and pressure waveforms. The model demonstrates a strong capability in capturing patient-ventilator dynamics, effectively reflecting changes in airway resistance, compliance, and patient effort within ventilator waveforms. Despite its minimal formulation, which simplifies the spatial structure of the lung by representing key anatomical regions, such as the trachea, bronchi, and alveoli, using lumped resistance
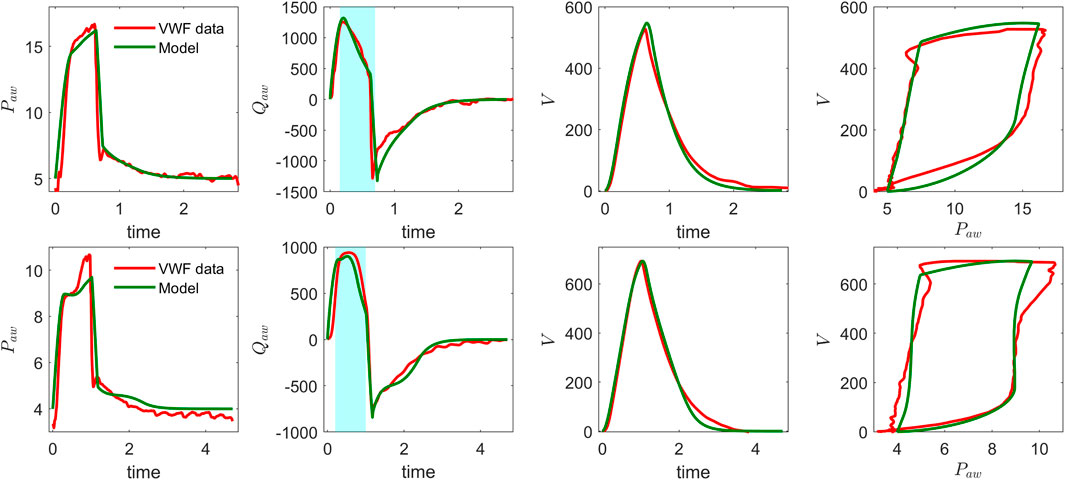
Figure 2. Model validation of CPAP-PS simulation using real ventilator waveforms: airway pressure, airway flow, volume, and pressure–volume loop for two patients. Note the differences in airway pressure and flow patterns between the top and bottom plots, particularly during the inspiratory phase (highlighted in the shaded region of the flow curves).
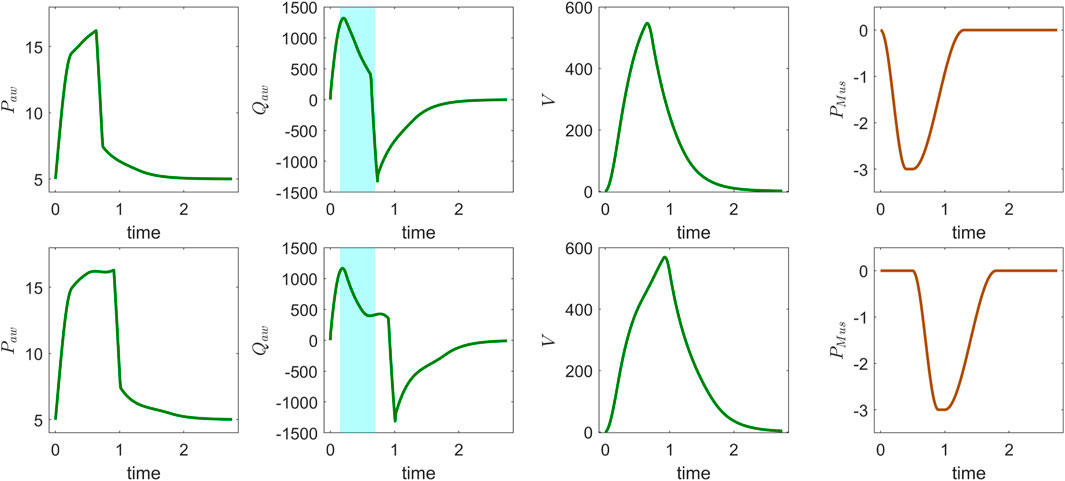
Figure 3. Model simulation of CPAP-PS mode using patient-specific parameters: airway pressure
In our study, we calibrated the ventilator model and estimated optimal parameter values using an evolutionary optimization approach. Specifically, we employed a non-gradient-based optimization method, Exponential Natural Evolution Strategy (xNES), developed initially by Glasmachers et al. (2010) and implemented using the BlackBoxOptim package in Julia. xNES is a derivative-free evolutionary optimization method designed for high-dimensional, non-linear objective functions. Its suitability for physiological model calibration arises from its ability to efficiently explore complex, noisy parameter spaces where solutions are often non-unique and interdependent. In ventilator simulations, where patient-specific variations introduce significant heterogeneity in the resulting lung mechanics, xNES enables robust parameter estimation without relying on gradient information, making it more effective than traditional optimization methods. The xNES optimization minimizes the discrepancy between simulated and observed patient data (pressure, flow, and volume waveforms) by refining model parameters within physiological constraints. It iteratively explores the parameter space, adapting its search distribution and covariance matrix to converge on an optimal solution that minimizes the fitness score. The process terminates when a target fitness or iteration limit is reached, yielding a calibrated parameter set that closely aligns the ventilator model with patient data. Mathematically, this involves minimizing the difference between simulated data
where
The optimization is performed over a 14-dimensional parameter vector, denoted as
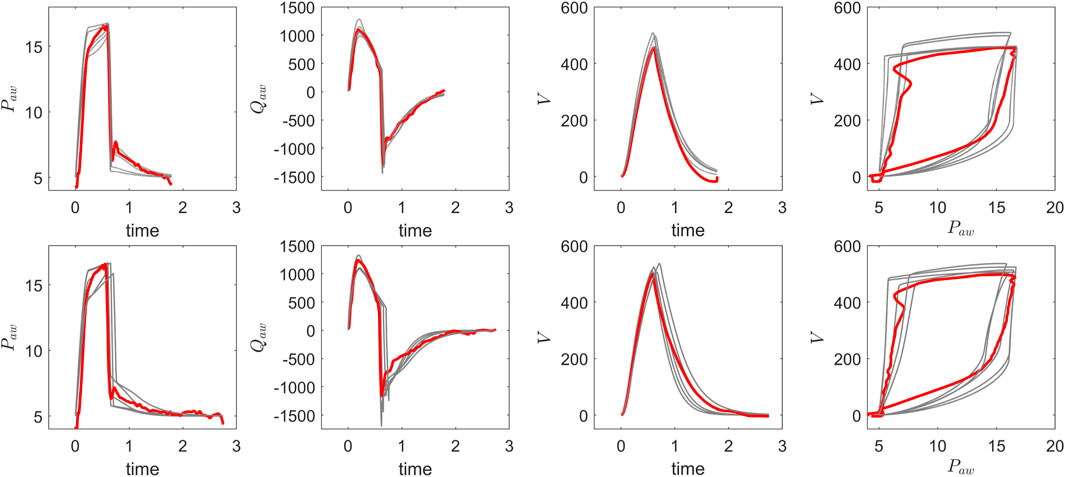
Figure 4. Comparison of optimisation results for pressure, flow, and volume waveforms: pre-suction (top) and post-suction (bottom). The recorded VWF data (red) is overlaid with five optimized VWF profiles (grey), demonstrating consistent alignment between the recorded data and optimised solutions before and after secretion clearance.
3 Secretion quantification using ventilator waveforms
The ability to detect and quantify airway secretion accumulation remains a critical yet unresolved challenge in mechanical ventilation. Traditional methods for assessing secretion accumulation have notable limitations. One common approach is auscultation, which involves listening to lung sounds with a stethoscope. This method is inherently subjective and often unreliable in sedated or intubated patients. Another common practice is secretion volume estimation, typically performed after suctioning, which provides only retrospective insight and relies on visual assessment and clinical judgment rather than standardized or predictive metrics. Although ventilator waveforms are routinely monitored at the bedside, their potential for secretion monitoring remains underutilized due to the absence of structured methods for quantifying secretion load and its impact on respiratory dynamics. To address this gap, we use our CPAP-PS model to simulate secretion-related waveform alterations, providing a controlled framework for understanding the impact of secretion accumulation on ventilation patterns and enabling the development of quantitative metrics for secretion detection. To quantify secretion accumulation, various features derived from ventilator waveform data were considered, including peak inspiratory flow
3.1 Secretion analysis on VWF synthetic data
To evaluate the impact of secretion accumulation on ventilator waveforms, we generated a synthetic dataset using the CPAP-PS ventilator model developed in this study. Secretion levels were assumed here to be proportional to increased airway resistance, with specific parameter variations introduced to simulate different secretion accumulations. In this exploratory analysis, we selected resistance distributions to systematically probe how varying resistance levels affect ventilator waveforms. We defined a baseline resistance mean of 0.001 mmHg
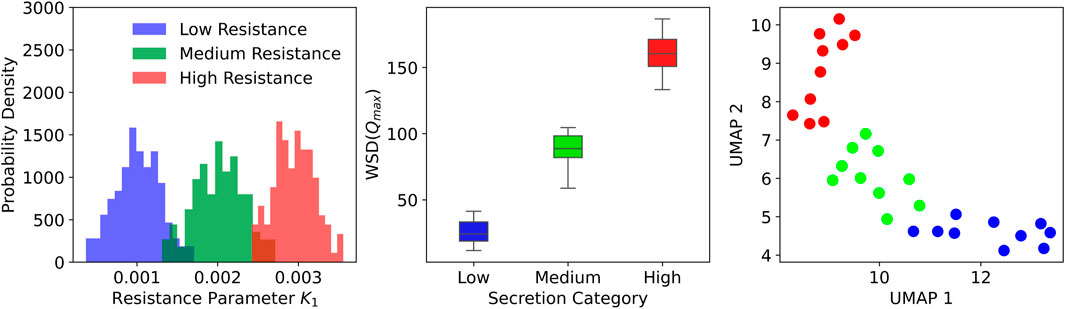
Figure 5. Distribution of airway resistance parameters and clustering based on ventilator waveform features. Left: Histograms of resistance values across three secretion levels. Middle: Box plots showing separation in WSD
A quantitative analysis was conducted to evaluate secretion-related changes in ventilator waveforms using the synthetic dataset. For each of the 30 synthetic patients, peak inspiratory flow
3.2 Secretion analysis on VWF patient data
To extend the insights gained from synthetic VWF data analysis, we applied the same feature extraction methodology to real patient VWF data, where secretion levels were clinically assessed. The real-world VWF signals, recorded over short time intervals before and after airway clearance procedures, were inherently more variable and susceptible to noise. We analysed data from 35 patients, of whom four had copious secretions, seven had large, nine had moderate, 13 had small, and two had no detectable secretions. The analysis of individual breaths revealed noticeable shifts in the distributions of peak inspiratory flow rate following suctioning. However, changes in tidal volume and expiratory time constant were less discernible, likely due to signal variability and the subtle nature of secretion-related effects on these features. To provide a more detailed representation of the inspiratory phase, we introduced two slope-based metrics, namely, the flow slope and the volume slope. The flow slope
Figure 6 presents a box plots comparing WSD scores across different secretion levels, showing that WSD derived from peak inspiratory flow rates effectively distinguishes between varying levels of secretion. Features such as
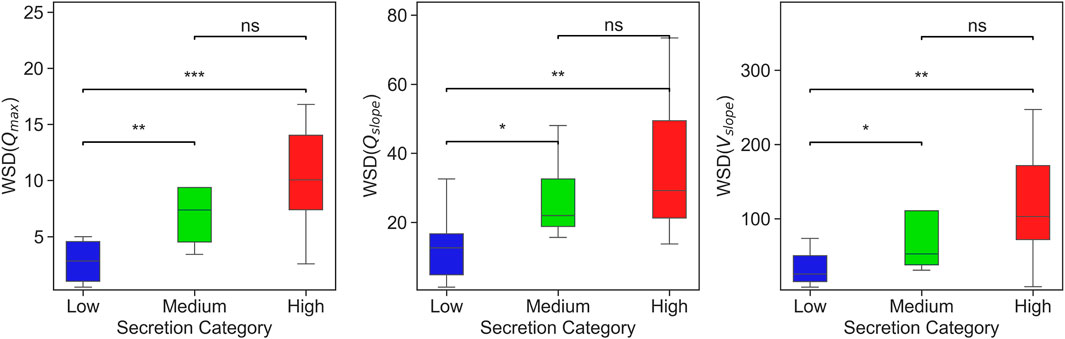
Figure 6. Box plots showing WSD-based considering three features (
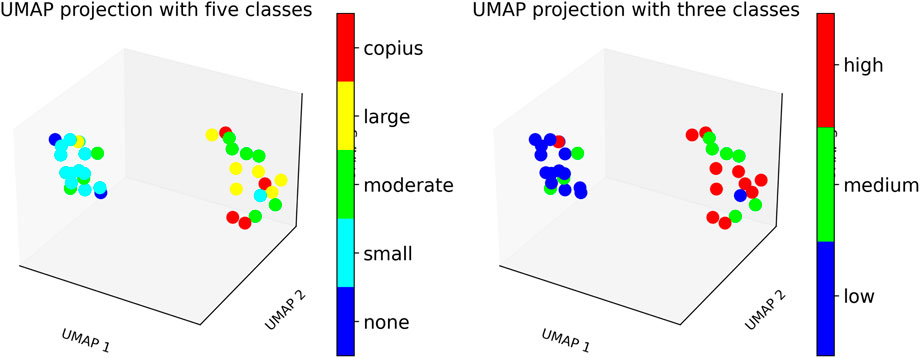
Figure 7. UMAP plot showing patient clustering based on secretion levels using WSD-based measures. Left: Patients categorized into five clinical secretion levels: none, small, moderate, large, and copious. Right: Patients grouped into three aggregated secretion levels: low, medium, and high.
3.3 Secretion index: A novel metric for airway secretion quantification
A comprehensive assessment of secretion accumulation requires a method that captures its gradual progression and impact on ventilation dynamics. To address this, we have developed a metric that quantifies secretion accumulation by tracking continuous changes in ventilator waveforms over time. Our proposed metric is the Secretion Index (SI) defined as
where
To evaluate the effectiveness of the proposed secretion index, a controlled simulation was designed to generate ventilator waveform data over a 1-h period, corresponding to approximately 720 simulated breaths. The simulation assumed an initially clear airway, setting the resistance parameters
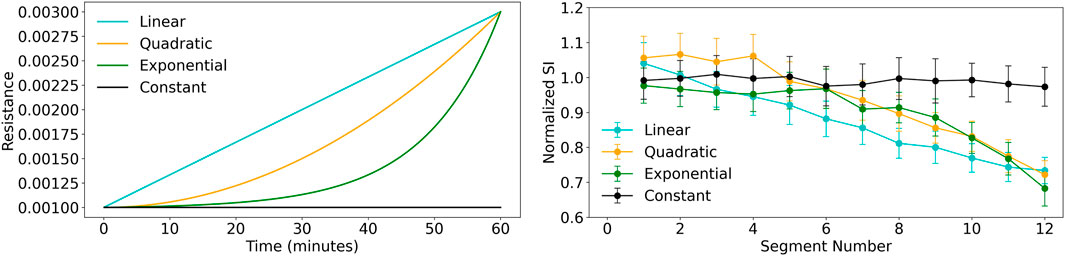
Figure 8. Comparison of resistance conditions and secretion index across segment numbers. Left: Resistance verses time plot shows the resistance progression for different models: Linear (cyan), Quadratic (orange), Exponential (green), and Constant (black). The exponential model shows the fastest growth, while the constant condition remains unchanged. Right: Secretion Index plot shows the median secretion index across 12 segments with standard deviation error bars. The linear model shows the steepest decline, while the constant condition remains stable.
4 Summary and conclusion
This study examined the impact of airway secretions on ventilator dynamics using a mechanistic model combined with patient ventilator waveform data. Simulations were performed to evaluate how secretion accumulation alters respiratory dynamics, demonstrating that increased airway resistance makes it more difficult to mechanically maintain desired ventilation. In particular, increased resistance affects patient-ventilator interactions by reducing peak inspiratory flow and prolonging expiratory time. These effects were reflected in VWF alterations, highlighting the potential for waveform-based analysis to detect secretion accumulation.
To systematically investigate this, we first employed our ventilator model to generate synthetic VWF data under varying airway resistance conditions, corresponding to different secretion levels. The parameters governing airway resistance were selected from different distributions to establish controlled pre- and post-secretion conditions, providing a systematic basis for extracting key waveform features and analysing the impact of secretion removal on ventilator dynamics. Features such as peak inspiratory flow
Beyond discrete pre/post secretion analysis, we further investigated the continuous progression of airway resistance over time. A 60-min simulation was conducted, where airway resistance gradually increased from a baseline clear-airway state to a high-secretion condition, modelling the dynamic accumulation of secretions. Four different progression profiles were considered: constant, linear, quadratic, and exponential resistance increase. The secretion index, a composite metric derived from ventilator waveform features, consistently tracked the progression of airway resistance in all four cases, demonstrating its potential as a quantitative indicator of secretion accumulation. These findings highlight the potential critical interplay between airway resistance and secretion accumulation, emphasizing the need for timely intervention in response to secretion-induced changes in the ventilator waveform features. Although our model delineates waveform signatures of secretion accumulation, it has certain limitations. It approximates secretion effects solely through resistance changes and does not account for mucus rheology or spatial heterogeneity. The parameter estimation is limited by the lack of additional physiological data (e.g., oesophageal pressure, imaging), which would constrain model parameters and mitigate ill-posedness. While our approach shows promising initial validation on both simulated and clinical data, formal uncertainty quantification (e.g., Bayesian methods) and evaluation in larger patient cohorts are essential to confirm its generalizability and clinical utility. The current model’s translation to diverse patient populations is limited by its simplified representation of airway resistance, without explicitly accounting for condition-specific respiratory mechanics such as compliance variations, lung heterogeneity, or dynamic hyperinflation, as observed in COPD, ARDS, and paediatric cases. Extending the model to such conditions would require incorporation of disease or condition-specific parameters, alongside access to well-labelled ventilator waveform datasets, which remain scarce and present challenges for comprehensive validation. Further studies in these areas will enhance the interpretability and applicability of the framework.
4.1 Potential clinical applications and implementation challenges
The proposed mechanistic model and secretion quantification framework holds several practical applications in critical care. Firstly, the secretion index and ventilator waveform features can be used for early detection of airway secretion accumulation, allowing clinicians to initiate suctioning or respiratory physiotherapy before clinical deterioration occurs. Secondly, the model enables real-time monitoring of secretion-related resistance changes, offering the potential for integration into ICU dashboards or ventilator interfaces as a non-invasive indicator of airway patency. This would support timely interventions, particularly in sedated or neurologically-impaired patients. Thirdly, the model-derived metrics could be incorporated into weaning-readiness scores by quantifying secretion accumulation trends, thus improving the prediction of extubation success. Furthermore, personalised adjustment of ventilator settings such as PEEP or pressure support based on inferred resistance and patient effort may reduce ventilator-induced lung injury and improve synchrony. These applications highlight the translational potential of this modelling approach in guiding secretion management, optimizing ventilator strategies, and ultimately enhancing patient outcomes.
Despite its clinical utility, translating this framework into routine ICU practice faces several practical challenges. These include interoperability with existing ICU infrastructure, particularly with ventilator platforms and patient monitoring systems that use diverse data standards and proprietary protocols. Ensuring low-latency data acquisition, secure transmission, and real-time processing will be critical for timely clinical decision support. Robust data storage and management solutions must also be in place to handle the continuous high-frequency waveform data while maintaining patient privacy and compliance with healthcare regulations, such as the European Union General Data Protection Regulation (GDPR) and the U.S. Health Insurance Portability and Accountability Act (HIPAA). Moreover, clinician trust in model-derived indices will depend on transparent validation using real ICU datasets in prospective clinical trials, rigorous performance benchmarking against standard secretion assessment methods, and user-friendly visualization integrated into familiar electronic health record (EHR) interfaces. Comprehensive training and change-management programs will be needed to overcome resistance to adopting novel decision-support tools and to minimize the risk of alarm fatigue (i.e., desensitization caused by excessive non-actionable alarms). Successfully navigating these challenges will pave the way for seamless bedside integration, transforming secretion management and improving patient outcomes in critical care environments.
Data availability statement
The data analyzed in this study is subject to the following licenses/restrictions: The datasets analysed in this study are stored in a secure research environment used for managing sensitive health data. Access to the data can be granted upon reasonable request to the corresponding author. Requests to access these datasets should be directed to bi5vdmVuZGVuQHVjbC5hYy51aw==.
Ethics statement
Ethical approval for this study was provided by East Midlands - Derby Research Ethics Committee (21/EM/0134, IRAS 288423 - CHIMERA Research Database). The studies were conducted in accordance with the local legislation and institutional requirements. Written informed consent for participation was not required from the participants or the participants’ legal guardians/next of kin in accordance with the national legislation and institutional requirements.
Author contributions
DA: Writing – review and editing, Formal Analysis, Methodology, Writing – original draft, Conceptualization, Visualization, Investigation, Software. MT: Software, Writing – review and editing. CB: Data curation, Writing – review and editing. VD-Z: Writing – review and editing, Supervision, Funding acquisition, Project administration, Conceptualization. NO: Funding acquisition, Project administration, Writing – review and editing, Conceptualization, Supervision.
Funding
The author(s) declare that financial support was received for the research and/or publication of this article. The authors are grateful for the funding and support of the EPSRC-funded CHIMERA Maths in Healthcare Hub (EP/T017791/1) and Department of Mathematics at UCL.
Acknowledgments
The authors would like to thank Dr. Mark Peters and Dr. Samiran Ray from Great Ormond Street Hospital and Dr. Steve Harris from University College London Hospitals for discussion and support of the project. We would also like to thank the UCL CHIMERA group, and in particular Professor Rebecca Shipley and Professor Christina Pagel for their invaluable comments and feedback. We would also like to thank Dr. Kyle Wedgwood from the University of Exeter for his helpful discussions and insights.
Conflict of interest
The authors declare that the research was conducted in the absence of any commercial or financial relationships that could be construed as a potential conflict of interest.
Correction note
This article has been corrected with minor changes. These changes do not impact the scientific content of the article.
Generative AI statement
The author(s) declare that no Generative AI was used in the creation of this manuscript.
Publisher’s note
All claims expressed in this article are solely those of the authors and do not necessarily represent those of their affiliated organizations, or those of the publisher, the editors and the reviewers. Any product that may be evaluated in this article, or claim that may be made by its manufacturer, is not guaranteed or endorsed by the publisher.
References
Albanese A., Cheng L., Ursino M., Chbat N. W. (2016). An integrated mathematical model of the human cardiopulmonary system: model development. Am. J. Physiology-Heart Circulatory Physiology 310, H899–H921. doi:10.1152/ajpheart.00230.2014
Albani F., Fusina F., Ciabatti G., Pisani L., Lippolis V., Franceschetti M. E., et al. (2021a). Flow index accurately identifies breaths with low or high inspiratory effort during pressure support ventilation. Crit. Care 25, 427. doi:10.1186/s13054-021-03855-4
Albani F., Pisani L., Ciabatti G., Fusina F., Buizza B., Granato A., et al. (2021b). Flow index: a novel, non-invasive, continuous, quantitative method to evaluate patient inspiratory effort during pressure support ventilation. Crit. Care 25, 196. doi:10.1186/s13054-021-03624-3
Branson R. D. (2007). Secretion management in the mechanically ventilated patient. Respir. Care 52 (10), 1328–1347. doi:10.4187/respcare.07521328
Cabeleira M. T., Anand D. V., Ray S., Black C., Ovenden N. C., Díaz-Zuccarini V. (2024). Comparing physiological impacts of positive pressure ventilation versus self-breathing via a versatile cardiopulmonary model incorporating a novel alveoli opening mechanism. Comput. Biol. Med. 180, 108960. doi:10.1016/j.compbiomed.2024.108960
Chen Z.-L., Yan Y.-Z., Yu H.-Y., Wang Q.-B., Wang W., Zhong M. (2024). Influence of compliance and resistance of the test lung on the accuracy of the tidal volume delivered by the ventilator. BMC Pulm. Med. 24, 498. doi:10.1186/s12890-024-03294-1
Cheng J., Diaz De La O F., Hristov P. (2025). Dynamic model updating through reliability-based sequential history matching. Mech. Syst. Signal Process. 232, 112689. doi:10.1016/j.ymssp.2025.112689
De Wit M. (2011). Monitoring of patient-ventilator interaction at the bedside. Respir. Care 56, 61–72. doi:10.4187/respcare.01077
Flevari A. G., Maniatis N., Kremiotis T. E., Siempos I., Betrosian A. P., Roussos C., et al. (2011). Rohrer’s constant, k2, as a factor of determining inspiratory resistance of common adult endotracheal tubes. Anaesth. Intensive Care 39, 410–417. doi:10.1177/0310057X1103900311
Glasmachers T., Schaul T., Yi S., Wierstra D., Schmidhuber J. (2010). “Exponential natural evolution strategies,” in Proceedings of the 12th annual conference on genetic and evolutionary computation, 393–400.
Goetz R. L., Vijaykumar K., Solomon G. M. (2022). Mucus clearance strategies in mechanically ventilated patients. Front. Physiology 13, 834716. doi:10.3389/fphys.2022.834716
Guglielminotti J., Alzieu M., Maury E., Guidet B., Offenstadt G. (2000). Bedside detection of retained tracheobronchial secretions in patients receiving mechanical ventilation: is it time for tracheal suctioning? Chest 118, 1095–1099. doi:10.1378/chest.118.4.1095
Harris R. S. (2005). Pressure-volume curves of the respiratory system. Respir. Care 50 (1), 78–99. doi:10.4187/respcare.05500078
Hess D. R. (2007). Airway clearance: physiology, pharmacology, techniques, and practice. Respir. Care 52 (10), 1392–1396. doi:10.4187/respcare.07521392
Hess D. R. (2014). Respiratory mechanics in mechanically ventilated patients. Respir. Care 59, 1773–1794. doi:10.4187/respcare.03410
Howroyd F., Chacko C., MacDuff A., Gautam N., Pouchet B., Tunnicliffe B., et al. (2024). Ventilator-associated pneumonia: pathobiological heterogeneity and diagnostic challenges. Nat. Commun. 15, 6447. doi:10.1038/s41467-024-50805-z
Jubran A., Tobin M. J. (1994). Use of flow-volume curves in detecting secretions in ventilator-dependent patients. Am. J. Respir. Crit. Care Med. 150, 766–769. doi:10.1164/ajrccm.150.3.8087350
Liu C. H., Niranjan S. C., Clark J. W. J., San K. Y., Zwischenberger J. B., Bidani A. (1998). Airway mechanics, gas exchange, and blood flow in a nonlinear model of the normal human lung. J. Appl. Physiology 84, 1447–1469. doi:10.1152/jappl.1998.84.4.1447
McInnes L., Healy J., Melville J. (2018). Umap: uniform manifold approximation and projection for dimension reduction. arXiv Prepr. arXiv:1802.03426. doi:10.48550/arXiv.1802.03426
Mietto C., Pinciroli R., Piriyapatsom A., Thomas J. G., Bry L., Delaney M. L., et al. (2014). Tracheal tube obstruction in mechanically ventilated patients assessed by high-resolution computed tomography. Anesthesiology 121, 1226–1235. doi:10.1097/ALN.0000000000000455
Mistry S., Brook B. S., Saffaran S., Chikhani M., Hannon D. M., Laffey J. G., et al. (2022). “A computational cardiopulmonary physiology simulator accurately predicts individual patient responses to changes in mechanical ventilator settings,” in 2022 44th annual international conference of the IEEE engineering in medicine and biology society (EMBC) (IEEE), 3261–3264.
Ngo C., Dahlmanns S., Vollmer T., Misgeld B., Leonhardt S. (2018). An object-oriented computational model to study cardiopulmonary hemodynamic interactions in humans. Comput. methods programs Biomed. 159, 167–183. doi:10.1016/j.cmpb.2018.03.008
Pal A., Holtorf F., Larsson A., Loman T., Schäefer F., Qu Q., et al. (2024). Nonlinearsolve.jl: high-performance and robust solvers for systems of nonlinear equations in julia. arXiv Prepr. arXiv:2403.16341. doi:10.48550/arXiv.2403.16341
Paratz J., Ntoumenopoulos G. (2014). Detection of secretion retention in the ventilated patient. Curr. Respir. Med. Rev. 10, 151–157. doi:10.2174/1573398x11666141229230526
Polak A. G., Mroczka J. (2006). Nonlinear model for mechanical ventilation of human lungs. Comput. Biol. Med. 36, 41–58. doi:10.1016/j.compbiomed.2004.08.001
Rackauckas C., Nie Q. (2017). Differentialequations.jl–a performant and feature-rich ecosystem for solving differential equations in julia. J. Open Res. Softw. 5, 15. doi:10.5334/jors.151
Roe T., Talbot T., Terrington I., Johal J., Kemp I., Saeed K., et al. (2025). Physiology and pathophysiology of mucus and mucolytic use in critically ill patients. Crit. Care 29, 68. doi:10.1186/s13054-025-05286-x
Salazar E., Knowles J. H. (1964). An analysis of pressure-volume characteristics of the lungs. J. Appl. Physiology 19, 97–104. doi:10.1152/jappl.1964.19.1.97
Sinderby C., Navalesi P., Beck J., Skrobik Y., Comtois N., Friberg S., et al. (1999). Neural control of mechanical ventilation in respiratory failure. Nat. Med. 5, 1433–1436. doi:10.1038/71012
Sundaresan A., Yuta T., Hann C. E., Chase J. G., Shaw G. M. (2009). A minimal model of lung mechanics and model-based markers for optimizing ventilator treatment in ARDS patients. Comput. Methods Programs Biomed. 95, 166–180. doi:10.1016/j.cmpb.2009.02.008
Tsaneva-Atanasova K., Pederzanil G., Laviola M. (2025). Decoding uncertainty for clinical decision-making. Philos. Trans. A 383, 20240207. doi:10.1098/rsta.2024.0207
Vicario F., Albanese A., Karamolegkos N., Wang D., Seiver A., Chbat N. W. (2015). Noninvasive estimation of respiratory mechanics in spontaneously breathing ventilated patients: a constrained optimization approach. IEEE Trans. Biomed. Eng. 63, 775–787. doi:10.1109/TBME.2015.2470641
Volpe M. S., Guimarães F. S., Morais C. C. A. (2020). Airway clearance techniques for mechanically ventilated patients: insights for optimization. Respir. Care 65, 1174–1188. doi:10.4187/respcare.07904
Younes M. (2002). “Proportional assist ventilation,” in Mechanical ventilation and weaning (Springer), 39–73.
Younes M., Brochard L., Grasso S., Kun J., Mancebo J., Ranieri M., et al. (2007). A method for monitoring and improving patient-ventilator interaction. Intensive Care Med. 33, 1337–1346. doi:10.1007/s00134-007-0681-4
Zamanian M., Marini J. J. (2006). Pressure-flow signatures of central-airway mucus plugging. Crit. Care Med. 34, 223–226. doi:10.1097/01.ccm.0000196216.49407.ee
Zhou C., Chase J. G., Knopp J., Sun Q., Tawhai M., Möller K., et al. (2021). Virtual patients for mechanical ventilation in the intensive care unit. Comput. Methods Programs Biomed. 199, 105912. doi:10.1016/j.cmpb.2020.105912
Appendix A
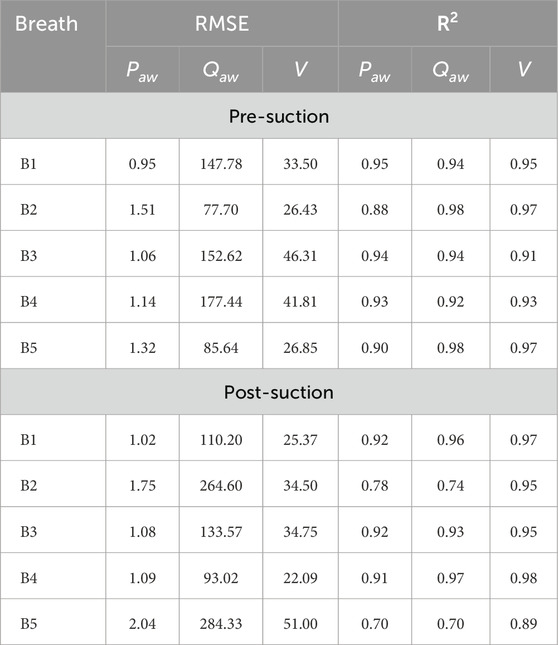
TABLE A1. Comparison of model performance for pre- and post-suction breaths across five cases (B1–B5). Metrics include RMSE and
Keywords: mechanical ventilation, airway clearance, secretion management, compartmental model, ventilator waveforms
Citation: Anand DV, Teixeira Cabeleira M, Black C, Diaz-Zuccarini V and Ovenden NC (2025) A feedback-driven ventilation model for assessing airway secretions in mechanically ventilated patients. Front. Physiol. 16:1612501. doi: 10.3389/fphys.2025.1612501
Received: 15 April 2025; Accepted: 23 May 2025;
Published: 13 June 2025; Corrected: 20 June 2025.
Edited by:
Aranyak Chakravarty, Jadavpur University, IndiaReviewed by:
Karthiga Devi S. G., Sri Ramachandra Institute of Higher Education and Research, IndiaKadambari Vijaykumar, University of Alabama at Birmingham, United States
Copyright © 2025 Anand, Teixeira Cabeleira, Black, Diaz-Zuccarini and Ovenden. This is an open-access article distributed under the terms of the Creative Commons Attribution License (CC BY). The use, distribution or reproduction in other forums is permitted, provided the original author(s) and the copyright owner(s) are credited and that the original publication in this journal is cited, in accordance with accepted academic practice. No use, distribution or reproduction is permitted which does not comply with these terms.
*Correspondence: Nicholas C. Ovenden, bi5vdmVuZGVuQHVjbC5hYy51aw==