 Chase Garcia1
 Ariana Banerjee1Claire Montgomery1Lauren Adcock1
 Izumi Maezawa2
 Jon Ramsey1
 Ana Cristina G. Grodzki1
 Kyoungmi Kim3
 Gino Cortopassi1*
- 1Department of Molecular Biosciences, School of Veterinary Medicine, University of California at Davis, Davis, CA, United States
- 2Department of Pathology and Laboratory Medicine, UC Davis Medical Center, University of California at Davis, Sacramento, CA, United States
- 3Department of Public Health Sciences, School of Medicine, University of California at Davis, Davis, CA, United States
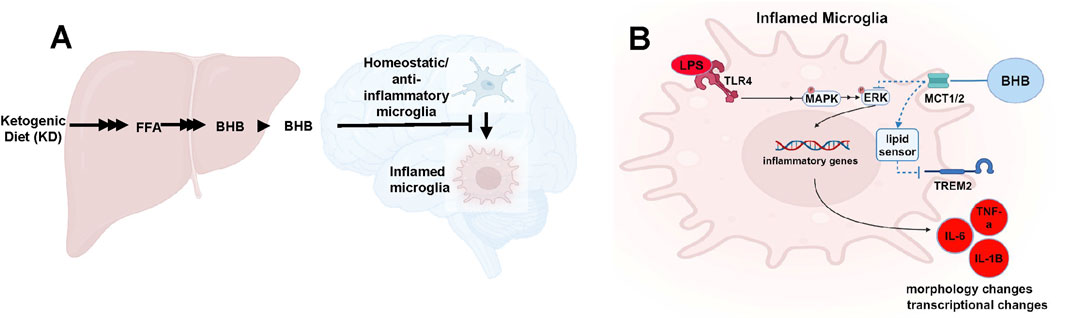
Introduction: The ketogenic diet (KD) increases mouse lifespan and health span, and improves late-life memory. This raises the question regarding the mechanism behind this effect. In mice on a KD, blood beta-hydroxybutyrate (BHB) levels uniquely rise higher than those of mice on a control diet (CD). BHB is therefore considered a key signaling and metabolic mediator of KD’s effects and benefits. BHB crossed the blood–brain barrier and rescued memory, improved cognitive function, and increased neuronal plasticity in two different mouse models of Alzheimer’s disease (PS1/APP and 5XFAD). At the cellular level, microglia are thought to play a critical role in the physiologic basis of memory due to their important role in synaptic development, plasticity, and connectivity. Conversely, microglial dysfunction and inflammation are connected to cognitive decline and neurodegenerative diseases. Because of this, one explanatory hypothesis for these positive therapeutic observations in mice is that the KD and BHB drive memory and longevity benefits through their anti-inflammatory actions on microglia.
Method: We investigated the concentration dependence of BHB’s antiinflammatory effects in BV2 microglial cells. We focused on 1.5 mM BHB, which reflects blood levels in mice and humans on a KD.
Results: At this concentration, BHB significantly and concentration-dependently decreased the following: 1) inflammatory cytokine expression (IL-6, TNF-α, and IL-1β), 2) inflammatory morphological changes, and 3) activation of p-ERK and p-p38MAPK, which are key pathways involved in microglial inflammation. We show, for the first time, that the expression of Alzheimer’s risk gene TREM2 is modified by dietarily-achievable 1.5 mM BHB. BHB’s anti-inflammatory, morphological, biochemical, and TREM2 effects were blocked by a monocarboxylate transporter (MCT) inhibitor, supporting the idea that BHB must enter microglia to elicit some of its anti-inflammatory effects.
Discussion: These results support the hypothesis that blood BHB levels achievable on a KD elicit significant concentration-dependent anti-inflammatory effects in microglia. Increasing BHB concentration through sustained KD, or BHB supplements, may lower microglial inflammatory tone and provide benefits in age-related memory loss.
Introduction
Alzheimer’s disease (AD) is an age-related irreversible neurodegenerative disease hallmarked by amyloid-beta (Aβ) plaque pathologies and typified by clinical signs of memory loss, confusion, and cognitive decline (Knopman et al., 2021). AD affected over 7 million Americans in 2024, accounting for 70% of all dementia cases, and is the fifth leading cause of death in the United States (Alzheimer’s Association, 2024). Despite >30 years of intense research and therapeutic development, effective therapies are limited.
Microglial dysfunction is related to cognitive decline in aging and AD (Gao et al., 2023). Microglia are the resident innate immune cells of the brain and respond to local injury and infection (Paolicelli et al., 2011). Importantly to AD, microglia also regulate synaptic development and long-term potentiation (LTP), which is a cellular marker of memory, connectivity, and plasticity (Paolicelli et al., 2011; Andoh and Koyama, 2021; Nguyen et al., 2020). Several recent papers support the concept that microglial function has a significant impact on AD risk and progression. Genetic data support that many AD risk factors are highly and selectively expressed in microglia (Hansen et al., 2018; Sala Frigerio et al., 2019). It has been suggested that microglial hyper-inflammation and overactive synaptic pruning may decrease synaptic plasticity in AD, suppress new memory formation, and contribute to AD symptoms (Hong et al., 2016; Vanderheyden et al., 2018; Brucato and Benjamin, 2020). Additionally, cytokines secreted from inflamed microglia may contribute to AD pathophysiology too (Wang WY. et al., 2015; Tanaka et al., 2014; Lyra et al., 2021).
Dysregulation of the microglial inflammatory tone may contribute to neurodegenerative diseases (Guo et al., 2022). Aging and other AD risk factors may converge on microglia to drive an aberrant, chronic, inflammatory state (Guo et al., 2022). This inflamed state may impair normal microglial and brain function, reduce clearance of amyloid plaques, and drive AD (Hansen et al., 2018; Wang WY. et al., 2015; Guo et al., 2022; Bernier et al., 2020; Ghosh et al., 2018; Dutta et al., 2023). Identifying nutritional or supplement strategies to reduce age- or AD-dependent microglial inflammation could have therapeutic benefits (Paidi et al., 2023).
A ketogenic diet (KD) is a diet that is very low in carbohydrates. In humans, a KD often contains less than 35 g of carbohydrates per day, whereas for mice, a KD contains ∼1% of the total kcal as carbohydrates (Zhou et al., 2023; Di Lucente et al., 2024a; Roberts et al., 2017). Consuming a KD causes a physiological increase in blood BHB. In mice on a KD, BHB is sustainably maintained at ∼1.5 mM. BHB levels of 1.5 mM are never sustainably achieved on an ad libitum control diet (CD) (Zhou et al., 2023; Di Lucente et al., 2024a; Roberts et al., 2017; Pathak et al., 2022; Newman et al., 2017). With good compliance, a KD can increase blood [BHB] in humans up to ∼2 mM (Newman and Verdin, 2017). On a KD, BHB functions as both a metabolic alternative to glucose and a potent signaling molecule that crosses the blood–brain barrier and can modulate microglial function (Newman and Verdin, 2017; Sun et al., 2023; González Ibáñez et al., 2023).
We and others previously showed that the KD, a diet extremely low in carbohydrates, extended longevity and improved late-life memory and cognition in aged C57Bl6 mice (Roberts et al., 2017; Newman et al., 2017). We previously analyzed blood BHB levels in aging C57Bl6 mice that experience memory loss and found that BHB levels were twice as high in mice on a KD compared to mice on a CD (Roberts et al., 2017; Newman et al., 2017), and only KD mice with 2X higher BHB levels experienced a significant memory benefit compared to CD24 mice. Similar results were seen when we and others tested BHB directly in the 5XFAD AD mouse model (Wu et al., 2020; Di Lucente et al., 2024b). These data suggest that increasing BHB levels may support increased memory, which leads to the question of how this might occur.
Recent in vitro and in vivo evidence suggests that BHB reduces microglial inflammation, and this is what leads to memory benefit in the AD context. BHB changed microglial morphology toward a nonreactive phenotype and increased transcription of anti-inflammatory cytokines (Polito et al., 2023; Zhang et al., 2022; Huang et al., 2018). We recently observed that BHB concentration-dependently suppressed human microglial inflammation and phagocytic dysfunction provoked by Aβ oligomer, and this suppression was more potent at 1.5 mM than at 0.1 mM33. Furthermore, we showed that 3 mM BHB applied directly to the hippocampi from PS1/APP mice, which are a mouse model of AD, rescued LTP (Di Lucente et al., 2024a). Thus, as microglia control synaptic plasticity and memory formation (Hong et al., 2016; Vanderheyden et al., 2018; Brucato and Benjamin, 2020), and respond to lipids and their derivatives, which include ketones (Wang Y. et al., 2015), it is our hypothesis that BHB, through its concentration-dependent anti-inflammatory effect in microglia, preserves memory at BHB concentrations that are only sustainably achieved on the KD (BHB = 1.5 mM) but not on a control diet in which the BHB levels are much lower.
In the current study, we focus on whether BHB’s positive therapeutic effects are concentration dependent and aim to identify the therapeutic range of this action. We chose to study the anti-inflammatory potency of BHB in the well-characterized BV2 microglial cell line. For the reasons stated above, in this study, we focused on the concentration-dependent effects of BHB from the low physiological blood BHB concentration range observed in ad libitum-fed mice and people on a CD, that is, ∼0.5 mM BHB to the high physiological BHB concentration range achieved sustainably on a KD, that is, ∼1.5 mM.
The results of our study support the view that BHB is concentration-dependently anti-inflammatory for mouse microglia and provide a potential clue as to why the KD increases synaptic plasticity and memory in the mouse models of AD PS1/APP (Di Lucente et al., 2024a) and 5XFAD (Wu et al., 2020; Di Lucente et al., 2024b). These results support the view that the KD, through its production of BHB, acts as an anti-inflammatory drug, and that the concentration of BHB controls its anti-inflammatory potency.
Results
Lipopolysaccharide (LPS) and BHB significantly altered microglial BV2 cell circularity
The potent inflammatory immunogen LPS, also known as endotoxin, induced BV2 microglia to assume a circular morphology (Figures 1A, B) that had minimal branching (Figure 1C), and these observations are consistent with inflamed microglial morphology (Vidal-Itriago et al., 2022). At two time-points after BHB and LPS administration, at 8 h and 14 h, BHB concentration-dependently decreased microglial circularity. At 8 h, 2.5–5 mM BHB significantly reduced circularity. As the BHB concentration increased, the LPS-induced circular phenotype became more branched; at the highest BHB concentrations, microglia adopted a more branched and elongated phenotype, like the untreated control [-BHB -LPS]. The effect of LPS is completely reversed at the 14 h time-point, at which 1.25 mM and 2.5 mM BHB completely and significantly rescued LPS-induced circular microglial morphology. BHB at the concentration of 5 mM reduced circularity past baseline. Thus, BHB concentration- and time-dependently rescued LPS-induced BV2 microglial circularity, which is associated with inflammatory potency.
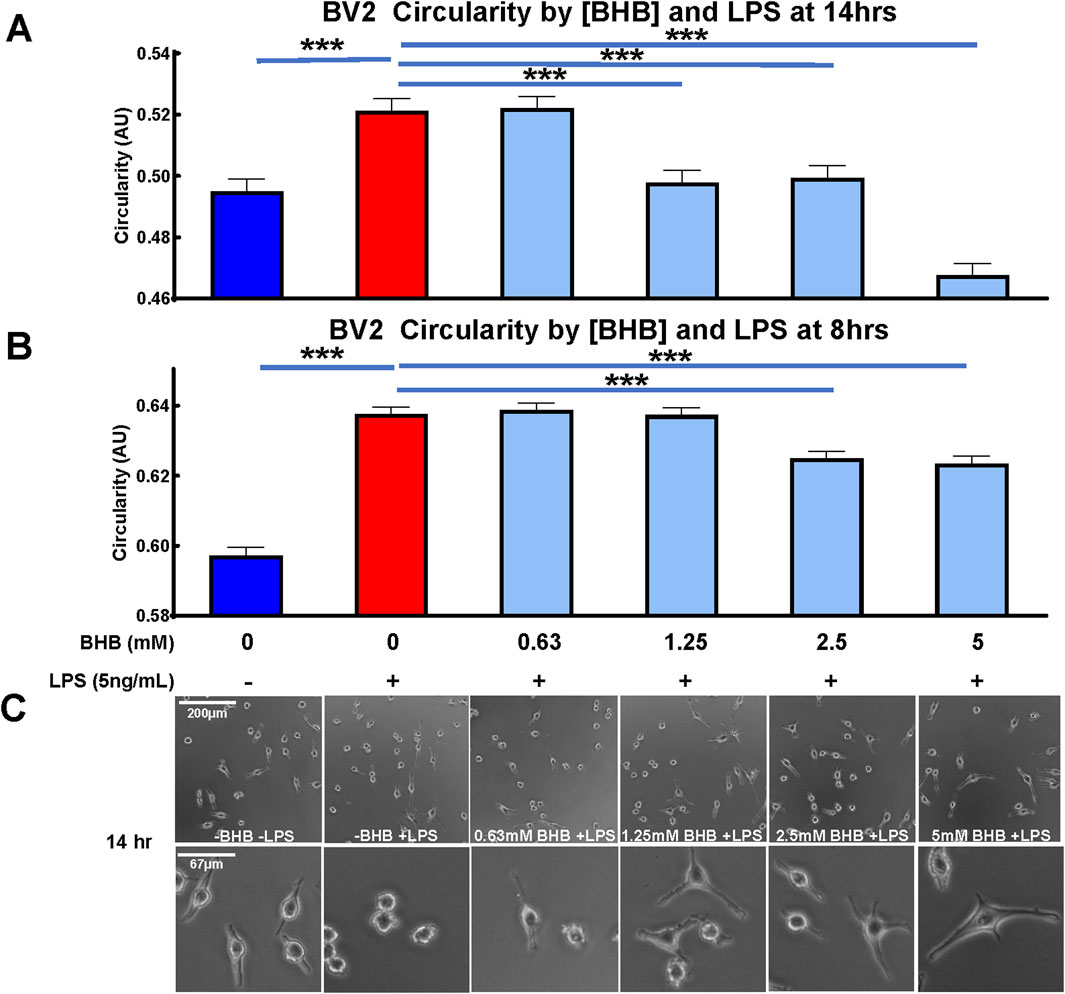
Figure 1. Beta-hydroxybutyrate (BHB) significantly decreased circularity in BV2 microglia in a concentration- and time-dependent manner. Circularity compares cell area to the perimeter on a scale of 0–1. Homeostatic/anti-inflammatory microglia are associated with low-circularity morphology, i.e., closer to 0. Cells were plated, incubated overnight, then supplemented with lipopolysaccharide (LPS) and BHB, and incubated for a specified time before imaging. (A, B) These data show that BHB concentration- and time-dependently decreased circularity at 8 (B) and 14 (A) hours after supplementing with increasing titration of BHB and 5 ng/mL LPS, suggesting that BHB promoted an anti-inflammatory phenotype in these microglia. These metrics were quantified from Calcein AM-derived fluorescent images captured by BioTek Cytation5 imager. Calcein AM only stains live cells, and thus, the changes presented here do not reflect changes in cell viability. An automated and unbiased thresholding process in Gen5 software application was used to outline cells and quantify the perimeter and area from these images. Bars are the mean +SEM. Each bar represents an average of ∼7,000 individual cell measurements. For statistical analysis, one-way ANOVA was used for a linear trend test on groups treated with LPS (p < 0.0001 for 8 h and 14 h time-points), followed by post hoc Dunnett’s tests for multiple comparisons, which compared baseline control and BHB exposure groups to the [LPS] control. Asterisks represent significance values from the post hoc Dunnett’s test. * = p < 0.05, ** = p < 0.01, and *** = p < 0.001. (C) Representative images of each group from (A) data, i.e. 14 h time-point, and they include two levels of magnification for images.
BHB concentration-dependently and significantly reduced inflammatory cytokine transcript levels
Figure 2 shows the BHB and LPS effects on inflammatory cytokine transcript levels, and upstream intracellular signaling. As expected, LPS significantly activated the transcription of canonical inflammatory cytokines: IL-6, TNF-α, and IL-1β. In contrast, BHB concentration-dependently and significantly decreased the transcription of these same cytokines, reaching a maximum of ∼50% inhibition at 1.5 mM BHB (Figure 2A).
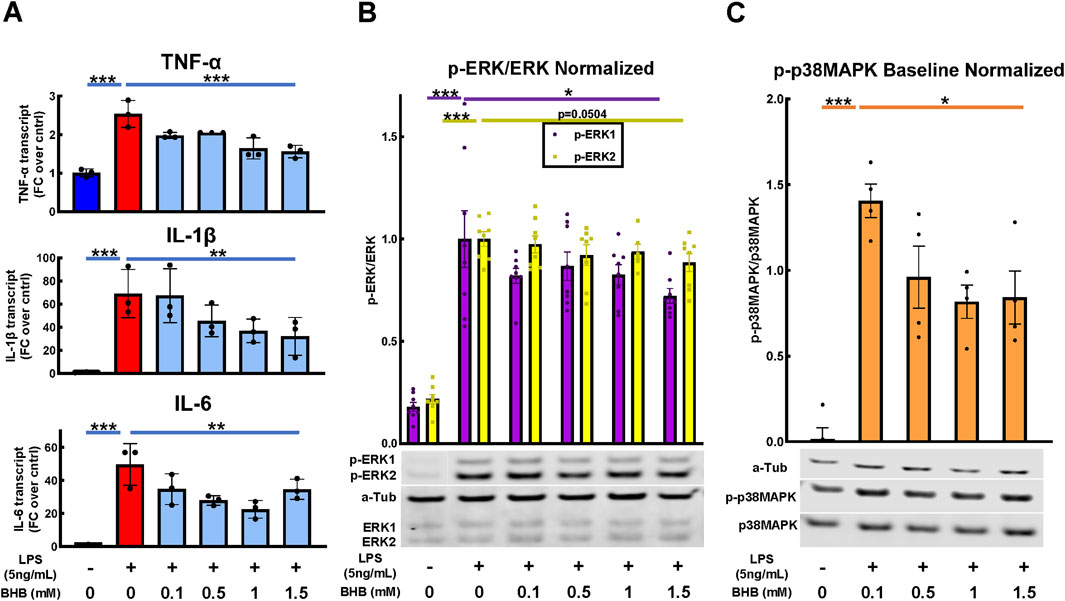
Figure 2. BHB concentration-dependently and significantly decreased pro-inflammatory cytokines 4 hrs after LPS was added, and upstream p-ERK and p-38MAPK signaling 1 h after LPS was added. BV2 cells were plated, incubated overnight, treated with LPS and BHB, and then incubated for a specified interval before samples were collected and processed for either qRT-PCR or Western blot. Bars are mean ± SEM. One-way ANOVA was used for a linear trend test comparing groups treated with LPS, followed by post hoc Dunnett’s tests for multiple comparisons, which compared baseline control and BHB exposure groups to the [LPS] control. * = p < 0.05, ** = p < 0.01, and *** = p < 0.001. (A) BHB concentration-dependently and significantly decreased LPS-activated transcription of canonical inflammatory cytokines IL-6, TNF-α, and IL-1β; three technical replicates per group. (B) BHB concentration-dependently decreased LPS-activated p-ERK1 and p-ERK2 signaling 1 h after 5 ng/mL LPS was added, and this was significant for p-ERK1. The test for p-ERK2 had p = 0.0504, with eight biological replicates per group. Representative Western blot images are shown. (C) BHB concentration-dependently and significantly decreased LPS-activated p-p38MAPK signaling 1 h after 5 ng/mL LPS was added. Data were baseline normalized to subtract homeostatic p38MAPK signaling, which was constitutively high in this cell type, with four biological replicates per group. Representative Western blot images are shown.
Next, we tested upstream signaling pathways that drive the expression of these inflammatory transcripts: ERK and p38 mitogen-activated protein kinase (p38MAPK) pathways. After LPS is added, phospho-ERK1/2 (p-ERK) and phospho-p38MAPK (p-p38MAPK) significantly increase, which indicates an increase in their activity. In contrast, BHB concentration-dependently and significantly decreased p-ERK1 and p-p38MAPK signaling up to 1.5 mM BHB (Figures 2B, C), thus suggesting that BHB downregulates inflammatory pathways even in the face of LPS.
Blocking MCT transporters or suppressing MCT expression suppressed BHB’s anti-inflammatory effects
BHB enters the cell through plasma membrane transporters monocarboxylate transporter 1 (MCT1) and monocarboxylate transporter 2 (MCT2) (Newman and Verdin, 2017), and there exists a specific inhibitor of these transporters, AR-C155858 (Ovens et al., 2010), which is hereafter referred to as monocarboxylate transporter blocker (MCT blocker or MCTB). At 30 min before adding BHB, cells were exposed to 100 nM MCT blocker, with the known 85% inhibitory concentration (Ovens et al., 2010), whereas the rest of the protocol was identical to that shown in Figure 2A. BHB’s anti-inflammatory effect on LPS-driven IL-6 and TNF-α transcript levels was reversed when MCT blocker was administered (Figure 3A). Additionally, as a confirmation test, we genetically knocked down MCT1/2 with siRNA and saw a similar trend as we did with pharmacologic inhibition (Figure 3B). Although these results were generally nonsignificant, they showed a trend that MCTB at least partially reversed the anti-inflammatory effect of BHB.
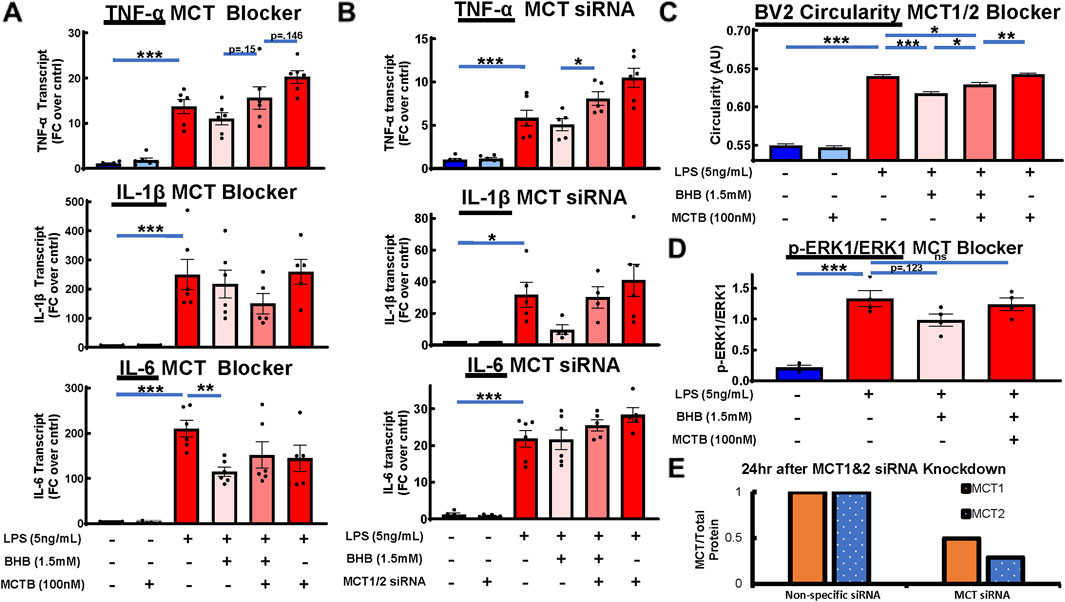
Figure 3. Pharmacologic and genetic MCT1/2 inhibition reversed BHB’s anti-inflammatory effect on cytokine transcripts. Pharmacologic MCT inhibition also reversed BHB’s effect on microglial circularity and p-ERK signaling. MCT1/2 are transporters that allow BHB to enter the cell. AR-C155858 (MCT blocker (MCTB)) is a potent pharmacologic MCT1 and MCT2 blocker. We used this blocker at 100 nM, which is known to inhibit 85% of MCT function. siRNA-mediated downregulation of MCT1 and MCT2 expression was also used. For all graphs: bars are mean ± SEM; one-way ANOVA with six levels was used, followed by Sidak’s post hoc pairwise group comparisons. Pre-determined comparisons that were tested were as follows: baseline control vs. LPS, LPS vs. LPS + BHB, LPS + BHB vs. LPS + BHB + MCTB, LPS vs. LPS + BHB + MCTB, and LPS + MCTB vs. LPS + BHB + MCTB. * = p <0.05, ** = p <0.01, and *** = p < 0.001. (A) MCT blocker partially inhibited BHB’s anti-inflammatory effects on transcript levels. Cells were plated, incubated overnight, and then treated with combinations of LPS, BHB, and MCT blocker. IL-6, TNF-α, and IL-1β transcriptional output were measured. Notably, the [LPS + BHB + MCTB] group and the [LPS + MCTB] group elicited different responses for TNF-α and IL-1β, suggesting that there are BHB-mediated effects that are not dependent on MCT-mediated BHB transport, with six technical replicates per group. (B) Genetic suppression of MCT1/2 had a similar profile as pharmacologic MCT1/2 suppression, and it partially reversed BHB’s anti-inflammatory effects on cytokine expression. BV2 cells were plated, incubated overnight, transfected with siRNA against MCT1and2, incubated overnight again, supplemented with 1.5 mM BHB and 5 ng/mL LPS, and then incubated for 4 h. Samples were collected for qRT-PCT. Knocking down MCT1/2 expression with siRNA ablated part of BHB’s anti-inflammatory effect on transcript levels. Similar to the MCTB data, the [LPS + BHB + siRNA] group and the [LPS + siRNA] group elicited different responses for all three transcripts, albeit not being significantly different, suggesting that there were BHB-mediated effects that are not dependent on MCT-mediated BHB transport, with six technical replicates per group. (C) Blocking BHB’s entry into the cell with pharmacologic monocarboxylate transporter blocker (MCTB) partially inhibited its anti-circular effect on microglial morphology. Cells were plated, incubated overnight, treated with combinations of MCTB, BHB, and LPS, and then assayed 8 h later. The same Cytation5 fluorescent imaging and data reduction protocol from Figure 1 was used to generate bar graphs. Blocking BHB’s entry into the cell with MCTB eliminated ∼45% of BHB’s anti-circular effect. However, like with the transcript data, MCTB did not eliminate all the anti-circular effect from BHB, suggesting that BHB had effects that are not dependent on MCT. Once we remove BHB, even with MCTB and LPS, microglial morphology returned to LPS-only levels. In this experiment, MCTB had no effect on its own on BV2 microglial morphology (∼10,000 individual cell measurements per group). (D) Blocking BHB’s entry into the cell with MCT blocker eliminated BHB’s downregulation of LPS-activated p-ERK signaling 1h after LPS was added. Cells were plated, incubated overnight, and then treated with LPS, LPS + BHB, or LPS + BHB + MCT blocker, and p-ERK and ERK levels were measured by Western blot, with four biological replicates per group. One-way ANOVA with four levels was used, followed by the Sidak’s post hoc group comparisons. Predetermined comparisons tested were as follows: baseline control vs. LPS, LPS vs. LPS + BHB, LPS + BHB vs. LPS + BHB + MCTB, and LPS vs. LPS + BHB + MCTB. * = p < 0.05, ** = p < 0.01, and *** = p < 0.001. (E) MCT1 and 2 protein over total protein with nonspecific and MCT siRNA were measured by Western blot, showing the degree of knockdown of MCT protein with the siRNA approach. Cells were plated, incubated overnight, transiently transfected with siRNA, and incubated for another day; then, cell pellets were collected, lysed, and ran through Western blot protocol. (E) siRNA knockdown of MCT1 and MCT2 reduced expression by 50%–75% 24 h after transfection, as measured by Western blot. BV2 cells were plated, incubated overnight, transfected the next afternoon, and incubated overnight again, and then the cells were lysed and ran through Western blot protocol. Bars are means (normalized to nonspecific siRNA control; n = 2).
Blocking MCT transporters also inhibited BHB’s suppression of p-ERK and circularity
An amount of 100 nM of MCT blocker was added 30 min before administering 1.5 mM BHB, whereas the rest of the protocol was identical to that shown in Figure 2B. The addition of MCTB eliminated BHB’s suppression of LPS-stimulated p-ERK signaling (Figure 3D). In addition, MCTB significantly blunted BHB’s anti-circularity morphologic effect. The significant effect of MCTB was evident when we compared the [LPS + MCTB + BHB] group to the [LPS + BHB] group (Figure 3C).
BHB significantly suppressed triggering receptor expressed on myeloid cells 2 (TREM2) expression, which was reversible by MCT blockade
Changes in TREM2 expression are connected to AD pathophysiology (Gratuze et al., 2018), and TREM2 variants confer AD risk (Benitez et al., 2013; Jin et al., 2014; Jin et al., 2015; Jonsson et al., 2013; Guerreiro et al., 2013). BHB significantly decreased TREM2 expression, and this effect appeared concentration dependent (Figure 4B). MCT blockade significantly abrogated BHB’s TREM2 effect (Figure 4A). These data support that BHB’s suppression of TREM2 required plasmalemmal BHB uptake.
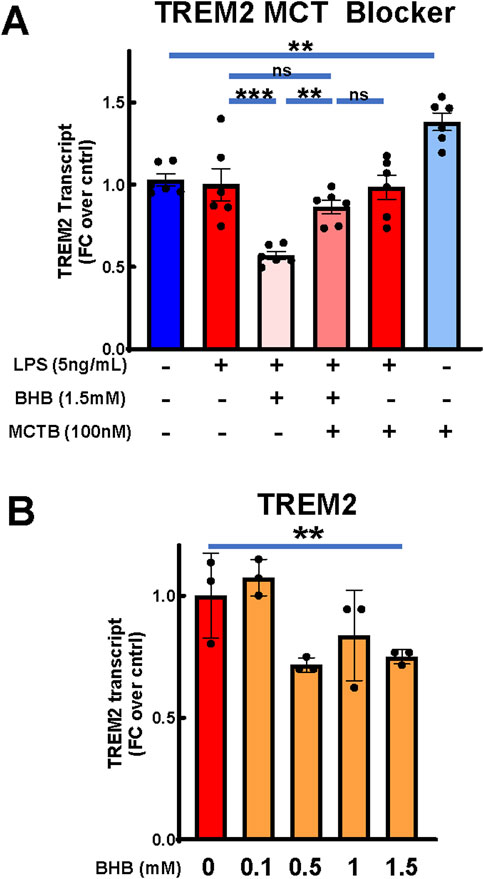
Figure 4. BHB significantly reduced microglial TREM2 expression, and this was significantly abrogated by MCT blocker. Cells were plated, incubated overnight, and then treated with combinations of LPS, BHB, and MCT blocker (AR-C155858), and TREM-2 transcriptional output was measured 4 h later. Bars are mean +SEM. (A) When treated with MCT blocker, BHB’s effect on TREM2 transcript levels in BV2 microglia was inhibited, with six technical replicates per group. One-way ANOVA with six levels was used, followed by the Sidak’s post hoc group comparisons. Preselected comparisons tested were as follows: baseline control vs. LPS. LPS vs. LPS + BHB, LPS + BHB vs. LPS + BHB + MCTB, LPS vs. LPS + BHB + MCTB, LPS + MCTB vs. LPS + BHB + MCTB, and baseline control vs. MCTB. * = p < 0.05, ** = p < 0.01, and *** = p < 0.001. (B) BHB mildly, but significantly and concentration-dependently, decreased transcription of TREM2 with 5 ng/mL LPS added to all groups, with three technical replicates per group. One-way ANOVA was used for a linear trend test. * = p < 0.05, ** = p < 0.01, and *** = p < 0.001.
BHB increased transcription of known anti-inflammatory cytokines IL-10 and TGF-β, and CD206
Whereas the above experiments were focused on BHB’s suppression of inflammatory microglial cytokines, we also measured BHB’s effects on known anti-inflammatory microglial cytokines, which can be elicited on a later time course: 24 h. While LPS suppressed transcription of IL-10 and CD206, once 1 mM BHB was added, all three transcripts increased above [LPS] the control; for IL-10, this effect was concentration-dependent and significant (Figure 5). For CD206, this effect significantly varied by BHB concentration (Figure 5).
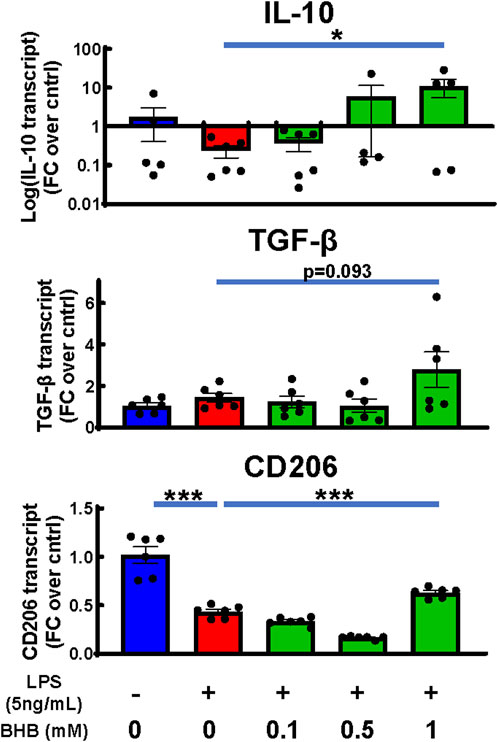
Figure 5. BHB rescued or increased anti-inflammatory markers under the same conditions as Figure 2A when extended to 24 hrs. Same conditions and methodology were used as for the cell experiment, RNA isolation, cDNA synthesis, and q-PCR in Figure 2A. The only difference is the incubation in BHB and LPS was extended to 24 h instead of 4 h, to measure the peak time-point for anti-inflammatory transcripts. Bars are mean ± SEM, with six technical replicates per group. One-way ANOVA was used for a linear trend test comparing groups treated with LPS, followed by post hoc Dunnett’s tests for multiple comparisons, which compared baseline control and BHB exposure groups to the [LPS] control. Left-skewed IL-10 data were log-transformed prior to statistical analysis. * = p < 0.05, ** = p < 0.01, and *** = p < 0.001.
Viability measurements via direct cell count and ATP concentration confirmed that the tested experimental conditions did not affect BV2 cell viability
We tested cell viability in response to increasing BHB concentration and confirmed via direct cell count (using Calcein AM fluorescent dye that only stains live cells) and ATP concentration that BHB does not affect cell viability (Supplementary Figure S1A). Additionally, we tested whether inhibiting MCT function influenced viability via the direct cell count method, and we observed no significant effects (Supplementary Figure S1B, C).
Discussion
We previously showed that a KD that produced significantly higher BHB levels than a CD preserved age-related memory loss in C57BL6 mice (Roberts et al., 2017), suggesting that BHB levels themselves may be a major driver of the KD’s benefit. We subsequently showed that the KD decreased inflammatory cytokines, suggesting that BHB itself may be concentration-dependently driving its anti-inflammatory effect (Zhou et al., 2023). In addition, we found that BHB was concentration-dependently anti-inflammatory to human iPSC microglia (Jin et al., 2023), but that did not necessarily explain its anti-inflammatory and pro-memory effect in mouse model AD brains (Di Lucente et al., 2024a; Wu et al., 2020; Di Lucente et al., 2024b), so we chose a mouse microglial cell model, BV2.
The goal of this work was to establish whether or not BHB has concentration-dependent anti-inflammatory effects on mouse microglial cells, which could explain the KD’s reduction of inflammatory cytokines systemically in mice (Zhou et al., 2023), the KD’s unique memory benefit vs. CD (Roberts et al., 2017), and the KD and BHB’s anti-inflammatory and pro-memory benefit in mouse AD models PS1/APP (Jin et al., 2023) and 5XFAD (Wu et al., 2020; Di Lucente et al., 2024b). Furthermore, we aimed to better define the optimal concentration range of BHB for the anti-inflammatory effect within the physiological range of blood BHB observed in vivo in mice and humans on a standard CD (<0.5 mM BHB) vs. a KD (1.5 mM).
Strengths, limitations, and suitability of the BV2 microglial cell model
BV2 microglia are a well-studied and characterized immortalized microglial cell model originally isolated from female C57Bl6 mice (Nissen, 2017a). Because of their reduced variability compared to primary microglia and their ability to be easily cultured and manipulated for experimentation, BV2 microglia are a very useful research tool. However, like all immortalized cell lines, they have their drawbacks, which must be acknowledged. Generally, the suitability of immortalized cell lines for experimentation has recently been questioned due to disparities between their behavior and that of their primary cell counterparts (Carter and Shieh, 2010). The very thing that makes them an easy-to-use research tool, the expression of oncogenes allowing quick proliferation and easy survival in culture, may significantly alter their biologic behavior compared to primary in vivo counterparts (Carter and Shieh, 2010; Stansley et al., 2012). Furthermore, BV2 basal morphology may differ and generally be more amoeboid than what would be seen from primary microglia in vivo (Horvath et al., 2008). That being said, BV2 microglia have been observed to maintain many core characteristics and functions of primary microglia, such as the expression of classic microglial cell markers, ability to respond to inflammatory stimuli, cytokine transcription, and phagocytosis (Kopec and Carroll, 1998; Blasi et al., 1990). Furthermore, and particularly relevant to our work in this study, BV-2 microglia were found to express 90% of the same genes as primary microglia in response to LPS; however, BV2’s upregulation of cytokines in response to LPS was far less pronounced than that of primary microglia (Henn et al., 2009).
Effects of sex on microglia and BHB metabolism
Something very important to note is the effect of sex on biological behavior. This is especially important to discuss in the context of microglia and their reactivity as many neurodegenerative diseases are simultaneously linked to dysregulated microglial biology and the higher prevalence in females, including but not limited to AD (Knopman et al., 2021; Gao et al., 2023). A full review of the effect of sex on microglial biology is complex, still needs significantly more investigation, and outside the scope of this work, but what is known has been reviewed by others (Nissen, 2017b; Lynch, 2022). Although there are many complexities to the effects of sex, and many of them are life-stage-dependent, two big themes emerge: one is that adult female microglia are generally more responsive to inflammatory stimuli and have higher basal inflammatory tone; the other is that the effect of sex has both a genetic basis and a hormonal basis (Nissen, 2017b; Lynch, 2022). The X-chromosome has the highest concentration of immune-related genes throughout the entire genome, and this may explain the higher incidence of autoimmune disorders in females (Bianchi et al., 2012). Additionally, female and male microglia express estrogen receptors but preferentially different isoforms, which potentially explains the differential effects of sex (Nissen, 2017b; Lynch, 2022). It is important to note that gene-based sex effects exist, but not hormonal sex effects, in our experiments because there are no sex hormones in our cell cultures. Even less well studied is the effect of sex on BHB dynamics and metabolism, especially on the KD. In female mice on a KD, it has been shown that as they age, they are more reliant on fat metabolism than males and maintain higher plasma BHB concentrations (Smolensky et al., 2023). In theory, this may mean that females could uniquely benefit from therapeutic ketosis in the AD context, but we do not know how sex affects microglial responses to BHB. More investigation is warranted.
LPS induces BV2 morphologic circularity that is concentration- and time-dependently suppressed by BHB at physiological BHB levels that are sustainably achieved on the KD but not on CD
Microglial function and activation state are closely tied to their morphology. In vivo, microglia reside in the brain and spinal cord, with long branches to sense their environment and then respond to stimuli. Once they sense injury, infection, etc., they retract their processes, become more circular (i.e., amoeboid) so they can move to the site of the injury/infection, produce cytokines, and otherwise respond appropriately (Huang et al., 2018; Vidal-Itriago et al., 2022). More circular microglia are associated with more reactive and inflammatory phenotypes, whereas more branched and less circular microglia are associated with less reactive/anti-inflammatory phenotypes (Vidal-Itriago et al., 2022). Furthermore, direct changes in cell morphology may directly alter the reactivity/activation state, as has been demonstrated for innate immune-cell macrophages (McWhorter et al., 2013). Thus, changes in microglial morphology are a useful biomarker of their reactivity and inflammatory potential.
As Figure 1 shows, LPS increased circularity, which is strongly correlated with inflammatory potency (Vidal-Itriago et al., 2022), and this circularity is concentration- and time-dependently suppressed by BHB. Another way of saying this is that BHB concentration- and time-dependently induces ramified, homeostatic microglial morphology within the physiological concentration range of BHB that is sustainably achieved on a KD but not on a CD. BHB decreased circularity even in the absence of LPS (Supplementary Figure S2A), suggesting that BHB’s anti-inflammatory effect is not dependent on the presence of an inflammatory stimulus. BHB’s circularity suppression was significantly blunted by MCT blockade, supporting the view that BHB plasmalemmal transport is required for circularity suppression (Figure 3C). However, we observed that BHB’s anti-circularity effects were not completely abrogated by MCT blockade. Two possible explanations occur to us: 1) BHB may be entering the cell via non-MCT-dependent mechanisms and 2) BHB may mediate anti-inflammatory effects on microglia extracellularly.
LPS activated p-ERK and p-p38MAPK pathways and the expression of downstream inflammatory cytokines IL-6, TNF-α, and IL-1β. BHB significantly and concentration-dependently suppressed these inflammatory effects
LPS activated the phospho-ERK1/2 and phospho-p38MAPK pathways that drive microglial inflammation (Murali and Rao, 2001; Shi et al., 2002; Chen et al., 2019; Roux and Blenis, 2004; Guha et al., 2001), and BHB concentration-dependently suppressed them (Figures 2B, C). These signaling pathways control LPS-mediated transcription of canonical inflammatory cytokines IL-6, TNF-α, and IL-1β. We observed that LPS significantly upregulated the transcription of these inflammatory cytokines, whereas BHB significantly and concentration-dependently suppressed them (Figure 2A). We also tested the effect of BHB on LPS-induced cytokine secretion on human HMC3 microglia because HMC3 microglia inducibly secrete IL-6 at the LPS concentrations we investigated in contrast to BV2 cells (Dello et al., 2018). It is known that BV2 inflammatory responses and cytokine secretion are attenuated compared to primary microglia when stimulated with LPS (Henn et al., 2009). We found that BHB significantly decreased LPS-stimulated IL-6 secretion at 1 mM and 5 mM (Supplementary Figure S3), which is the concentration range of blood BHB achievable only on a KD. Furthermore, these BHB-driven anti-inflammatory effects were abrogated by MCT blockade (Figures 3A–B), the known cellular transporters for BHB, supporting the view that BHB’s MCT-mediated uptake is required for some of BHB’s microglial anti-inflammatory effects. These data support the view that BHB not only concentration-dependently suppresses morphological changes consistent with inflammation observed in Figure 1 but also induces significant anti-inflammatory changes in microglial cytokine gene expression and the underlying p-ERK and p-p38MAPK cascades that drive that inflammation (Figures 2A–C).
Taken together, these data from Figures 1–3 suggest that BHB downregulates LPS-induced inflammatory processes starting at the beginning, signal transduction (Figures 2B, C), continuing through cytokine and transcriptional-level changes (Figure 2A), and all the way to changing the whole cell morphology (Figures 1A–C), and these effects can be blocked at the beginning by blocking BHB’s cellular uptake through MCT1/2 (3A–D). From the standpoint of the microglia in the brain that receive BHB through the blood–brain barrier, this supports the view that physiological BHB levels achievable on the KD could have significant anti-inflammatory effects on brain microglia in vivo.
Inhibiting BHB uptake through MCT reversed some of BHB’s anti-inflammatory effects, possibly suggesting extracellular BHB effects in these measured outputs
We believe that we are the first to address the pharmacological mechanism of BHB’s anti-inflammatory effect in BV2 microglia. We believe there are at least two, and possibly three, mechanisms that explain the overall results.
If we look at the inflammatory characteristic of circularity in the top right of Figure 3C, LPS significantly increases circularity, BHB significantly lowers it, and LPS + BHB + MCTB significantly raises circularity. This means that MCTB is reducing the anti-inflammatory potency of BHB, and as MCTB blocks BHB’s cell entry, we interpret this to mean that BHB entry is required to elicit BHB’s anti-inflammatory effect. In addition, something similar is observed in Figure 3D, where BHB reduces the central driving force of inflammation, phospho-ERK pathway activation, and it is blunted by MCTB that blocks BHB’s entry into the cell. This is mechanism 1.
Although blocking BHB’s uptake into the cell via pharmacologic or genetic means reversed part of BHB’s anti-inflammatory, anti-circular, and transcript effects, it did not reverse the whole effect (Figures 3A–C). In Figure 3A, MCTB + BHB + LPS does not completely bring the inflammatory endpoints back to the LPS baseline. This suggests that even when we inhibited BHB’s cellular uptake, BHB still had an anti-inflammatory effect. We saw this same trend in the MCT siRNA and MCTB circularity data; however, it is not significant (Figures 3B, C). Thus, this suggests that BHB either gained access to the cell through incomplete MCT inhibition, MCT-independent mechanisms, and/or it exerted some of its anti-inflammatory effect through not only intracellular pathways but also extracellular pathways, namely, hydrocarboxylic acid receptor 2 (HCA2) (Gonzatti and Goldberg, 2024), that is, mechanism 2; HCA2, also known as GPR109A, is a cell-surface GPCR that can bind niacin, BHB, and other monocarboxylic acids. HCA2 signaling has been documented to be anti-inflammatory in multiple studies in macrophages/microglia (Rahman et al., 2014; Offermanns and Schwaninger, 2015; Graff et al., 2016). In addition, knockdown of HCA2 via siRNA does significantly rescue the suppression of circularity induced by BHB (Supplementary Figure S4A). We interpret these data to mean that BHB elicits its anti-inflammatory effects in two ways: 1) through cell entry, which results in the activation of the p-ERK pathway that can be blocked with MCTB, and 2) through extracellular engagement of HCA2.
We also observed a trend from the MCTB and MCT siRNA transcript data that the [LPS + MCTB] group often had greater transcript expression than the [LPS] group alone. However, loss of MCT and its function alone had no significant effect on inflammatory transcript expression. Our third hypothesis is that there are likely other monocarboxylates in addition to BHB in the cell culture media that are anti-inflammatory. When these additional, anti-inflammatory monocarboxylates are prevented from entering the cell by MCTB, LPS could drive the inflammatory potential higher (mechanism 3). However, it is beyond the scope of this manuscript to isolate other, novel anti-inflammatory monocarboxylates; our goal is to better understand the anti-inflammatory mechanism of BHB. Despite lack of statistical significance, these multiple independent experiments in aggregate paint the same story that blocking BHB’s entry into the cell via either pharmacologic or genetic means at least partially, if not fully, reverses BHB’s anti-inflammatory effects.
Differences between MCT blocker and siRNA data may be due to differences in the experimental approach
While the trend was the same in the inflammatory cytokine transcript data between the MCTB and siRNA experiments, in the siRNA experiment, the anti-inflammatory effect of BHB and the reversal of this effect was not as pronounced as that seen in Figures 2A, 3A. We have two hypotheses as to why: 1) there were slightly different experimental conditions between the two approaches because siRNA knockdown of MCT1/2 added 24 h to the experimental timeline. These BV2 cells double every 12 h. Thus, there were ∼4x more cells at the time of experiment for siRNA experiments vs. MCTB experiments, and cell confluency can significantly change metabolic transcriptional profiles of cells in culture, including BHB. 2) The amount of protein knockdown achieved, which was ∼50–75% (Figure 3E), in contrast to the 85% inhibition of MCT1/2 via MCT blocker (Ovens et al., 2010) is another potential cause for the discrepancy. Thus, we see the same trend of results with the MCT blocker experiment (Figure 3A) and siRNA MCT knock down, and we hypothesize that the mild differences are due to experimental limitations with the siRNA technique.
Anti-inflammatory effects we observed are similar to the published reports of BHB’s effects in related lineage macrophages
Although reports of the effects of BHB in microglia are limited, there is more published research of BHB’s effects in functionally and developmentally similar cell types: monocytes and macrophages. In one study, BHB inhibited the activation of monocyte/macrophage NLRP3 inflammasome activation, which is a driver of some inflammatory diseases (Youm et al., 2015). In another study, BHB also ameliorated colitis by pushing macrophages toward an anti-inflammatory phenotype (Huang et al., 2022). BHB also induced a neuroprotective phenotype in monocytes/macrophages in an ischemic brain injury study (Rahman et al., 2014). These published reports in conjunction with our data support the hypothesis that BHB has anti-inflammatory effects in macrophage-like innate immune cells throughout the body.
BHB downregulated TREM2 expression, and this was dependent on BHB’s cellular uptake
We observed that BHB downregulated TREM2 expression in this BV2 microglial in vitro system (Figure 4B), and this effect was dependent on BHB’s uptake through MCT1/2 (Figure 4A). TREM2 is a microglial cell surface receptor that senses multiple lipid carriers, including ApoE4, HDL, and LDL status (Damisah et al., 2020; Nugent et al., 2020; Li et al., 2022), and it is intimately linked to microglial metabolism (Zheng et al., 2018). Microglia express TREM2, and its signaling promotes core, AD-relevant physiological functions of microglia: phagocytosis, chemotaxis, survival, and proliferation, and physiological synaptic pruning (Hansen et al., 2018; Jay et al., 2017).
Loss-of-function variants in TREM2 increase AD risk (Benitez et al., 2013; Jin et al., 2014; Jin et al., 2015; Jonsson et al., 2013; Guerreiro et al., 2013). One explanatory hypothesis is that the loss of microglial lipid-sensing ability is pro-inflammatory and part of the AD pathophysiology. We observed that BHB levels sustainably achieved on KD suppressed TREM2 receptor expression. Our interpretation and testable hypothesis is that higher KD-driven BHB concentration signals a lipid-replete state, decreasing the need for TREM2-based lipid sensing and lipid import (Figure 6B). The [MCTB] alone group compared to the control in Figure 4A lends itself to this theory too but displays the other side of this paradigm: when we inhibited the transport of oxidized lipids through MCT, TREM2 expression increased, possibly because it sensed a lipid-depleted state.
Figure 6. BHB is synthesized in the liver, then travels to the brain, where it antagonizes inflammatory microglial phenotypes and promotes resting/anti-inflammatory phenotypes (A), and the intracellular pathway implicated in this effect (B).
BHB increases microglial anti-inflammatory, homeostatic transcripts
BHB increased anti-inflammatory transcripts at 24 h after LPS/BHB was added (Figure 5). These data support the view that long-term physiological KD or BHB dosing may induce a longer-term change toward the anti-inflammatory microglial tone.
How this work fits with the existing literature
We have already complemented these BV2 data with human iPSC data; we previously showed that BHB dose-dependently suppressed inflammation in human iPSC microglia (Jin et al., 2023). That study was much less detailed, and many more inflammatory endpoints that were absent in the previous study were investigated in this study. The previous study did not include as many cytokines (two vs. the four in this study), did not include the morphometric estimates of inflammation-dependent circularity, and did not include measurements of p-ERK and p-38MAP kinase inflammatory pathways, and TREM2. Importantly, the previous study also did not show that the anti-inflammatory effects of BHB required cellular BHB import by chemical MCT knockdown and siRNA of MCT. Thus, by using BV2 cells, we were able to address many more inflammation mechanistic endpoints and pharmacological mechanisms than the previous work, and we identified that BHB dose-dependently suppresses the p-ERK/MAPK pathway that drives the inflammation. The fact that something similar happens in human iPSC microglia confirms that what we are seeing in mouse BV2 cells is more likely to be relevant to the human physiological condition. The homology of the mouse BV2 cell results are helping in building a mechanistic understanding of this effect; that is, that in some way, BHB is dose-dependently inhibiting the central drivers of inflammation, p-ERK and p-38MAPK, but how BHB is doing it is still to be discovered.
Regarding in vivo AD models, we have published that BHB dosed as KD or BHB itself reverses memory deficits in two in vivo mouse models of AD, PS1/APP (Di Lucente et al., 2024a) and 5XFAD (Di Lucente et al., 2024b), and our preliminary data in ApoE4 mice show something similar. Furthermore, other groups have shown similar benefit of KD/BHB in in vivo AD and aging mouse models (Zhou et al., 2023; Roberts et al., 2017; Pathak et al., 2022; Newman et al., 2017; Wu et al., 2020; Xu et al., 2022). There is evidence this is relevant to humans too (Phillips et al., 2021; Dyńka et al., 2022; Oliveira et al., 2024). BHB’s and KD’s potency to ameliorate multiple independent mouse models of AD is what motivated us to study BHB’s anti-inflammatory mechanism in more detail in BV2 cells.
Summary and prospects
In mice and humans, physiological levels of ∼1.5 mM BHB are sustainably achieved uniquely on the KD but not on an ad libitum or one-meal-a-day CD (Zhou et al., 2023; Di Lucente et al., 2024a; Roberts et al., 2017; Pathak et al., 2022). We and others uniquely observed memory benefits in C57BL6 mice on a KD but not on the CD. In addition, in PS1/APP and 5XFAD mice, we have observed significant increases in synaptic plasticity using BHB alone (Di Lucente et al., 2024a; Di Lucente et al., 2024b). In parallel to the above memory benefits of BHB, in this work, we observed concentration-dependent anti-inflammatory effects of BHB on mouse microglial cells precisely in the concentration range of BHB that produced the memory benefit in aging C57Bl6 mice, PS1/APP and 5XFAD mice. We showed that BHB’s suppression of the p-ERK and p-MAPK pathways, inflammatory cytokine elicitation, and inflammatory morphology are all reversible by blocking BHB’s entry into the cell using an MCT inhibitor. These data support the idea that BHB, through its concentration-dependent suppression of inflammatory processes, may be driving the KD’s memory benefit, and that maximizing BHB levels through a KD or with BHB supplements could potentially support memory deficits in humans in the aging or AD context.
Methods
For all experiments, BV2 (RRID: CVCL_0182) microglial cells (originally derived from female C57/Bl6 mice (Nissen, 2017a)) were used. They were acquired directly from AcceGen with appropriate documentation confirming their authenticity and the known genetic mutations to this cell line, which is detailed in the materials table. Cells were continuously cultured in ∼35 mL 10% fetal bovine serum (FBS) Dulbecco’s modified Eagle medium F12 (DMEM/F12) in T175 flasks. Then, they were sub-cultivated at a 1:20 (0.5 mL from 10 mL cell suspension) ratio every 2 or 3 days. Cells between passage numbers 6 to 15 were used in this study. For all plate-based assays, plate effects were not observed nor measured. To further reduce the risk of plate effects, all wells were plated, but edge wells were excluded from analysis. Whenever LPS was used, it was always at 5 ng/mL final and added at 100 x concentration. Catalog numbers and manufacturers of reagents used are summarized in Table 1.
Table 1. Materials.
Cell viability assays
BV2 microglia were plated at 6e3 cells/cm2 in 100 µL/well with 2% FBS Dulbecco’s modified Eagle medium (DMEM) in a 96-well plate, incubated overnight, and then treated with BHB ranging from 0 to 5 mM for 20 h. Then, cell viability was assessed via two different methods: direct cell count and ATP concentration. Direct cell count was carried out by measuring cells co-stained with Hoechst 33342 and Calcein AM, which only stains live cells. ATP measurements were done using the well-validated Cell-Titer Glo method using the manufacturer protocol (Riss et al., 2024). Additionally, the viability of BV2 microglia treated with LPS, BHB, and MCTB was assessed. Cells were plated at 6e3 cells/cm2 in 100 µL/well 2% FBS DMEM in a 96-well plate, incubated overnight, and then treated with MCTB, LPS, and BHB for 20 h. Direct cell count was carried out by measuring cells co-stained with Hoechst 33342 and Calcein AM, which only stains live cells. Measurements are displayed as fold change compared to control.
Morphometric analysis of microglia
Cells were plated at 6e3 cells/cm2 in a tissue-culture-treated 96-well plate in 100 µL/well 2% FBS Eagle’s minimal essential media (EMEM) and incubated overnight in a 37 ℃ 5% CO2 incubator. Each experimental group was a combination of individual cell measurements across 4–12 wells. Again, plate effects were not observed nor measured; thus, we had no a priori expectation of difference between identically treated wells. To further reduce the risk of plate effects, all wells were plated, but the edge wells were not analyzed. Next morning, cells were treated with 0–5 mM BHB. Cells were incubated for an additional 30 min. Cells were then treated with 0 or 5 ng/mL LPS. Cells were incubated for an additional 8 or 14 h, and 80% of cell media was removed and replaced with 1 µM Calcein AM and 4 µM Hoechst 33342 in Dulbecco’s phosphate-buffered saline (DPBS) +Ca2+ +Mg2+. This allowed for clear visualization of the cell and its boundaries (Calcein AM–GFP channel) and nuclei (Hoechst 33342–DAPI channel). Live cells were imaged at 10x in our BioTek Cytation 5 high-throughput non-confocal imager on GFP, DAPI, phase contrast, and brightfield channels. We generated a protocol in Cytation 5 Gen 5 software application to automatically generate regions of interest (ROIs) based on unmodified thresholded Calcein AM fluorescent cell images. Calcein AM only stains live cells; thus, these morphometric analyses do not reflect changes in cell viability. This system is ideal because there is no human observer bias, and the thresholding is consistent across the whole experiment. From these ROIs, we generated a circularity metric per cell, which is a metric that is on a 0–1 scale and calculated according to the formula: circularity = 4π*A/perimeter2. Individual cell measurements were pooled across identically treated wells. These findings were validated via a blinded observer that hand-drew cell outlines. ImageJ was used to outline cells, and from these outlines, we could measure the perimeter of the outline and area contained within to calculate circularity.
RNA isolation, cDNA synthesis, and q-PCR
Cells were plated at 6e3 cells/cm2 in 5 mL 2% FBS EMEM in T25 flasks and incubated overnight in a 37°C 5% CO2 incubator. On the next day, cells were then switched to 5 mL 2% FBS no-glucose DMEM supplemented with 0–1.5 mM BHB. After incubating for an additional 30 min, cells were then treated with 5 ng/mL LPS. Cells were incubated for an additional four (IL-6, TNF-α, IL-1β, and TREM2 transcripts) or 24 (IL-10, TGF-β, and CD206) hours. Cells were then lysed, and RNA was isolated using a Qiagen RNeasy micro kit [RNA] and normalized. cDNA was synthesized using the SuperScriptIII First Strand Synthesis System. qPCR was run with the Powerup SYBR Green qPCR Master-Mix according to protocol: 50 °C for 2min, 94 °C for 5 min, and 38 cycle x (94 °C for 15”, 58°C for 30”). Primer sequences are shown in Table 1 in Materials section. All primers were developed against coding sequences of the corresponding protein. Data were normalized to β-actin as the housekeeping gene via the delta delta-Ct method and then to the baseline control group. β-actin was confirmed to not change across the experimental groups.
Western blot for p-ERK1/2 p-p38MAPK signaling experiments
Cells were plated at 6e3 cells/cm2 in 2 mL 2% FBS EMEM in a tissue-culture-treated, 6-well plate and incubated overnight in a 37°C 5% CO2 incubator. On the next day, cells were then switched to 2 mL 2% FBS no-glucose DMEM supplemented with 0–1.5 mM BHB. After incubating for an additional 30 min, cells were then treated with 5 ng/mL LPS. Cells were incubated for an additional 1 h. Cells were lysed with 0.2 mL Cell Signaling lysis buffer supplemented with Roche protease and phosphatase inhibitors. Cell lysates were collected, and protein concentration was quantified using the Bradford assay with subsequent dilution with lysis buffer. An amount of 12µg protein per well (10µL/well) were run on 26-well gel NuPAGE™ Bis-Tris Midi Protein Gels. Gel electrophoresis was run at 80 V for 20 min and then at 120 V for 2 h. Protein was transferred onto 0.2 um nitrocellulose. Blots were blocked in Licor TBS blocking buffer. Blots were probed for p-ERK1/2 (1:1000), ERK1/2 (1:1000), p-p38MAPK (1:2000), p38MAPK (1:1000), and α-Tubulin (1:5000) in Licor TBS blocking buffer overnight at 4°C. Blots were washed 3 x, for 5 min each in TBST (Tween 0.1%). Licor secondary antibodies were probed at 1:15,000 in TBS blocking buffer. Blots were washed 3 x, for 5 min each in TBST (Tween 0.1%). Images were taken with Licor Odyssey CLx and analyzed with Image Studio for densitometry quantification. Boxes for quantification were uniform in size across an individual experiment. Antibodies are commercially available from Cell Signaling, whose website provides citations (hundreds if not thousands of citations per antibody because these antibodies are so widely used) and in-house validation experiments for each antibody.
AR-C155858 MCT1/2 blocker experiments
AR-C155858 (MCTB) is a potent MCT1 and MCT2 inhibitor (Ovens et al., 2010). MCT1/2 are transporters that allow BHB to enter the cell (Newman and Verdin, 2017). For these experiments, we used 100 nM AR-C155858 because this is the lowest concentration to achieve maximal MCT1/2 inhibition, which is ∼85% transport reduction (Ovens et al., 2010). Utilizing this inhibitor required minimal alterations to the existing methods and protocols for analogous experiments (e.g., Figures 2A vs. 3A). AR-C155858 was dissolved in DMSO, and the final concentration of DMSO was 0.01%. An amount of 0.01% DMSO was maintained across all experimental groups in experiments involving AR-C155858. The inhibitor was added 30 min before dosing with BHB. All other experimental conditions were maintained the same.
MCT1/2 siRNA knockdown
To knock down MCT1/2, we used the Oz Biosciences Glial-Mag magnetofection kit due to its reported increased transfection efficiency over other siRNA transfection protocols, lack of toxicity and inflammatory activation, design, which is specifically for microglia (reported in BV2 cells too), and ease of use (Smolders et al., 2018; Carrillo-Jimenez et al., 2018). Cells were plated at 6e3 cells/cm2 in 2 mL 2% FBS EMEM in a 6-well plate and incubated overnight in a 37 °C 5% CO2 incubator. On the next day, 2 h before transfection, cell media were switched to 2 mL 0% FBS Opti-MEM. Cells were transfected according to the manufacturer’s protocol at a ratio of 6 uL Glial-Mag transfection reagent to 1.5 ug siRNA per well in 2 mL of media in a 6-well dish. These ratios were chosen based on experimental optimization for maximal siRNA transfection efficiency. After transfection, the cells were transferred back into a 37 °C 5% CO2 incubator. Cells were incubated on a magnetic plate for 20 min. Cells were then removed from the plate and allowed to be incubated for an additional 2 h. Cell media were then replaced with 2 mL 1% FBS Opti-MEM. Cells were incubated overnight. Next day, cells went through the same experimental methods described in the “RNA isolation, cDNA synthesis, and q-PCR” section.
IL-6 secretion ELISA of HMC3 cell culture supernatants
BV2 cells do not inducibly secrete inflammatory cytokines to detectable levels at our tested LPS concentrations. To test the impact of BHB on microglial inflammatory secretory function, we used HMC3s, a human microglial cell line, as a model system because of HMC3’s inducibility to secrete IL-6 (Dello et al., 2018), an important and classic inflammatory cytokine, at the concentrations of LPS that we tested. HMC3 cells were plated at 6e3 cells/cm^2 in 200 uL 10% FBS DMEM/F12 media in 96-well dishes and incubated overnight; then, the media were changed to 2% FBS EMEM and supplemented with varying concentrations of LPS (0–6.25 ng/mL) and BHB (0–5 mM) and incubated overnight again; and then, IL-6 in the media was measured the next day using Abcam IL-6 ELISA kit. Cell number was counted at the end of the experiment using Hoechst 33342 dye and the Cytation5 imager direct cell count method. Data were normalized to the cell number.
Statistics
All statistical analyses were carried out as directed by biostatistician Dr. Kyoungmi Kim, and Dr. Kim approved the final version of all the figures and manuscript. All statistical analyses were performed using GraphPad Prism 10.2.3 (GraphPad Software Inc., San Diego, CA). Prior to statistical inference tests, the analysis of residuals was performed to validate the normality and homoscedasticity assumptions. For group comparisons, one-way ANOVA or two-way ANOVA was used, followed by Dunnett, Sidak, or Tukey’s post hoc tests for pairwise group comparisons with adjustment for multiple comparisons, as appropriate. For experiments testing the concentration dependence of BHB for specified outcomes, one-way ANOVA was used to test for a linear trend in the group means as a function of the concentration level, followed by post hoc Dunnett’s tests for comparing the BHB exposure groups to the [LPS] control group, with adjustment for multiple comparisons. Data are presented as mean ± standard error of the mean (SEM). Group sizes are noted in figure legends. The use of either biological or technical replicates is specified in the figure legends. Biological replicates are biologically distinct samples treated in the same conditions (e.g., wells), whereas technical replicates are repeated measurements from the same sample. * = p < 0.05, ** = p < 0.01, and *** = p < 0.001. Adjusted p-values for multiple testing are reported in Table 2 and figures.
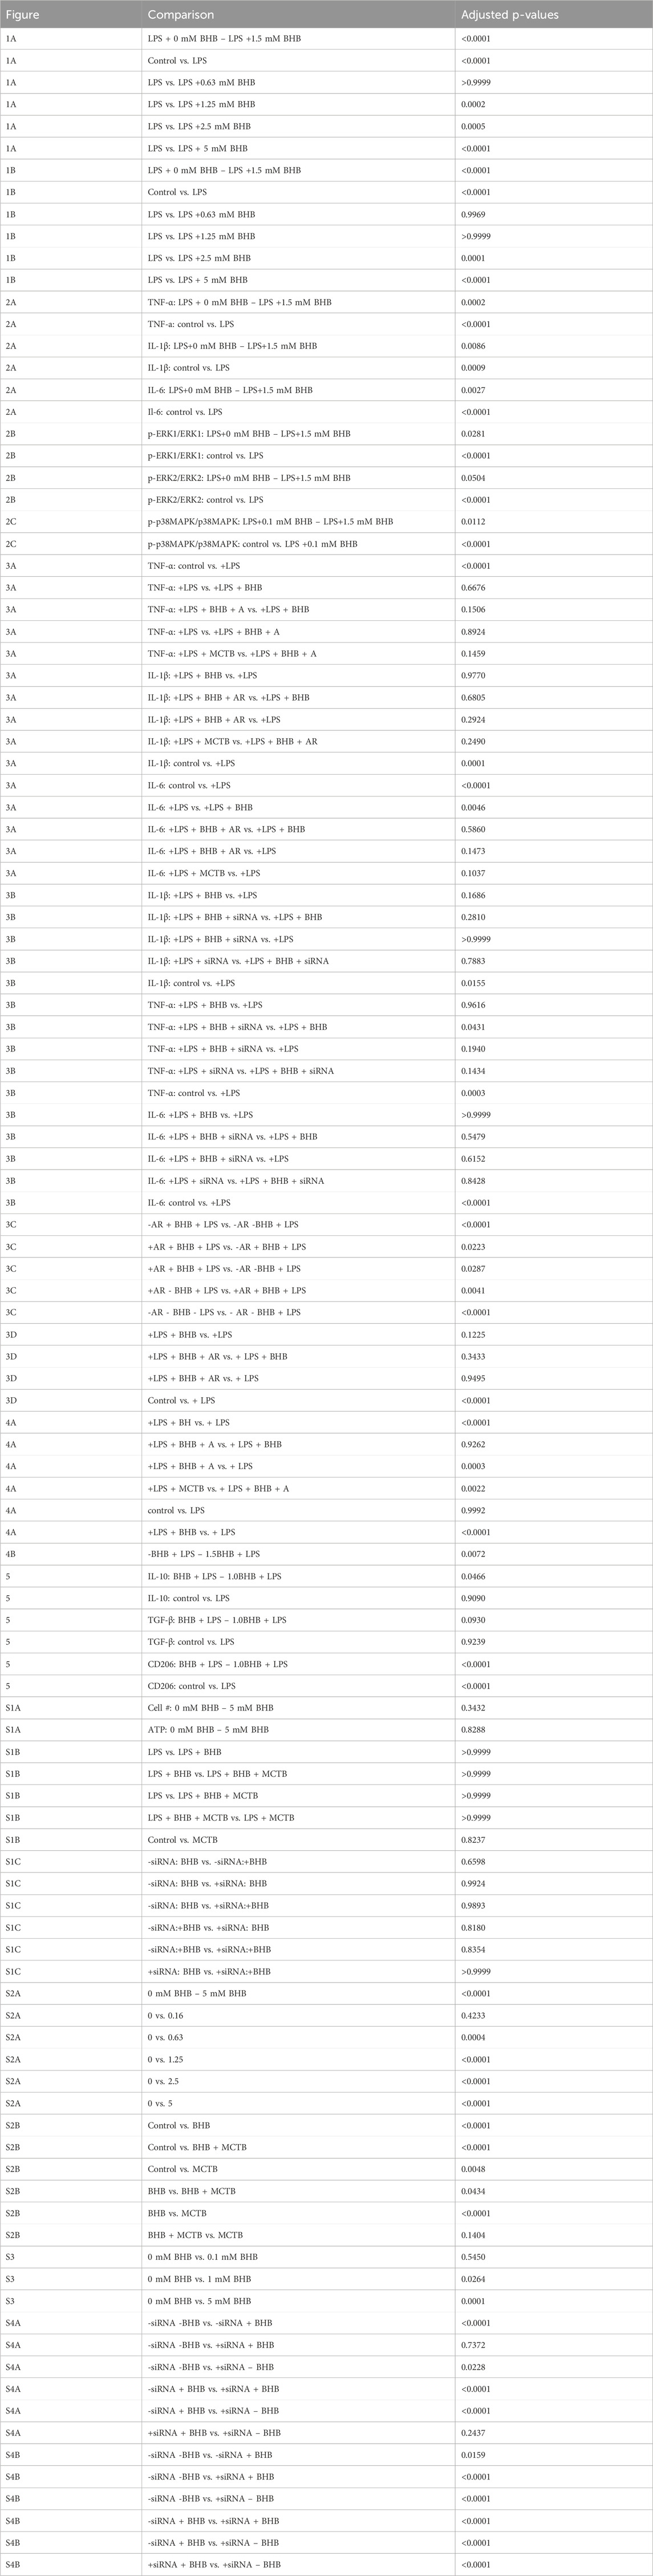
Table 2. Comparisons and p-values.
Scope
This work fits well within the Frontiers in Aging scope because it attempts to uncover the molecular and cellular mechanisms underlying the previously observed longevity, memory, and cognitive benefits in aged and AD mouse models on a KD or BHB. We previously showed that KDs, but not control diets, improved memory in aged C57BL6 mice, and BHB levels uniquely increased on a KD, which suggests that BHB itself improved memory. Our other work showed that BHB was dose-dependently anti-inflammatory in human microglial cells, and this may explain previous in vivo observations. However, to understand the anti-inflammatory and pro-memory effect of the KD in mice, we tested whether BHB’s anti-inflammatory effect is concentration-dependent in a mouse microglial cell line. We showed that BHB was concentration-dependently anti-inflammatory in mouse microglial cells, and these anti-inflammatory effects were present precisely in the concentration range of BHB that produced positive therapeutic benefit in aged C57Bl6 mice, PS1/APP, and 5XFAD mice. This work suggests that BHB is the causative agent for the cognitive benefits we have observed in various mouse models of aging and AD and supports the view that maximizing BHB levels through a KD or with BHB supplements could support cognitive health span in humans.
Data availability statement
The raw data supporting the conclusions of this article will be made available by the authors, without undue reservation.
Ethics statement
Ethical approval was not required for the studies on humans in accordance with the local legislation and institutional requirements because only commercially available established cell lines were used. Ethical approval was not required for the studies on animals in accordance with the local legislation and institutional requirements because only commercially available established cell lines were used.
Author contributions
CG: supervision, writing – original draft, formal analysis, writing – review and editing, software, data curation, investigation, funding acquisition, resources, project administration, conceptualization, methodology, validation, and visualization. AB: writing – review and editing, investigation, and data curation. CM: supervision, writing – review and editing, resources, formal analysis, data curation, methodology, visualization, investigation, and validation. LA: writing – review and editing, formal analysis, data curation, and investigation. IM: conceptualization, project administration, writing – review and editing, and methodology. JR: conceptualization, writing – review and editing, formal analysis, methodology, and supervision. AC: data curation, methodology, conceptualization, and writing – review and editing. KK: formal analysis, writing – review and editing, and methodology. GC: resources, writing – review and editing, investigation, formal analysis, writing – original draft, visualization, validation, funding acquisition, conceptualization, project administration, methodology, and supervision.
Funding
The author(s) declare that financial support was received for the research and/or publication of this article. The authors would like to thank the National Institute on Aging (NIA) for funding for this work. Funding for GC through grant 5P01AG062817 and funding for CG through grant F31AG079625 supported this work. Ana Cristina Grodzki was supported by the IDDRC (UC Davis MIND Institute’s Intellectual and Developmental Disabilities Research Center grant P50 HD103526. The authors would also like to acknowledge the Freedland Fellowship at UC Davis for supporting this work.
Acknowledgments
The authors acknowledge BioRender as the tool used to create the graphical abstract and concept figures.
Conflict of interest
The authors declare that the research was conducted in the absence of any commercial or financial relationships that could be construed as a potential conflict of interest.
Generative AI statement
The author(s) declare that no Generative AI was used in the creation of this manuscript.
Publisher’s note
All claims expressed in this article are solely those of the authors and do not necessarily represent those of their affiliated organizations, or those of the publisher, the editors and the reviewers. Any product that may be evaluated in this article, or claim that may be made by its manufacturer, is not guaranteed or endorsed by the publisher.
Supplementary material
The Supplementary Material for this article can be found online at: https://www.frontiersin.org/articles/10.3389/fragi.2025.1628835/full#supplementary-material
References
Alzheimer’s Association (2024). Alzheimer’s facts and figures report | Alzheimer’s association. Available online at: https://www.alz.org/alzheimers-dementia/facts-figures (Accessed May 31, 2024).
Andoh, M., and Koyama, R. (2021). Microglia regulate synaptic development and plasticity. Dev. Neurobiol. 81 (5), 568–590. doi:10.1002/DNEU.22814
Benitez, B. A., Cooper, B., Pastor, P., Jin, S. C., Lorenzo, E., Cervantes, S., et al. (2013). TREM2 is associated with the risk of Alzheimer’s disease in Spanish population. Neurobiol. Aging 34 (6), 1711.e15–1711.e17. doi:10.1016/J.NEUROBIOLAGING.2012.12.018
Bernier, L. P., York, E. M., and MacVicar, B. A. (2020). Immunometabolism in the brain: how metabolism shapes microglial function. Trends Neurosci. 43 (11), 854–869. doi:10.1016/j.tins.2020.08.008
Bianchi, I., Lleo, A., Gershwin, M. E., and Invernizzi, P. (2012). The X chromosome and immune associated genes. J. Autoimmun. 38 (2-3), J187–J192. doi:10.1016/J.JAUT.2011.11.012
Blasi, E., Barluzzi, R., Bocchini, V., Mazzolla, R., and Bistoni, F. (1990). Immortalization of murine microglial cells by a v-raf/v-myc carrying retrovirus. J. Neuroimmunol. 27 (2-3), 229–237. doi:10.1016/0165-5728(90)90073-V
Brucato, F. H., and Benjamin, D. E. (2020). Synaptic pruning in Alzheimer’s disease: role of the complement system. Glob. J. Med. Res. 20 (6), 1–20. doi:10.34257/GJMRFVOL20IS6PG1
Carrillo-Jimenez, A., Puigdellívol, M., Vilalta, A., Venero, J. L., Brown, G. C., StGeorge-Hyslop, P., et al. (2018). Effective knockdown of gene expression in primary microglia with siRNA and magnetic nanoparticles without cell death or inflammation. Front. Cell Neurosci. 12, 313. doi:10.3389/fncel.2018.00313
Carter, M., and Shieh, J. C. (2010). Cell culture techniques. 281–296. doi:10.1016/B978-0-12-374849-2.00013-6
Chen, M. J., Ramesha, S., Weinstock, L. D., Gao, T., Ping, L., Xiao, H., et al. (2019). Microglial ERK signaling is a critical regulator of pro-inflammatory immune responses in Alzheimer’s disease. bioRxiv 10, 798215. doi:10.1101/798215
Damisah, E. C., Rai, A., and Grutzendler, J. (2020). TREM2: modulator of lipid metabolism in microglia. Neuron 105 (5), 759–761. doi:10.1016/j.neuron.2020.02.008
Dello, R. C., Cappoli, N., and Coletta, I. (2018). The human microglial HMC3 cell line: where do we stand? A systematic literature review. J. Neuroinflammation 15 (1), 1–24. doi:10.1186/S12974-018-1288-0
Di Lucente, J., Persico, G., Zhou, Z., Jin, L. W., Ramsey, J. J., Rutkowsky, J. M., et al. (2024a). Ketogenic diet and BHB rescue the fall of long-term potentiation in an Alzheimer’s mouse model and stimulates synaptic plasticity pathway enzymes. Commun. Biol. 7 (1), 195–11. doi:10.1038/s42003-024-05860-z
Di Lucente, J., Ramsey, J. J., Jin, L. W., and Maezawa, I. (2024b). The impact of mild episodic ketosis on microglia and hippocampal long-term depression in 5xFAD mice. FASEB Bioadv 6 (12), 581–596. doi:10.1096/FBA.2024-00123
Dutta, D., Jana, M., Paidi, R. K., Majumder, M., Raha, S., Dasarathy, S., et al. (2023). Tau fibrils induce glial inflammation and neuropathology via TLR2 in Alzheimer’s disease–related mouse models. J. Clin. Invest 133 (18), e161987. doi:10.1172/JCI161987
Dyńka, D., Kowalcze, K., and Paziewska, A. (2022). The role of ketogenic diet in the treatment of neurological diseases. Nutrients 14 (23), 5003. doi:10.3390/NU14235003
Gao, C., Jiang, J., Tan, Y., and Chen, S. (2023). Microglia in neurodegenerative diseases: mechanism and potential therapeutic targets. Signal Transduct. Target. Ther. 8 (1), 359–37. doi:10.1038/s41392-023-01588-0
Ghosh, S., Castillo, E., Frias, E. S., and Swanson, R. A. (2018). Bioenergetic regulation of microglia. Glia 66 (6), 1200–1212. doi:10.1002/glia.23271
González Ibáñez, F., Halvorson, T., Sharma, K., McKee, C. G., Carrier, M., Picard, K., et al. (2023). Ketogenic diet changes microglial morphology and the hippocampal lipidomic profile differently in stress susceptible versus resistant male mice upon repeated social defeat. Brain Behav. Immun. 114, 383–406. doi:10.1016/J.BBI.2023.09.006
Gonzatti, M. B., and Goldberg, E. L. (2024). Ketone bodies as chemical signals for the immune system. Am. J. Physiol. Cell Physiol. 326 (3), C707–C711. doi:10.1152/ajpcell.00478.2023
Graff, E. C., Fang, H., Wanders, D., and Judd, R. L. (2016). Anti-inflammatory effects of the hydroxycarboxylic acid receptor 2. Metabolism 65 (2), 102–113. doi:10.1016/J.METABOL.2015.10.001
Gratuze, M., Leyns, C. E. G., and Holtzman, D. M. (2018). New insights into the role of TREM2 in Alzheimer’s disease. Mol. Neurodegener. 13 (1), 66–16. doi:10.1186/S13024-018-0298-9
Guerreiro, R., Wojtas, A., Bras, J., Carrasquillo, M., Rogaeva, E., Majounie, E., et al. (2013). TREM2 variants in Alzheimer’s disease. N. Engl. J. Med. 368 (2), 117–127. doi:10.1056/NEJMOA1211851
Guha, M., O’Connell, M. A., Pawlinski, R., Hollis, A., McGovern, P., Yan, S. F., et al. (2001). Lipopolysaccharide activation of the MEK-ERK1/2 pathway in human monocytic cells mediates tissue factor and tumor necrosis factor alpha expression by inducing Elk-1 phosphorylation and Egr-1 expression. Blood 98 (5), 1429–1439. doi:10.1182/BLOOD.V98.5.1429
Guo, S., Wang, H., and Yin, Y. (2022). Microglia polarization from M1 to M2 in neurodegenerative diseases. Front. Aging Neurosci. 14, 815347. doi:10.3389/fnagi.2022.815347
Hansen, D. V., Hanson, J. E., and Sheng, M. (2018). Microglia in Alzheimer’s disease. J. Cell Biol. 217 (2), 459–472. doi:10.1083/JCB.201709069
Henn, A., Lund, S., Hedtjärn, M., Schrattenholz, A., Pörzgen, P., and Leist, M. (2009). The suitability of BV2 cells as alternative model system for primary microglia cultures or for animal experiments examining brain inflammation. ALTEX - Altern. animal Exp. 26 (2), 83–94. doi:10.14573/ALTEX.2009.2.83
Hong, S., Beja-Glasser, V. F., Nfonoyim, B. M., Frouin, A., Li, S., Ramakrishnan, S., et al. (2016). Complement and microglia mediate early synapse loss in Alzheimer mouse models. Sci. (1979) 352 (6286), 712–716. doi:10.1126/science.aad8373
Horvath, R. J., Nutile-McMenemy, N., Alkaitis, M. S., and DeLeo, J. A. (2008). Differential migration, LPS-induced cytokine, chemokine and NO expression in immortalized BV-2 and HAPI cell lines and primary microglial cultures. J. Neurochem. 107 (2), 557–569. doi:10.1111/J.1471-4159.2008.05633.X
Huang, C., Wang, J., Liu, H., Huang, R., Yan, X., Song, M., et al. (2022). Ketone body β-hydroxybutyrate ameliorates colitis by promoting M2 macrophage polarization through the STAT6-dependent signaling pathway. BMC Med. 20 (1), 148. doi:10.1186/S12916-022-02352-X
Huang, C., Wang, P., Xu, X., Zhang, Y., Gong, Y., Hu, W., et al. (2018). The ketone body metabolite β-hydroxybutyrate induces an antidepression-associated ramification of microglia via HDACs inhibition-triggered Akt-small RhoGTPase activation. Glia 66 (2), 256–278. doi:10.1002/GLIA.23241
Jay, T. R., Von Saucken, V. E., and Landreth, G. E. (2017). TREM2 in neurodegenerative diseases. Mol. Neurodegener. 12 (1), 56–33. doi:10.1186/S13024-017-0197-5
Jin, L., Di Lucente, J., Ruiz Mendiola, U., Suthprasertporn, N., Tomilov, A., Cortopassi, G., et al. (2023). The ketone body β-hydroxybutyrate shifts microglial metabolism and suppresses amyloid-β oligomer-induced inflammation in human microglia. FASEB J. 37 (11), e23261. doi:10.1096/fj.202301254R
Jin, S. C., Benitez, B. A., Karch, C. M., Cooper, B., Skorupa, T., Carrell, D., et al. (2014). Coding variants in TREM2 increase risk for Alzheimer’s disease. Hum. Mol. Genet. 23 (21), 5838–5846. doi:10.1093/HMG/DDU277
Jin, S. C., Carrasquillo, M. M., Benitez, B. A., Skorupa, T., Carrell, D., Patel, D., et al. (2015). TREM2 is associated with increased risk for Alzheimer’s disease in African Americans. Mol. Neurodegener. 10 (1), 19. doi:10.1186/S13024-015-0016-9
Jonsson, T., Stefansson, H., Steinberg, S., Jonsdottir, I., Jonsson, P. V., Snaedal, J., et al. (2013). Variant of TREM2 associated with the risk of Alzheimer’s disease. N. Engl. J. Med. 368 (2), 107–116. doi:10.1056/NEJMOA1211103
Knopman, D. S., Amieva, H., Petersen, R. C., Chételat, G., Holtzman, D. M., Hyman, B. T., et al. (2021). Alzheimer disease. Nat. Rev. Dis. Prim. 7 (1), 33–21. doi:10.1038/s41572-021-00269-y
Kopec, K. K., and Carroll, R. T. (1998). Alzheimer’s β-amyloid peptide 1–42 induces a phagocytic response in murine microglia. J. Neurochem. 71 (5), 2123–2131. doi:10.1046/J.1471-4159.1998.71052123.X
Li, R. Y., Qin, Q., Yang, H. C., Wang, Y. Y., Mi, Y. X., Yin, Y. S., et al. (2022). TREM2 in the pathogenesis of AD: a lipid metabolism regulator and potential metabolic therapeutic target. Mol. Neurodegener. 17 (1), 40–19. doi:10.1186/S13024-022-00542-Y
Lynch, M. A. (2022). Exploring sex-related differences in microglia may Be a game-changer in precision medicine. Front. Aging Neurosci. 14, 868448. doi:10.3389/FNAGI.2022.868448
Lyra, e S. N. M., Gonçalves, R. A., and Pascoal, T. A. (2021). Pro-inflammatory interleukin-6 signaling links cognitive impairments and peripheral metabolic alterations in Alzheimer’s disease. Transl. Psychiatry 11 (1), 1–15. doi:10.1038/s41398-021-01349-z
McWhorter, F. Y., Wang, T., Nguyen, P., Chung, T., and Liu, W. F. (2013). Modulation of macrophage phenotype by cell shape. Proc. Natl. Acad. Sci. U. S. A. 110 (43), 17253–17258. doi:10.1073/pnas.1308887110
Murali, K., and Rao, K. (2001). MAP kinase activation in macrophages. J. Leukoc. Biol. 69 (1), 3–10. doi:10.1189/JLB.69.1.3
Newman, J. C., Covarrubias, A. J., Zhao, M., Yu, X., Gut, P., Ng, C. P., et al. (2017). Ketogenic diet reduces midlife mortality and improves memory in aging mice. Cell Metab. 26 (3), 547–557.e8. doi:10.1016/J.CMET.2017.08.004
Newman, J. C., and Verdin, E. (2017). β-Hydroxybutyrate: a signaling metabolite. Annu. Rev. Nutr. 37, 51–76. doi:10.1146/ANNUREV-NUTR-071816-064916
Nguyen, P. T., Dorman, L. C., Pan, S., Vainchtein, I. D., Han, R. T., Nakao-Inoue, H., et al. (2020). Microglial remodeling of the extracellular matrix promotes synapse plasticity. Cell 182 (2), 388–403.e15. doi:10.1016/J.CELL.2020.05.050
Nissen, J. C. (2017a). Microglial function across the spectrum of age and gender. Int. J. Mol. Sci. 18 (3), 561. doi:10.3390/IJMS1800561
Nissen, J. C. (2017b). Microglial function across the spectrum of age and gender. Int. J. Mol. Sci. 18 (3), 561. doi:10.3390/IJMS18030561
Nugent, A. A., Lin, K., van Lengerich, B., Lianoglou, S., Przybyla, L., Davis, S. S., et al. (2020). TREM2 regulates microglial cholesterol metabolism upon chronic phagocytic challenge. Neuron 105 (5), 837–854.e9. doi:10.1016/J.NEURON.2019.12.007
Offermanns, S., and Schwaninger, M. (2015). Nutritional or pharmacological activation of HCA2 ameliorates neuroinflammation. Trends Mol. Med. 21 (4), 245–255. doi:10.1016/J.MOLMED.2015.02.002
Oliveira, T. P. D., Morais, A. L. B., dos Reis, P. L. B., Palotás, A., and Vieira, L. B. (2024). A potential role for the ketogenic diet in Alzheimer’s disease treatment: exploring pre-clinical and clinical evidence. Metabolites 14 (1), 25. doi:10.3390/METABO14010025
Ovens, M. J., Davies, A. J., Wilson, M. C., Murray, C. M., and Halestrap, A. P. (2010). AR-C155858 is a potent inhibitor of monocarboxylate transporters MCT1 and MCT2 that binds to an intracellular site involving transmembrane helices 7-10. Biochem. J. 425 (3), 523–530. doi:10.1042/BJ20091515
Paidi, R. K., Raha, S., Roy, A., and Pahan, K. (2023). Muscle-building supplement β-hydroxy β-methylbutyrate binds to PPARα to improve hippocampal functions in mice. Cell Rep. 42 (7), 112717. doi:10.1016/J.CELREP.2023.112717
Paolicelli, R. C., Bolasco, G., Pagani, F., Maggi, L., Scianni, M., Panzanelli, P., et al. (2011). Synaptic pruning by microglia is necessary for normal brain development. Science 333 (6048), 1456–1458. doi:10.1126/science.1202529
Pathak, S. J., Zhou, Z., Steffen, D., Tran, T., Ad, Y., Ramsey, J. J., et al. (2022). 2-month ketogenic diet preferentially alters skeletal muscle and augments cognitive function in middle aged female mice. Aging Cell 21 (10), e13706. doi:10.1111/ACEL.13706
Phillips, M. C. L., Deprez, L. M., Mortimer, G. M. N., Murtagh, D. K. J., McCoy, S., Mylchreest, R., et al. (2021). Randomized crossover trial of a modified ketogenic diet in Alzheimer’s disease. Alzheimers Res. Ther. 13 (1), 51. doi:10.1186/S13195-021-00783-X
Polito, R., La Torre, M. E., Moscatelli, F., Cibelli, G., Valenzano, A., Panaro, M. A., et al. (2023). The ketogenic diet and neuroinflammation: the action of beta-hydroxybutyrate in a microglial cell line. Int. J. Mol. Sci. 24 (4), 3102. doi:10.3390/IJMS24043102
Rahman, M., Muhammad, S., Khan, M. A., Chen, H., Ridder, D. A., Müller-Fielitz, H., et al. (2014). The β-hydroxybutyrate receptor HCA2 activates a neuroprotective subset of macrophages. Nat. Commun. 5 (1), 3944–11. doi:10.1038/ncomms4944
Riss, T. L., Moravec, R. A., and Niles, A. L. (2024). Cell viability assays,” in Assay guidance manual. Available online at: https://www.ncbi.nlm.nih.gov/books/NBK144065/(Accessed July 10, 2024).
Roberts, M. N., Wallace, M. A., Tomilov, A. A., Zhou, Z., Marcotte, G. R., Tran, D., et al. (2017). A ketogenic diet extends longevity and healthspan in adult mice. Cell Metab. 26 (3), 539–546.e5. doi:10.1016/J.CMET.2017.08.005
Roux, P. P., and Blenis, J. (2004). ERK and p38 MAPK-activated protein kinases: a family of protein kinases with diverse biological functions. Microbiol. Mol. Biol. Rev. 68 (2), 320–344. doi:10.1128/MMBR.68.2.320-344.2004
Sala Frigerio, C., Wolfs, L., Fattorelli, N., Thrupp, N., Voytyuk, I., Schmidt, I., et al. (2019). The major risk factors for Alzheimer’s disease: age, sex, and genes modulate the microglia response to Aβ plaques. Cell Rep. 27 (4), 1293–1306.e6. doi:10.1016/J.CELREP.2019.03.099
Shi, L., Kishore, R., McMullen, M. R., and Nagy, L. E. (2002). Lipopolysaccharide stimulation of ERK1/2 increases TNF-alpha production via Egr-1. Am. J. Physiol. Cell Physiol. 282 (6), C1205–C1211. doi:10.1152/AJPCELL.00511.2001
Smolders, S., Kessels, S., Smolders, S. M. T., Poulhes, F., Zelphati, O., Sapet, C., et al. (2018). Magnetofection is superior to other chemical transfection methods in a microglial cell line. J. Neurosci. Methods 293, 169–173. doi:10.1016/J.JNEUMETH.2017.09.017
Smolensky, I., Zajac-Bakri, K., Odermatt, T. S., Brégère, C., Cryan, J. F., Guzman, R., et al. (2023). Sex-specific differences in metabolic hormone and adipose tissue dynamics induced by moderate low-carbohydrate and ketogenic diet. Sci. Rep. 13 (1), 16465–10. doi:10.1038/S41598-023-43587-9
Stansley, B., Post, J., and Hensley, K. (2012). A comparative review of cell culture systems for the study of microglial biology in Alzheimer’s disease. J. Neuroinflammation 9, 115. doi:10.1186/1742-2094-9-115
Sun, W., Wang, Q., Zhang, R., and Zhang, N. (2023). Ketogenic diet attenuates neuroinflammation and induces conversion of M1 microglia to M2 in an EAE model of multiple sclerosis by regulating the NF-κB/NLRP3 pathway and inhibiting HDAC3 and P2X7R activation. Food Funct. 14 (15), 7247–7269. doi:10.1039/D3FO00122A
Tanaka, T., Narazaki, M., and Kishimoto, T. (2014). IL-6 in inflammation, immunity, and disease. Cold Spring Harb. Perspect. Biol. 6 (10), a016295–a016296. doi:10.1101/CSHPERSPECT.A016295
Vanderheyden, W. M., Lim, M. M., Musiek, E. S., Gerstner, J. R., Rajendran, L., and Paolicelli, R. C. (2018). Microglia-mediated synapse loss in Alzheimer’s disease. J. Neurosci. 38 (12), 2911–2919. doi:10.1523/JNEUROSCI.1136-17.2017
Vidal-Itriago, A., Radford, R. A. W., Aramideh, J. A., Maurel, C., Scherer, N. M., Don, E. K., et al. (2022). Microglia morphophysiological diversity and its implications for the CNS. Front. Immunol. 13, 997786. doi:10.3389/FIMMU.2022.997786
Wang, W. Y., Tan, M. S., Yu, J. T., and Tan, L. (2015a). Role of pro-inflammatory cytokines released from microglia in Alzheimer’s disease. Ann. Transl. Med. 3 (10), 136. doi:10.3978/J.ISSN.2305-5839.2015.03.49
Wang, Y., Cella, M., Mallinson, K., Ulrich, J. D., Young, K. L., Robinette, M. L., et al. (2015b). TREM2 lipid sensing sustains the microglial response in an Alzheimer’s disease model. Cell 160 (6), 1061–1071. doi:10.1016/j.cell.2015.01.049
Wu, Y., Gong, Y., Luan, Y., Li, Y., Liu, J., Yue, Z., et al. (2020). BHBA treatment improves cognitive function by targeting pleiotropic mechanisms in transgenic mouse model of Alzheimer’s disease. FASEB J. 34 (1), 1412–1429. doi:10.1096/FJ.201901984R
Xu, Y., Jiang, C., Wu, J., Liu, P., Deng, X., Zhang, Y., et al. (2022). Ketogenic diet ameliorates cognitive impairment and neuroinflammation in a mouse model of Alzheimer’s disease. CNS Neurosci. Ther. 28 (4), 580–592. doi:10.1111/CNS.13779
Youm, Y. H., Nguyen, K. Y., Grant, R. W., Goldberg, E. L., Bodogai, M., Kim, D., et al. (2015). The ketone metabolite β-hydroxybutyrate blocks NLRP3 inflammasome-mediated inflammatory disease. Nat. Med. 21 (3), 263–269. doi:10.1038/NM.3804
Zhang, Y., Liu, K., Li, Y., Ma, Y., Wang, Y., Fan, Z., et al. (2022). D-beta-hydroxybutyrate exhibits protective effects against microglia activation in lipopolysaccharide-treated mice and BV-2 cells. doi:10.21203/RS.3.RS-1879713/V1
Zheng, H., Cheng, B., Li, Y., Li, X., Chen, X., and Zhang, Y. W. (2018). TREM2 in Alzheimer’s disease: microglial survival and energy metabolism. Front. Aging Neurosci. 10, 395. doi:10.3389/FNAGI.2018.00395
Keywords: Alzheimer’s, microglia, ketone, beta-hydroxybutyrate, TREM2, BHB, Alzheimer’s disease, ketogenic diet
Citation: Garcia C, Banerjee A, Montgomery C, Adcock L, Maezawa I, Ramsey J, Grodzki ACG, Kim K and Cortopassi G (2025) Beta-hydroxybutyrate (BHB) elicits concentration-dependent anti-inflammatory effects on microglial cells which are reversible by blocking its monocarboxylate (MCT) importer. Front. Aging 6:1628835. doi: 10.3389/fragi.2025.1628835
Received: 14 May 2025; Accepted: 26 June 2025;
Published: 29 July 2025.
Edited by:
Jenna M. Bartley, University of Connecticut Health Center, United StatesReviewed by:
Pingze Zhang, Yale University, United StatesRamesh Kumar Paidi, Rush University, United States
Copyright © 2025 Garcia, Banerjee, Montgomery, Adcock, Maezawa, Ramsey, Grodzki, Kim and Cortopassi. This is an open-access article distributed under the terms of the Creative Commons Attribution License (CC BY). The use, distribution or reproduction in other forums is permitted, provided the original author(s) and the copyright owner(s) are credited and that the original publication in this journal is cited, in accordance with accepted academic practice. No use, distribution or reproduction is permitted which does not comply with these terms.
*Correspondence: Gino Cortopassi, Z2NvcnRvcGFzc2lAdWNkYXZpcy5lZHU=