 Astrid Bracher1,2*
 Andrew Clive Banks3
 Hongyan Xi1
 David Dessailly4Juan Gossn4
 Carole Lebreton5
 Rüdiger Röttgers6
 Ewa Kwiatkowska4Spyros Chaikalis3
 Ehsan Mehdipour1
 Elli Pitta3
 Mariana Altenburg Soppa1Jan Wevers5
 Christina Zeri3
- 1Phytooptics Group, Physical Oceanography of the Polar Seas, Climate Department, Alfred Wegener Institute Helmholtz Centre for Polar and Marine Research, Bremen, Germany
- 2Institute of Environmental Physics, University Bremen, Bremen, Germany
- 3Institute of Oceanography Hellenic Centre for Marine Research, Heraklion, Crete, Greece
- 4European Organisation for the Exploitation of Meteorological Satellites (EUMETSAT), Darmstadt, Hessen, Germany
- 5Brockmann Consult GmbH, Hamburg, Germany
- 6Optical Oceanography, Institute of Carbon Cycles, Helmholtz-Zentrum HEREON, Geesthacht, Germany
New products of water-inherent optical properties have been made operational by European Organisation for the Exploitation of Meteorological Satellites (EUMETSAT), on behalf of the EC Copernicus Programme, based on a three-step semi-analytical algorithm to derive absorption coefficient products for all non-water components (anw), for phytoplankton (aphy), and for coloured detrital and dissolved matter (acdm), from the first eight bands of the Sentinel-3 (S3) Ocean and Land Colour Imager (OLCI). Additionally, based on a different type of retrieval, the absorption of coloured dissolved organic matter (CDOM) from the OLCI 443 nm band, acdom(443), has been introduced as a new product. In this study, we evaluate for the first time these new absorption coefficient products for OLCI, based on validation with a large (up to 1,000), global, and comprehensive in situ matchup dataset covering all optical water classes, considering the first 7 years of the S3 mission. Results show robust retrievals for all four OLCI absorption products (Rlog of 0.68–0.86), with a median absolute percent deviation of 30%–51% across all water types for the 443 nm band and similarly for the 400, 412, 490, and 510 nm bands. Performance was strongest for anw(λ) and weakest for acdm(λ). Results for these products for bands 560, 620, and 665 nm are much poorer. The results for OLCI anw(λ), aphy(λ), and acdm(λ) are consistent with previous in situ validation results presented for the European Seas. To obtain a good assessment on the temporal and spatial consistency, the monthly aphy(443) and acdm(443) data from 2019 have been intercompared with other operationally available products. The intercomparisons show that all products agree well for their 2019 average median value and in their overall regional distribution and seasonal variation. EUMETSAT operational processing now delivers the absorption products for the 443 nm band [aphy(443), anw(443), acdm(443), and acdom(443)] for S3 OLCI, and our study confirms the validity of these products. Furthermore, our study corroborates the skill of the EUMETSAT algorithm to obtain valid information in most of the blue and green spectra, making it of high potential for introduction into the processing of ocean-colour radiometry data from new hyperspectral satellite missions.
1 Introduction
Understanding oceanic responses to the Earth’s changing climate, the ocean’s role in land–ocean–atmosphere carbon cycles, regional aquatic ecosystems’ responses to hazards, variations across systems, and the health of fisheries and aquatic habitats—to name only a few—requires access to substantial volumes of marine biogeochemical information [e.g., IOCCG (2008) and IOCCG (2009)]. Ocean-colour satellite instruments not only collect data on temporal and spatial scales that currently cannot be achieved by conventional in situ or aircraft sampling platforms but also provide data records that allow retrospective analyses of spatiotemporal trends. These instruments provide estimates of spectral water-leaving radiances [or when divided by the downwelling irradiance, then the remote sensing reflectance [Rrs(λ)]—the light exiting a water body that defines its colour, leading to the discipline colloquially named ocean colour. Initially, remote sensing of ocean colour focused primarily on the retrieval of the concentration of chlorophyll-a in the global oceans. Subsequent studies, however, have also emphasized the importance of understanding and retrieving inherent optical properties (IOPs), namely, the scattering and absorption characteristics of water and its constituents (the dissolved and suspended material) across oceans and seas, as well as coastal and inland waters.
The interest in IOPs and their derivation from ocean-colour radiometry stems from their role in the propagation of light in water, which, in turn, affects light-associated processes such as primary production, visibility, and phytoplankton diel vertical migration. IOPs are the main determinants of Rrs(λ) and thus play a critical role in the interpretation of ultraviolet-to-near infrared remote-sensing data (Werdell and Bailey, 2005). The total IOPs, those that result from additive contributions of all water constituents with optical signatures, determine the propagation of light within an aquatic medium and, hence, the changes in the magnitude and spectral composition of the light field throughout the water column. The sensitivity of IOPs to the variability of optically significant components also allows IOPs to be used as proxies of various seawater-dissolved and particulate constituents of biogeochemical significance. For instance, absorption by coloured dissolved organic matter [acdom(λ)] and its spectral behaviour, especially in the UV range, allows the assessment of dissolved organic carbon variability in coastal waters [e.g., Vantrepotte et al. (2015)]. Furthermore, the spectral absorption coefficients of phytoplankton [aphy(λ)] provide essential parameters for quantifying primary production [e.g., Marra et al. (2007)]. Phytoplankton absorption coefficients also provide the best parameters for optically based assessments of phytoplankton community composition that is typically described in terms of the community size structure and pigment composition [see summary provided in the study by Bracher et al. (2017)]. Together, these products are derived from IOP-based algorithms and allow the estimation of the carbon pool in aquatic environments (Brewin et al., 2023). Considerable effort has focused on the development of analytical frameworks for deriving marine IOPs from sensor-observed Rrs(λ), recognizing that these frameworks cannot be exactly reduced to an analytical equation or expression (IOCCG, 2006; Werdell et al., 2018). Deriving IOPs in this way requires the solution of an inverse problem, which is often mathematically ill-posed because different combinations of IOPs can result in the same Rrs(λ) spectrum in the visible (VIS) domain (e.g., Defoin-Platel and Chami (2007)). This is particularly the case when the number of independent observations (i.e., the number of sensor VIS wavelengths) is small compared to the number of unknown IOP variables, or when uncertainty in the observed Rrs(λ) is high. Many radiative transfer codes that compute Rrs(λ) from user-input IOPs and other key environmental parameters (e.g., sea surface state, atmospheric transmittance, solar geometry, viewing geometry, and water column depth) have been developed. In OLCI products, the historical IOP absorption parameter distributed is a coefficient of absorption for coloured detrital and dissolved organic matter [acdm(λ)]. This parameter has been developed for coastal waters by Doerffer and Schiller (2007) and uses a trained neural network for the inversion of Rrs to IOPs. This parameter has been distributed for a long time in MERIS and OLCI products and is not validated in this work.
EUMETSAT, on behalf of the EC Copernicus Programme, has recently developed new water IOP products (EUMETSAT, 2018) for Sentinel-3 (S3) OLCI which are based on the semi-analytical algorithm “3SAA” presented by Jorge et al. (2021). These products were tuned to work across all water types. Furthermore, Bonelli et al. (2021) have adapted an algorithm from the study by Loisel et al. (2014) and applied it to satellite data to derive acdom(443), using a new semi-analytical model (CDOM-KD2). The general workflow of these algorithms is presented in Figure 1. The three-step SAA IOP algorithm has been provided with the source code in GitLab (https://gitlab.eumetsat.int/eumetlab/oceans/ocean-science-studies/olci-iop-processor) and was implemented, with the addition of the acdom(443) algorithm presented by Bonelli et al. (2021), in February 2024 into operational processing for S3 A and B OLCI data (Data Store | EUMETSAT - User Portal). A SNAP toolbox (https://earth.esa.int/eogateway/tools/snap), including a standalone version of the software, has been publicly released (https://gitlab.eumetsat.int/eumetlab/oceans/ocean-science-studies/olci-iop-processor). With this software, the following IOP products can be retrieved from Rrs(λ): the spectral absorption of all non-water components [anw(λ)], the spectral particle backscattering coefficients [bbp(λ)], aphy(λ), and acdm(λ) and the spectral light vertical attenuation coefficient [Kd(λ)] with bands centred at λ = 400, 412, 443, 490, 510, 560, 620, and 665 nm, and acdom(λ) with λ = 443 nm. It is noteworthy that following EUMETSAT (2018), OLCI bands Oa2 at 412.5 nm and Oa3 at 442.5 nm are abbreviated as 412 nm and 443 nm, respectively, for brevity in this study.
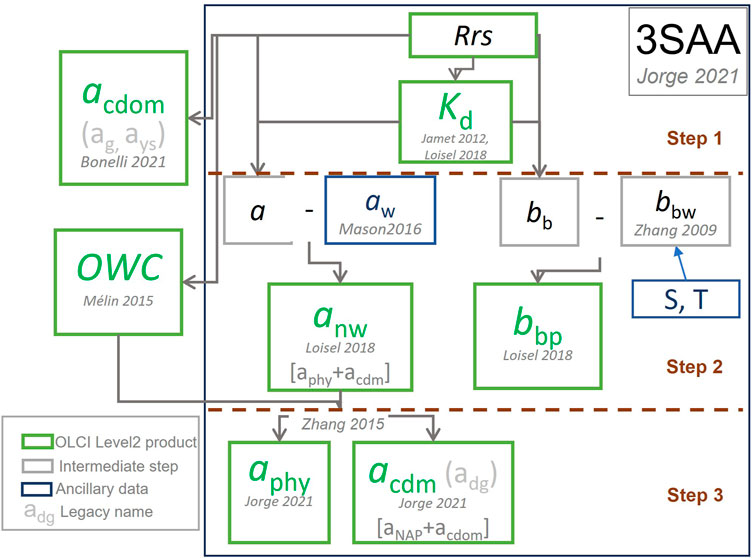
Figure 1. 3SAA (Jorge et al., 2021), acdom (Bonelli et al., 2021), and OWC (Mélin and Vantrepotte, 2015) algorithm workflow as implemented by EUMETSAT in February 2024 into operational processing for EUMETSAT S3 A and B OLCI data. The baseline values of the 3SAA are obtained from several previous studies by Zhang et al. (2009), Jamet et al. (2012), Mason et al. (2016), and Loisel et al. (2018).
Previously, the IOP algorithm absorption products have been evaluated, as described by Jorge et al. (2021) and Bonelli et al. (2021), by the algorithm’s developers. At that time, no validation of its application to OLCI data had been presented. Subsequently, independent in situ evaluation of the OLCI absorption products at the 443 nm band excluding the acdom(λ) product by Bonelli et al. (2021) was presented for European sea waters by Zibordi et al. (2023). However, no similar independent validation has been performed to assess the quality of these products at the other seven OLCI bands and in other waters, such as the world’s oceans, inland waters, and other coastal areas until now. There are also, to date, no assessments of the temporal and spatial patterns of these products.
In this study, we assess the quality of S3A and B OLCI water absorption products to provide a separate comprehensive validation and to instil confidence in the product quality coinciding with their operational release by EUMETSAT in February 2024. The approach is two-fold: first, we validated OLCI full resolution (300 m) products against satellite-simultaneous globally distributed in situ measurements, representing different clear and optically complex water types [following classification by Mélin and Vantrepotte (2015)]. The in situ dataset was compiled from public sources and complemented with more recent global in situ data. Second, we evaluated monthly 9 km gridded OLCI reduced-resolution (RR) products through intercomparison with corresponding absorption products from other missions.
2 Materials and methods
We first introduce in section 2.1 the products and data used in the validation and describe how they have been generated; in section 2.2, the details on the validation methodology used are provided, and in section 2.3, the chosen validation criteria are described.
2.1 Validation data
2.1.1 Evaluated S3 OLCI satellite data
S3A and S3B OLCI Level-2 (L2) were obtained on request from EUMETSAT. All the OLCI datasets were generated using the operational Processing Baseline (PB) OL__L2M.003.04 (EUMETSAT 2024). Matchups with the in situ data collection (as detailed in Section 2.1.2) were extracted from the OLCI full resolution (FR) dataset. For the global inter-comparisons, OLCI IOP RR products were gridded to 9 km monthly Level-3 (L3) products for 2019, following the study by Campbell et al. (1995). In this study, we only considered the OLCI L2 products of anw(λ), aphy(λ), and acdm(λ) at the first eight OLCI bands and acdom(443). For L3, only the aphy(443) and acdm(443) products from both OLCI sensors were evaluated. Furthermore, to obtain a merged monthly OLCI L3 RR product for each of those, the OLCI sensor-specific daily L3 RR products were accumulated using the l3bin tools version 5.13 from the SeaDAS software package version 8 (https://seadas.gsfc.nasa.gov).
2.1.2 In situ validation dataset
The in situ dataset consists of different datasets gathered together from measurements collected in open ocean, coastal, and inland surface waters spread around the globe and covering the time from first data delivery by OLCI on S3A until November 2022. We only used the absorption coefficient data derived from measurements on discrete water samples to ensure that a similar method procedure was followed with a similar uncertainty. All data were measured and processed using methods following specific standard protocols (IOCCG Protocol Series, 2018; Mannino et al., 2019). We used all publicly available data from different repositories [SeaWiFS Bio-optical Archive and Storage System (SeaBASS): https://seabass.gsfc.nasa.gov/, PANGAEA: https://www.pangaea.de, and Australian Open Access to Ocean Data portal (AODN): https://portal.aodn.org.au] and newly collected, measured, and analysed datasets from the Alfred Wegener Institute Helmholtz Centre for Polar and Marine Research (AWI, PI: Astrid Bracher) and the Hellenic Centre for Marine Research (HCMR, PI: Andrew C. Banks). Details on the different in situ dataset collections [named as Bracher22 [collection from Álvarez et al. (2022), Liu et al. (2019a), Liu et al. (2019b), Bracher and Liu (2021a), Bracher and Liu (2021b), Bracher et al. (2021a), Bracher et al. (2021b), Bracher et al. (2021c), Bracher et al. (2021d), Bracher et al. (2021e), Bracher et al. (2021f), Bracher et al. (2021g), Bracher et al. (2021h), Bracher et al. (2021i), Bracher et al. (2021j), Bracher et al. (2021k), Bracher et al. (2021l), Bracher et al. (2025a), Bracher et al. (2025b), Bracher et al. (2025c), and Bracher et al. (2025d)], Castagna22 (Castagna et al., 2022a collection from Castagna et al., 2022b), Röttgers23 (Röttgers et al., 2023), Lehmann22 [Lehmann et al., 2022 collection from Lehmann et al., 2023], AODN-1, AODN-2, SEABASS, Bracher-new, and Banks-new] are provided in the supplement (S1).
Some of these in situ datasets contain coincident hyperspectral particulate absorption coefficients [or instead hyperspectral absorption coefficients by non-algal particulates and aphy(λ)] and acdom(λ) data, which were summed up to calculate anw(λ). In the cases where the datasets contained coincident hyperspectral absorption coefficients by non-algal particulates and acdom(λ), these were summed up to calculate acdm(λ). Supplementary Table S1 shows that for each in situ dataset, how many data points are provided for matchup extractions for each OLCI absorption product. Overall, 5,537, 2,952, 3,214, and 3,027 data points for acdom, acdm, aphy, and anw, respectively, have been compiled. Supplementary Figure S1 shows the spread around the world’s ocean and inland waters for these in situ IOP datasets used for OLCI matchup analyses. It shows that the open ocean is especially well covered for the Atlantic Ocean including the polar oceans. Moreover, the collection includes many global coastal areas, such as the Baltic Sea and the Mediterranean Sea. Only few data points are found in the open waters of the Pacific Ocean, and none in the Indic Ocean. The coverage of the acdom(443) dataset also includes much more inland waters (lakes, estuaries, and large rivers in Argentina, Australia, Belgium, Brazil, Canada, China, Estonia, France, Germany, Italy, Japan, New Zealand, Norway, and the United States). For the other three data products, which also include the information at the seven other OLCI bands, the in situ inland water dataset was limited to a few German and Belgium lakes.
In order to have a consistent and realistic inclusion of uncertainties affecting the in situ data used in our study, relative uncertainties for each dataset (Supplementary Table S2) have been determined based on previous studies quantifying the specific methods’ uncertainties (Neeley et al., 2015; Lefering et al., 2016; Lefering et al., 2017; Werdell et al., 2018; Mannino et al., 2019). Details are provided in the supplement (S1). We use these specific values as relative standard deviation for all in situ anw(λ), aphy(λ), and acdm(λ) at the OLCI bands and for acdom(443).
2.1.3 Satellite validation dataset
The S3 OLCI IOP absorption coefficient products were evaluated on a global scale against corresponding products publicly available from other missions. The selected products only encompassed aphy(443) and acdm(443). Both products are available from NASA (https://oceandata.sci.gsfc.nasa.gov) for MODIS-Aqua, MODIS-Terra, VIIRS, OLCI-A, and OLCI-B data. We selected NASA products only for OLCI-A and OLCI-B to compare, in particular, the differences of the algorithms. NASA Rrs(λ) products rely on a different atmospheric processing than those from EUMETSAT (Ahmad et al., 2010), and the NASA follow-on IOP products use the Generalized Inherent Optical Property (GIOP) model (https://oceancolur.gsfc.nasa.gov/resources/atbd/giop/, Werdell et al., 2013; Werdell and McKinna, 2019; McKinna and Werdell, 2024). For acdm(443), merged satellite products (encompassing all sensors as listed before) are available from the ESA Ocean Colour Climate Change Initiative (OCCCI, https://www.oceancolour.org/), applying the Quasi-Analytical Algorithm (QAA) by Lee et al. (2002) according to version 6 processing (Lee et al., 2014, https://www.ioccg.org/groups/Software_OCA/QAA_v6_2014209.pdf). For acdm(443), merged satellite products are also available from GlobColour (https://hermes.acri.fr/; note: the same global IOP products are also available from the Copernicus Marine Environment Monitoring Service, https://data.marine.copernicus.eu/; OCEANCOLOUR_GLO_BGC_L3_MY_009_103), applying the Garver–Siegel–Maritorena (GSM) algorithm (Maritorena and Siegel, 2005). OCCCI- and GlobColour-merged data are version 6 and version 4.0, respectively. We downloaded all NASA, OCCCI, and GlobColour L3 products on 5 October 2023 at monthly 4 km resolution.
It should be noted that the products from OCCCI, NASA, and GlobColour are named adg443 and aphy443, whereas for EUMETSAT, we use the naming acdm(443) and aphy(443). For brevity, we also denote OCCCI, NASA, and GlobColour adg443 and aphy443 products here as acdm(443) and aphy(443).
2.2 Validation methodology
2.2.1 In situ data validation methodology
The in situ validation of OLCI anw(λ), aphy(λ), and acdm(λ) with λ equal to 400, 412, 490, 510, 560, 620, and 665 nm and acdom(443) followed established community protocols (IOCCG Protocol Series, 2018; IOCCG et al., 2019b) and particularly EUMETSAT’s OLCI matchup protocol (EUMETSAT, 2022). First, a pre-processing for quality control and a conversion of the considered in situ data to a common format following the study by Valente et al. (2022) was performed. We flagged and disregarded the following data from the final quality-controlled dataset which had (1) unrealistic or missing date or geographic coordinate fields, (2) poor quality (e.g., original flags) or method of observation that did not meet the criteria for the dataset [e.g., not defined in the community protocols (IOCCG Protocol Series, 2018; Mannino et al., 2019)], and (3) spuriously high or low data. For the last item, the following limits were imposed: [0.0001–10] m−1 for anw(λ), aphy(λ), acdm(λ), and acdom(λ) at λ = 443 nm.
The matchup procedure was that in situ data points had to fall within the 3 × 3 OLCI FR pixel box and a time window of ± 12 h was selected to have a large number of matchups. It was further checked for aphy(λ) and acdom(443), whether the choice of a narrower time window of ±1 h might lead to different results or might be more appropriate in complex waters rather than ± 12 h. OLCI pixels were discarded when flagged with the recommended flags (EUMETSAT, 2022), and the remaining matchups were only considered valid if more than 50% of satellite pixels were available at Rrs(560) (e.g., 5 out of 9 for the 3 × 3 criterion) per in situ data point, with the coefficient of variation (CV) < 0.2. Dedicated matchup software developed using EUMETSAT ThoMaS (the tool to generate Matchups of OC products with S3 OLCI https://gitlab.eumetsat.int/eumetlab/oceans/ocean-science-studies/ThoMaS) was used to ensure that the validation process followed the established guidelines.
In situ data from AODN-2 and Lehmann22 were already provided at the nominal OLCI band(s). All other anw(λ), aphy(λ), acdm(λ), and acdom(λ) data were provided in hyperspectral resolution (1 nm, 2 nm, or approximately 3.3 nm resolution). Following the study by Zibordi et al. (2023), these hyperspectral absorption coefficients were transformed to the nominal OLCI bands by averaging over the specific bandwidth.
2.2.2 Intercomparison to other missions’ products
OLCI global Level 3 IOP aphy(443) and acdm(443) products were cross-checked on a global scale with corresponding products from other missions, as listed in section 2.1.3. As a first step, OCCCI and GlobColour merged adg443 products, and NASA’s OLCI-A and OLCI-B aphy(443) and acdm(443) products were gridded to the same spatial and temporal resolution (9 km, monthly), as provided by EUMETSAT for OLCI-A and OLCI-B IOP absorption L3 RR products. These 4-km products were binned using the Binning Operator in SNAP (https://step.esa.int/main/download/snap-download/), which is based on the NASA SeaWiFS binning algorithm (https://oceancolor.gsfc.nasa.gov/SeaWiFS/TECH_REPORTS/PreLPDF/PreLVol32.pdf). It is an operator that is used to perform spatial and temporal aggregations into “bin” cells for any number of source products.
EUMETSAT OLCI IOP aphy(443) and acdm(443) products were treated separately for OLCI-A and OLCI-B to compare the EUMETSAT versus the NASA-specific OLCI sensor products. Furthermore, the merged EUMETSAT OLCI acdm(443) data were compared to the original OLCI sensors’ acdm(443) and to OCCCI and GlobColour acdm(443) merged products. Comparisons concentrated on comparing the difference of algorithms for IOP products from NASA and EUMETSAT, in particular focusing on OLCI-A and OLCI-B, and the difference between merged global products, such as EUMETSAT merged S3A and S3B OLCI, GlobColour, and OCCCI.
2.3 Validation criteria
The main validation outcomes for EUMETSAT OLCI IOP absorption products are the validation results against the in situ measurements. OLCI statistical performances (as defined in section 2.2.) are qualified against corresponding in situ validation results from other mission IOP products. The quality of the EUMETSAT OLCI anw(λ), aphy(λ), and acdm(λ) products, for bands other than 443 nm, was evaluated compared to the 443 nm results. For valid matchups, we calculated the median, the 75% and 25% quantile concentrations, and the quantitative statistical metrics of differences between the OLCI product 3 × 3 pixels’ median and the in situ data. To assess the accuracy of the OLCI IOP products, the statistical metrics were chosen as defined in the studies by EUMETSAT (2022) and Zibordi et al. (2023) for a number (N) of matchups:
• Correlation coefficient, slope, and intercept from regression on log10-scales (Rlog, Slog, and Ilog, respectively). Following the study by Brewin et al. (2023), we considered the uncertainty in the regression of matchups. We used the standard deviation of the 3 × 3 satellite data as uncertainty, together with the in situ data uncertainty. Here, instead of minimizing the vertical distance between independent data and linear fit (as in Type-1 regression), we minimized the perpendicular distance between independent data and linear fit (type-2 regression, Glover et al., 2011, MATLAB function lsqfitma.m).
• Median of deviation (MD) and median of absolute deviation (MAD) in m-1 of satellite (O) to in situ (IS) can be calculated using Equations 1, 2:
• Median of percent difference (MPD) and median of absolute percent difference (MAPD) based on the median of the relative difference with respect to in situ can be calculated using Equations 3, 4:
MAD and MAPD are statistical indices that describe the dispersion of the data, whereas MD and MPD are used to determine the biases. The relative quantities of MPD and MAPD can be used for immediate interpretation. Conversely, the MD and MAD indices are provided in physical units and are strictly related to the compared values. It is important to mention that the median, an alternative to the mean, was chosen to minimize the impact of non-ideal normal distributions of the compared quantities. According to the classification by Mélin and Vantrepotte (2015) and following the study by Jorge et al. (2021), the OLCI matchup dataset was separated into 17 distinct optical water classes (OWCs) within the L2 data processing (Figure 1). These range from very absorbing and turbid waters (OWCs 1 and 2), over other case-2 (OWCs 3–8) and mesotrophic case-1 waters (OWCs 9–12), to oligotrophic and very oligotrophic waters (OWCs 13–17). These were all considered by evaluating EUMETSAT OLCI IOP products with matchups of in situ measurements. We did not apply the quality control proposed by Zibordi et al. (2023) to remove individual values exceeding two standard deviations from the mean from the computation of MAPD and MAD as our global dataset covers many different water types and quite a lot of valid matchups would have been excluded. Furthermore, if this approach had been applied, there would have been no need to validate the IOP products across all OWCs.
The intercomparison also investigated the OLCI IOP consistency and the differences observed at the overall yearly and seasonal global scales to rank products against the other missions’ IOP datasets. The year 2019 was selected because it guaranteed OLCI-A and OLCI-B data to be equally available, and GlobColour and OCCCI datasets were still based on merging MODIS and VIIRS data, without OLCI being included. The missions’ monthly IOP products were projected in Hovmöller diagrams, which enable the depiction of their seasonal variation as a function of latitude across global waters. For the yearly comparisons, the mean, median, standard deviation, and the absolute and relative differences between the same IOP products and missions were calculated.
3 Results
3.1 In situ validation
Overall, for all four EUMETSAT OLCI absorption products, more than 550 valid matchups have been found, with the maximum for acdom(443) reaching 986, followed by anw with 651, acdm with 604, and aphy with 554 (Table 1), all matchups are published in Bracher et al., 2025e-h. For all four parameters matchups are well distributed around the globe and cover 17 OWCs (Figure 2). The matchups from satellite and in situ data represent more than five orders of magnitude for the absorption coefficients. Based on their product for 443, they agree well (especially for anw) in their normal distribution on the log10 scale and also in their values for minimum, maximum, median, and the coefficient of variation (CV), as shown in Figure 3. Most of the matchups are found in the group of the very absorbing and turbid waters (OWCs 1 and 2, ∼40%), then approximately 30% in the other case-2 waters (OWCs 3–8), 20% in the mesotrophic case-1 waters (OWCs 9–12), and 5% in the oligotrophic and very oligotrophic waters (OWCs 13–17, Figure 4). As the latter group is too small for separate statistical analysis when evaluating EUMETSAT OLCI products’ performance for different OWC groups, OWC groups 13–17 were combined with OWC groups 9–12 to represent the case-1 waters. For each product, approximately 5%–10% of the matchups had no assignment to an OWC.
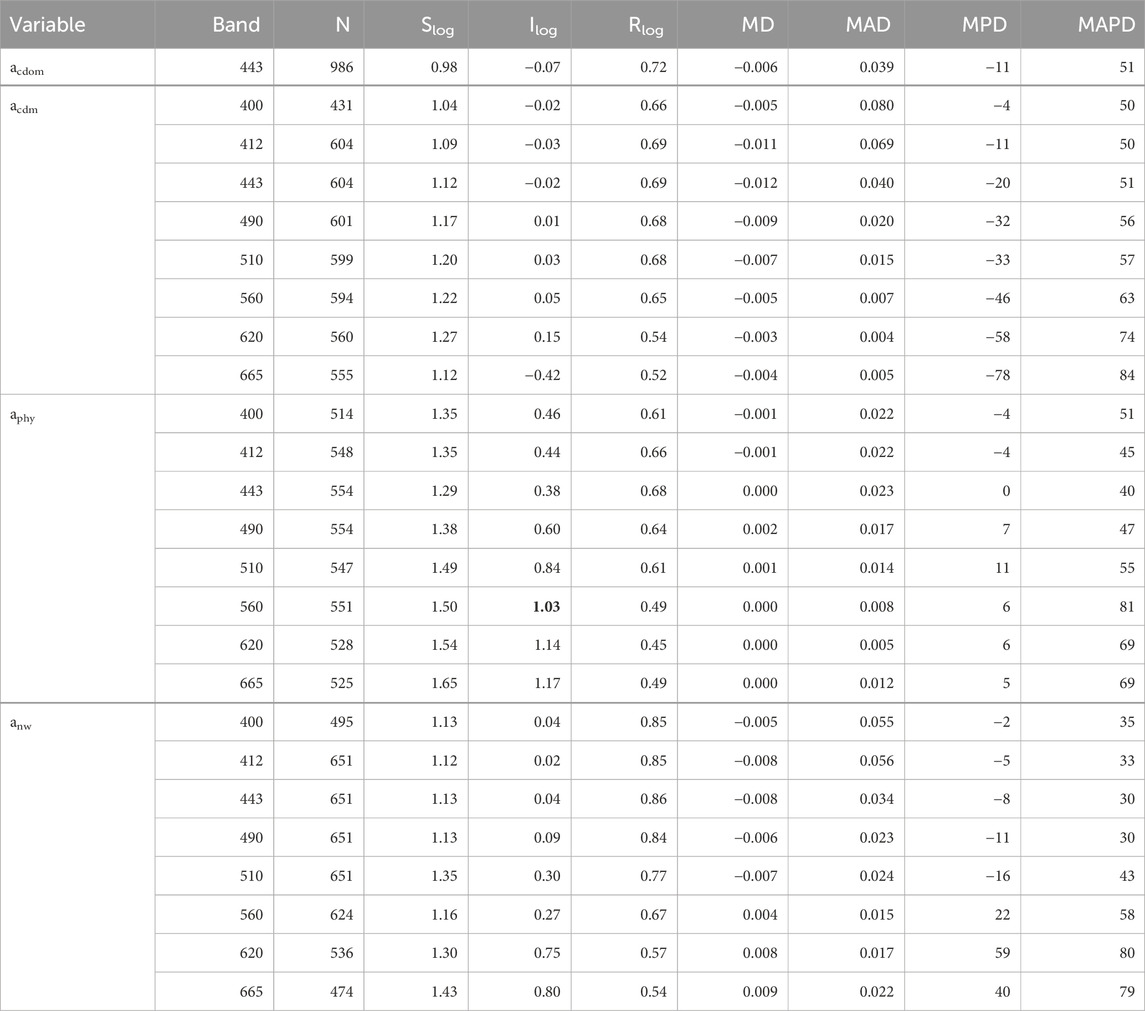
Table 1. Statistics [N (number of matchups), Slog, Ilog, Rlog, MD (in m–1), MAD (in m–1), MPD (in %), and MAPD (in %); for abbreviation, see section 2.3] of the comparisons of in situ matchups to EUMETSAT OLCI acdom(443) and the acdm(λ), aphy(λ), and anw(λ) products at the eight OLCI bands.
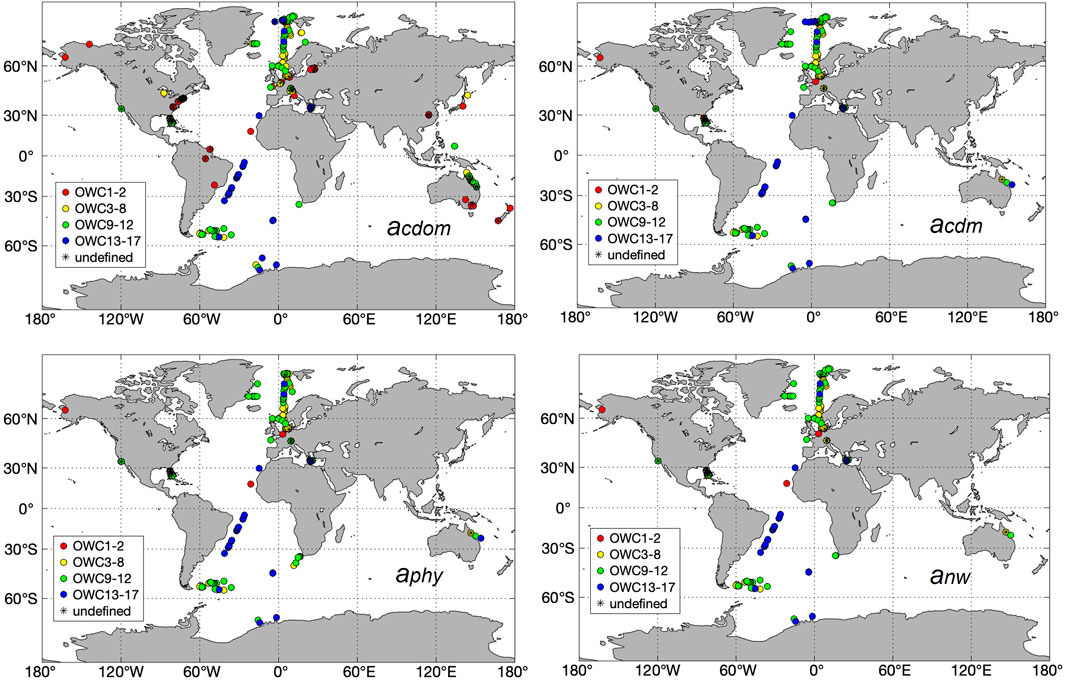
Figure 2. Global maps of distribution of matchups within ± 12 h, 3 × 3 pixels, >50% of valid pixels, and CV < 0.2 at RRs(560) provided for anw(λ), acdm(λ), aphy(λ), and acdm(443), highlighting the different OWC groups: 1–2 (red), 3–8 (yellow), 9–12 (green), and 13–17 (blue). Matchups with no OWC identification are also highlighted.
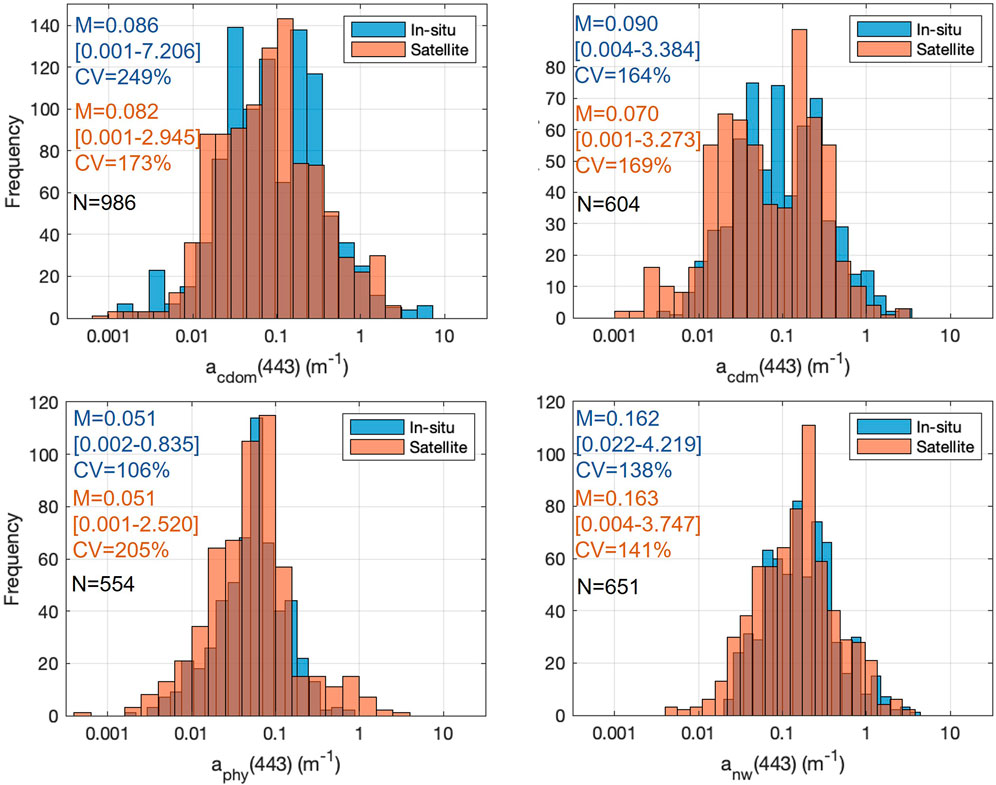
Figure 3. Histograms of absorption coefficients of matchups between in situ and EUMETSAT OLCI with M, N, and CV, which stand for median value in m−1, number of matchup points, and coefficient of variation, respectively. The minimum-to-maximum range values for the optical coefficients are indicated in parentheses (units in m−1 are omitted).
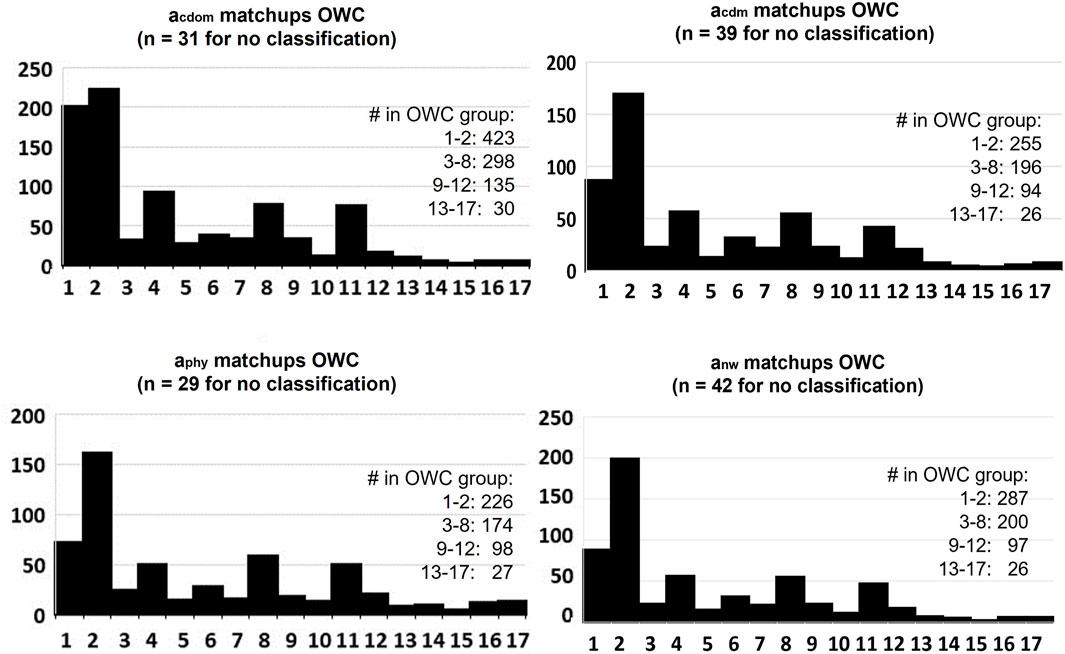
Figure 4. Histograms of classification in OWC of matchups between in situ and EUMETSAT OLCI absorption coefficients. In addition, the numbers of matchups in the four OWC groups (see section 2.3) and without OWC assignment are provided.
As a quantitative comparison of EUMETSAT OLCI vs. in situ data, all statistical measures also for the four absorption products at all available wavebands and based on all valid matchups are provided in Table 1. Figure 5 shows the scatterplots of these comparisons for the 443-nm band only, highlighting their assignment to the OWC together with the MD and MAPD values; Figure 6 shows these metrics for the three different OWC groups.
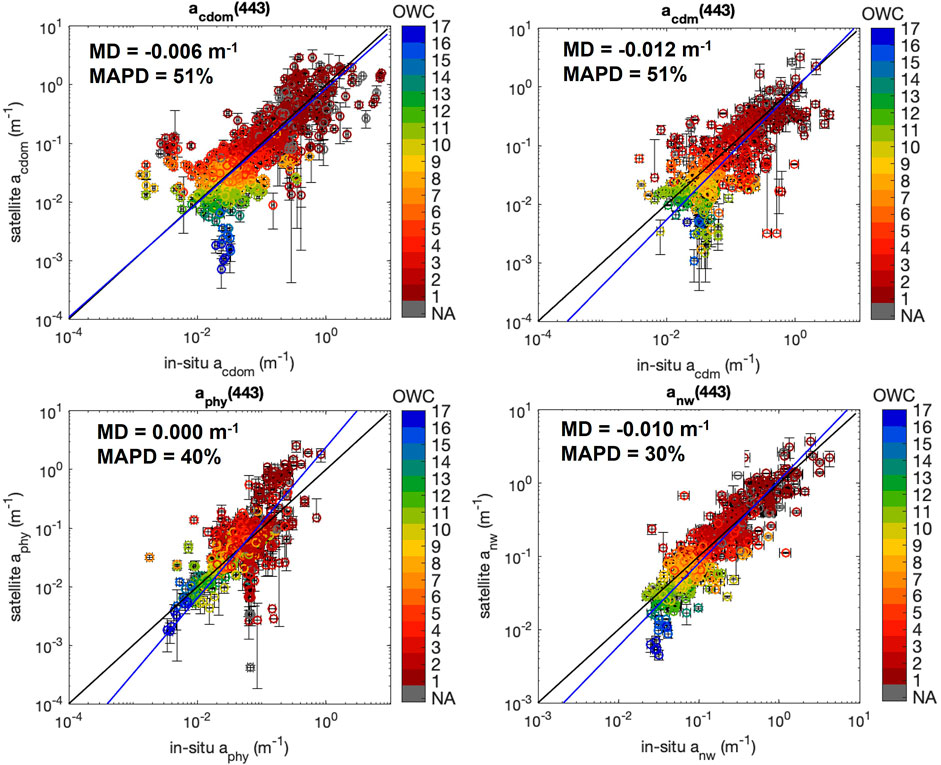
Figure 5. EUMETSAT OLCI vs. in situ matchups for acdom(443), acdm(443), aphy(443), and anw(443) within +12 h, 3 × 3 pixels, and >50% of valid pixels and coefficient of variation (CV) < 0.2 at Rrs(560). The 1:1 line is represented in black, and the fitted line of the matchup comparison in blue.
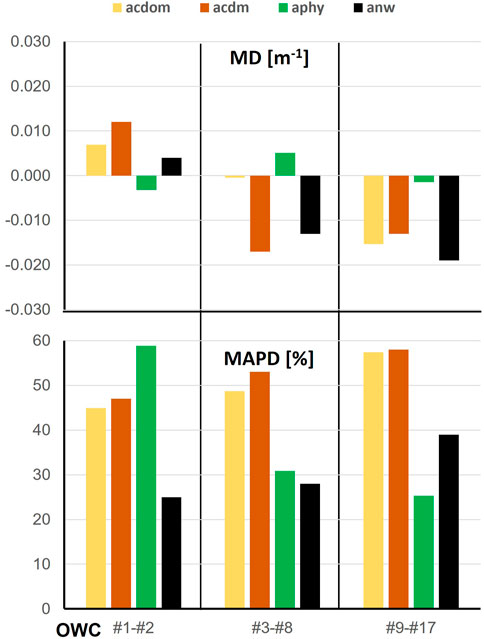
Figure 6. Median deviation (MD in m−1) and median absolute percentage deviation (MAPD in %) of the comparisons of in situ to EUMETSAT S3 acdom(443), acdm(443), aphy(443), and anw(443) product matchups within the three OWC groups, as defined in section 2.3 (the number of matchups is listed in Figure 4), Matchups are extracted as stated in Figure 4.
At the 443-nm band, all four EUMETSAT OLCI products correlate well with the in situ matchups (Figure 5). For acdom(443), matchups agree very close to the 1:1 line (Slog = 0.98); for aphy(443), they disagree the most (Slog = 1.29), and for the other two products, they are within these two values. On the other hand, aphy(443) has no bias (MD = 0.000; MPD = 0%), whereas all the other products have negative biases (MD between −0.006 m-1 and −0.012 m-1; MPD −6%–20%). anw(443) products show the best performance in terms of correlation (R = 0.86) and MAPD (30%) compared to the three other products (R = 0.68–0.72; MAPD = 40%–51%), which also have many more “outliers” (matchups far away from the fitting line) than the anw(443) product. These outliers often [less for aphy(443)] have very large standard deviation for the EUMETSAT-OLCI product, indicating that despite the homogeneity of RRS(560) guaranteed by the matchup extraction procedure, the results of the absorption products within the 3 × 3 pixel box can be quite different. No OWC group was able to be assigned to these outliers. In contrast, the standard deviation of the EUMETSAT-OLCI anw(443) product is rather low.
Regarding the performance of these EUMETSAT-OLCI products for different OWC groups (Figure 6), acdom(443) and acdm(443) perform similar for MAPD and in terms of bias (MD). The latter is negative for OWCs 3−8 and OWCs 9–17, whereas it is positive for the very complex waters (OWCs 1–2). acdm(443) mostly performs much worse in the two case-2 water groups; however, it performs better than acdom(443) in the case-1 water group. When considering the different OWC groups, aphy(443) exhibits low biases. In both case-2 water groups, it exhibits opposite biases to acdom(443) and acdm(443), whereas in case-1 waters, it is also (slightly) negative. In terms of MAPD, aphy(443) shows the highest values for MAPD (59%) in the very complex waters (OWCs 1–2) among all OWC groups and products while showing a nearly low value in other case-2 waters (OWCs 3–8) as anw(443), and the lowest value in all case-1 waters (OWCs 9–17). In summary, the statistical analysis shows clearly that the retrieval of the different components is more successful in waters where they dominate the optical signature, that is, for aphy(443) in case-1 waters and for acdom(443) and acdm(443) in case-2 waters. Interestingly, anw(443) works well in terms of bias and MAPD in both case-2 water groups, but in case-1 waters, it exhibits the highest negative bias (MD = −0.02 m−1) among all four products and also rather high MAPD (39%).
We also analysed the performance of the matchups for bands other than 443 nm. The statistical metrics of these comparisons are shown in Table 1. Figure 7 presents the anw(λ), aphy(λ), and acdm(λ) matchups of in situ and satellite median spectra with the 75% and 25% quantile based on their assignment to the four OWC groups.
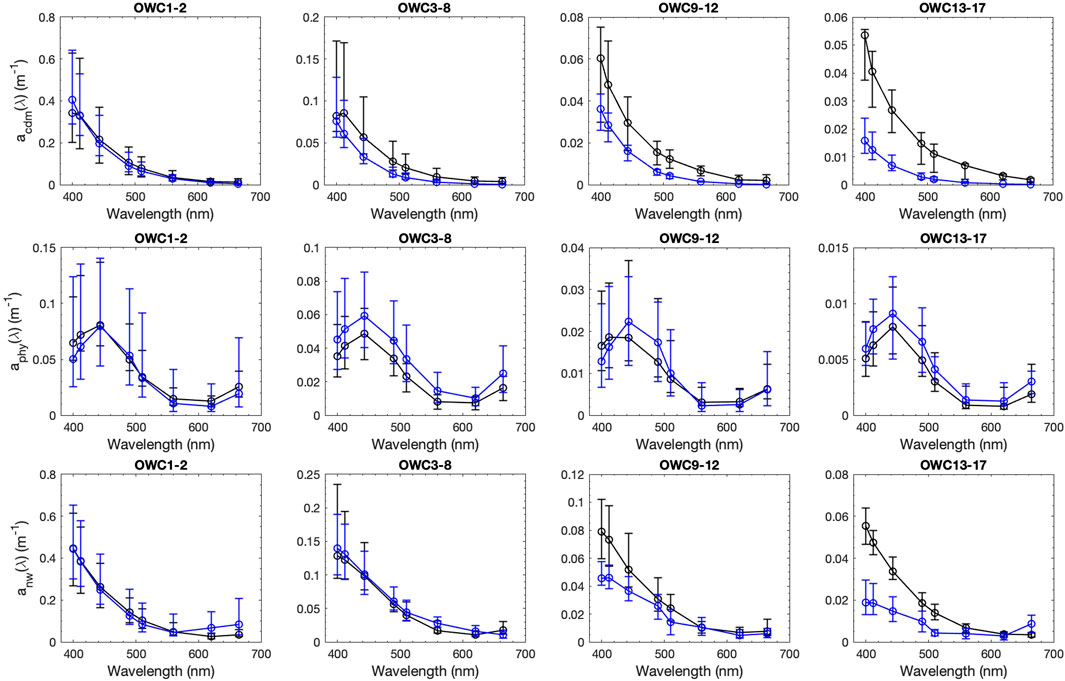
Figure 7. Median +75 percentile and −25% percentile for all three parameters for which EUMETSAT OLCI absorption coefficients are available at the eight OLCI bands (400, 412, 443, 490, 510, 560, 620, and 665 nm) for the matchup in situ (black) and satellite (blue) data based on classification to OWC groups as in Figure 6.
For acdm, the statistical metrics (Table 1) for EUMETSAT OLCI bands 400 nm, 412 nm, 490 nm, and 510 nm are very similar to those for band 443 nm, with a range of Rlog from 0.68 to 0.69, MPD from −4% to −33%, and MAPD from 50% to 57%. They are much poorer for the 560, 620, and 665 nm bands in terms of correlation and relative absolute deviation (Rlog 0.52–0.54 and MAPD 63%–84%; see Table 1). As acdm is generally much lower in these bands than that in the bands at shorter wavelengths, as expected, their negative bias in terms of MD is much lower (between −0.003 and −0.005 m−1) than shorter wavelengths (between −0.005 and −0.012 m-1). The spectral shapes of the in situ and the satellite matchup acdm spectra (Figure 7) agree well (75% quantiles are overlapping) for the first three OWC groups, except at 490 nm–510 nm for the mesotrophic case-1 waters (OWCs 9–12). For the oligotrophic case-1 waters (OWCs 13–17), at all blue and green wavebands, in situ and satellite data are significantly different. For the in situ data compared to the satellite data, the spread between 25% and 75% quantiles is larger, especially in the blue–green range of the spectrum. The comparison of the median spectra shows, for mostly all OWC groups, an underestimation of the satellite compared to the in situ data, which confirms the negative biases observed in the statistics for all matchups.
For aph, the statistical metrics (Table 1) for EUMETSAT OLCI bands at 400 nm, 412 nm, 490 nm, and 510 nm are slightly worse than those for 443 nm, with lower Rlog of 0.61–0.66, higher bias (slightly negative for 400 and 410 and slightly positive for 490 and 510), and higher MAPD (45%–55%). For acdm, Rlog and MAPD are worse for 560, 620, and 665 nm (0.45–0.49 and 69%–82%, respectively), but this is not the case for MPD and MD. The in situ and satellite matchup aphy spectra (Figure 7) agree very well for all four OWC groups (25% and 75% quantiles are overlapping). The spread between 25% and 75% quantiles is similar for both datasets. The comparison of the median spectra shows, for the less complex case-2 waters (OWCs 3–8) and oligotrophic case-1 waters (OWCs 13–17), higher values of satellite data than the in situ data, whereas for the other two OWC groups, it shows slightly lower or similar values. For the OWC 9–12 group (mesotrophic case-1 waters), the medians show a slightly different shape from 400 nm to 443 nm. The values of the 25% and 75% quantiles at each waveband are similar in magnitude for the two datasets for all OWC groups.
For anw, the statistical metrics (Table 1) for EUMETSAT OLCI bands at 400 nm, 412 nm, 490 nm, and 510 nm are comparable to band 443 nm performance, with a slightly lower Rlog of 0.77–0.86, a similar negative bias (MD is smaller and MAD decreases with wavelength, so higher for 400 and 412 and lower for 490 and 510 nm), and a slightly higher MAPD (30%–35%, except at 510 nm where it is 43%). For acdm, the Rlog MPD and MAPD values are worse for 560, 620, and 665 nm (0.54 to 0.67, +22% to +59%, and 58% to 83%, respectively). The latter is most probably due to the same reasoning as for acdm; that is, anw is generally much lower in these bands than that in the bands at shorter wavelengths. For acdm, the median spectral shapes of the in situ and satellite matchup spectra for anw (Figure 7) agree well for the case-2 water groups (OWCs 1–2 and OWCs 3–8) and show lower and much lower values in the case-1 waters for the satellite data. However, the ranges of 25% and 75% quantiles are mostly overlapping, except for band 400 nm and for bands between 400 nm and 443 nm for OWCs 9–12 and OWCs 13–17, respectively. For anw, the values of the 25% and 75% quantiles at each waveband are similar in magnitude for the two datasets for all OWC groups.
In summary, the best statistical results are obtained for all products generally in the blue range, with bands 412, 443, and 490 performing the best and bands 620 and 665 nm performing the worst, as shown in Table 1. Considering all the metrics at band 443 nm, the results for anw are the best (MPD of −8%, MAPD of 30%, and Rlog of 0.89), followed by aphy, which shows no bias (MPD 0%) and a slightly worse MAPD (40%) and an Rlog of 0.68 at 443 nm. Performances of acdom and acdm are weaker, with higher negative MPD (−11% to −20%) and MAPD (51%) and only slightly better Rlog (0.69–0.72) than aphy. In terms of performance in different OWC groups, the results confirm the much higher uncertainty of the EUMETSAT OLCI acdom and acdm products in OWC of the case-1 waters and of aphy products in the very complex case-2 waters, where the contribution of these components is low. Similarities (for most statistical metrics) and differences (considering MD in the different OWC groups) in performance for acdm(443) and acdom(443) are interesting as these EUMETSAT OLCI products are based on two different algorithms, acdom(443) being directly retrieved from RRS(λ) inversions to the bulk IOPs and from that to the specific water component IOPs (see Figure 1).
3.2 Global intercomparison with other operational products
Figure 8 shows the comparison of monthly 2019 9 km gridded S3 OLCI-A L3 products averaged over all longitudes along a latitudinal grid for the EUMETSAT and the NASA acdm(443) and aphy(443) products. For both parameters, the results of the NASA and EUMETSAT processors are nearly identical for OLCI A and B (results for OLCI-B are shown in Supplementary Figure S2), also supported by their mean, median, and standard deviation values calculated from their L3 products (Table 2). The seasonal variation of EUMETSAT products follow, in general, the one depicted by the NASA products, except for the northern hemisphere, where acdm(443) from the EUMETSAT products shows an enhancement in May–June, whereas for NASA products, this starts in August. Considering the global distribution of the relative differences between the EUMETSAT and NASA products (Figure 8, left panel), EUMETSAT products agree within ∼20% with the NASA products for acdm(443), with a slight underestimation in non-productive waters and an overestimation in highly productive waters. Although EUMETSAT aphy(443) products also agree within 20% for most of the open ocean within 55°S–40°N, they are higher in most of the other area, reaching up to 80% in the high latitudes. Furthermore, both EUMETSAT OLCI products show unrealistic values either very early or very late in the season at high latitudes, close to the solar zenith angle limit set for observations, where NASA products do not provide any data.
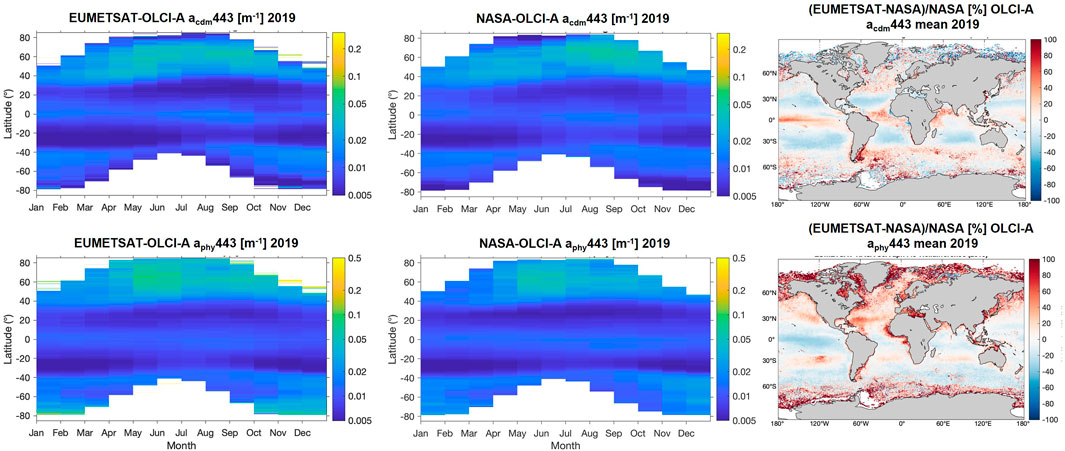
Figure 8. Comparison of EUMETSAT- and NASA-processed acdm(443) and aphy(443) for 2019 monthly 9 km gridded OLCI-A products as Howmöller plots and as mean relative difference for 2019 (EUMETSAT–NASA/NASA).
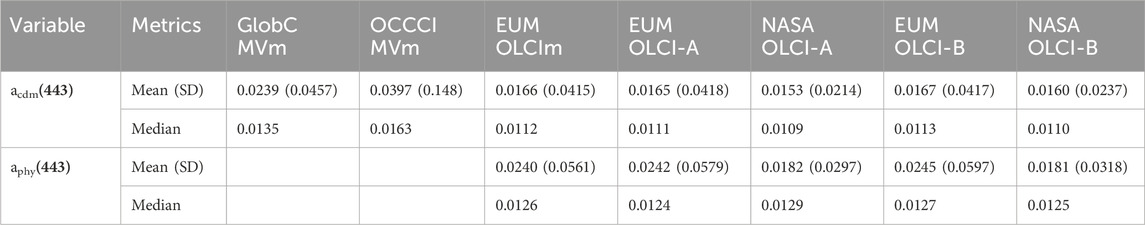
Table 2. Mean, median, and standard deviation of the different monthly 9 km gridded acdm(443) and aphy(443) products from 2019: NASA and EUMETSAT (EUM) OLCI-A and OLCI-B, EUM merged OLCI (OLCIm), GlobColour (GlobC), and OCCCI merged MODIS and VIIRS (MVm) products.
Figure 9 (upper panel) shows the monthly 9 km gridded L3 data for the merged EUMETSAT OLCI, GlobColour, and OCCCI acdm(443) products in Hovmöller plot representation. EUMETSAT OLCI merged products are nearly identical to EUMETSAT OLCI-A and OLCI-B results (Figure 8; Supplementary Figure S2; Table 2). All three merged product processors show similar seasonal patterns and latitudinal distributions, except for the latitudes >60°. At these high latitudes, in contrast to EUMETSAT OLCI and GlobColour, OCCCI products exhibit a different seasonality and are very high. Figure 9 (lower panel) shows the yearly global difference between the products: except for the tropics, EUMETSAT acdm(443) underestimates by 5% to 40% compared to GlobColour and by 20% to 60% compared to OCCCI products, whereas GlobColour compared to OCCCI products underestimates from 5% to 40%. For all comparisons, the underestimation increases with latitudes.
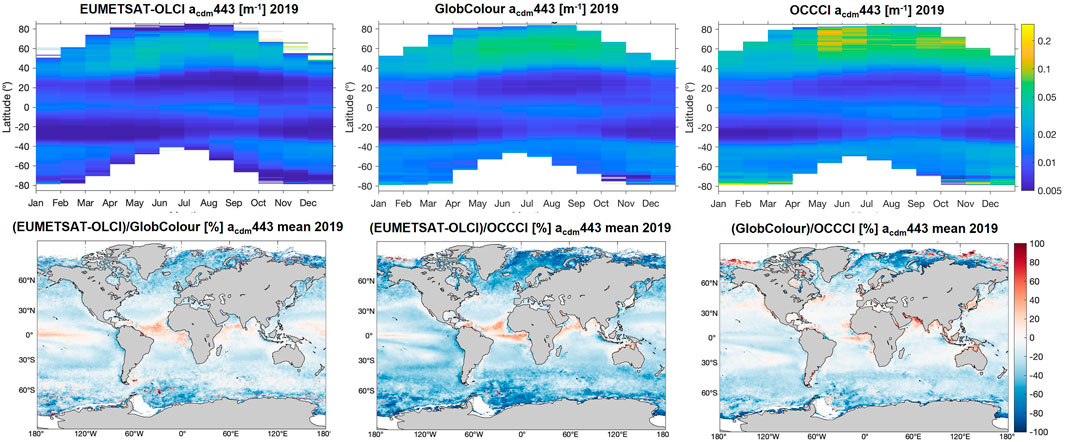
Figure 9. Comparison of merged OLCI from EUMETSAT and merged MODIS-VIIRS from GlobColour and OCCCI acdm(443) for 2019 monthly 9 km gridded products in Hovmöller plot presentation (upper panel) and as mean relative difference for 2019 (lower panel): (EUMETSAT-OLCI–GlobColour)/GlobColour (lower left panel), (EUMETSAT-OLCI–OCCCI)/OCCCI (lower middle panel), and (GlobColour–OCCCI)/OCCCI (lower right panel).
Comparing the yearly gridded average values for 2019 among all products (Table 2) and the statistical metrics (Table 3) results in the following:
• For acdm(443), NASA and EUMETSAT agree on the global 2019 average for mean and median, whereas GlobColour is approximately 35% and 20% higher than both, respectively. OCCCI is much higher (+150% for mean and +45% for median) than NASA (and EUMETSAT) and also higher than GlobColour (+66% for mean and +20% for median). The standard deviation is similar for EUMETSAT and GlobColour, whereas it is approximately half for NASA and even less for OCCCI. Overall, the statistical results confirm the EUMETSAT products’ agreement to the NASA products within a low MAPD (13%) and low bias (−3%). They show slightly larger deviations than GlobColour (MAPD 16% and MPD −16%) and much larger deviations than OCCCI (MAPD 27% and MPD −27%) products. The later deviation is supported by the difference between GlobColour and OCCCI, with an MAPD of 15% and an MPD of −13%.
• For aphy(443), generally NASA and EUMETSAT agree in distribution and are very similar in median values, but NASA’s mean and standard deviation values for the 2019 average are approximately 25% and 50% lower than the EUMESAT product, respectively. Overall, EUMETSAT agrees within a MAPD of 13% and a positive bias of <5% (MPD). Furthermore, for both products, the values are very similar for S3A and S3B OLCI.
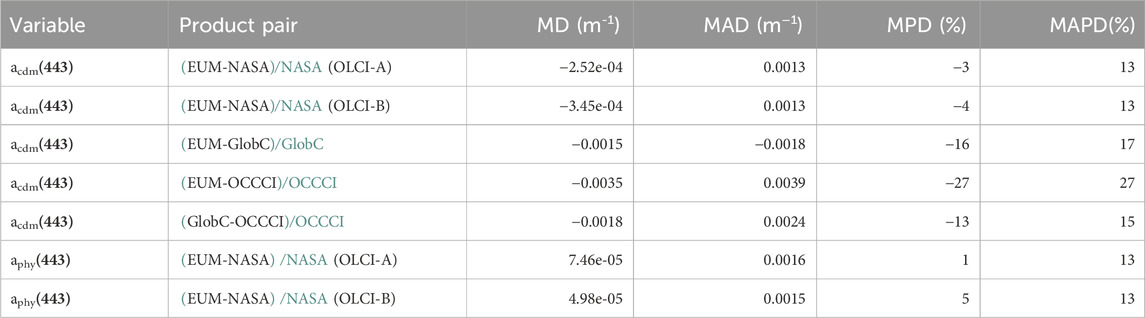
Table 3. Statistics of the absolute (MD and MAD) and relative differences (APD and APD) between acdm(443) and aphy(443) NASA, EUMETSAT (EUM), GlobColour (GlobC), and OCCCI products. Product pairs for absolute differences in black and for relative differences in black and green.
4 Discussion
4.1 In situ validation
In this study, we have validated for the first time EUMETSAT OLCI water absorption products at all available OLCI bands, with a global in situ matchup dataset covering all different water types, according to the classification by Mélin and Vantrepotte (2015) and updated by Jorge et al. (2021).
Formerly, these IOP algorithm-derived absorption coefficients at band 443 nm were validated by the algorithm developers (Jorge et al., 2021; Bonelli et al., 2021). They had applied the algorithms to either in situ or GlobColour merged satellite RRS data (www.hermes.fr). The latter at that time did not contain any OLCI data. Their results were validated with coincident in situ data at band 443 nm only [except aphy(665) was also validated]. The matchup criteria to the GlobColour data were similar to ours but a bit looser for the time window (daily matchups) and a bit stricter for the CV (a value of 0.15 was used). They obtained very similar validation results for all four products compared to ours, with about the same for anw(443), slightly worse for acdm(443), and slightly better for acdom(443), aphy(443), and aphy(665) results (considering Slog, Ilog, Rlog, MD, and MAPD). Although the matchup dataset by Jorge et al. (2021) had approximately the same number of matchups as our data set and included nearly all OWC, it consisted of much more data from oceanic rather than complex waters. This is apparent from the much lower range of their absorption coefficients that do not cover high values than those of our matchup dataset, which spread of over five magnitudes. acdom(443) in situ validation by Bonelli et al. (2021) was based on the open ocean matchups only and on a much lower number of matchups than those of our study (∼16%).
Our analysis of the EUMETSAT OLCI product validation for different OWC groups confirms variations in bias (represented by MD) and MAPD among the OWC groups. Compared to Jorge et al. (2021) validation results based on the same OWC groups (and their algorithm applied to their large in situ RRS matchup dataset), we obtained much lower MD, but our MAPD values were often higher [acdm(443) for all OWC groups; aphy(443) for OWCs 1–2 was 59% versus 40%; anw(443) for OWCs 3–8 was 28% versus 18%], whereas the values are the same or even lower in other cases. Higher MAPD values for our OLCI matchups may result from higher uncertainty in the OLCI RRS input data resulting from atmospheric correction compared to that in the study by Jorge et al. (2021), who evaluated the application of the algorithm to the directly measured in situ RRS data.
We acknowledge that our open water data are mainly confined to the Mediterranean Sea and most latitudes of the Atlantic Ocean, whereas hardly matchups are available for the Pacific and Indic oceans. We still assume our statistical results to be valid for these waters as our results confirm the findings of Jorge et al. (2021) and Bonelli et al. (2021), where the IOP retrieval validation results were very similar and also matchups from these two oceans were covered within the open water OWCs. Moreover, our analysis showed that the performance of the validation based on matchups in very complex waters (OWCs 1–2) was robust and comparable to the performance obtained for matchups in the other OWC groups. We conclude from this analysis that despite applying a rather large time window (±12 h) for matchups (which was also used by Jorge et al. (2021) for their satellite validation of the same algorithm’s products), we still obtained adequate matchups between the satellite and in situ data as we applied the matchup condition of having 50% of valid pixels in the 3 × 3 pixel matchups meeting a CV < 0.2. Results by González et al. (2024) for the validation of chlorophyll-a concentration in the Baltic Sea confirm that using these criteria allows loosening the temporal time condition even in very complex waters. This is because only matchups are kept for the validation ensuring homogeneous conditions within a larger footprint of the in situ data point. In addition, this was confirmed by our first attempt when we extracted matchups using a very strict time window (±1 h) for acdom(443) and aphy for the eight OLCI bands. Results show very similar statistical performance (Supplementary Table S3) for both temporal criteria. However, the first matchup dataset (±1 h) was based on 15%–25% of the total matchups obtained with the ±12-h temporal criterion, and it did not cover any OWC in the oligotrophic waters (OWCs 15–17) and also missed out on many more OWCs (OWCs 5, 7, 10, and 12). Therefore, in order to not limit our assessment of the OLCI products along different water types, we opted for the matchups based on the larger time window. We further analysed the temporal difference between our matchups, as illustrated in the new Supplementary Figure S3. We can clearly see that for OWCs 1–8, most matchups are within ± 6 h, with median absolute time differences between >2 and <4 h. For nearly all case-1 waters (OWCs 9–17), this value is similar (except for the oligotrophic OWC 15, where it reaches 8 h), but the range of most extends for the 75% percentile up to 9 h. In general, this confirms that in our study, the time difference for matchups of the more complex waters has met a more stringent criterion than for the matchups of the case-1 waters. Mélin and Vantrepotte (2015) characterised the optical diversity in accordance with our OWC classification. Their analysis shows that along with case-1 waters, the most turbid waters, closed seas, and inland water bodies have very low values, which allow the loosening of the generally recommended time criterion of ± 4 h (EUMETSAT, 2022; Zibordi et al., 2023). Furthermore, their analysis supports keeping the strict criterion for the intermediate waters between the coastal domain and open ocean, which show the highest optical diversity and vary on much shorter time scales. The varying optical diversity across the OWCs is further confirmed in our study by the varying standard deviation shown in Figure 7 for both in situ and satellite matchups. Due to the relatively young age of the mission, our EUMETSAT OLCI absorption product assessment is limited to evaluate the results based on the OWC classification. This is because global ocean matchups were not available for all regions (as mentioned above for most of the Pacific Ocean and all of the Indian Ocean), which would have allowed a deeper analysis of the water type classification.
Furthermore, our validation results for EUMETSAT OLCI FR products are quite consistent with the former independent in situ validation of absorption products at 443 nm by Zibordi et al. (2023). Here, nearly the same matchup procedure was used but with EUMETSAT OLCI-A RR products (i.e., a larger spatial window used for matchups compared to ours as RR products have 1 km resolution as opposed to 300 m for FR products) and with a stricter time window (±4 h). Their validation results were worse for anw (their MPD at −29% showed a strong negative bias but with other metrics nearly identical to ours), slightly worse for acdm [a higher MPD (+32%) and a lower Rlog (0.64), but a lower MAPD at 32%], and slightly better for aphy [a higher MPD (3%), but lower MAPD (18%) and higher Rlog (0.87)]. Zibordi et al. (2023) focused on 88 matchups obtained around the European Seas, whereas we have compiled a very large global matchup dataset covering all OWCs for all the absorption products with six to more than ten times the number of matchups, depending on the product.
In summary, our validation results support the high confidence in the EUMETSAT OLCI FR absorption products found by Zibordi et al. (2023) for the RR products. Our results are also in agreement with previous results generated by the algorithm developers’ when the algorithm was applied to in situ or other satellite RRS data. Results are consistent for OLCI-A and OLCI-B, and even with the relaxed time window for matchups, no clear outliers in the statistical analysis were identified. Furthermore, considering the lifetime of the S3 mission so far, but also overall, this is the first study presenting a very large and comprehensive matchup dataset for acdom(443) and for eight bands of anw, aph, and acdm covering all OWCs, as defined by Mélin and Vantrepotte (2015). The in situ dataset was based on a strict quality control (Valente et al., 2022) after only considering data from measurements on discrete water samples following the standard protocol (IOCCG Protocol Series, 2018) and using an realistic estimate of the uncertainty in the in situ dataset. However, the detail on data reporting still varies among the different datasets which contribute to the uncertainty estimate analysis for product validation. Our matchup criteria and statistical analysis also followed the standard protocols (EUMETSAT, 2022), and for the validation, as suggested by Brewin et al. (2023), we accounted in the type-2 model regressions (used to determine Rlog, Slog, and Ilog) for a realistic uncertainty of the in situ measurements and the standard deviation in the matched satellite data. Based on our evaluation of the in situ validation results, and compared to former in situ validations, we can infer that the algorithm provides robust results (Rlog = 0.61 to 0.89, MPD = −20% to +11%, and MAPD = 30%–57%) for acdom(443) and at 412, 443, 490, and 510 nm for acdm, aph, and anw. Results are less robust for these coefficients at the longer wavebands, where (according to its OWC) the contribution of the specific optical component is low, and atmospheric correction often introduces higher uncertainties. Because of the dominance of the contribution of pure water to total absorption from the green (555 nm) to the red part of the spectrum, the retrieval accuracy of anw(λ) (and then of the other absorption components) in this part of the spectrum is very challenging. In addition, in situ measurements of acdom(λ) and the spectral absorption coefficient of non-algal particles which are used to obtain acdm(λ) in this spectral domain are usually even more largely impacted by measurement uncertainties than shorter wavelengths (IOCCG Protocol Series, 2018; Mannino et al., 2019).
4.2 Intercomparison among operational absorption products
Our evaluation of the intercomparisons of monthly 9 km gridded L3 products from EUMETSAT, GlobColour, NASA, and OCCCI for 2019 provided the following insights on the global performance of EUMETSAT OLCI RR aphy(443) and acdm(443) products. To our knowledge, our activity was the first to globally intercompare different operational IOP satellite products. We picked a representative year (2019) where both, Sentinel-3A and B, OLCIs were fully operational and compared these products with the corresponding GlobColour, NASA, and OCCCI products (as well as between OLCI-A and B for the same EUMETSAT products). Results enabled the depiction of typical and expected seasonal distributions for all four different retrievals (and satellite data inputs), along with systematic differences which were mostly linked to features of high vs. mid-low latitudes or low vs. highly productive regions showing opposite features.
The two EUMETSAT absorption products at 443 nm agree well with NASA products, with low biases (<±5%). Our results confirm that differences between OLCI-A and OLCI-B instruments are marginal, and results are consistent for NASA and the EUMETSAT IOP retrievals. For EUMETSAT acdm(443), the bias to GlobColour is within −15% and the overall agreement, as is the case for the NASA products, is within 15%. In contrast, the negative bias to OCCCI is even higher (−27%), and the agreement is also only within 27%. However, with the bias of GlobColour to OCCCI also close to −15% and the agreement only within 15%, this points towards a likelihood that the OCCCI acdm(443) products are too high. Regarding the standard deviation of the yearly 2019 products, the EUMETSAT products have a standard deviation almost twice as large as the NASA and OCCCI products, whereas the values are very similar to those calculated for GlobColour. Both evaluated EUMETSAT products show unrealistic values in the high latitudes close to the solar zenith angle limit set for observations. The flagging of invalid EUMETSAT OLCI Rrs data seems to be failing in these cases. Improvements in quality flagging of EUMETSAT OLCI Rrs are recommended to eliminate the unrealistic absorption values of OLCI IOP products. EUMETSAT is planning to implement new flagging of Rrs products in the next processing version in 2026 (E. Kwiatkowska, EUMETSAT, pers. comm.).
The systematic observed differences between operational products can be caused by differences either in IOP algorithms (see details in section 2.1.) or in the input RRS data resulting from the uncertainty of atmospheric corrections:
1. The NASA GIOP products for SeaWiFS, MODIS, and MERIS are regularly validated (https://oceancolor.gsfc.nasa.gov/resources/atbd/giop/). No results for the NASA OLCI products have been presented. The in situ validation results significantly vary between the different sensors (SeaWiFS, MODIS, and MERIS) of GIOP products. However, they generally show less bias (lower MD) for acdm(443) compared to aphy(443) and vice versa for MAD, which is the opposite to the comparisons for EUMETSAT OLCI products. The GlobColour acdm(443) product has been validated within the Copernicus Marine Service (Garnesson et al., 2023), which showed better results for Slog (1.06) and Rlog(0.78), but much worse Ilog (−0.17) and MD (0.23 m-1) than EUMETSAT OLCI products. This validation was based on approximately 75% of the matchups used in our in situ validation. To our knowledge, no satellite product in situ validation has been performed so far for the OCCCI acdm(443) (see ESA-OCCCI, 2022). This product is based on the QAA_v6 algorithm (Lee et al., 2014).
2. Based on the different operational product providers, the different input RRS data generally meet mostly their missions’ requirements (<5% uncertainty) in the blue bands and the open ocean. EUMETSAT OLCI, OCCCI, and GlobColour RRS data validations against in situ show very similar performance (EUMETSAT, 2021; ESA-OCCCI, 2021; Brockmann and Stelzer, 2022; Garnesson et al., 2023), with OCCCI showing slightly better results for the intercept and RMSD, whereas GlobColour products have lower biases, better slopes, and higher R2 values. EUMETSAT OLCI products’ slope lays in between GlobColour and OCCI, and the products show slightly higher biases. NASA OLCI RRS data are based on the l2gen atmospheric correction (Ahmad et al., 2010). Validation for NASA OLCI RRS data is presented for a few wavebands for the two OLCI instruments separately (https://oceancolor.gsfc.nasa.gov/data/reprocessing/r2022/s3a/, https://oceancolor.gsfc.nasa.gov/data/reprocessing/r2022/s3b/). Statistical results of the MAD are slightly worse for bands 412, 443, and 665 nm and slightly better for band 490 nm than that of the EUMETSAT OLCI products (EUMETSAT, 2021).
In summary, the current status of these previous assessments of the operational products of aphy(443) and acdm(443) intercompared in this study does not allow us to interpret the deviations among them as an indicator of poorer or superior performance. Regarding the quality of their RRS input data, these appear to be similar among the different products considered here. Most probably, the differences in the algorithm parametrizations are the main influence on the biases between the different operational products. Validation of the operational NASA OLCI aphy(443) and acdm(443) and merged GlobColour and OCCCI acdm(443) using the same in situ dataset as for the EMETSAT-OLCI products will enable a ranking of their performance.
5 Conclusion
Considering the 8-year S3 mission lifetime so far, this is the first study presenting a large and comprehensive global matchup in situ dataset covering all OWCs and including validation of acdom(443) and anw(λ), aphy(λ), and acdm(λ) (with λ equal to bands centred at 400, 412, 490, 510, 560, 620, and 665 nm). Results for the four EUMETSAT OLCI absorption products at the 443 nm centred band, based on in situ validation, confirm their robustness with reasonable accuracy (MAPD 29%–51% and MPD 0% to −19%). For two of these products, aphy(443) and acdm(443), this may be confirmed by our global intercomparison with operationally available data from other missions and agencies, which showed consistent seasonal and regional variations in accordance with each other. Our evaluation of EUMETSAT OLCI absorption products supports EUMETSAT’s decision to recently release these products into operational processing. Furthermore, our results for bands 400, 412, 490, and 510 nm showed very similar performance in the in situ validation to the results of band 443 nm, suggesting that the absorption products for these bands could be released as well. Nevertheless, in the following, we raise a list of open points for improving the IOP algorithm, enlarging its applicability and enabling the continuity of the assessment of the operational product.
We recommend revising the EUMETSAT OLCI IOP algorithm to improve the performance for the bands centred at 560, 620, and 665 nm. Optimizing the retrieval might benefit from newly released simulated dataset allowing optical closure from water constituent concentrations and IOPs to Rrs(λ), covering specific IOPs characteristic for many water types (Bi et al., 2023; Loisel et al., 2023). Flagging of invalid OLCI retrievals (artefacts) should be targeted, for example, in areas and at wavebands where the obtained signal is too close to the noise. A special focus for development should also be targeted on the high latitudes; this became especially visible in the L3 intercomparison. This should probably start with improving the quality (flagging) of the input Rrs OLCI products used in the IOP algorithm in high latitude waters and at high solar zenith angles.
To ensure that current and future versions of the IOP algorithms are accompanied by a comprehensive uncertainty characterization, regular global in situ validations encompassing the majority of OWCs and intercomparison with other mission data are pre-requisites. A protocol on measuring in situ absorption properties, data analysis, and uncertainty has been developed (IOCCG Protocol Series, 2018; Mannino et al., 2019). However, training events and organization of round robins for intercomparison of different IOPs’ in situ measurement systems is necessary to consolidate the protocols for global satellite validation. Similar efforts are successfully ongoing for the in situ measurements and data analyses of phytoplankton pigments and for ocean colour radiometry used in validation (e.g., Banks et al., 2020; Tilstone et al., 2020; Canuti et al., 2022). Inline spectrophotometric measurements also enable the retrieval of hyperspectral anw, along with acdm, acdom, and aphy data (IOCCG et al., 2019a). These inline datasets, despite their higher uncertainty than discrete water measurements, could be particularly useful to assess the data quality of EUMETSAT products at all eight OLCI bands for anw and allow a better assessment of satellite data when acquired in spatially and/or temporally inhomogeneous scenes (e.g., Liu et al. (2018)).
L3 intercomparisons with all available products from other processors and missions helped identify important latitudinal and seasonal inconsistencies. It would be valid to enlarge these intercomparisons over the whole mission’s lifetime, now covering more than 8 years. Finally, the large number of ocean colour missions that will be launched in the coming years provides additional justification for a continuous iterative approach in repeating and updating the validations presented here as new sensors come online.
Finally, the 3SSA IOP algorithm (Jorge et al., 2021) is set to be tested on the recently launched hyperspectral satellite sensors, for example, the Ocean Color Imager (OCI) from the global Plankton, Aerosol, Cloud, Ocean Ecosystem (PACE) mission (Werdell et al., 2019). This will enable IOPs’ retrievals across the visible spectrum with the abundance of information contained in hyperspectral IOPs helping obtain much more quantitative information about the composition of the different optically active substances in the surface ocean and lower the uncertainties in estimates of primary production. These hyperspectral products will also need validating and comparing with results such as those presented in this paper.
Data availability statement
The datasets presented in this study can be found in online repositories. The names of the repository/repositories and accession number(s) can be found in the article/Supplementary Material.
Author contributions
AsB: Conceptualization, Data curation, Formal Analysis, Funding acquisition, Investigation, Methodology, Project administration, Resources, Visualization, Writing – original draft, Writing – review and editing. AnB: Data curation, Funding acquisition, Resources, Validation, Writing – review and editing. HX: Data curation, Formal Analysis, Methodology, Validation, Visualization, Writing – review and editing. DD: Conceptualization, Data curation, Resources, Writing – review and editing. JG: Data curation, Methodology, Software, Writing – review and editing. CL: Methodology, Writing – review and editing. RR: Data curation, Methodology, Writing – review and editing. EK: Conceptualization, Writing – review and editing. SC: Data curation, Writing – review and editing. EM: Methodology, Writing – review and editing. EP: Data curation, Writing – review and editing. MS: Data curation, Methodology, Writing – review and editing. JW: Funding acquisition, Project administration, Writing – review and editing. CZ: Data curation, Writing – review and editing.
Funding
The author(s) declare that financial support was received for the research and/or publication of this article. This work was supported by EUMETSAT as part of the “S3 OLCI Ocean Colour product improvements” project, in the frame of the European Commission Copernicus program (contract No. EUM/CO/23/4600002753/DDe). The acquisition and curation of the “Bracher-new” dataset was supported by AWI, the Helmholtz Infrastructure project FRAM, and the DLR Space Agency with funds of the German Federal Ministry of Economic Affairs and Climate Action (projects TypSynSat FKZ 50EE 1915 and EnMAP CalVal Water 50EE 1923), and the DFG (German Research Foundation) Transregional Collaborative Research Center ArctiC Amplication: Climate Relevant Atmospheric and SurfaCe Processes, and Feedback Mechanisms (AC)3 (Project C03, grant no. 268020496–TRR 172). EM contribution was funded in parts by Mardata and Inspire project “4DPhyto.” The acquisition and curation of the “Banks-new” data was supported by HCMR, DG-JRC of the European Commission, and the LEVECO (GSRT/IKY/SIEMENS 2014–2016), the PERLE-2 (doi 10.17600/18000865), and the MARRE (Hellenic Ministry of Economy and development, EPAnEK, NSRF 2014–2020) projects.
Acknowledgments
The authors would like to thank C. Hohe, J. Oelker, L. Alvarado, M. Zeising, M. Gomez, and S. Dittrich for supporting the collection and measurements of absorption data at expeditions MSM93, PS126, PS131, PS133-1, and Lake Constance Campaigns BS1, BS2, BS3, and BS4. The captains, other scientists, and crews of these expeditions and of FS Kormoran at BS1 are thanked for supporting the AWI (“Bracher-new”) sample collection. The authors would like to thank G. Zibordi [formerly of the European Commission’s Joint Research Centre (JRC), now at NASA] and J.-F. Berthon of JRC for helpful advice and discussion and some of the JRC absorption data collected on the joint JRC-HCMR optics cruise around Crete in April/May 2022. N. Spyridakis, S. Psarra, E. Livanou, D. Velaoras, A. Karageorgis, P. Drakopoulos, and the captains and crews of the HCMR R/Vs Aegaeo and Philia, and the IFREMER R/V “Pourquoi Pas?” are also gratefully acknowledged for facilitating the acquisition and curation of the HCMR (“Banks-new”) sample collection. Data were sourced from Australia’s Integrated Marine Observing System (IMOS)—IMOS is enabled by the National Collaborative Research Infrastructure Strategy (NCRIS). It is operated by a consortium of institutions as an unincorporated joint venture, with the University of Tasmania as Lead Agent. All AODN data contributors [Janet Anstee, Joey Crosswell, Ruth Erikson, and Thomas Schroeder (CSIRO); Renee Gruber (AIMS)], IMOS, NCRIS, AIMS, and CSIRO are acknowledged for their contribution and funding. Alexander Castagna (Universiteit Gent), all scientists contributing to the Lehmann et al. (2022) aCDOM(443) dataset collection, and all SEABASS data contributors [Colin Roesler (BOW); Maria Tzortziou (CCNY); Ivona Cetinic, Chelsea Lopez, Antonio Mannino, Aimee Neeley, S. Scholaert, and Ryan Vandermeulen (NASA); Colleen Mouw (URI); James Allen, Sasha Kramer, Kelsey Bisson, Dylan Catlett, and David Siegel (UCSB); Chuanmin Hu, and Frank Muller-Karger (USF)], SeaBASS, and NASA are acknowledged for their contribution and funding. The authors acknowledge support by the Open Access Publication Funds of Alfred-Wegener-Institut Helmholtz- Zentrum für Polar-und Meeresforschung.
Conflict of interest
Authors CL and JW were employed by Brockmann Consult GmbH.
The remaining authors declare that the research was conducted in the absence of any commercial or financial relationships that could be construed as a potential conflict of interest.
The author(s) declared that they were an editorial board member of Frontiers, at the time of submission. This had no impact on the peer review process and the final decision.
Generative AI statement
The author(s) declare that no Generative AI was used in the creation of this manuscript.
Publisher’s note
All claims expressed in this article are solely those of the authors and do not necessarily represent those of their affiliated organizations, or those of the publisher, the editors and the reviewers. Any product that may be evaluated in this article, or claim that may be made by its manufacturer, is not guaranteed or endorsed by the publisher.
Supplementary material
The Supplementary Material for this article can be found online at: https://www.frontiersin.org/articles/10.3389/frsen.2025.1545664/full#supplementary-material
References
Ahmad, Z., Franz, B. A., McClain, C. R., Kwiatkowska, E. J., Werdell, J., Shettle, E. P., et al. (2010). New aerosol models for the retrieval of aerosol optical thickness and normalized water-leaving radiances from the SeaWiFS and MODIS sensors over coastal regions and open oceans. Appl. Opt. 49, 5545–5560. doi:10.1364/ao.49.005545
Álvarez, E., Losa, S. N., Bracher, A., Thoms, S., and Völker, C. (2022). Phytoplankton light absorption impacted by photoprotective carotenoids in a global ocean spectrally-resolved biogeochemistry model. JAMES 14. doi:10.1029/2022MS003126
Banks, A. C., Vendt, R., Alikas, K., Bialek, A., Kuusk, J., Lerebourg, C., et al. (2020). Fiducial reference measurements for satellite ocean colour (FRM4SOC). Remote Sens. 12 (8), 1322. doi:10.3390/rs12081322
Bi, S., Hieronymi, M., and Röttgers, R. (2023). Bio-geo-optical modelling of natural waters. Front. Mar. Sci. 10, 1196352. doi:10.3389/fmars.2023.1196352
Bonelli, A. G., Vantrepotte, V., Schaffer, D., Jorge, F., Jamet, C., Dessailly, D., et al. (2021). Colored dissolved organic matter absorption at global scale from ocean color radiometry observation: spatio-Temporal variability and contribution to the absorption budget. Remote Sens. Environ. 265, 112637. doi:10.1016/j.rse.2021.112637
Bracher, A., Bouman, H. A., Bricaud, A., Brewin, R. W. J., Brotas, V., Ciotti, A. M., et al. (2017). Obtaining phytoplankton diversity from ocean color: a scientific roadmap for future development. Front. Mar. Sci. 4, 55. doi:10.3389/fmars.2017.00055
Bracher, A., and Liu, Y. (2021a). Spectrophotometric measurements of absorption coefficients by non-algal particles in the Atlantic Southern Ocean during RV POLARSTERN cruise PS103 in Dec 2016 to Jan 2017. Bremen, Germany: PANGAEA. doi:10.1594/PANGAEA.938196
Bracher, A., and Liu, Y. (2021b). Spectrophotometric measurements of absorption coefficients by phytoplankton in the Atlantic Southern Ocean during RV POLARSTERN cruise PS103 in Dec 2016 to Jan 2017. Bremen, Germany: PANGAEA. doi:10.1594/PANGAEA.938193
Bracher, A., Liu, Y., Hellmann, S., and Röttgers, R. (2021a). Absorption coefficients by coloured dissolved organic matter from north sea to fram strait measured at fixed stations with a liquid waveguide capillary cell system during POLARSTERN cruise PS99.1. Bremen, Germany: PANGAEA. doi:10.1594/PANGAEA.938491
Bracher, A., Liu, Y., Hellmann, S., and Röttgers, R. (2021b). Absorption coefficients by coloured dissolved organic matter from north sea to fram strait measured underway with a liquid waveguide capillary cell system during POLARSTERN cruise PS99.1. Bremen, Germany: PANGAEA. doi:10.1594/PANGAEA.938494
Bracher, A., Liu, Y., Hellmann, S., and Röttgers, R. (2025a). Absorption coefficients by coloured dissolved organic matter (CDOM) within the fram strait measured underway with a liquid waveguide capillary cell system during POLARSTERN cruise PS99.2. Bremen, Germany: PANGAEA. doi:10.1594/PANGAEA.971552
Bracher, A., Liu, Y., Hellmann, S., and Röttgers, R. (2025b). Absorption coefficients by coloured dissolved organic matter (CDOM) within the fram strait measured at fixed stations with a liquid waveguide capillary cell system during POLARSTERN cruise PS99.2. Bremen, Germany: PANGAEA. doi:10.1594/PANGAEA.971524
Bracher, A., Liu, Y., Hellmann, S., and Röttgers, R. (2025c). Absorption coefficients by coloured dissolved organic matter (CDOM) within the fram strait measured underway with a liquid waveguide capillary cell system during POLARSTERN cruise PS107. Bremen, Germany: PANGAEA. doi:10.1594/PANGAEA.971587
Bracher, A., Liu, Y., Hellmann, S., and Röttgers, R. (2025d). Absorption coefficients by coloured dissolved organic matter (CDOM) within the fram strait measured at fixed stations with a liquid waveguide capillary cell system during POLARSTERN cruise PS107. Bremen, Germany: PANGAEA. doi:10.1594/PANGAEA.971585
Bracher, A., Liu, Y., Oelker, J., and Röttgers, R. (2021c). Absorption coefficients by coloured dissolved organic matter across the south Atlantic Ocean measured at fixed stations with a liquid waveguide capillary cell system during POLARSTERN cruise PS103. Bremen, Germany: PANGAEA. doi:10.1594/PANGAEA.938467
Bracher, A., Liu, Y., Oelker, J., and Röttgers, R. (2021d). Absorption coefficients by coloured dissolved organic matter across the south Atlantic Ocean measured underway with a liquid waveguide capillary cell system during POLARSTERN cruise PS103. Bremen, Germany: PANGAEA. doi:10.1594/PANGAEA.938468
Bracher, A., Liu, Y., and Wiegmann, S. (2021e). Spectrophotometric measurements of absorption coefficients by non-algal particles during RV POLARSTERN cruise PS121 from 11 Aug to 10 sep 2019. Bremen, Germany: PANGAEA. doi:10.1594/PANGAEA.938262
Bracher, A., Liu, Y., and Wiegmann, S. (2021f). Spectrophotometric measurements of absorption coefficients by phytoplankton during RV POLARSTERN cruise PS121 from 11 Aug to 10 sep 2019. Bremen, Germany: PANGAEA. doi:10.1594/PANGAEA.938260
Bracher, A., Liu, Y., Wiegmann, S., and Röttgers, R. (2021g). Absorption coefficients by coloured dissolved organic matter (CDOM) from north sea to fram strait measured at fixed stations with a liquid waveguide capillary cell system during POLARSTERN cruise PS121. Bremen, Germany: PANGAEA. doi:10.1594/PANGAEA.938472
Bracher, A., Liu, Y., Wiegmann, S., and Röttgers, R. (2021h). Absorption coefficients by coloured dissolved organic matter (CDOM) from north sea to fram strait measured underway with a liquid waveguide capillary cell system during POLARSTERN cruise PS121. Bremen, Germany: PANGAEA. doi:10.1594/PANGAEA.938473
Bracher, A., Liu, Y., Wiegmann, S., Xi, H., and Röttgers, R. (2021i). Absorption coefficients by coloured dissolved organic matter across the Atlantic Ocean measured at fixed stations with a liquid waveguide capillary cell system during POLARSTERN cruise PS113. Bremen, Germany: PANGAEA. doi:10.1594/PANGAEA.938399
Bracher, A., Liu, Y., Wiegmann, S., Xi, H., and Röttgers, R. (2021j). Absorption coefficients by coloured dissolved organic matter across the Atlantic Ocean measured underway with a liquid waveguide capillary cell system during POLARSTERN cruise PS113. Bremen, Germany: PANGAEA. doi:10.1594/PANGAEA.938400
Bracher, A., Liu, Y., Xi, H., and Wiegmann, S. (2021k). Spectrophotometric measurements of absorption coefficients by non-algal particles during POLARSTERN cruise PS113 along an Atlantic transect. Bremen, Germany: PANGAEA. doi:10.1594/PANGAEA.938185
Bracher, A., Liu, Y., Xi, H., and Wiegmann, S. (2021l). Spectrophotometric measurements of absorption coefficients by phytoplankton during POLARSTERN cruise PS113 along an Atlantic transect. Bremen, Germany: PANGAEA. doi:10.1594/PANGAEA.938178
Bracher, A., Soppa, M. A., Banks, A. C., Xi, H., Chaikalis, S., Pitta, E., et al. (2025e). Absorption coefficients by phytoplankton at the first eight ocean land colour imager (OLCI) bands from a global in-situ collection of open ocean, coastal and inland waters matched to OLCI. doi:10.1594/PANGAEA.983241
Bracher, A., Soppa, M. A., Banks, A. C., Xi, H., Chaikalis, S., and Röttgers, R. (2025f). Absorption coefficients by coloured dissolved organic matter at 443 from a global in-situ collection of open ocean, coastal and inland surface waters matched to Ocean Land Colour Instrument. doi:10.1594/PANGAEA.983195
Bracher, A., Soppa, M. A., Banks, A. C., Xi, H., Chaikalis, S., and Röttgers, R. (2025g). Absorption coefficients by coloured detrital and dissolved organic matter at the first eight ocean land colour imager (OLCI). doi:10.1594/PANGAEA.983161
Bracher, A., Soppa, M. A., Banks, A. C., Xi, H., Chaikalis, S., and Röttgers, R. (2025h). Absorption coefficients by non-water components at the first eight Ocean Land Colour Imager (OLCI) bands from a global in-situ collection of open oceans, coastal and inland waters matched to OLCI. doi:10.1594/PANGAEA.983227
Brewin, R. J. W., Sathyendranath, S., Kulk, G., Rio, M.-H., Concha, J. A., Bell, T. G., et al. (2023). Ocean carbon from space: current status and priorities for the next decade. Earth-Science Rev. 240, 104386. doi:10.1016/j.earscirev.2023.104386
Brockmann, C., and Stelzer, K. (2022). Copernicus marine service quality information document. Global reprocessed observation product for the Atlantic and arctic observation products OCEANCOLOUR_GLO_BGC_L3_MY_009_107 OCEANCOLOUR_GLO_BGC_L4_MY_009_108, issue 3.0. Available online at: https://documentation.marine.copernicus.eu/QUID/CMEMS-OC-QUID-009-107to108 (Accessed December 13, 2024).
Campbell, J. W., Blaisdell, J. M., and Darzi, M. (1995). Level-3 SeaWiFS data products: spatial and temporal binning algorithms. NASA Tech. Memo. Editors S. B. Hooker, E. R. Firestone, and J. G. Acker (Greenbelt, MD: NASA Goddard Space Flight Center) 32.
Canuti, E., Artuso, F., Bracher, A., Brotas, V., Devred, E., Dimier, C., et al. (2022). The fifth HPLC intercomparison on phytoplankton pigments (HIP-5) technical report, EUR 31334 EN. Luxembourg: Publications Office of the European Union. doi:10.2760/563102
Castagna, A., Amadei Martínez, L., Bogorad, M., Daveloose, I., Dasseville, R., and Dierssen, H. M. (2022b). Optical and biogeochemical properties of diverse Belgian inland and coastal waters. Earth Syst. Sci. Data 14 (6), 2697–2719. doi:10.5194/essd-14-2697-2022
Castagna, A., Amadei Martínez, L., Bogorad, M., Daveloose, I., Dasseville, R., and Dierssen, H. M. (2022a). Dataset of optical and biogeochemical properties of diverse Belgian inland and coastal waters. Bremen, Germany: PANGAEA. doi:10.1594/PANGAEA.940240
Defoin-Platel, M., and Chami, M. (2007). Sensitivity of the retrieval of the inherent optical properties of marine particles in coastal waters to the directional variations and the polarization of the reflectance. J. Geophys. Research-Oceans 112 (C3), C03004. doi:10.1029/2006jc003758
Doerffer, R., and Schiller, H. (2007). The MERIS case 2 water algorithm. Int. J. Remote Sens. 28, 517–535. doi:10.1080/01431160600821127
ESA-OCCCI (2021). Product validation and inter-comparison report. Available online at: https://climate.esa.int/en/projects/ocean-colour/key-documents/(Accessed November 18, 2024).
ESA-OCCCI (2022). Product user guide for v6.0 dataset. ESA ocean colour climate change initiative (OC_CCI) phase 3. Available online at: https://climate.esa.int/en/projects/ocean-colour/key-documents/(Accessed November 18, 2024).
EUMETSAT (2018). Sentinel-3 OLCI inherent optical properties website. Link to algorithm theoretical basis document (ATBD). Available online at: https://www.eumetsat.int/S3-OLCI-IOP (Accessed November 18, 2024).
EUMETSAT (2021). Sentinel-3 OLCI L2 report for baseline collection OL_L2M_003. Available online at: https://user.eumetsat.int/s3/eup-strapi-media/Sentinel_3_OLCI_L2_report_for_baseline_collection_OL_L2_M_003_2_B_c8bbc6d986.pdf (Accessed November 18, 2024).
EUMETSAT (2024). Sentinel-3 product notice – OLCI Level-2 ocean colour doc. No. EUM/OPS-SEN3/DOC/24/1394276S3_PN_OLCI_L2_M_003_04_Sentinel_3_Product_Notice_OLCI_Level_2_Ocean_Colour_f851462f90.pdf (eumetsat.int). Available online at: https://user.eumetsat.int/s3/eup-strapi-media/S3_PN_OLCI_L2_M_003_04_Sentinel_3_Product_Notice_OLCI_Level_2_Ocean_Colour_f851462f90.pdf (Accessed November 18, 2024).
EUMETSAT (2022). Recommendations for Sentinel-3 OLCI ocean colour product validations in comparison with in situ measurements – Matchup protocols. Available online at: https://user.eumetsat.int/s3/eup-strapi-media/Recommendations_for_Sentinel_3_OLCI_Ocean_Colour_product_validations_in_comparison_with_in_situ_measurements_Matchup_Protocols_V8_B_e6c62ce677.pdf (Accessed November 18, 2024).
Garnesson, P., Mangin, A., Bretagnon, M., and Jutard, Q. (2023). Copernicus marine service quality information document. Global reprocessed observation product for the Atlantic and arctic observation products OCEANCOLOUR_GLO_BGC_L3_NRT_009_101 OCEANCOLOUR_GLO_BGC_L4_NRT_009_102 OCEANCOLOUR_GLO_BGC_L3_MY_009_103 OCEANCOLOUR_GLO_BGC_L4_MY_009_104 OCEANCOLOUR_ATL_BGC_L3_NRT_009_111 OCEANCOLOUR_ATL_BGC_L3_MY_009_113 OCEANCOLOUR_ATL_BGC_L4_NRT_009_116 OCEANCOLOUR_ATL_BGC_L4_MY_009_118, issue 3.0, 16 Jun 2023. Available online at: https://documentation.marine.copernicus.eu/QUID/CMEMS-OC-QUID-009-107to108 (Accessed November 13, 2024).
Glover, D. M., Jenkins, W. J., and Doney, S. C. (2011). Modeling methods for marine science. Cambridge University Press. doi:10.1017/CBO9780511975721
González, V. L., Brando, V. E., Di Cicco, A., Colella, S., D’Alimonte, D., Kajiyama, T., et al. (2024). Assessment of ocean color atmospheric correction methods and development of a regional ocean color operational dataset for the Baltic sea based on Sentinel-3 OLCI. Front. Mar. Sci. 10, 1256990. doi:10.3389/fmars.2023.1256990
IOCCG (2006). Remote sensing of inherent optical properties: fundamentals, tests of algorithms, and applications. Dartmouth, Canada: International Ocean Colour Coordinating Group. Available online at: http://ioccg.org/wp-content/uploads/2015/10/ioccg-report-05.pdf (Accessed November 18, 2024).
IOCCG (2008). Why ocean colour? The societal benefits of ocean-colour technology. Dartmouth, Canada: International Ocean Colour Coordinating Group. Available online at: https://ioccg.org/wp-content/uploads/2015/10/ioccg-report-07.pdf (Accessed November 18, 2024).
IOCCG (2009). Remote sensing in fisheries and aquaculture. Dartmouth, Canada: International Ocean Colour Coordinating Group. Available online at: https://ioccg.org/wp-content/uploads/2015/10/ioccg-report-08.pdf (Accessed November 18, 2024).
IOCCG (2019a). “IOCCG ocean optics and biogeochemistry protocols for satellite ocean colour sensor validation,” in IOCCG protocol series volume 4.0. Editors A. R. Neeley, and A. Mannino (Dartmouth, NS, Canada: IOCCG). doi:10.25607/OBP-664
IOCCG (2019b). “Protocols for satellite ocean colour data validation: in situ optical radiometry,” in IOCCG ocean optics and biogeochemistry protocols for satellite ocean colour sensor validation, volume 3.0. Editors G. Zibordi, K. J. Voss, B. C. Johnson, and J. L. Mueller (Dartmouth, NS, Canada: IOCCG). doi:10.25607/OBP-691
IOCCG Protocol Series (2018). “Inherent optical property measurements and protocols: absorption coefficient,” in IOCCG ocean optics and biogeochemistry protocols for satellite ocean colour sensor validation, volume 1.0. Editors A. R. Neeley, and A. Mannino (Dartmouth, NS, Canada: IOCCG). doi:10.25607/OBP-119
Jamet, C., Loisel, H., and Dessailly, D. (2012). Retrieval of the spectral diffuse attenuation coefficientKd(λ) in open and coastal ocean waters using a neural network inversion. J. Geophys. Res. Oceans 117 (C10). doi:10.1029/2012JC008076
Jorge, D. S. F., Loisel, H., Jamet, C., Dessailly, D., Demaria, J., Bricaud, A., et al. (2021). A three-step semi analytical algorithm (3SAA) for estimating inherent optical properties over Oceanic, coastal, and inland waters from remote sensing reflectance. Remote Sens. Environ. 263, 112537. doi:10.1016/j.rse.2021.112537
Lee, Z., Carder, K. L., and Arnone, R. A. (2002). Deriving inherent optical properties from water color: a multiband quasi-analytical algorithm for optically deep waters. Appl. Opt. 41 (27), 5755–7572. doi:10.1364/ao.41.005755
Lee, Z., Lubac, B., Werdell, J., and Arnone, R. (2014). Update of the quasi-analytical algorithm (QAA-v6). Available online at: http://www.ioccg.org/groups/Software-OCA/QAA_v6_2014209.pdf (Accessed May 24, 2024).
Lefering, I., Röttgers, R., Utschig, C., and McKee, D. (2017). Uncertainty budgets for liquid waveguide CDOM absorption measurements. Appl. Opt. 56 (22), 6357. doi:10.1364/AO.56.006357
Lefering, I., Röttgers, R., Weeks, R., Connor, D., Utschig, C., Heymann, K., et al. (2016). Improved determination of particulate absorption from combined filter pad and PSICAM measurements. Opt. Express 24 (22), 24805–24823. doi:10.1364/OE.24.024805
Lehmann, M. K., Gurlin, D., Pahlevan, N., Alikas, K., Anstee, J., Balasubramanian, S. V., et al. (2022). Gloria - a global dataset of remote sensing reflectance and water quality from inland and coastal waters. Bremen, Germany: PANGAEA. doi:10.1594/PANGAEA.948492
Lehmann, M. K., Gurlin, D., Pahlevan, N., Alikas, K., Anstee, J., Balasubramanian, S. V., et al. (2023). GLORIA - a globally representative hyperspectral in situ dataset for optical sensing of water quality variables. GLORIA - a globally representative hyperspectral in situ dataset for optical sensing of water quality. Sci. Data 10 (100), 191. doi:10.1038/s41597-023-02069-3
Liu, Y., Röttgers, R., Ramírez-Pérez, M., Dinter, T., Steinmetz, F., Noethig, E.-M., et al. (2018). Underway spectrophotometry in the fram strait (european Arctic Ocean): a highly resolved chlorophyll a data source for complementing satellite ocean colour. Opt. Express 26 (14), A678–A698. doi:10.1364/OE.26.00A678
Liu, Y., Wiegmann, S., and Bracher, A. (2019a). Spectrophotometric measurements of absorption coefficients and optical density by total particles, phytoplankton and non-algal particles during POLARSTERN cruise PS99. Bremen, Germany: PANGAEA. doi:10.1594/PANGAEA.907648
Liu, Y., Wiegmann, S., and Bracher, A. (2019b). Spectrophotometric measurements of absorption coefficients and optical density by total particles, phytoplankton and non-algal particles during POLARSTERN cruise PS107. Bremen, Germany: PANGAEA. doi:10.1594/PANGAEA.907419
Loisel, H., Jorge, D. S. F., Reynolds, R. A., and Stramski, D. (2023). A synthetic optical database generated by radiative transfer simulations in support of studies in ocean optics and optical remote sensing of the global ocean. Earth Syst. Sci. Data 15 (8), 3711–3731. doi:10.5194/essd-15-3711-2023
Loisel, H., Stramski, D., Dessailly, D., Jamet, C., Li, L., and Reynolds, R. A. (2018). An inverse model for estimating the optical absorption and backscattering coefficients of seawater from remote-sensing reflectance over a broad range of Oceanic and coastal marine environments. J. Geophys. Res. Oceans 123, 2141–2171. doi:10.1002/2017JC013632
Loisel, H., Vantrepotte, V., Dessailly, D., and M´eriaux, X. (2014). Assessment of the colored dissolved organic matter in coastal waters from ocean color remote sensing. Opt. Express 22 (11), 13109–13124. doi:10.1364/OE.22.013109
Mannino, A., Novak, M. G., Nelson, N. B., Belz, M., Berthon, J.-F., Blough, N. V., et al. (2019). “Measurement protocol of absorption by chromophoric dissolved organic matter (CDOM) and other dissolved materials, in inherent optical property measurements and protocols: absorption coefficient,” in IOCCG ocean optics and biogeochemistry protocols for satellite ocean colour sensor validation. Editors A. Mannino, and M. G. Novak (Dartmouth, NS, Canada: IOCCG).
Maritorena, S., and Siegel, D. (2005). Consistent merging of satellite ocean color data sets using a bio-optical model. Remote Sens. Environ. 94, 429–440. doi:10.1016/j.rse.2004.08.014
Marra, J., Trees, C. C., and O'Reilly, J. E. (2007). Phytoplankton pigment absorption: a strong predictor of primary productivity in the surface ocean. Deep-Sea Res. Part I 54, 155–163. doi:10.1016/j.dsr.2006.12.001
Mason, J. D., Cone, M. T., and Fry, E. S. (2016). Ultraviolet (250–550 nm) absorption spectrum of pure water. Appl. Opt. 55 (25), 7163–7172. doi:10.1364/AO.55.007163
McKinna, L. I. W., and Werdell, P. J. (2024). Inherent optical properties – version 1. Preprint of manuscript submitted to Earth and space science. Release date: 10 Apr 2024. doi:10.5067/ZGBW3QECROJ2
Mélin, F., and Vantrepotte, V. (2015). How optically diverse is the coastal ocean? Remote Sens. Environ. 160, 235–251. doi:10.1016/j.rse.2015.01.023
Neeley, A. R., Freeman, S. A., and Harris, L. A. (2015). Multi-method approach to quantify uncertainties in the measurements of light absorption by particles. Opt. Express 23 (24), 31043–31058. doi:10.1364/oe.23.031043
Röttgers, R., Bi, S., Burmester, H., Heymann, K., Hieronymi, M., Krasemann, H., et al. (2023). Water inherent optical properties and concentrations of water constituents from the German bight and adjacent regions. Bremen, Germany: PANGAEA. doi:10.1594/PANGAEA.950774
Tilstone, G., Dall'Olmo, G., Hieronymi, M., Ruddick, K., Beck, M., Ligi, M., et al. (2020). Field intercomparison of radiometer measurements for ocean colour validation. Remote Sens. 12 (10), 1587. doi:10.3390/rs12101587
Valente, A., Sathyendranath, S., Brotas, V., Groom, S., Grant, M., Jackson, T., et al. (2022). A compilation of global bio-optical in situ data for ocean-colour satellite applications – version three. Earth Syst. Sci. Data 14 (12), 5737–5770. doi:10.5194/essd-14-5737-2022
Vantrepotte, V., Danhiez, F.-P., Loisel, H., Ouillon, S., Meriaux, X., Cauvin, A., et al. (2015). CDOM-DOC relationship in contrasted coastal waters: implication for DOC retrieval from ocean color remote sensing observation. Opt. Express 23 (1), 33–54. doi:10.1364/OE.23.000033
Werdell, P. J., and Bailey, S. W. (2005). An improved in-situ bio-optical data set for ocean color algorithm development and satellite data product validation. Remote Sens. Environ. 98, 122–140. doi:10.1016/j.rse.2005.07.001
Werdell, P. J., Behrenfeld, M. I., Bontempi, P. S., Boss, E., Cairns, B., Davis, G. T., et al. (2019). The plankton, aerosol, cloud, ocean ecosystem mission: status, science, advances. Bull. Am. Meteorol. Soc. 100, 1775–1794. doi:10.1175/BAMS-D-18-0056.1
Werdell, P. J., Franz, B. A., Bailey, S. W., Feldman, G. C., Boss, E., Brando, V. E., et al. (2013). Generalized ocean color inversion model for retrieving marine inherent optical properties. Appl. Opt. 52, 2019–2037. doi:10.1364/AO.52.002019
Werdell, P. J., and McKinna, L. I. W. (2019). Sensitivity of inherent optical properties from ocean reflectance inversion models to satellite instrument wavelength suites. Front. Earth Sci. 7, 54. doi:10.3389/feart.2019.00054
Werdell, P. J., McKinna, L. I. W., Boss, E., Ackleson, S. G., Craig, S. E., Gregg, W. W., et al. (2018). An overview of approaches and challenges for retrieving marine inherent optical properties from ocean color remote sensing. Prog. Oceanogr. 160, 186–212. doi:10.1016/j.pocean.2018.01.001
Zhang, X., Hu, L., and He, M.-X. (2009). Scattering by pure seawater: effect of salinity. Opt. Express 17 (7), 5698–5710. doi:10.1364/oe.17.005698
Keywords: satellite ocean colour, validation, inherent optical properties, absorption coefficient, phytoplankton, coloured dissolved organic matter, Sentinel-3 OLCI, in situ measurements
Citation: Bracher A, Banks AC, Xi H, Dessailly D, Gossn J, Lebreton C, Röttgers R, Kwiatkowska E, Chaikalis S, Mehdipour E, Pitta E, Soppa MA, Wevers J and Zeri C (2025) Assessment of OLCI absorption coefficients for non-water components across all optical water classes. Front. Remote Sens. 6:1545664. doi: 10.3389/frsen.2025.1545664
Received: 15 December 2024; Accepted: 08 July 2025;
Published: 20 August 2025.
Edited by:
Wenhan Qin, Science Systems and Applications Inc., United StatesReviewed by:
Shaohua Lei, Nanjing Hydraulic Research Institute, ChinaVioleta Sanjuan Calzado, National Aeronautics and Space Administration (NASA), United States
Copyright © 2025 Bracher, Banks, Xi, Dessailly, Gossn, Lebreton, Röttgers, Kwiatkowska, Chaikalis, Mehdipour, Pitta, Soppa, Wevers and Zeri. This is an open-access article distributed under the terms of the Creative Commons Attribution License (CC BY). The use, distribution or reproduction in other forums is permitted, provided the original author(s) and the copyright owner(s) are credited and that the original publication in this journal is cited, in accordance with accepted academic practice. No use, distribution or reproduction is permitted which does not comply with these terms.
*Correspondence: Astrid Bracher, YXN0cmlkLmJyYWNoZXJAYXdpLmRl