 N. Le Bouffant
 L. Berger
 R. Fezzani
- Underwater Acoustics Laboratory, Institut Francais de Recherche pour l’Exploitation de la Mer, Plouzane, France
Introduction: In recent years, methods have been developed to calibrate seafloor backscatter measurements from hydrographic multibeam echosounders. Some of these methods involve the use of well-characterized reference areas that consistently exhibit stable backscatter levels over the years. This study investigates the potential of measuring seafloor backscatter over such a known stable area with vertical single beam echosounders, to provide a straightforward monitoring of their calibration.
Methods: We propose a methodology for calculating standard seafloor surface backscattering at normal incidence, utilizing the standard volume backscattering echo-integration technique commonly used in fishery echosounders, which is also applicable to wideband frequency modulation (FM) transmissions. We explain how this technique compares to the typical multibeam echosounder computation, which is based on samples of maximum amplitude.
Results: The operational accuracy of seafloor backscatter measurements taken over a known stable area is presented, with data collected over several years from various single-beam systems primarily calibrated using the sphere method.
Discussion: The repeatability of the results suggests that such natural seafloor reference areas can serve as a secondary calibration reference for quickly monitoring single-beam echosounders, through a straightforward acquisition and processing approach. While this method may not provide access to all the echosounder features controlled by sphere calibration, it can be used to adjust standard volume and surface backscattering measurements.
1 Introduction
Reliable quantitative measurement of acoustic backscatter levels is essential for single-beam echosounders used in applications such as fishery stock assessment surveys (Simmonds et al., 2007). As equipment is subject to manufacturing variability, aging, and changes in performance due to environmental factors like temperature and pressure (Demer, D. A. et al., 2015; Demer and Renfree, 2008) a backscatter calibration procedure must be performed before any acquisition that involves quantitative analysis of acoustic backscatter levels. This calibration process corrects possible bias in quantitative data collected by the echosounders and ensures their performance and proper functioning. Any significant change in echosounder calibration parameters, if not related to environmental conditions such as temperature, indicates a change in the equipment. This change could be gradual due to aging, as shown in (Knudsen, 2009), or could signal more severe malfunctions, such as transducer damage or failure of electronic components. Decisions regarding whether to maintain, repair, or replace the echosounder depend on the expected impact on its performance.
A standard method for performing calibration is the sphere calibration protocol, which involves comparing Target Strength measurements obtained from a metallic reference sphere placed at a known distance from the echosounder to the theoretical value (Demer, D. A. et al., 2015). Scientific echosounders, such as the Simrad EK80, include a built-in calibration program that acquires sphere target data, calculates calibration offsets, and provides an evaluation of measurement accuracy.
Carrying out this procedure at sea for vessel-mounted echosounders requires a suitable anchoring area and favorable environmental conditions, including sufficient water depth, sheltered area with calm seas, low wind speed and low currents. Operating on large platforms may require dedicated poles and winches to manage the suspension lines for the sphere (Demer, D. A. et al., 2015). The complete operation can take several hours, depending on the number of echosounders and modes of operation to be calibrated.
Meeting these operational requirements, especially during an ongoing survey, is challenging, and the process becomes even more burdensome if calibration quality is found to be poor when environmental conditions are not optimal, requiring the protocol to be repeated at a later time. This situation can arise when large variability in the sphere measurements is observed, as indicated by a high standard deviation of the measured target strength, which is a quality factor provided by the EK80 calibration program. Values exceeding 0.4 dB are generally regarded as unsatisfactory, particularly if they are associated with suspicious parameter outputs, such as for beam opening angles, acoustic axis offsets, or gain values.
Given the operational constraints of the sphere calibration protocol and the benefits of regular calibration checks, it would be highly advantageous to have a cost-effective and convenient method for secondary checks on echosounder calibration. Zhu et al. (2024) used seafloor backscatter along specific transects to intercalibrate fishing echosounders with sphere-calibrated echosounders. A more general approach is developed here that uses specific seafloor areas as reference calibration targets, similar to methods proposed for backscatter calibration of hydrographic multibeam echosounders (Eleftherakis et al., 2018). Sphere calibration can be difficult for these systems due to their large transversal swath and the lack of a method to locate targets in the along-ship direction. However, multibeam systems can readily provide seafloor backscatter, which naturally leads to the search for seafloor areas that could serve as appropriate reference calibration targets. These areas must have specific geomorphological characteristics to be suitable for calibration (Roche et al., 2018), such as stability over time, homogeneity, isotropism, flat bathymetry, and accessibility (ideally near regular vessel routes). Most importantly, they must exhibit stable surface backscattering over various time scales, including daily, seasonal, and annual periods. Reference surface backscattering for such areas can be initially established using a calibrated EK80, with appropriate frequencies and different tilt angles, as described in (Eleftherakis et al., 2018; Ladroit et al., 2018). These calibrated values are then compared to multibeam echosounder measurements, which can be adjusted to fit the reference values.
An area with these characteristics is presented in (Roche et al., 2018), and its potential for the proposed single-beam quick calibration check is explored here, based on data observed over several years, across different systems and frequencies. A method for extracting seafloor surface backscattering values from the EK80 output is detailed in (Eleftherakis et al., 2018) similar to the procedure used for hydrographic multibeam systems. An alternative processing approach is also proposed here, which estimates the same surface backscattering physical quantity using the native EK80 volume backscattering strength output, and the typical echo-integration processing used for fish abundance estimation. This allows the use of existing processing tools to provide seafloor surface backscattering measurements that can be compared against the reference area data.
2 Materials and methods
2.1 Study area
The reference area used to investigate the accuracy of the EK80 calibration secondary check is Carré Renard, located in the Bay of Brest (Figure 1). The water depth is approximately 20 m, varying with tides. The bathymetry is generally flat, with variations less than 1 m over the 0.5 km2 surface area. Features analyzed in (Roche et al., 2018) indicate that the substrate consists of relatively rough sediment composed of coarse sand and gravel within a mud matrix, mixed with larger elements such as pebbles and shells (Figure 2). The area is home to a population of small echinoderms.
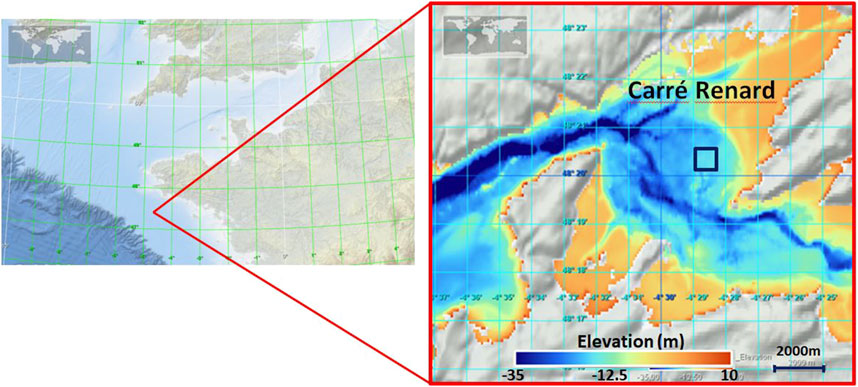
Figure 1. Location of Carré Renard reference area in the Grande Rade de Brest (France). Central coordinates of the area: 48°20.419′N–4°28.770′W. Background: EMODnet bathymetry (Thierry et al., 2019).
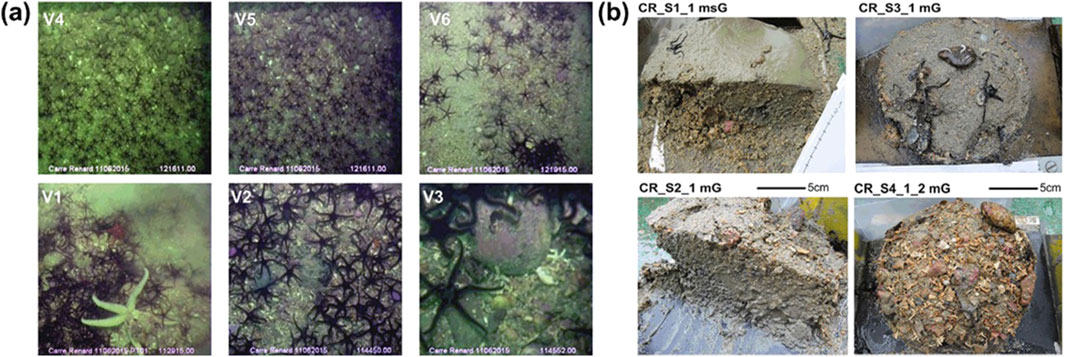
Figure 2. Carré Renard ground-truth observations from the RV Belgica cruise #2015/16, 11 June 2015. (a) Video images (variable scale, Ophiocomina nigra rigid central disc diameter = 2–3 cm). (b) Reineck box-corer samples. Excerpt from (Roche et al., 2018) Figure 4, used with permission from the authors.
Extensive acoustic multibeam surveys analyzed in (Roche et al., 2018) demonstrated that the seafloor surface backscattering strength is homogeneous across the area, independent of transect direction, and stable over the years. Surveys were confined to a 0.5NM x 0.5NM area, centered at 48°20.419′N–4°28.770′W, with preferential transects oriented East-West or North-South, focusing on the central region.
2.2 Single beam echosounders
The repeatability of seafloor surface backscatter measurements obtained using different calibrated single-beam echosounders has been analyzed through a series of acquisitions conducted over several years, frequencies, and pulse durations, as detailed in Table 1. Earlier surveys were carried out with Simrad EK60 single-beam echosounders using General Purpose Transceivers (GPT) electronics. More recent surveys utilized EK80 Wide Band Transceivers (WBT) electronics (Demer, D. A. et al., 2017). All acquisitions were performed with downward-looking echosounders using continuous wave (CW) transmission pulses and were previously calibrated according to the sphere calibration protocol. Details of the systems and calibration values can be found in the Supplementary Material.
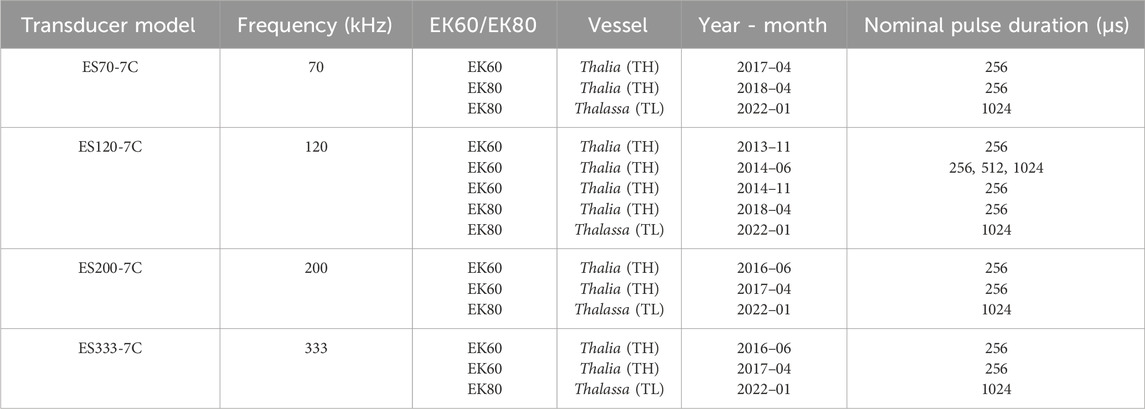
Table 1. Surveys and echosounders characteristics. All transducers have 7° circular one-way beamwidth.
2.3 Seafloor backscatter computation
Depending on the physical nature of the target (single reflector, surface, or volume), different physical backscatter indices can be calculated: single target strength, surface backscattering strength, and volume backscattering strength (Lurton, 2010). These three indices characterize the ratio of the acoustic power backscattered per steradian by the target, relative to the incident acoustic intensity. The latter two indices are compensated for the backscattering surface or volume that contributed to the backscattered signal. Therefore, calculating these quantities requires modelling the surface or volume of the reflectors that contributed to the acoustic power received by the echosounder at a given time.
In this context, we consider the seafloor as a surface reflector and the main contributor to backscatter during seabed echo reception, while neglecting the volume backscatter potentially generated by water column echoes or sub-bottom penetration.
By analyzing the acoustic signal received over time by a downward-looking single-beam echosounder over a flat seafloor, we observe that the extent of the bottom echo corresponds to different parts of the seafloor that successively reflect the propagated pulse (Lurton, 2010). The surface area of the elements reflecting the acoustic pulse must also be weighted by the corresponding acoustic beam shape.
When the contributing reflectors are initially located in the water column, the echo level is weak (Figure 3a). The echo level increases as the transmitted pulse reaches the seafloor (Figure 3b) and continues to grow as the surface intercepted by the pulse expands (Figure 3c), convolved with the beam directivity (Figure 4A). Once the pulse footprint becomes an annular shape (Figure 3d) and extends beyond the main lobe of the sounder (Figure 3e), the backscattered signal begins to decrease. Figure 4B presents a typical single-beam echogram including the bottom echo. The successive data levels corresponding to the subsets described in Figure 3 are highlighted in Figure 4C on a single echogram slice.
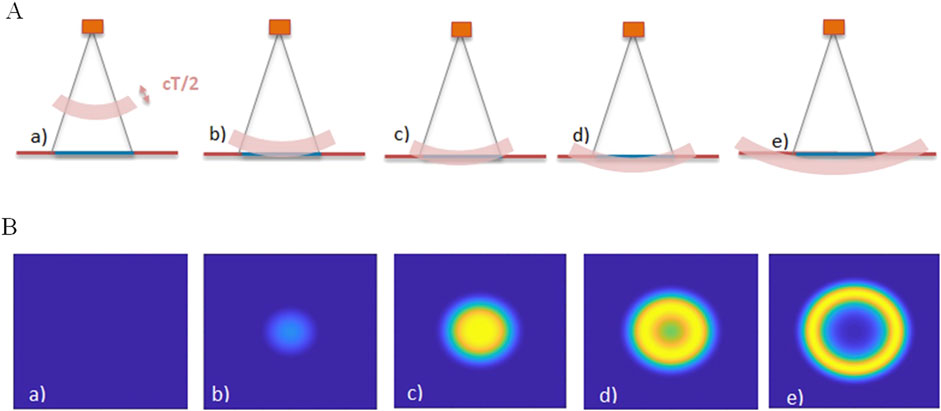
Figure 3. (A) Physical extent of a transmitted pulse of duration T, propagating through time. (B) Seafloor reflectors contributing to backscattered signal through time, weighted with the pulse amplitude. Successive footprints correspond to a) to e) situations shown in Figure 3A. Combination with beam directivity (Figure 4A) is not represented in these figures.
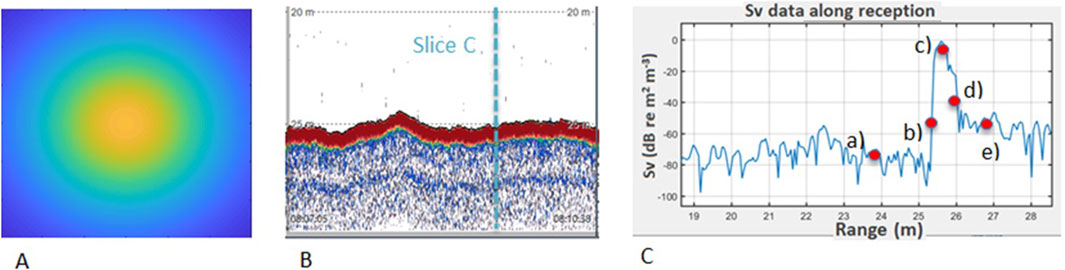
Figure 4. Beam directivity projected on the seafloor (A), EK80 echogram (B), EK80 reception signal for transmission (C), with echo levels corresponding to a) to e) situations shown in Figure 3.
To extract the seafloor backscatter index, various options can be considered depending on the time sample and the surface contributors selected for computation. Based on this choice, the level of the selected sample will vary, along with the associated insonified surface; however, the process should yield the same surface backscattering strength if properly compensated. Two approaches are presented in the following sections.
Note that the term seafloor surface backscattering strength (dB re 1 m2 m-2) is used here in accordance with the definitions, notation, and units provided by (Demer et al., 2015) in the context of acoustic instrument calibration, ensuring consistency with the volume backscattering strength also defined therein. The symbol
2.4 Seafloor surface backscattering strength computation from maximum echo level (MAX
A common method used by hydrographic multibeams to determine seafloor surface backscattering in the case of normal incidence, when the bottom echo is brief and strong, is to determine the time and intensity of the maximum echo level (Hammerstad, 2000). It is assumed that the contributing seafloor reflectors correspond to the projection of the beam’s main lobe, fully covered by the effective pulse footprint (Figure 3c).
Since the EK80 acquisition software natively provides the volume backscattering strength
With:
-
-
-
It is commonly assumed that the surface corresponding to the maximum backscattered level at normal incidence represents the effective beam footprint, given by
This expression implies that the beam footprint is fully ensonified by the transmitted pulse. However, specific cases may arise where the transmitted pulse is too short to fully cover at once the entire beam footprint or the seafloor roughness, resulting in an effective ensonified area that is smaller than expected. These situations are further discussed in Section 4.4.
2.5 Seafloor surface backscattering strength computation from echo-integration over bottom echo (EI
Another approach to calculating seafloor backscatter involves considering all the samples corresponding to the bottom echo. As with the previous method, we assume that the surface backscattering coefficient is constant within the beam footprint and equal to
For a bottom echo sample at time
Where:
-
-
-
If we integrate
For every
Changing integration variable from time to range, with
With
For beamwidth of a few degrees, the seafloor echo length remains brief, and the range
In other words, area backscattering strength
This approach to compute seafloor
Initial volume backscatter data (
3 Results
We applied the echo-integration (EI
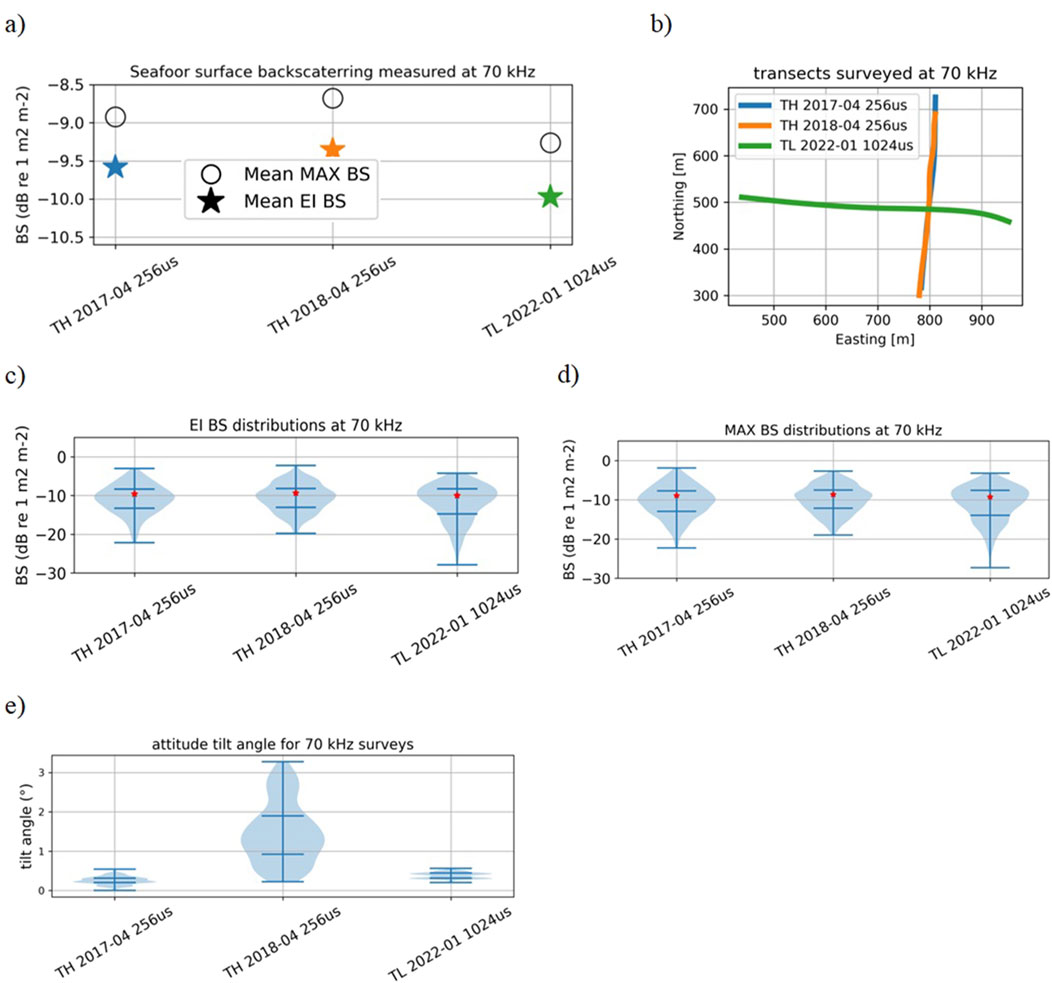
Figure 5. Results for 70 kHz surveys: (a) Mean
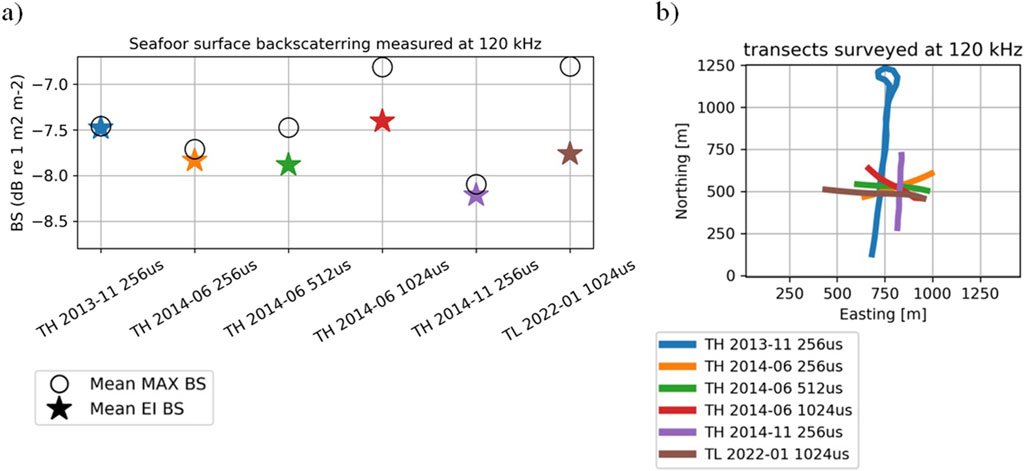
Figure 6. Results for 120 kHz surveys: (a) Mean
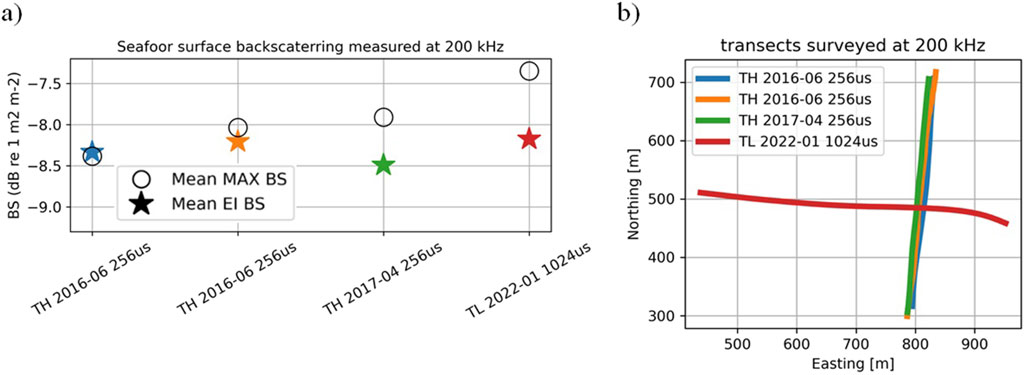
Figure 7. Results for 200 kHz surveys: (a) Mean
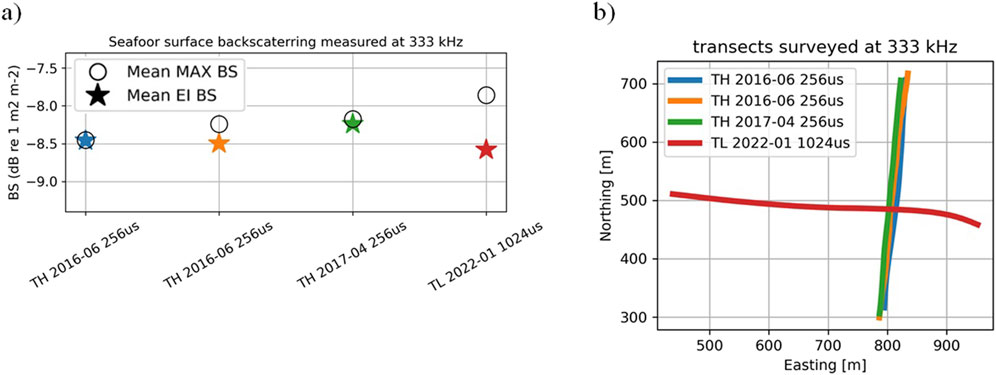
Figure 8. Results for 333 kHz surveys: (a) Mean
The stability of seafloor backscatter values on Carré Renard over the period 2013–2022, computed using the EI approach, is within 0.7 dB for the 70 kHz and 120 kHz echosounders. The stability of EI backscatter is better for higher frequencies (200 kHz and 333 kHz), varying by 0.3 dB.
The MAX
4 Discussion
Carré Renard is an area that has been found to remain stable over the years (Roche et al., 2018). Measurements of seafloor
4.1 Impact of initial calibration accuracy
The echosounders had been initially calibrated using the sphere method, but it is challenging to determine how much of the final
While it is difficult to separate calibration accuracy from seafloor backscatter stability, it can be stated that these two variables are independent. Their effects are summed in the seafloor
Beyond calibration accuracy, other factors that can impact backscatter measurements are further discussed.
4.2 Impact of attitude
The influence of platform movements during data acquisition on backscatter values can be questioned, as the seafloor backscatter index depends on the incident angle (Lurton, 2010; Kloser et al., 2010), as well as the insonified area (Lurton, 2010).
The seafloor is a directional reflector, and
A second impact arises from the surface area of the reflectors contributing to acoustic reflection, which affects the backscatter level. The
During the different surveys, echosounder attitudes remained within ±2° for 75% of the data, and no significant impact is expected based on the phenomena described above.
The “TH 2018 256µs” survey showed much greater attitude dispersion than the “TH 2017 256µs” survey (Figure 5e), but the BS distributions, whether using the EI or MAX extraction methods, were similar for both surveys (Figures 5c,d for EI BS and MAX BS, respectively).
Seafloor backscatter measurements from the “TH 2018 256µs” rolling acquisition line were further averaged within 0.2° attitude intervals, and Figure 9 shows no noticeable trend with the attitude angle.
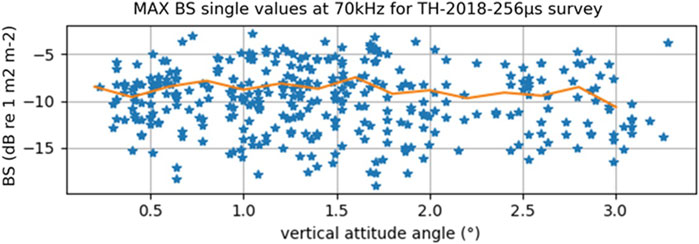
Figure 9. MAX
Further processing could be applied to adjust the insonified area computation based on attitude or simply filter out data with attitudes deviating from the vertical. However, since the impact of attitude is found to be minimal, we have kept the processing as simple as possible. This approach is straightforward to implement, using the standard echo-integration method, which is available in various single-beam echosounder analysis software, such as Echoview, ESP3, Matecho, LSSS, and Movies (González-Máynez et al., 2024).
4.3 Impact of frequency
The stability of the seafloor
4.4 Seafloor surface backscatter: EI versus MAX computations
Seafloor
Based on these results, an operational recommendation for setting the echo-integration layer would be to maintain a 1-m margin above the detected bottom to avoid overreliance on the precision of bottom detection, and to ensure the layer fully encompasses the bottom echo, whose width varies with pulse length, beam width, depth, and seafloor characteristics.
Beyond the statistical impact of the processing chain, both MAX and EI approaches do not reflect the exact same physical phenomena nor imply same echosounder features. The EI method uses all the samples involved in the seafloor echo, potentially giving more weight to the volume backscattering component associated with sub-bottom penetration. The MAX method, on the other hand, decompensates the effective pulse duration
The MAX
It is worth noting that 1,024 µs pulses show higher MAX
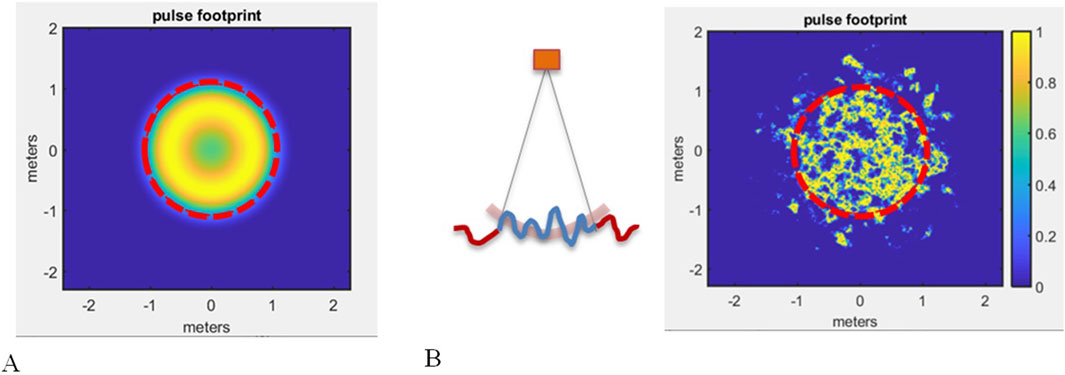
Figure 10. Cases where beam footprint is never fully insonified by the acoustic pulse: (A)- The 64µs pulse with sin2 shaping becomes annulus before covering a 5° two-way beam lobe at 25m depth (dashed). (B)- The 64µs pulse is too short to insonify at once a surface with 5 cm micro-bathymetry.
The distribution and variability of individual
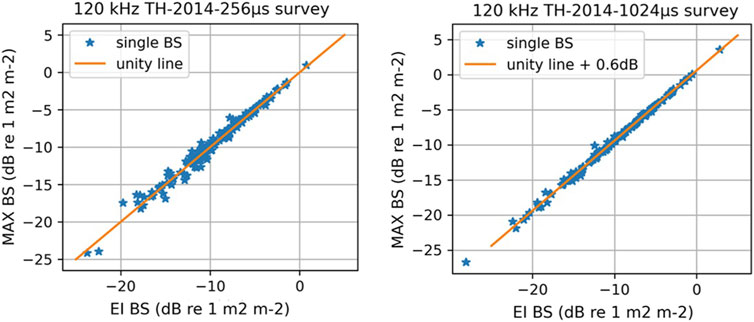
Figure 11. Comparison of single
4.5 Wideband FM seafloor backscatter spectrum through echo-integration
A significant benefit of the echo-integration approach is that it allows for a direct estimation of the spectral seafloor backscattering coefficient
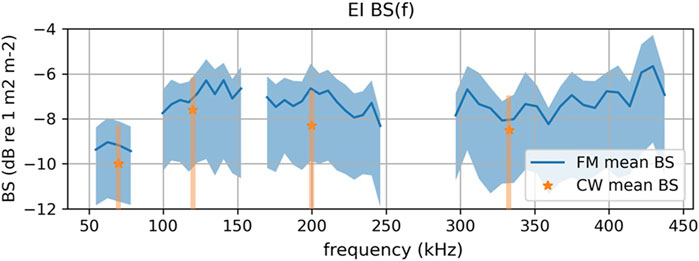
Figure 12. Seafloor backscatter spectrum over Carré Renard obtained through bottom echo-integration in FM mode, and comparison with EI
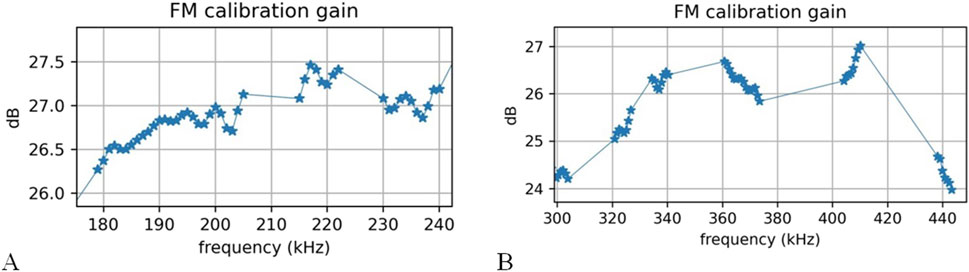
Figure 13. Calibration gains measured on 38.1 mm Tungsten sphere in ES200-7C (A) and ES333-7C (B) bandwidths.
4.6 Calibration monitoring over reference area and sphere calibration
The proposed method for measuring reference seafloor backscatter is not intended to replace a thorough sphere calibration protocol. The latter provides essential individual characteristics of the echosounder, such as on-axis gain, effective pulse duration, and the 2D beam pattern. These parameters are mandatory for applying the sonar equation and obtaining quantitative measurements of reflecting targets. The calibration check through seafloor
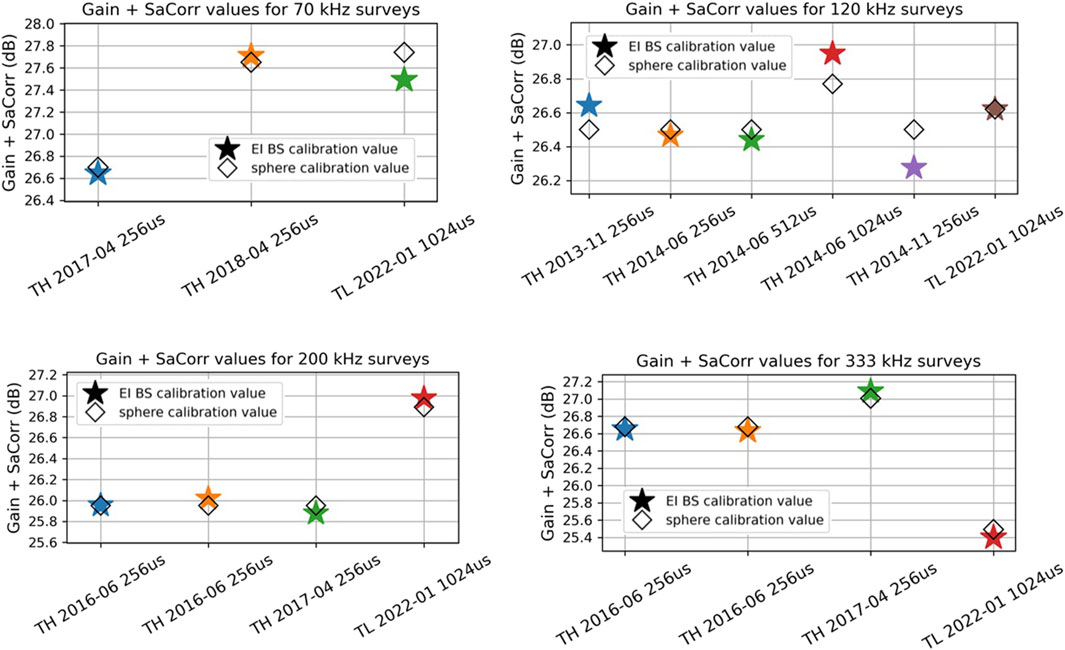
Figure 14.
For these reasons, sphere calibration is recommended for full equipment validation after its initial integration onto a platform, or before undertaking a critical survey requiring reliable quantitative acoustic measurements, such as fishery stock assessment surveys. However, regularly surveying an appropriate transect and measuring its seafloor surface backscattering offers an easy way to quickly monitor the equipment’s stability. This rapid check can also enhance confidence in the sphere-based calibration parameters used, particularly if, due to circumstances such as adverse weather conditions, the sphere calibration quality or results were unsatisfactory and could not be repeated. This method is also straightforward for ensuring consistent data comparison with different platforms. For instance, this assurance is crucial when conducting vessel intercalibration processes (De Robertis and Handegard, 2013) to assess the impact of target avoidance by the platform. Finally, this approach can serve as an alternative for correcting quantitative acquisitions when sphere calibrations cannot be performed due to logistical or time constraints, especially when using multiple opportunistic platforms like commercial fishing vessels, or when the involved single-beam echosounders lack split-beam capabilities.
We illustrate in Figure 14 the calibration results that would be extracted for each echosounder through the different surveys, using seafloor surface backscattering measured over Carré Renard, and we compare it to parameters obtained with sphere calibration. To do so we assume that the Carré Renard reference seafloor backscattering value,
Gain and
4.7 Determination and use of reference seafloor transect
Unlike sphere calibration, where reference Target Strength is ensured by the physical characteristics of the target (such as its dimensions and material), reference seafloor surface backscattering is established using primary acoustic measurements from calibrated echosounders. If the
When selecting a reference transect, it is also recommended to perform a full bathymetric survey of the surrounding area, with different line orientations, to ensure the homogeneity of seafloor backscattering, the absence of any orientation dependence of backscatter related to microbathymetry (Lurton et al., 2018), and the flatness of the topography.
When monitoring echosounder calibration over an established reference line, if the
5 Conclusion
This paper explored the possibility of quickly monitoring the calibration of vertical single-beam echosounders by regularly acquiring seafloor surface backscattering data over a reference area, such as Carré Renard. Time series of acquisitions conducted with different equipment and frequencies showed that this method is an effective way to monitor the validity of echosounder measurements within an interval of better than 1 dB.
The paper proposed using the widely employed volume backscattering echo-integration process, performed on bottom echoes, to compute the seafloor surface backscattering
By leveraging existing echo-integration tools commonly used in fishery acoustics, this method also facilitates the straightforward measurement of the seafloor backscatter spectrum
While
Data availability statement
The original contributions presented in the study are included in the article/Supplementary Material, further inquiries can be directed to the corresponding author.
Author contributions
NL: Conceptualization, Data curation, Formal Analysis, Investigation, Methodology, Validation, Writing – original draft, Writing – review and editing. LB: Investigation, Supervision, Writing – review and editing. RF: Writing – review and editing.
Funding
The author(s) declare that no financial support was received for the research and/or publication of this article.
Acknowledgments
We thank the reviewers involved in this submission and in a previous attempt for their encouragement and constructive comments, which have greatly contributed to improving the manuscript and bringing it to publication standards.
Conflict of interest
The authors declare that the research was conducted in the absence of any commercial or financial relationships that could be construed as a potential conflict of interest.
Generative AI statement
The author(s) declare that Generative AI was used in the creation of this manuscript. ChatGPT was used to correct english writing occasionnaly, from already written sentences. No result, no method, nor any analysis was extracted from generative AI.
Publisher’s note
All claims expressed in this article are solely those of the authors and do not necessarily represent those of their affiliated organizations, or those of the publisher, the editors and the reviewers. Any product that may be evaluated in this article, or claim that may be made by its manufacturer, is not guaranteed or endorsed by the publisher.
Supplementary material
The Supplementary Material for this article can be found online at: https://www.frontiersin.org/articles/10.3389/frsen.2025.1549238/full#supplementary-material
References
Demer, D. A., Andersen, L. N., Bassett, C., Berger, L., Chu, D., Condiotty, J., et al. (2017). USA–Norway EK80 Workshop Report: evaluation of a wideband echosounder for fisheries and marine ecosystem science. ICES Coop. Res. Re-port No. 336. doi:10.17895/ices.pub.2318
Demer, D. A., Berger, L., Bernasconi, M., Bethke, E., Boswell, K., Chu, D., et al. (2015). Calibration of acoustic instruments (report). ICES Coop. Res. Rep. (CRR). doi:10.17895/ices.pub.5494
Demer, D. A., and Renfree, J. S. (2008). Variations in echosounder–transducer performance with water temperature. ICES J. Mar. Sci. 65, 1021–1035. doi:10.1093/icesjms/fsn066
De Robertis, A., and Handegard, N. O. (2013). Fish avoidance of research vessels and the efficacy of noise-reduced vessels: a review. ICES J. Mar. Sci. 70, 34–45. doi:10.1093/icesjms/fss155
Eleftherakis, D., Berger, L., Le Bouffant, N., Pacault, A., Augustin, J.-M., and Lurton, X. (2018). Backscatter calibration of high-frequency multibeam echosounder using a reference single-beam system, on natural seafloor. Mar. Geophys Res. 39, 55–73. doi:10.1007/s11001-018-9348-5
González-Máynez, V. E., Morales-Bojórquez, E., Nevárez-Martínez, M. O., and Villalobos, H. (2024). Application of fisheries acoustics: a review of the current state in Mexico and future perspectives. Fishes 9, 387. doi:10.3390/fishes9100387
Jackson, D. R., and Richardson, M. D. (2007). High-frequency seafloor acoustics. New York, NY: Springer. doi:10.1007/978-0-387-36945-7
Kloser, R. J., Penrose, J. D., and Butler, A. J. (2010). Multi-beam backscatter measurements used to infer seabed habitats. Cont. Shelf Res. 30, 1772–1782. doi:10.1016/j.csr.2010.08.004
Knudsen, H. P. (2009). Long-term evaluation of scientific-echosounder performance. ICES J. Mar. Sci. 66, 1335–1340. doi:10.1093/icesjms/fsp025
Ladroit, Y., Lamarche, G., and Pallentin, A. (2018). Seafloor multibeam backscatter calibration experiment: comparing 45°-tilted 38-kHz split-beam echosounder and 30-kHz multibeam data. Mar. Geophys Res. 39, 41–53. doi:10.1007/s11001-017-9340-5
Lurton, X. (2010). “An introduction to underwater acoustics: principles and applications,” in Springer-Praxis books in geophysical sciences. Second edition. Berlin Heidelberg Dordrecht London New York: Springer.
Lurton, X., Eleftherakis, D., and Augustin, J.-M. (2018). Analysis of seafloor backscatter strength dependence on the survey azimuth using multibeam echosounder data. Mar. Geophys Res. 39, 183–203. doi:10.1007/s11001-017-9318-3
Lurton, X., Lamarche, G., Brown, C., Lucieer, V., Rice, G., Schimel, A., et al. (2015). Backscatter measurements by seafloor-mapping sonars - guidelines and Recommendations. pymovies_3d. Available online at: https://gitlab.ifremer.fr/fleet/movies/pymovies_3d.
Renfree, J. S., Andersen, L. N., Macaulay, G., Sessions, T. S., and Demer, D. A. (2020). Effects of sphere suspension on echosounder calibrations. ICES J. Mar. Sci. 77, 2945–2953. doi:10.1093/icesjms/fsaa171
Roche, M., Degrendele, K., Vrignaud, C., Loyer, S., Le Bas, T., Augustin, J.-M., et al. (2018). Control of the repeatability of high frequency multibeam echosounder backscatter by using natural reference areas. Mar. Geophys Res. 39, 89–104. doi:10.1007/s11001-018-9343-x
Simmonds, J., and Maclennan, D. N. (2007). Fisheries acoustics: theory and practice: second edition. Fisheries acoustics. Theory Pract. Second Ed., 1–252. doi:10.1002/9780470995303
Thierry, S., Dick, S., George, S., Benoit, L., and Cyrille, P. (2019). “EMODnet Bathymetry a compilation of bathymetric data in the European waters,” in Oceans 2019 - marseille. Presented at the OCEANS 2019 - marseille, 1–7. doi:10.1109/OCEANSE.2019.8867250
Weber, T. C., and Ward, L. G. (2015). Observations of backscatter from sand and gravel seafloors between 170 and 250 kHz. J. Acoust. Soc. Am. 138, 2169–2180. doi:10.1121/1.4930185
Keywords: sphere calibration, seafloor backscatter, echo-integration, seafloor reference area, EK80, wideband transmissions
Citation: Le Bouffant N, Berger L and Fezzani R (2025) Using seafloor echo-integrated backscatter for monitoring single beam echosounder calibration. Front. Remote Sens. 6:1549238. doi: 10.3389/frsen.2025.1549238
Received: 20 December 2024; Accepted: 08 May 2025;
Published: 21 May 2025.
Edited by:
Alexandre Carmelo Gregory Schimel, Geological Survey of Norway, NorwayReviewed by:
Elias Fakiris, Independent Researcher, Patras, GreeceThomas Weber, Mitre, United States
Copyright © 2025 Le Bouffant, Berger and Fezzani. This is an open-access article distributed under the terms of the Creative Commons Attribution License (CC BY). The use, distribution or reproduction in other forums is permitted, provided the original author(s) and the copyright owner(s) are credited and that the original publication in this journal is cited, in accordance with accepted academic practice. No use, distribution or reproduction is permitted which does not comply with these terms.
*Correspondence: N. Le Bouffant, bmFpZy5sZS5ib3VmZmFudEBpZnJlbWVyLmZy