 Marc Roche
1*
Marc Roche
1*
 Tor Inge Birkenes Lønmo
2
Tor Inge Birkenes Lønmo
2
 Ridha Fezzani
3
Ridha Fezzani
3
 Laurent Berger
3
Laurent Berger
3
 Samuel Deleu
4
Samuel Deleu
4 Hervé Bisquay5
 Arnaud Gaillot
3
Arnaud Gaillot
3
 Kris Vanparys
4Jan Vercaemst4
Kris Vanparys
4Jan Vercaemst4
 Koen Degrendele
1Florian Barette1
Koen Degrendele
1Florian Barette1
 Luciano Emidio Fonseca
6Johan Verstraeten4Kjell Echholt Nilsen3
Luciano Emidio Fonseca
6Johan Verstraeten4Kjell Echholt Nilsen3
 Giacomo Montereale-Gavazzi
7,8
Giacomo Montereale-Gavazzi
7,8
 Xavier Lurton
9
Xavier Lurton
9
 Jean-Marie Augustin
10
Jean-Marie Augustin
10
- 1 Federal Public Service Economy, Continental Shelf Service, Brussels, Belgium
- 2 Kongsberg Discovery, Horten, Norway
- 3 Ifremer, Centre de Brest, France
- 4 Flemish Hydrography, Agency for Maritime and Coastal Services, Oostende, Belgium
- 5 Genavir, Brest, France
- 6 Department of Electronic Engineering, Universidade de Brasilia (UnB), Brasilia, Brazil
- 7 European Commission, Joint Research Centre (JRC), Ispra, Italy
- 8 Royal Belgian Institute of Natural Sciences, Operational Directorate of Nature, Brussels, Belgium
- 9 Independent Consultant, Locmaria-Plouzané, France
- 10 Independent Consultant, Brest, France
Multibeam echosounder Backscatter Strength (BS) measurement is a pivotal tool for seabed mapping and monitoring. However, its effective utilization is contingent upon the resolution of challenges such as environmental influences, calibration and repeatability. Natural reference areas offer a pragmatic solution by providing a reliable foundation for backscatter quality control and calibration, ensuring data consistency over time. Recent measurements conducted on the Kwinte reference area (Belgian part of the North Sea) have revealed a significant correlation between measured BS and seawater temperature. This correlation is corroborated by other measurements carried out on the Carré Renard reference area (Bay of Brest, France) and in-tank (by Kongsberg Discovery, Horten, Norway). Significant measured level shifts were currently observed (up to 4 dB per 10°C), depending on signal frequency and angle, and described either as global level shifts or as directivity pattern distortions. Given the negligible impact of sound absorption through the water column, the level-temperature dependence assessed here is regarded as a sensor artifact. This finding underscores a heretofore unrecognized source of MBES-measured level variability. This instrumental temperature-dependence is attributable to variations in the properties of the materials constituting transducers and in their acoustic interaction, which, in turn, affect the sensitivity and directivity of the arrays and influence measured levels. A simple sound-speed-dependent description of in-transducer refraction offers an explanation for these effects but does not fully account for the observed changes in directivity patterns. Hence, it is necessary to consider complex models accounting for material interactions, transducer properties and coupling, and individual calibration. However, these models are challenging to build and implement comprehensively. A systematic cross-calibration during each measurement campaign is considered as a means to account for this variability. This pragmatic approach is demonstrated through its application to a short time series dataset, showcasing its benefits. This research advances key priorities in the concerned scientific community by enhancing the accuracy and reliability of BS as a seabed sediment indicator and refining cross-calibration over natural reference areas. It also advocates for the systematic use of backscatter measurements in marine resource management and habitat monitoring.
1 Introduction, context and objectives
With their ability to simultaneously collect bathymetric and Backscatter Strength (BS) data alongside high operational efficiency, multibeam echo sounders (MBESs) have become widely used for studying the structure and composition of the seabed. Notably, the use of MBES-measured BS has emerged as a cornerstone in benthic habitat mapping. When radiometric and geometric corrections are properly applied (Schimel et al., 2018), BS is a well-established indicator or proxy contributing to the characterization of seabed sediment properties, such as grain size, texture, and roughness, across extensive marine areas (Amiri-Simkooei et al., 2019; Briggs et al., 2005; Chotiros et al., 1997; Costa, 2019). In various marine environments, BS may be employed to classify sediment types, ranging from fine silt to gravel, to identify seabed habitats (Arifah et al., 2023; Brown and Blondel, 2009; Gaida, 2020; Mopin et al., 2024; Montereale-Gavazzi, 2019) and has proven effective in differentiating sediment textures (Feldens et al., 2018; Ferrini and Flood, 2006). Overall, BS is positively correlated with grain size, with coarser sediments typically reflecting stronger signals due to their high acoustic impedance and increased interface roughness (Chotiros et al., 1997; Goff et al., 2000). Additionally, discrete objects such as shells can significantly influence backscatter levels (Stanic et al., 1989; Stanton et al., 2000; Fonseca et al., 2021).
A key point in the physics of seafloor is the angle dependence of the measured BS; while the general trend (monotonically decreasing from vertical to grazing angles) is most often observed, the contrast between the specular echo around nadir, the plateau at moderate incidence angle and the fall-off rate at grazing angles is a powerful descriptor of the local seabed properties: a flat mirror-like interface generates a distinctive narrow specular echo even for low impedance contrasts and a strong fall-off at oblique angles; a high interface roughness (with reference to the acoustic wavelength) causes a high backscatter level with a weak angle dependence; and in-sediment penetration of the sonar signal raises a volumic backscatter component that may compete with the interface one at intermediate oblique angles (Novarini and Caruthers, 1998). In this perspective, MBESs are a naturally suitable tool in the sense that they readily give access to the angle dependence of measured BS; this capability has been recognized early in the development of MBES systems (de Moustier, 1986) and widely used since then (Lurton et al., 2015).
Over the past two decades, there have been notable advancements in the field of benthic habitat mapping and sediment characterization, largely due to the advent of multi-frequency MBESs. Combining low frequencies, which reveal subsurface layers, with high frequencies, which provide detailed surface features, allows for enhanced seabed discrimination (Hughes Clarke, 2015; Gaida et al., 2019; Fezzani et al., 2021). The incorporation of multispectral data enhances the capacity of BS values to discriminate and facilitate the identification of habitats in diverse marine environments that are subject to seasonal variations (Feldens et al., 2018; Schulze et al., 2022).
Thanks to these technological improvements, MBES-measurement of seafloor backscatter has become a valuable tool for monitoring changes in surface sediments over time, enabling a deeper understanding of seabed environmental dynamics driven by natural processes such as sediment transport and erosion, as well as anthropogenic activities like sand extraction. Significant variations in BS time series at different temporal scales reflect changes in surface sediment characteristics (Kint et al., 2023; Krabbendam et al., 2022; Montereale-Gavazzi et al., 2018; 2019; Pratomo et al., 2023; Schulze et al., 2022; Wyns et al., 2021; Lopez Lopez et al., 2025 submitted).
Despite its many advantages, the use of MBES-measured backscatter data in marine environmental monitoring programs faces several challenges. These include controlling environmental factors that may influence raw measurements, monitoring acquisition parameters, verifying measurement repeatability, calibrating measurements, and standardizing data processing procedures (Lurton et al., 2015; Lamarche and Lurton, 2018; Lucieer et al., 2018). The inter-comparability of BS time series obtained using one single MBES requires regular assessments of measurement repeatability. This can be achieved through repeated surveys over a stable reference area, where the absence of significant variations demonstrates sensor stability, ensuring that detected changes elsewhere are reliable and attributable to actual seabed modifications (Roche et al., 2018). The integration of BS data from multiple MBESs operating at closely spaced frequencies (differing by significantly less than one octave), requires the absolute calibration of each MBES involved (Hughes Clarke et al., 2008; Eleftherakis et al., 2018). Similarly, the comparative analysis of high- and low-frequency BS data acquired simultaneously by multi-frequency MBESs requires precise calibration for each frequency used (Ladroit et al., 2018; Runya et al., 2020). Several backscatter calibration methods for MBESs exist and have been critically analyzed (Eleftherakis et al., 2018). Among the various available options, cross-calibration over a reference seabed area offers a pragmatic solution, reducing costs and complexity associated with tank and reference sphere calibration, while ensuring reliable results obtained in an operational configuration of the sensor (Eleftherakis et al., 2018; Weber et al., 2018; Fezzani et al., 2021).
This study is situated within the broader framework of the monitoring program for the environmental impacts of sand extraction in the Belgian part of the North Sea, as required by national and European regulations (Belgian Law of 13 June 1969; Marine Strategy Framework Directive MSFD, 2008). The assessment of sand extraction impacts is contingent upon systematic acquisitions of bathymetric and backscatter data using MBES. In this context, the Kwinte Reference Area (Kwinte RA), located in the Flemish banks of the Belgian part of the North Sea, plays a pivotal role due to its stability in bathymetric and backscatter (BS) measurements. This stability allows for the verification of measurement repeatability and the cross-calibration of MBESs utilized in the monitoring program (Roche et al., 2018; Deleu and Roche, 2020).
However recent measurements in the Kwinte RA have unexpectedly revealed a significant correlation between MBES-measured backscatter levels and seawater temperature. This dependence, shown to be entirely distinct from the acoustic energy absorption through the water column, suggests changes in transducer behavior related to seawater temperature. Notably, this measurement temperature dependence of up to 4 dB for 10°C has not been explicitly addressed for MBES in previous publications, despite representing a potential crucial source of measurement variability that can complicate the interpretation of BS time series and cross-calibration on natural reference areas. This temperature dependence is also observed in at-sea measurements carried out at the Carré Renard reference area (Bay of Brest, France). In-tank measurements (by Kongsberg Discovery, Horten, Norway) unequivocally demonstrate this instrumental dependence on temperature, providing a solid foundation for the findings in this article.
The objective of this contribution is to address these challenges and to direct the attention of seafloor backscatter users to this subject matter. To this end, the above-mentioned data sets will be presented in order to describe the temperature dependence of BS, identify potential causes of this dependence, and elucidate its impact on cross-calibration of backscatter measurements and its use in the monitoring context. The temperature-induced variations can potentially confound environmental changes, thereby leading to misinterpretations in the dynamics of the target of interest (here the surficial seabed). Specifically, inherent seasonal fluctuations in seawater temperature can induce a substantial variability that is unrelated to actual alterations of seabed properties. Failure to account for this temperature dependence can result in erroneous signals in BS time-series analyses, potentially misconstruing sediment transport patterns, erosion processes, or anthropogenic impacts, and ultimately compromising the validity and reliability of long-term monitoring initiatives. As a solution, a pragmatic approach is proposed, entailing the implementation of a systematic cross-calibration during each measurement campaign. This approach facilitates the correction of the variability associated with the temperature dependence of backscatter measurements to final BS values. The advantages and limitations of this method are demonstrated through an illustration of its application to a short time series acquired over 2 years in a sand extraction monitoring zone.
This research addresses the current research priorities of the backscatter-concerned scientific community (Lecours et al., 2025) by improving the accuracy and reliability of the BS as an indicator of seabed sediments and refining the cross-calibration using natural reference areas. Furthermore, it promotes the systematic use of backscatter measurements for sustainable marine resource management and habitat monitoring programs.
2 Material and methods
This article draws upon a range of data sources.
• The data obtained at sea, selected to illustrate the correlation between measured backscatter level and temperature, were gathered from two MBESs operating at 300 kHz.
• Temperature and salinity data from a range of sources were used to calculate absorption coefficients to assess related potential uncertainties and their effects on measured level values.
• In-tank data recorded with a third MBES at 200, 300, and 380 kHz served to support the observations of temperature dependence made at sea, thereby providing an additional insight into the subject matter.
• At-sea data single-beam (SBES) and MBES used to illustrate the case study demonstrating the application and relevance of cross-calibration using a natural reference zone, while simultaneously accounting for temperature dependence.
The origin and use of the data are detailed in sections 2.1. To 2.4.
2.1 MBES data acquired at sea
Data acquired at sea, selected to emphasize and quantify the temperature dependence, were obtained from two reference areas (RA), the Kwinte RA located in the Flemish banks area of the Belgian part of the North Sea, Belgium and the Carré Renard RA located in the Bay of Brest, France (Figure 1; Table 1).
• At the Kwinte RA, measurements were carried out between 2022 and 2023 using a Kongsberg Discovery (KD) EM 2040-04 MKII Dual Receiver MBES, installed in 2021 on the new RV Belgica (this dataset is tagged as Kwinte EM2040MKII).
• Similarly, data from the Carré Renard RA were obtained from 2019 to 2022 using a KD EM 2040-07 MKI Dual Receiver MBES, installed on the RV Thalia in 2012 (this dataset is tagged as Carré Renard EM2040MKI).
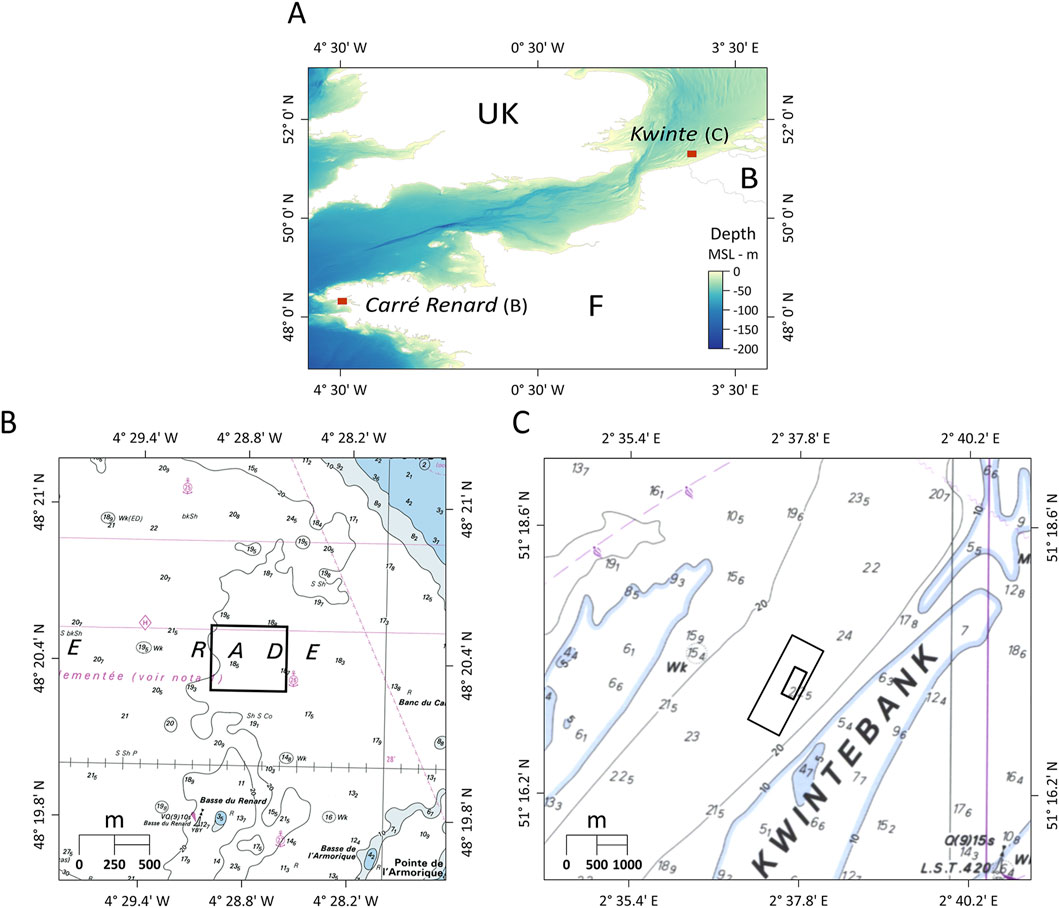
Figure 1. Localization of backscatter reference areas. (A) General overview (background: GEBCO_2024 15 arc-second grid). (B) Carré Renard RA location in the Bay of Brest, France; area center coordinates: 48°20.419′N, 4°28.770′W (background: Service Hydrographique et Océanographique de la Marine, 2008). (C) Kwinte RA location in the Flemish Bank area, Belgium; large rectangle: area designated in the Belgian Marine Spatial Plan 2020–2026; small rectangle: bathymetric and backscatter calculation area; center coordinates: 51°17.1978′N, 2° 37.7213′E (background: Vlaamse Hydrografie, 2014).
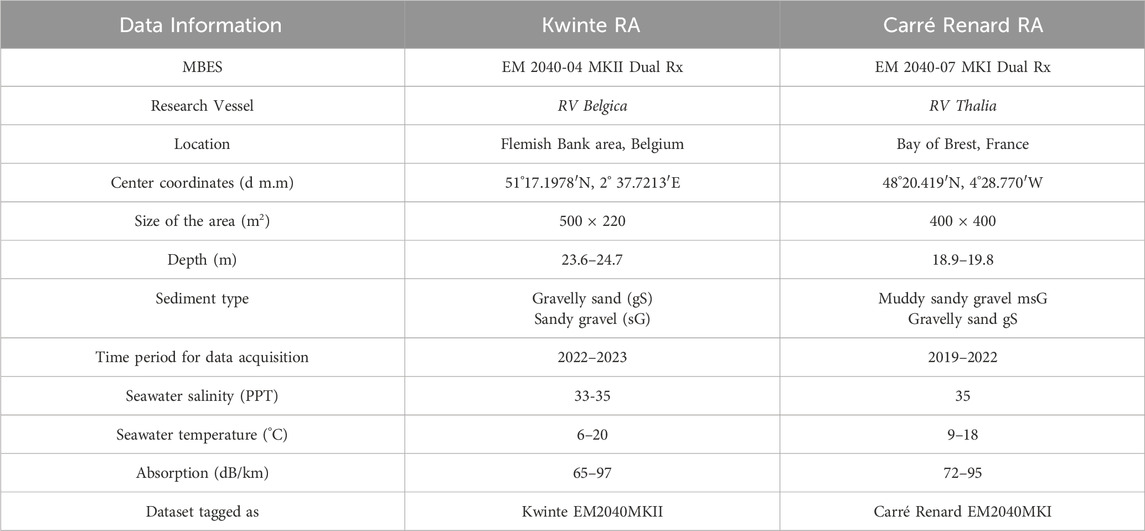
Table 1. Kwinte and Carré Renard Reference Areas: General data.
The two series of surveys were conducted using KD Seabed Information System (SIS ®) version 4 (KD, 2007; 2020) at a nominal frequency of 300 kHz (Table 2).
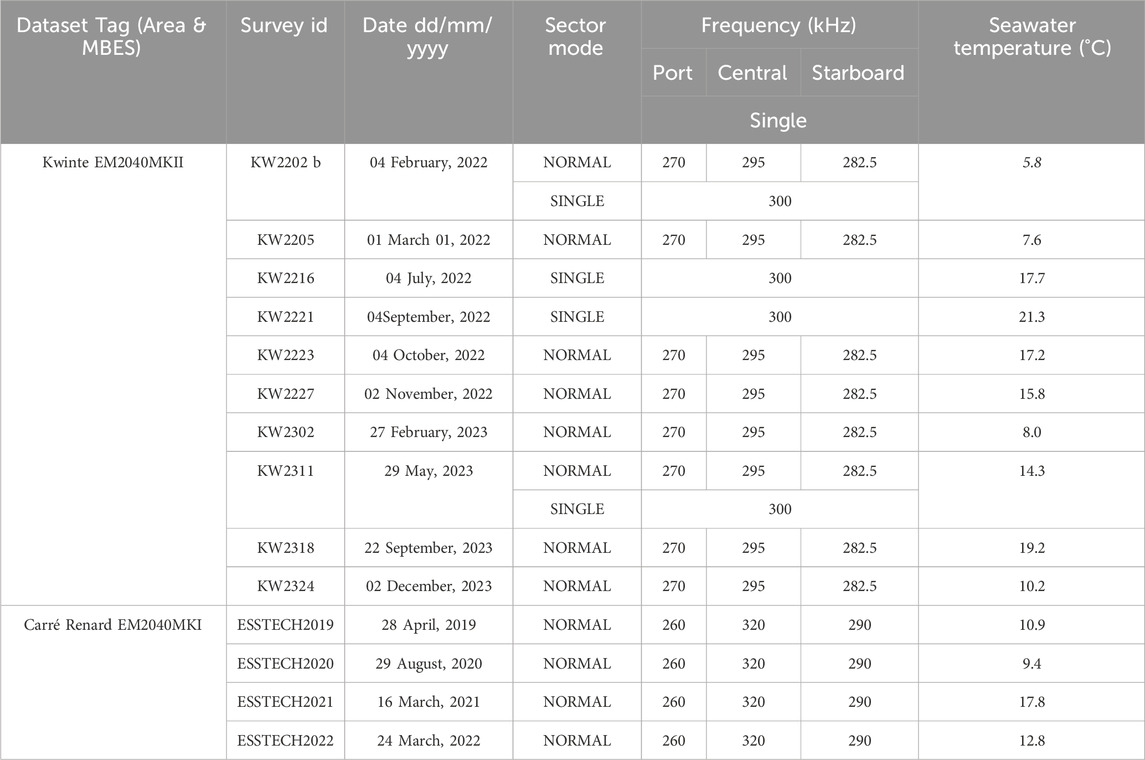
Table 2. Kwinte EM2040MKII and Carré Renard EM2040MKI survey ID, date, MBES sector mode and sector frequency and seawater average temperature (°C). All MBES data acquired at a nominal frequency of 300 kHz using Kongsberg Discovery Sea Information System (SIS). Kwinte EM2040 MKII Seawater temperature: all real-time from thermosalinograph except for survey KW2202 b using COHERENS model. Carré Renard EM2040MKI Seawater temperature: all real-time from Bathythermograph.
The EM 2040 operates in normal mode using a three-sector transmit configuration, with each sector pinging simultaneously at slightly different frequencies (KD, 2021). The three sectors are formed from three combined transmitting (Tx) arrays, with the central array built differently from the others. In single-sector mode, the EM 2040 transmits in only one wide sector at a user-selected frequency of 200, 300 or 400 kHz. On both research vessels, the two receiving antennas (Rx) are mounted on the port and starboard sides of the Tx antenna, tilted across-ship at angles of 35° on RV Belgica and 40° on RV Thalia. Sketches of the Tx and Rx directivity patterns in multi-sector mode are provided in Figure 2. The exact array installation angles are given in the Supplementary Material (see § 14. Supplementary Material: EM2040_Tx_Rx.pdf).
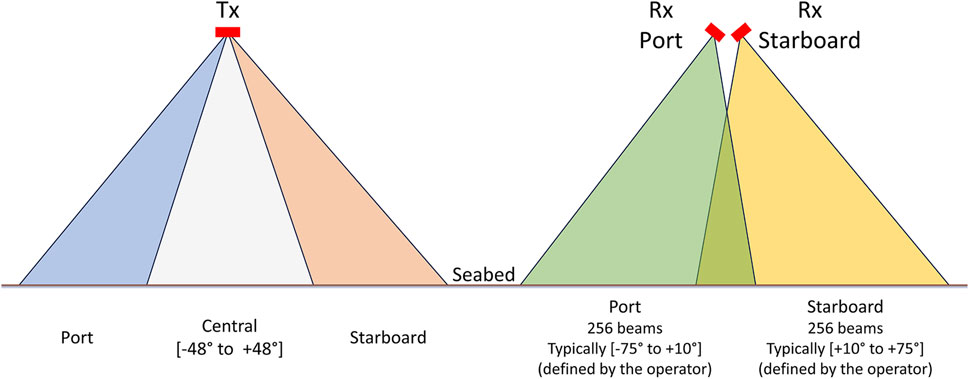
Figure 2. Kongsberg Discovery EM2040 Tx and Rx directivity patterns in multi-sector mode.
2.2 Oceanographic data
Assessing absorption uncertainty due to temperature variation is critical to interpreting temperature dependence of backscatter level measurements. For Kwinte EM2040MKII, various sources of temperature and salinity values, along with different estimation approaches, have been used to determine absorption both during in-situ measurements at sea and retrospectively during data post-processing. The sources of oceanographic data are presented in Table 3. A detailed table listing the temperature and salinity values used, their sources, and the corresponding absorption values for each survey is included as Supplementary Material of this paper (see § 14. Supplementary Material).
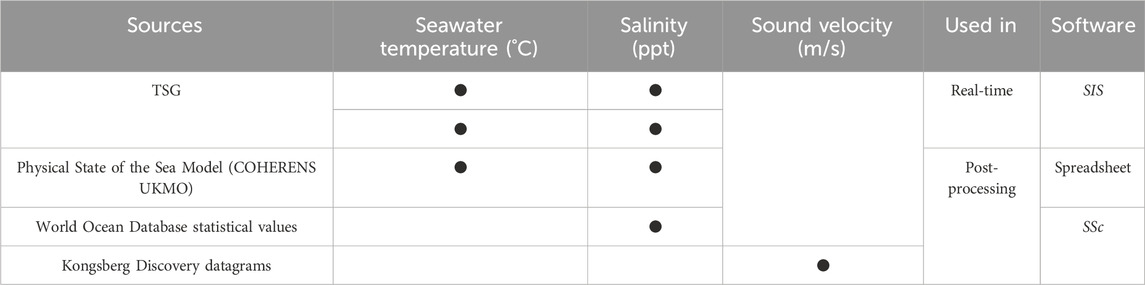
Table 3. Data sources and software for real-time and post-processing estimation of absorption values for Kwinte EM2040MKII. SIS: Kongsberg Discovery’s Seabed Information System® . SSc: Ifremer’s SonarScope ® software. TSG: SeaBird SBE21 Thermosalinograph. See also Supplementary Material: SYNTHESIS TABLE RV BELGICA THALIA T S ABS.xlsx.
2.3 MBES data acquired in-tank
In addition to the MBES data gathered at sea, measurements conducted in a controlled environment (KD test-tank facilities) with varying temperature provide valuable insights into the temperature dependence of a KD EM2040 receiving antenna directivity. The measurements were conducted 10–16 August 2015 by repeatedly running KD production measurements on a transducer while heating and subsequently cooling the water in the measurement pool. The dataset contains 17 measurement series with temperatures between 22.5°C and 32.6°C collected opportunistically while the tank was being heated. The receive directivity pattern is measured by transmitting on a hydrophone at regular angle intervals while rotating the EM2040 receiver at a fixed distance of 1.1 m. The calculated directivity is compensated for differences in arrival angles per element due to the nearfield, but not for any temperature dependence in the sensitivity of the hydrophone.
2.4 Data for cross-calibration
Cross-calibration on a natural reference area consists in comparing simultaneous measurements from two echosounders (the one to be calibrated, and a reference one, already calibrated) on a same seafloor patch at identical angles and frequencies. This principle was extended to the concept of natural reference areas, where a limited seafloor zone is chosen as a permanent benchmark, and characterized by calibrated Angular Response Curves (ARCs), that are frequency dependent and typically recorded using tilted calibrated single-beam echosounders (SBESs) (Eleftherakis et al., 2018). Uncalibrated MBES are then operated over this area for the same frequency and angle values; their results are compared with the calibrated ARCs to obtain the calibration compensations to be applied. Obviously, this method is contingent upon the seabed stability. The stability criteria are considered in Roche et al. (2018). The assumption of acoustic stability of both Kwinte and Carré Renard RAs is grounded in a substantial high resolution bathymetric and BS time series. In particular for the Kwinte RA, backscatter data collected over both multi-year in different seasons and short-term within a tidal cycle periods consistently show high acoustic stability, with variations staying within ±1 dB of the overall mean at 45° incidence (Roche et al., 2018; Montereale Gavazzi, 2019; Montereale Gavazzi et al., 2019).
The calibrated ARCs for Kwinte RA were established on 24/05/2023 through BS measurements with three transducers KD EK80 SBES on HV Sirius recording data within a frequency range from 50 to 440 kHz. The transducers were mounted on a pan-and-tilt device, all deployed through the ship’s “moon pool.” A tungsten-carbide reference sphere was employed to accurately ascertain the combined transmission-reception response of each transducer and their associated Wide Band Transceiver (Demer et al., 2017), thereby ensuring their absolute calibration (Demer et al., 2015). The pan-and-tilt device was operated remotely from the vessel bridge, with the transducers vertically rotating between −10° and +75° by 5° increments. The survey was conducted along 18 lines in both directions for each frequency, resulting in the generation of a comprehensive library of reference ARCs for the Kwinte RA (Fezzani and Berger, 2023).
The case study presented in the final part of the article illustrates the value of cross-calibration in correcting for temperature dependence. The data discussed in this section originate from the same EM2040 MBES model on which temperature-related effects were demonstrated both at sea and in the tank. The short BS time series was recorded from 2022 to 2023 in the BRMC monitoring zone (BRMC MZ) located on the Buiten Ratel sandbank near to the Kwinte RA. During each measurement campaign, the Kwinte RA was surveyed to compute calibration corrections using the same 300 kHz EK80 reference ARC. Table 4 summarizes the information of these data.
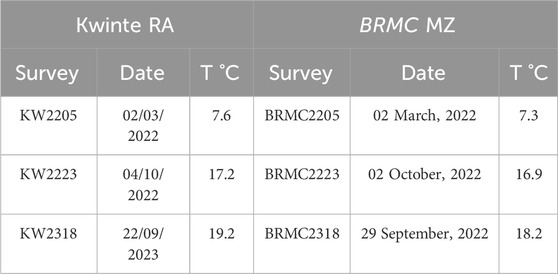
Table 4. Case study MBES surveys information. All MBES data acquired at a nominal frequency of 300 kHz using the RV Belgica Kongsberg Discovery EM2040-04 MKII Dual Receiver MBES. Seawater temperature (T°C) from realtime SeaBird SBE21Thermosalinograph.
2.5 BS processing
Processing backscatter data from multibeam echosounders involves complex environmental and sensor-specific corrections, yet the lack of standardized procedures remains a critical challenge for the user community (Malik et al., 2019).
The received echo results from a combination of acoustic and geophysical processes, including both the transmitting and receiving electronics of the sonar system, as well as the physical propagation phenomena occurring in the water column and the signal interaction with the seafloor interface. To access the backscattering properties of the seafloor, it is necessary to remove components of the received signal that are not directly related to the target. Therefore, the data recorded by the MBES must be corrected for both radiometric (related to sonar characteristics and settings) and geometric (related to the measurement configuration) effects. The necessary corrections include:
• Source level (and its angular variation, i.e., the transmit sector directivity pattern)
• Receiver sensitivity (and its angular variation)
• Applied gains (TVG and fixed gains)
• Insonified area (depending on pulse length, beam width, terrain slope and incidence angle)
• Transmission losses (slant range, seawater absorption coefficient)
A complete view of the various terms involved in the estimate of the Echo Level EL (the acoustical signal amplitude considered upon reception by the sonar) can be described by the following sonar equation expressed in dB:
where SL is the nominal source level; DF is the combined directivity pattern of transmission and reception, depending on multiple sensor-related factors, including transducer element patterns and array processing (as functions of frequency and angle); TL is the one-way transmission loss featuring spreading loss and seawater absorption. BS is the backscatter strength (for 1 m2) which is the quantity of interest; and
The Kongsberg Discovery MBES used in this work logs datagrams that include both the collected data and the metadata featuring the system settings and survey status. Specifically, the “Beam Intensity” quantity for a given frequency
1. The detected signal amplitude considered for one beam at the sonar receiver output (
2. The acoustical echo level upon reception is given by accounting for the sonar sensitivity and applied gains:
3. The target strength of the instantaneous insonified seafloor area is obtained by correcting the echo level as:
4. Finally, the backscatter strength (for 1 m2) is the target strength corrected by the effective backscattering area:
where
Ifremer’s SonarScope ® software (release 2024-02-24; Augustin, 2023) was used to process the backscatter data. SonarScope ® is a research-oriented MATLAB tool that applies corrections to each term of the sonar equation, prioritizing precision and transparency. SonarScope ® methodology ensures the reliability of corrections and allows for comparability of backscatter values across datasets at each processing step.
SonarScope® applies two main correction steps to the raw backscatter data provided in the echosounder datagrams, addressing both geometric and radiometric effects. The corresponding “backscatter processing levels” are referred to as Level-1 BS and Level-2 BS. Most end-users of MBES backscatter data expect a mosaic of the survey area. As a final standard step in the mosaic realization, the intensities must be normalized to a reference level, and compensated to reduce the dependence of BS on the incidence angle. This final step produces Level-3 BS.
The following section describes the applied corrections and how the resulting backscatter levels can be used in practice.
2.5.1 Level-1 BS
The following corrections are applied:
• Spreading loss and seawater absorption correction using SonarScope ® absorption coefficient. In the context of backscatter measurements, the assessment of energy loss during propagation in the water column is a critical issue. In this respect, special attention has been given to the absorption impact in section 3.2.
• Seafloor insonified area correction. This can be accurately estimated for each ping and beam, based on the digital bathymetric model and the measured angle of incidence, while taking account of the echosounder characteristics (individual beam apertures and signal duration).
Although not calibrated by absolute values of the TX source level and RX sensitivity, nor corrected for the MBES overall directivity pattern, Level-1 BS makes possible a robust comparison of the BS levels obtained with the same MBES on the same seafloor area at different times (Roche et al., 2018).
2.5.2 Level-2 BS
The next round of corrections is the following:
• Backscatter level cross-calibration. Cross-calibrating the backscatter data involves correcting the differences at each incidence angle between the MBES-measured average values from a reference area (in our case the Kwinte RA) and the reference ARCs obtained with a calibrated SBES, assuming the RA remains stable over time (see §2.41.2). The average correction obtained from this operation is applied to backscatter data collected in other areas. In the present study, Kwinte EM2040MKII were calibrated in accordance with the principle mentioned above, utilizing the 300-kHz ARC established in May 2023 as an absolute reference level.
• MBES array directivity pattern correction. This is performed together with cross-calibration, as it is de facto included in the BS compensation values obtained by comparison with the reference ARC.
The resulting Level-2 BS, after applying cross-calibration and array directivity pattern correction, provides the BS level and angular dependence only depending on the characteristics of the seabed, enabling the analysis and modelling of the angular response characteristic of the local seabed properties. Level-2 BS is the Backscattering Strength. As a result of calibration, the angular responses of the Level-2 BS data from disparate MBESs operating at analogous frequencies can then be compared.
2.5.3 Level-3 BS
Finally, a last step may be applied to produce backscatter mosaics:
• Angular compensation. An average pattern of the local calibrated angular response is estimated and then compensated in the Level-2 data, keeping invariant a conventional reference point in the response (usually the local BS value at 45°). This flattening correction maintains a stable homogenized calibrated backscatter level on the area over which it is calculated.
This Level-3 BS encompasses all environmental and sensor-related corrections, thereby constituting the actual acoustic signature of the seabed. It is considered as the end product of the backscatter mosaic computation, which serves as the foundation for image-based acoustic classification and its interpretation in terms of marine habitats.
For this research, Level-1 BS is adequate for conducting comparisons of the backscatter angular response acquired by the same MBES on the same seabed area over time; consequently, it has been employed for the analysis of the temperature dependence.
In the case-study section, Level-2 BS of a dataset recorded on Kwinte RA and BRMC MZ with the same MBES is presented to illustrate the benefits of cross-calibration as a solution to overcome the instrumental temperature dependence. Level-3 BS mosaics of the two involved areas are presented in the same section.
3 Results
3.1 Data acquired at sea
The average Level-1 BS (see §2.5.1) angular response from Kwinte EM2040MKII in multi-sector mode and in single-sector mode, are presented respectively in Figure 3. A and 3B in which the chromatic properties of the angular responses are contingent upon the seawater temperature. From 2022 to 2023, eight survey datasets are available in multi-sector mode and four in single-sector mode (Table 2).
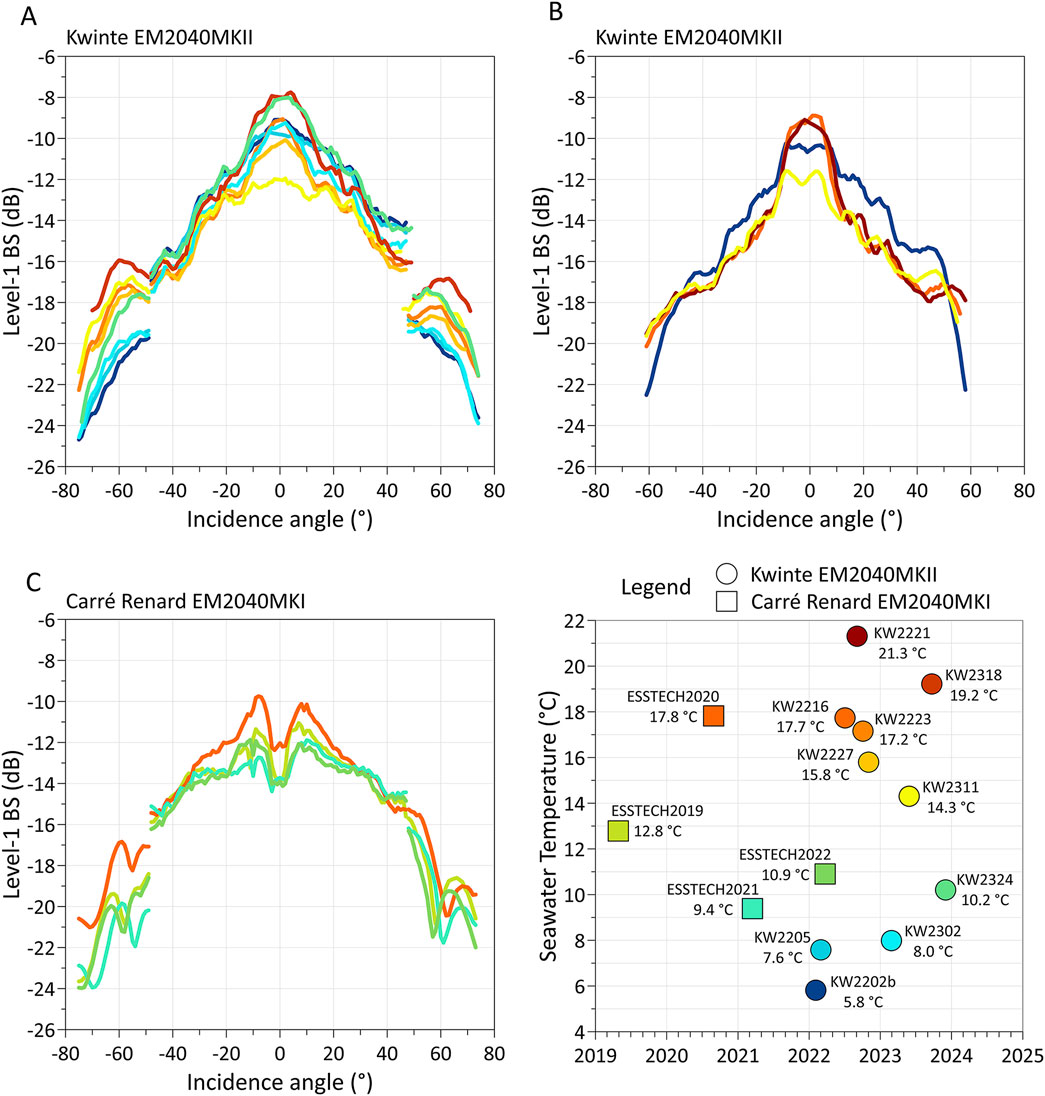
Figure 3. BS angular response, Level-1 BS (dB) vs. incidence angle (°) at 300 kHz for various seawater temperatures (°C). For all three charts, the line color reflects the temperature according to the graph-legend. Refer to Table 1 for detailed MBES survey specifications and temperature information. (A) Kwinte EM2040MKII in multi-sector mode. (B) Kwinte EM2040MKII in single-sector mode. (C) Carré Renard EM2040MKI in multi-sector mode. Temperature values used: for (A) and (B): Thermosalinograph except for survey KW2202 b using COHERENS model; for (C): Bathythermograph.
In the multi-sector mode, angular responses are evaluated independently for each sector (Figure 3A). In the central sector, angular responses exhibit consistency across surveys, with directivity and backscatter levels demonstrating stability with respect to seawater temperature. In contrast, within the Rx port and starboard sectors, the angular response signatures (angular position of the maximum BS value and slope) present significant variability across different surveys. This variability is indicative of a directivity change with relation to the temperature. The average backscatter levels also vary with temperature. For the port sector, a substantial increase of up to 6 dB is observed between recordings made in the coldest waters (5°C–6°C) and the warmest waters (16°C–20°C). A comparable behavior, albeit with a reduced amplitude, is observed for the starboard sector.
In the single-sector mode, the only recording at low temperature (5.8°C) manifests an angular response with distinct variations in both intensity and directivity compared to those recorded at temperatures above 12°C (Figure 3B). Within the incidence angle range from −50° to 50°, with the exception of the specular lobe, there is a 2-dB average increase. However, this trend is reversed when the incidence angle falls below −50° and exceeds 50°. In this case, the levels at low temperatures decrease by 3–4 dB at 60° incidence compared to the levels measured above 12°C.
A similar approach was applied to Carré Renard EM2040MKI in multi-sector mode (Figure 3C; Table 2). Level-1 BS angular responses evaluated for each transmission sector show analogous trends to those observed in the Kwinte RA records with some nuances. The central sector exhibits a high degree of similarity across the three series of measurements conducted at temperatures ranging from 9°C to 13°C. The BS values of the survey conducted in water at 17.8 °C demonstrate a substantial increase of 2 dB in the angular interval ranging from −25° to 25°. This increase is accompanied by a change in directivity around the specular. A more significant variation in BS levels and beam pattern in relation to temperature is observed on the port and starboard sectors. The survey conducted at 17.8°C reveals levels 4 dB higher than those observed in the other three surveys above an angle of incidence of 50°.
A correlation analysis between the mean backscatter levels in each sector and the corresponding temperature values is performed for Kwinte EM2040MKII and Carré Renard EM2040MKI (Figure 4). The trends are remarkably similar for the port and starboard sectors on both datasets. For the port sector, the positive correlations between the average BS level and temperature are significant and result in practically identical average increases as a function of temperature. For Kwinte EM2040MKII, the average increase is 3.2 dB/10°C, and for Carré Renard EM2040MKI, the average increase is 3.6 dB/10°C (Figure 4A). The correlations observed in the starboard sectors are less substantial in comparison to those measured in the port sectors but the backscatter level average increases with temperature remain fully comparable from one system to the other, with 1.8 dB/10°C for Kwinte EM2040MKII and 1.6 dB/10°C for Carré Renard EM2040MKI (Figure 4C). However, the two systems diverge for the central sectors (Figure 4B). Kwinte EM2040MKII shows a slight negative trend of −0.6 dB/10°C, but the correlation is not significant. Conversely, Carré Renard EM2040MKI shows a positive trend of 1.3 dB/10°C, which is comparable to the trend observed in the starboard sector. To summarize: with the exception of the central sector, the outer sectors of both Kwinte EM2040MKII and Carré Renard EM2040MKI demonstrate a comparable correlation of backscatter with temperature. The port sector, which transmits at 270 kHz, representing the lowest frequency of the three sectors, exhibits the most substantial correlations between measured backscatter and temperature.
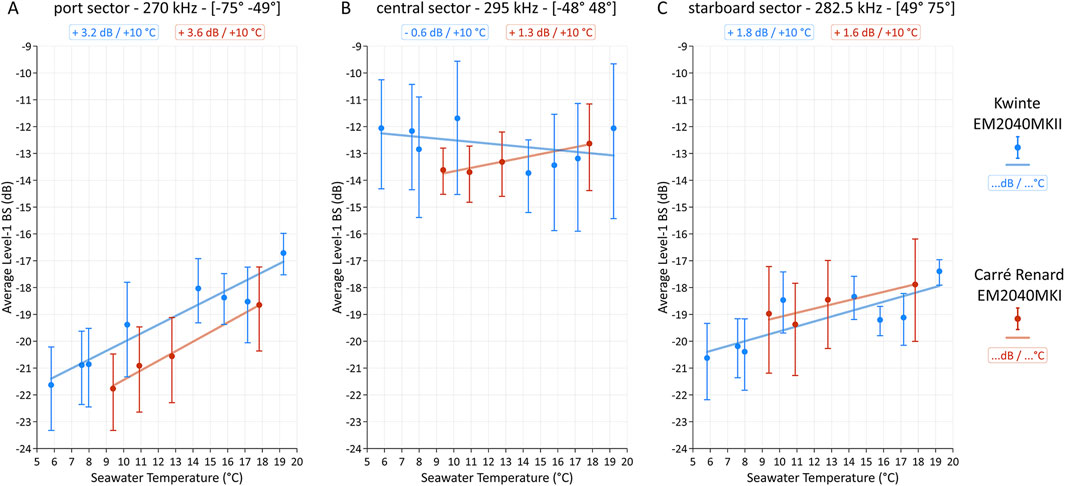
Figure 4. Mean Level-1 BS (dB) vs. seawater temperature (°C) for the three transmit sectors (A) Port; (B) Central; (C) Starboard of two similar EM2040 MBES (both 300 kHz), based on data recorded on Kwinte (EM2040-MKII) and Carré Renard (EM2040-MKI). For each survey and transmit sector, the mean m and standard deviation s were computed from BS data averaged in 1° bins using natural amplitude values. Error bars in dB are computed as 20 × log10 (1 ± s/m). For each sector, the graph displays the scatter plots with their linear trend vs. seawater temperature, and gives the average BS variation in dB for a 10°C increase. The measured temperature uncertainty is 0.1°C for the thermosalinograph used for Kwinte EM2040MKII (excepting survey KW2202b using COHERENS model) and 0.1 °C for the bathythermograph used for Carré Renard EM2040MKI. Refer to Table 2 for detailed MBES survey specifications and temperature information.
3.2 Seawater absorption
Seawater temperature plays a crucial role in sound absorption by influencing the visco-thermal mechanisms and the chemical relaxation processes (François and Garrison, 1982a; 1982b; Doonan et al., 2003). It is a key point for understanding sound attenuation variations across frequencies. Errors in absorption coefficient estimation can substantially impact transmission loss calculations, contributing to uncertainties in MBES backscatter measurements of up to several decibels (Malik et al., 2018).
Comparing absorption values obtained from different data sources offers insight into the potential absorption uncertainties and enables a thorough assessment of their impact on measured backscatter values at different incidence angles for a specified average depth.
Three estimates of absorption from different seawater temperature and salinity sources were considered for Kwinte EM2040MKII (see §2.3, Table 3):
• Real-time absorption values, derived from temperature and salinity provided by the hull-mounted thermosalinograph, are manually entered into SIS ® by the MBES operator at the start of the survey. Only a single value is considered per Tx sector. As a result of these simplifications, these values may be subject to local uncertainties.
• SonarScope ® uses a dedicated algorithm enhancing the accuracy of the absorption contribution in the transmission loss prediction used for BS calculations. For each frequency, a mean absorption profile across the entire water column is estimated for each ping and beam. This estimation is based on salinity values from the World Ocean Database (Levitus et al., 2013) and temperature derived from the sound speed profiles recorded in the KD datagrams. In the Flemish Banks area, where water mixing constantly occurs, local sound speed profiles are directly retrieved from the sound speed sensor installed close to the MBES transducers. As the sound speed profiles are strictly controlled, this approach ensures that reliable absorption values are obtained. For this reason, SonarScope ® absorption coefficient has been used in the calculation of Level-1 BS (see §2.5.1).
• Another series of absorption values was derived from the temperature and salinity provided by the Physical State of the Sea Model COHERENS UKMO developed for the Belgian part of the North Sea. (Physical State, 2023).
All absorption coefficient values were calculated using the same formula by François and Garrison (1982b). All the temperature and salinity data available during the ship operation time on the Kwinte RA have been included in post-processing absorption estimates. The results are summarized in Figure 5.

Figure 5. Seawater temperature at Kwinte RA from 2022 to 2023 and average of absorption estimates. Sea surface Temperature (T, °C) from the Physical State of the Sea COHERENS UKMO model. Absorption coefficients (dB/km) at 300 kHz calculated using the same formula by François and Garrison (1982b). Absorption real-time: T and S inputs from RV Belgica Seabird SBE21 Thermosalinograph. Absorption post-processing SonarScope ®: S from World Ocean Database (Levitus et al., 2013) and T from KD datagram sound velocity profile. Absorption post-processing COHERENS model: T and S from the Physical State of the Sea COHERENS UKMO model. See Table 3 and Supplementary Material SYNTHESIS TABLE RV BELGICA THALIA T S ABS. xlsx.
Over all the various surveys, the average absorption measurement values appear to be rather consistent; the average dispersion between extreme absorption values is 2.5 dB/km. For a mean depth of 24 m representative of the Kwinte RA, this 2.5 dB/km average dispersion results in backscatter measurement uncertainties of 0.12 dB–0.46 dB for incidence angles ranging from 0° to 75°.
For Carré Renard EM2040MKI, the agreement between the absorption coefficients used in real-time and those recalculated by SonarScope ® was simply checked, since the values were virtually identical and did not need further corrections.
The detailed table listing the oceanographic data, their sources, and the corresponding estimated absorption values for each survey, are included as Supplementary Material of this paper, together with a spreadsheet evaluating the impact of absorption uncertainties for different angles of incidence, by varying the uncertainty level and the water depth (see §14. Supplementary Material).
The observed backscatter amplitude variations of 3–4 dB/10 °C are out of proportion with the modest variations caused by absorption uncertainties, which are at most around 0.5 dB. It is concluded that absorption cannot be a critical cause for the observed temperature-dependence of Level-1 BS.
3.3 In-tank data
Figure 6 shows the directivity patterns of an EM2040 receiver, measured in an instrumented test-tank (by Kongsberg Discovery, Horten, Norway) for various temperatures at 200, 300 and 380 kHz, spanning the typical frequency range of an EM 2040. The variations with temperature differ for every frequency. Each frequency plot displays directivity variation in relation to water temperature. Constant changes across all angles may reflect changes in the transducer sensitivity with temperature.
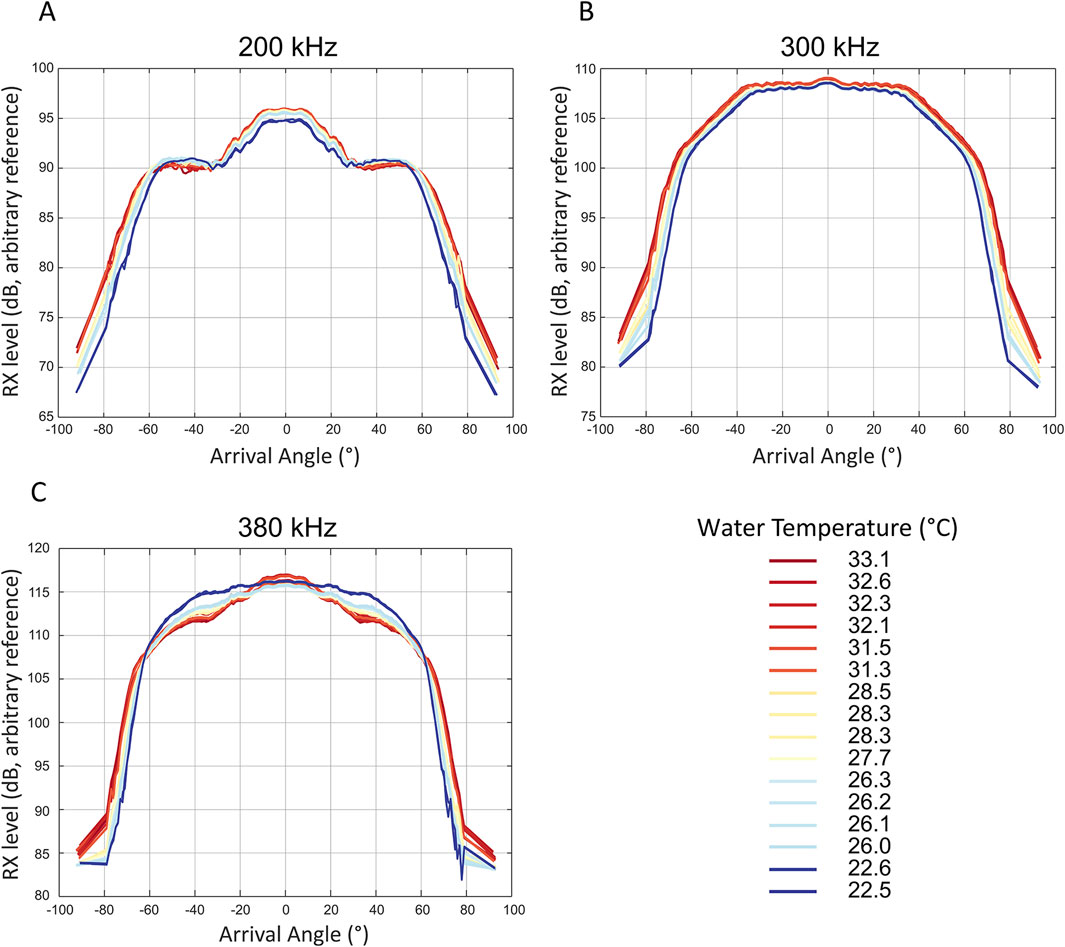
Figure 6. In-tank measurement results of EM2040 receiver directivity for varying water temperatures. Root Mean Square (RMS) amplitude (dB, arbitrary reference) as a function of arrival angle (°). For all three charts, the line color reflects the temperature according to the indicated color scale. (A–C) Results for 200, 300 and 380 kHz, respectively. Hydrophone temperature dependence is not accounted for, and may contribute to the change in level.
At 200 kHz (Figure 6A), a gradual amplitude increase by up to 4 dB is observed at angles between 60° and 80°, corresponding to a rise in temperature from 22.5°C to 32.1°C. However, this trend undergoes a reversal from 25° to 60°: within this angular sector, the amplitudes recorded at the lowest temperatures exceed those at the highest temperatures by 2 dB. For angles between 0° and 25°, the cold water amplitude levels demonstrate a slight depression (less than 1 dB) below the levels recorded in warmer water.
A consistent trend persists at 300 kHz (Figure 6B) across all angular intervals. The discrepancy between the amplitudes recorded in warm and cold water exhibits a gradual increase from less than 0.5 dB at 0° up to 9 dB at 80°. These changes can be seen as a gradual widening of the directivity pattern with temperature.
Recordings at 380 kHz (Figure 6C) demonstrate a relationship between important transducer properties (directivity pattern and measured level) and temperature analogous to that observed at 200 kHz. Within the range 60°–80°, a 5-dB increase in amplitude corresponds to an increase in temperature. However, this trend undergoes a reversal between 60° and 20°, with amplitudes recorded at the lowest temperatures exhibiting a 3-dB increase compared to those recorded in warm water. In the range 0°–20°, the amplitudes remain relatively consistent, with differences within 1 dB.
4 Interpretation and discussion
4.1 Instrumental temperature dependence of backscatter measurements
Results from KD EM2040 MBESs data acquired at sea and in tank demonstrate a significant dependence of measured backscatter on seawater temperature. This dependence manifests itself in two distinct ways: fluctuations in measured levels, and alterations in directivity patterns (see Figure 3). The expression of this dependence of amplitude and directivity varies from one transmission sector to another (see Figure 4).
Given its pivotal role in determining the level of absorption, seawater temperature constitutes a substantial source of uncertainty in backscatter measurements (Malik et al., 2018). However, in this study, as demonstrated in the absorption effect analysis, the variation resulting from absorption uncertainty is found to be negligible in comparison to the measured amplitude variation of 3–4 dB observed over a temperature variation range of 10°C (see §3.2). This point merits specific emphasis, as it is frequently assumed that fluctuations in echo level measurements are primarily influenced by the seawater absorption effect when investigating the relationship between measured backscatter levels and hydrological changes: our conclusion is rather that the absorption effect magnitude is evidently inadequate to elucidate the relationship between BS and temperature as highlighted in this study; consequently, the temperature dependence of measured backscatter should be regarded as an echosounder instrumental artefact.
A survey of the available literature reveals a lack of publications specifically addressing the temperature dependence of MBES-measured backscatter. A notable exception is (Wendelboe et al., 2012) mentioning the need for an analysis to assess the influence of temperature variations on sensitivity, but without providing any further details.
However, some relevant literature on this temperature-dependence topic exists for single-beam echosounders. For these systems, calibration procedures at sea are defined in order to compensate for the variation of echosounder performance with temperature, both during the preliminary calibration at sea and during the backscatter processing phases. For a given echosounder, backscatter variations for at-sea measurements within the current range of temperature range need to be compensated for, in order to reduce uncertainty when estimating aquatic resource abundance (Simmonds and MacLennan, 2007).
In order to quantify the effect of the temperature dependence of the calibrated ARC used on Kwinte RA, a literature review on predicted and measured temperature dependence on echosounder performance was conducted based on similar SBES as the one used here.
Demer and Renfree (2008) confirm a temperature dependence of echosounder sensitivity for echo level measurements using in-tank measurements of KD EK60 SBES by varying water temperature between 1°C and 17°C and highlighting that changes in water temperature can significantly affect the transducer properties such as impedance, resonance frequency, and quality factor. These temperature-induced variations influence system gain and equivalent beam aperture used in the sonar equation (Eleftherakis et al., 2018), and consequently, also influence backscatter measurement results. Among all the systems tested then, apart from the Simrad ES120-7 that is no longer manufactured since 2012, the observed variation in system gain is below 1 dB in the range 1°C–17°C.
Regarding the echosounder directivity dependence on temperature, a key point is that SBES systems use one same transducer for transmission and reception. Hence it can be shown (Bodholt, 2002) that the transducer gain and its equivalent beam aperture, both depending on the squared wavelength, cancel each other - making the system insensitive to sound speed variations caused by seawater changing temperature, at least for volume backscatter measurements. For interface backscatter measurements, a temperature dependence of the beam aperture must be introduced in the relevant sonar equation terms, similarly to MBES (Eleftherakis et al., 2018; Le Bouffant et al., in this Special Issue).
The temperature dependence magnitude in echosounder gain as predicted theoretically was confirmed by at-sea calibration for a range of transducers installed on RV GO Sars during the calibration procedure at different periods of the year (Knudsen, 2009). For temperatures ranging from 3°C to 12°C the transducer gain variation was found below 0.2 dB over several years of regular sphere calibration of the KD EK60 SBES. The same calibration gain variation magnitude (below 0.2 dB) was obtained from the integration of the volume backscatter of KD EK60 and EK80 SBES over the Carré Renard RA used for calibration monitoring over several years (Le Bouffant et al., this Special Issue).
4.2 Causes of MBES instrumental temperature dependence
A MBES array is composed of various materials (piezoelectric ceramics, metal, resins), and both its transmitter and receiver sensitivities and its directivity patterns are influenced by the array design, the material properties and the vessel mounting. As for seawater, the sound speed inside these materials (as well as other material properties) varies with temperature, and this variation differs between them.
The simplest model for temperature dependence is purely a sound-speed refraction effect, i.e., by assuming that the sound is refracted through the transducer acoustic window before being either transmitted into water or received by the RX array elements. This leads to a Snell’s law correction, rescaling the directivity in sine of the angle according to the ratio of the material and seawater sound speeds. This model gives an effect similar to the change in directivity pattern width in Figure 6B; however, we have only obtained an incomplete match when applying this model to plausible sound speed values. Moreover, this mechanism cannot explain the shape changes of the directivity patterns in Figures 6A,C. Hence refraction cannot be a sufficient cause for the observed temperature dependence.
Another possible explanation is that the temperature-driven changes of the material properties change the coupling between the array elements (Butler and Sherman, 2016; Viberg et al., 2009). With mechanical coupling the signal received (or transmitted) by an element includes a component of the signals received on other elements. It can be modeled as:
where
The amount of coupling depends on the array design, and may change with temperature as the material properties are modified. As an example, adding coupling of 10% and 3% to the two first neighbouring elements respectively adds a central peak to the directivity pattern, similar to what appears in Figure 6C with increasing temperature. The effect of compensating for this effect in the 31.3°C measurements in Figure 6C is shown in Figure 7. This compensation significantly reduces the difference in the directivity patterns from the two measurements. This suggests that a significant component of the variation of a given directivity pattern can be explained and modeled through coupling, and this can be an important cause for the observed temperature dependence. In this case, the coupling parameters were adjusted to match the observed directivity. However, estimating these parameters at the operational temperature is necessary to facilitate the calibration transfer between different temperatures. Moreover, as shown in Figure 6, the change in coupling has a frequency dependence that must be accounted for.
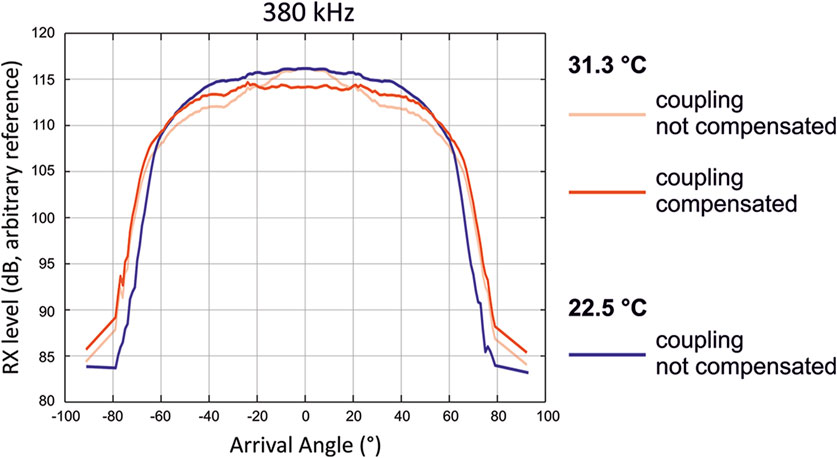
Figure 7. Example of the effect of coupling compensation. The 22.5°C curve is directly from the 380 kHz measurements in Figure 5C. The 31.3°C curve is the corresponding curve from Figure 5C compensated for the effect of 10% coupling to the nearest neighbours and 3% to the second nearest neighbours. The effect of coupling has been calculated on simulated data.
A comprehensive approach would be to apply the Finite Element Method (FEM) to model the transducer. This method directly models the physical properties and behavior of the array elements and can describe a range of additional effects accounting for detailed interaction between the different parts and properties of a transducer–if all required properties are known. In principle, FEM could be used to directly predict coupling values and their impact on directivity.
Several MBES units of one same model may correspond with different calibration values, even if mounted on the same vessel. Therefore, specific properties of the materials used in each individual transducer would be needed in order to predict the directivity accurately enough to avoid a further need for calibration. From a manufacturer’s point of view, this data is generally not available and expected to be prohibitively costly to acquire exhaustively over the relevant temperature and frequency ranges. Hence, a clear interest of accurate FEM computations would be to restrict/parameterize the expected directivity variation, hence reducing the amount of data needed to cover the full temperature range. Further data, modelling and research are clearly necessary before this approach may become feasible.
4.3 Impact on backscatter time-series and cross-calibration
BS time-series are employed to detect alterations in seabed properties over time, including sediment composition and surface roughness (Degrendele et al., 2024; De Backer et al., 2024; Lopez Lopez et al., submitted 2025). Nevertheless, even for surveys using one same MBES with meticulous attention to absorption considerations, temperature-induced variations can potentially confound environmental changes, thereby leading to misinterpretations in the dynamics of the target of interest (here the surficial seabed). Specifically, inherent diurnal and seasonal fluctuations in seawater temperature can induce a substantial variability that is unrelated to actual alterations of seabed properties. Failure to account for this temperature dependence can result in erroneous signals in BS time-series analyses, potentially misconstruing sediment transport patterns, erosion processes, or anthropogenic impacts, and ultimately compromising the validity and reliability of long-term monitoring initiatives.
Cross-calibration of MBES backscatter measurements on natural reference areas is also susceptible to the variability induced by temperature. In contrast, the SBES sensitivity variation due to seawater temperature is negligible considering only 1-dB change over a temperature range of 1°C–17°C (as elaborated in section 2.1.2). Consequently, the derived SBES reference ARC, which is used to estimate calibration corrections per incidence angle, fortunately remains relatively stable with respect to this concern. The corrections for cross-calibrating backscatter measurements are determined by the differences at each incidence angle between the MBES average BS values from the reference area and the ARC from calibrated SBES assuming a full stability of the reference area. Due to the temperature dependence of the MBES backscatter measurements, calibration corrections based on data acquired on the reference area during a survey carried out at a certain temperature cannot be used to calibrate data acquired at different temperatures, especially if the temperature difference is substantial. Consequently, it is not possible to establish a single calibration correction applicable to a time series of backscatter data from a specific MBES. However, when systematically performed, cross-calibration provides a solution to this issue.
The intricate interplay of sonar-related factors contributing to the temperature dependence of backscatter measurements renders the implementation of a corrective solution at the MBES system level impractical at this time. Further research will be necessary to develop a viable technological solution applicable to various MBESs. As things stand, considering the temperature dependence of backscatter measurements is only feasible downstream, within the data acquisition and processing. Cross-calibration on a natural reference area offers an effective means of compensating for the instrumental temperature dependence. The following case study illustrates the practicality of this approach.
5 Cross-calibration to account for the instrumental temperature dependence
In the framework of sand extraction supervision in the Belgian part of the North Sea, measurement campaigns are periodically conducted to assess the sand extraction environmental impact in monitoring zones situated on various offshore sandbanks. Measurement cruises are conducted over durations of one to 2 weeks. During such short periods of time, the disparities in seawater temperature between the designated monitoring zones and the Kwinte RA are known to remain below 2°C (Physical State of the Sea - Belgian Coastal Zone - COHERENS UKMO model and (Meetnet Vlaamse Banken, 2025)).
In this context, a systematic measurement of the Kwinte RA during each campaign greatly facilitates the a posteriori cross-calibration of the collected backscatter data. This approach, accounting for the sensor temperature dependence in the backscatter calibration, is essential for ensuring the data integrity and reliability.
The cross-calibration method was applied to short time series acquired in 2022 and 2023 in the BRMC monitoring zone (BRMC MZ), located on the Buiten Ratel sandbank at 1.75 nautical miles north-north-west from the Kwinte RA (Table 4; Figure 8A). All the measurements were made at 300 kHz (§2.4 and Table 4). The difference between the MBES-measured Level-1 BS angular response and the calibrated ARC (Figure 8B) provides the calibration correction (Figure 8C). This correction applies to all data sets acquired during the same survey cruise, assuming a stable seawater temperature. For the three surveys considered, the measured differences in seawater temperature between Kwinte RA and BRMC MZ during one same cruise ranged from 0.3°C to 1 °C (Table 4). The differences in the Level-1 BS correction between various cruises reflect the measurement temperature dependence as previously demonstrated with the same data (see §4.1 Instrumental temperature dependence of backscatter measurements).
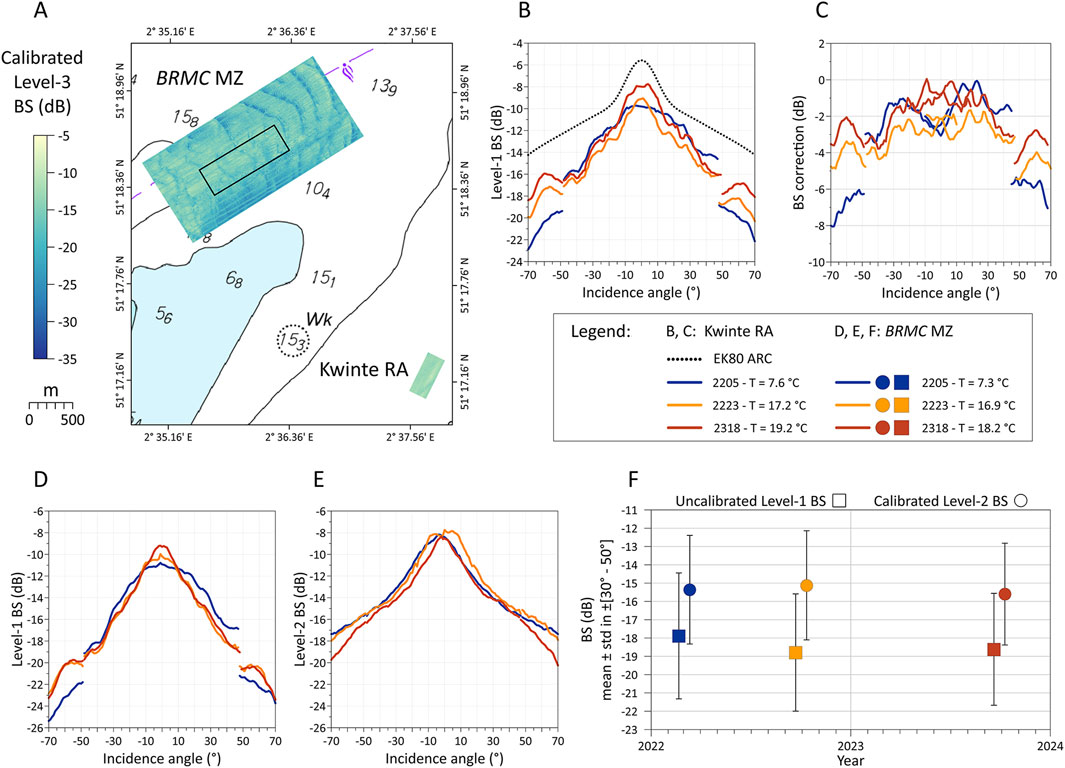
Figure 8. Case study: Cross-calibration of the 2022–2023 BS time series recorded at 300 kHz on BRMC monitoring zone using BS correction calculated on Kwinte RA. See Table 4 for data information. (A) Location of the BRMC MZ (center coordinates: 51° 18.6003′N, 2° 35.9855′E); calculation area inside the BRMC MZ (black rectangle); Kwinte RA (SE corner); Level-3 BS mosaics (1 × 1m). Data RV Belgica EM2040 MKII dual RX, survey 2205; background: Vlaamse Hydrografie, 2014. Kwinte RA: (B) BS (dB) Level-1 vs. incidence angle (°) and EK80 300 kHz calibrated ARC from EK80 (24/05/2023); (C) BS correction (EK80 calibrated ARC minus Level-1 BS, dB) vs. incidence angle (°). BRMC MZ: (D) BS (dB) Level-1 vs. incidence angle (°); (E) Calibrated BS (dB) Level-2 vs. incidence angle (°) using the corrections established on the Kwinte RA (C.); (F) Time series of uncalibrated Level-1 BS and calibrated Level-2 BS from the BRMC MZ calculation area. The BS values are restricted to incidence angles ± [30°,50°] and are depicted as mean ± std. The dates are slightly shifted (±10 days) to avoid std bars to overlap.
Applying BS corrections defined during cruise 2,205 to the data from cruise 2,318 may introduce errors up to 4 dB for Level-2 BS at incidence angle below −45° and up to 3 dB above 45°. Such an inacceptable inaccuracy demonstrates the need to perform one calibration for each measurement cruise, as it is standard practice in fisheries acoustics.
The presentation of BRMC MZ calibrated Level-2 BS vs. uncalibrated Level-1 BS illustrates the benefits of cross-calibration (Figures 8D–F). The evolution of Level-1 BS angular response and average level inside the angular sector ± (30°, 50°) (Figures 8D,F) is difficult to interpret as it may be due, at least partly, to temperature dependence. By applying the calibration correction established at Kwinte RA (Figure 8B) to the corresponding BRMC MZ surveys, the temperature dependence is accounted for and the resulting Level-2 BS angular responses and average level inside the angular sector ± (30°, 50°) are made comparable, now strictly representing the seabed BS (Figures 8E,F). The slight drop in Level-2 BS between the two 2022 and the single 2023 datasets is consistent with the observed trend toward sediment refinement in this area (Lopez Lopez, submitted 2025). This slight decline is mainly noticeable in Level-2 BS measured at high angles of incidence, above 50° (Figure 8E). Logically, this trend is barely perceptible in the evolution of the average Level-2 BS calculated inside the angular sector ± (30°, 50°) (Figure 8F). This suggests that, from now on, the evolution of the entire angular response of Level-2 BS should be considered for finely monitoring changes in surficial sediments over time.
6 Conclusion
This study demonstrates a clear correlation between backscatter measurement variability and seawater temperature through a dataset comprising both at-sea and in-tank measurements, all obtained with KD EM2040 MBESs. The temperature dependence is observed through changes in both measured echo amplitude and directivity patterns, with variations across transmission sectors. A 10°C temperature change has been observed to induce level variations up to 4 dB, which significantly exceeds the expected uncertainties associated with the variations of the water column absorption. These findings clearly demonstrate an instrumental temperature-dependence of backscatter measurements that has not been previously documented in the scientific literature related to MBES.
Investigations of the underlying causes put in evidence the complex, multifaceted nature of this dependence, encompassing changes in the materials sound speed and other properties, and in the coupling between MBES transducer elements. This multiple nature of potential causes makes impractical for now the implementation of an effective corrective solution.
The instrumental temperature-dependence can introduce artifacts that obscure or mimic real environmental changes, increasing misinterpretation risks. Seasonal fluctuations in seawater temperature, for example, may cause significant variations of measured BS values that are unrelated to actual changes in seabed properties. In addition, this complicates cross-calibration over natural reference areas. While SBES-measured BS variation with temperature is minimal and ensures the stability of the reference ARCs, the temperature dependence of MBEs prevents the use of calibration corrections from one survey to another.
The present research recommends a systematic cross-calibration on stable natural reference areas to correct backscatter data, as it inherently accounts for temperature-induced variability. For now, the cross-calibration correction is applied a posteriori; in the future, it could be integrated into the MBES acquisition system to enable real-time calibration of both bottom and water column backscatter measurements.
The BS measurement temperature-dependence observed on KD EM2040 likely extends to other MBESs from other models or manufacturers. Further research is needed to evaluate the extent and implications of temperature effects across a range of current MBESs. This issue complicates further the MBESs factory calibration operations because the calibration results are only valid within the specific temperature range in which it is conducted; nevertheless factory-made calibration, even for one reference temperature, remains a protocol of paramount interest. Despite these previsible difficulties, it can still be hoped that a better understanding of the temperature dependence processes will make possible systematic corrections at the sonar system level. More controlled experiments and cross-system analyses are necessary to develop correction models that could provide solutions to this issue; this should involve efforts from both the manufacturers and the users community concerned by seafloor backscatter measurements using MBES.
Data availability statement
The raw data supporting the conclusions of this article will be made available by the authors, subject to prior approval by the parties concerned.
Author contributions
MR: Conceptualization, Data curation, Formal Analysis, Investigation, Methodology, Project administration, Resources, Software, Supervision, Validation, Visualization, Writing – original draft, Writing – review and editing. TL: Conceptualization, Data curation, Formal Analysis, Investigation, Methodology, Resources, Writing – original draft, Writing – review and editing, Validation. RF: Data curation, Formal Analysis, Investigation, Methodology, Resources, Writing – review and editing. LB: Investigation, Methodology, Writing – original draft, Writing – review and editing. SD: Data curation, Investigation, Methodology, Resources, Writing – review and editing. HB: Data curation, Formal Analysis, Validation, Visualization, Writing – review and editing. AG: Investigation, Resources, Writing – review and editing. KV: Investigation, Resources, Writing – review and editing. JV: Investigation, Resources, Writing – review and editing. KD: Investigation, Resources, Validation, Writing – review and editing. FB: Investigation, Resources, Validation, Writing – review and editing. LF: Formal Analysis, Writing – review and editing. JV: Resources, Writing – review and editing. KE: Conceptualization, Resources, Writing – review and editing. GM: Investigation, Writing – review and editing. XL: Supervision, Writing – original draft, Writing – review and editing. J-MA: Formal Analysis, Methodology, Resources, Software, Visualization, Writing – review and editing.
Funding
The author(s) declare that financial support was received for the research and/or publication of this article. The Belgian Federal Public Service Economy is thanked for taking charge of the article publishing charges (APCs). TL acknowledges funding from the Norwegian Research Council through project 317874.
Acknowledgments
The authors extend their gratitude to the crews of the research vessels RV Belgica, RV Thalia, and HV Sirius for their assistance in data collection at sea. The Institute of Natural Sciences - OD Nature - Measurement Services Ostend is thanked for its technical support. The Belgian Federal Public Service Economy is thanked for its professional support and for enabling the completion of this work.
Conflict of interest
The authors declare that the research was conducted in the absence of any commercial or financial relationships that could be construed as a potential conflict of interest.
The handling editor (PB) declared a past co-authorship with the author (GMG).
Generative AI statement
The author(s) declare that Generative AI was used in the creation of this manuscript. Checking written wording and reformulation in English.
Publisher’s note
All claims expressed in this article are solely those of the authors and do not necessarily represent those of their affiliated organizations, or those of the publisher, the editors and the reviewers. Any product that may be evaluated in this article, or claim that may be made by its manufacturer, is not guaranteed or endorsed by the publisher.
Supplementary material
The Supplementary Material for this article can be found online at: https://www.frontiersin.org/articles/10.3389/frsen.2025.1572545/full#supplementary-material
Footnotes
1 e.g., Kongsberg Discovery’s TVG accounts for Lambert law and normal incidence suppression
References
Amiri-Simkooei, A. R., Koop, L., van der Reijden, K. J., Snellen, M., and Simons, D. G. (2019). Seafloor characterization using multibeam echosounder backscatter data: methodology and results in the North Sea. Geosciences 9 (7), 292. doi:10.3390/geosciences9070292
Arifah, S. N., Manik, H. M., and Mulyadi, D. S. (2023). Multibeam echosounder backscatter strength analysis for seafloor sediment identification in Damar Besar Island Waters, Thousand Islands. IOP Conf. Ser. Earth Environ. Sci. 1251 (1), 012013. doi:10.1088/1755-1315/1251/1/012013
Augustin, J.-M. (2023). SonarScope® software. Ifremer technical report, Brest, France: SEANOE. doi:10.17882/87777
Belgian Law Belgian law on the exploration and exploitation of non-living resources in the territorial sea and continental shelf of 13 June 1969. Available online at: https://www.ejustice.just.fgov.be/cgi_loi/change_lg.pl?language=fr&la=F&cn=1969061330&table_name=loi (Accessed December 16, 2024).
Bodholt, H. (2002). The effect of water temperature and salinity on echo sounder measurements. ICES Symposium on Acoustics in Fisheries, Montpellier June 2002 Paper No 123. 7
Briggs, K. B., Lyons, A. P., Pouliquen, E., Mayer, L. A., and Richardson, M. D. (2005). “Seafloor roughness, sediment grain size, and temporal stability,” International Conference on Underwater Acoustic Measurements: Technologies & Results (Heraklion, Greece). Conference Proceedings. 337–343.
Brown, C. J., and Blondel, P. (2009). Developments in the application of multibeam sonar backscatter for seafloor habitat mapping. Appl. Acoust. 70 (10), 1242–1247. doi:10.1016/j.apacoust.2008.08.004
Butler, J. L., and Sherman, C. H. (2016). Transducers and Arrays for Underwater Sound. 2nd Ed. Switzerland: Springer International Publishing AG. doi:10.1007/978-3-319-39044-4
Chotiros, N. P., Altenburg, R., and Piper, J. (1997). Analysis of acoustic backscatter in the vicinity of the Dry Tortugas. Geo-Marine Lett. 17, 325–334. doi:10.1007/s003670050044
Costa, B. (2019). Multispectral acoustic backscatter: how useful is it for marine habitat mapping and management? J. Coast. Res. 35 (5), 1062–1079. doi:10.2112/jcoastres-d-18-00103.1
De Backer, A., Callens, M., Derycke, S., Festjens, F., Goedefroo, N., Lopez Lopez, L., et al. (2024). Evaluating the ecological effects of sand extraction and optimising monitoring methods for impact assessment, Monitoring report 2021-2024, study day “Gold in the North Sea: the importance of marine sand and innovations in terms of monitoring and research”. 59. Available online at: https://economie.fgov.be/sites/default/files/Files/Entreprises/Sand/Seminar-2024-gold-north-sea-Monitoring-report-2021-2024.pdf.
Degrendele, K., Roche, M., and Barette, F. (2024). Monitoring sand extraction activities and its impacts on the seabed: results, developments and innovations from 2020–2024, monitoring report 2021–2024, study day “gold in the North Sea: the importance of marine sand and innovations in terms of monitoring and research”. Available online at: https://economie.fgov.be/sites/default/files/Files/Entreprises/Sand/Seminar-2024-gold-north-sea-Monitoring-report-2021-2024.pdf. (Accessed May 13, 2025)
Deleu, S., and Roche, M. (2020). KWINTE, a dedicated quality control area in the North Sea with stable seabed. Reference area for multibeam bathymetry and backscatter. Hydro Int. 1, 18–20.
Demer, D. A., Berger, L., Bernasconi, M., Bethke, E., Boswell, K., Chu, D., et al. (2015). Calibration of acoustic instruments. ICES Coop. Res. Rep. No. 326, 133. doi:10.25607/OBP-185
Demer, D. A., Andersen, L. N., Bassett, C., Berger, L., Dezhang, C., Condiotty, J., et al. (2017). 2016 USA–Norway EK80 Workshop Report: evaluation of a wideband echosounder for fisheries and marine ecosystem science. ICES Coop. Res. Rep. 336, 79. doi:10.17895/ices.pub.2318
Demer, D. A., and Renfree, J. S. (2008). Variations in echosounder–transducer performance with water temperature. ICES J. Mar. Sci. 65 (6), 1021–1035. doi:10.1093/icesjms/fsn066
de Moustier, C. (1986). Beyond bathymetry: mapping acoustic backscattering from the deep sea floor with Sea Beam. J. Acoust. Soc. Am. 79 (2), 316–331. doi:10.1121/1.393570
Doonan, I. J., Coombs, R. F., and McClatchie, S. (2003). The absorption of sound in seawater in relation to the estimation of deep-water fish biomass. ICES J. Mar. Sci. 60 (5), 1047–1055. doi:10.1016/s1054-3139(03)00120-6
Eleftherakis, D., Berger, L., Le Bouffant, N., Pacault, A., Augustin, J. M., and Lurton, X. (2018). Backscatter calibration of high-frequency multibeam echosounder using a reference single-beam system, on natural seafloor. Mar. Geophys. Res. 39, 55–73. doi:10.1007/s11001-018-9348-5
Feldens, P., Schulze, I., Papenmeier, S., Schönke, M., and Schneider von Deimling, J. (2018). Improved interpretation of marine sedimentary environments using multi-frequency multibeam backscatter data. Geosciences 8 (6), 214. doi:10.3390/geosciences8060214
Ferrini, V. L., and Flood, R. D. (2006). The effects of fine-scale surface roughness and grain size on 300 kHz multibeam backscatter intensity in sandy marine sedimentary environments. Mar. Geol. 228 (1-4), 153–172. doi:10.1016/j.margeo.2005.11.010
Fezzani, R., and Berger, L. (2023). Creation of a reference area for backscatter calibration of shallow and medium depth multibeam sounders. Ifremer Intern. Rep. ASTI-2023-300, 24.
Fezzani, R., Berger, L., Le Bouffant, N., Fonseca, L., and Lurton, X. (2021). Multispectral and multiangle measurements of acoustic seabed backscatter acquired with a tilted calibrated echosounder. J. Acoust. Soc. Am. 149 (6), 4503–4515. doi:10.1121/10.0005428
Fonseca, L., Lurton, X., Fezzani, R., Augustin, J. M., and Berger, L. (2021). A statistical approach for analyzing and modeling multibeam echosounder backscatter, including the influence of high-amplitude scatterers. J. Acoust. Soc. Am. 149 (1), 215–228. doi:10.1121/10.0003045
François, R. E., and Garrison, G. R. (1982a). Sound absorption based on ocean measurements: Part I: pure water and magnesium sulfate contributions. J. Acoust. Soc. Am. 72 (3), 896–907. doi:10.1121/1.388170
François, R. E., and Garrison, G. R. (1982b). Sound absorption based on ocean measurements. Part II: boric acid contribution and equation for total absorption. J. Acoust. Soc. Am. 72 (6), 1879–1890. doi:10.1121/1.388673
Gaida, T. C. (2020). Acoustic mapping and monitoring of the seabed: from single-frequency to multispectral multibeam backscatter. Dissertation. TU Delft: Delft University of Technology. doi:10.4233/uuid:52b8e925-b619-45f8-9056-39454e82fe02
Gaida, T. C., Mohammadloo, T. H., Snellen, M., and Simons, D. G. (2019). Mapping the seabed and shallow subsurface with multi-frequency multibeam echosounders. Remote Sens. 12 (1), 52. doi:10.3390/rs12010052
Goff, J. A., Olson, H. C., and Duncan, C. S. (2000). Correlation of side-scan backscatter intensity with grain-size distribution of shelf sediments, New Jersey margin. Geo-Marine Lett. 20 (1), 43–49. doi:10.1007/s003670000032
Hammerstad, E. (2000). Backscattering and seabed image reflectivity. Horten, Norway: Kongsberg Maritime AS Technical Note, 5.
Hughes Clarke, J. E. (2015). “Multispectral acoustic backscatter from multibeam, improved classification potential,” United States Hydrographic Conference. (San Diego, CA). Conference Proceedings. 16–19.
Hughes Clarke, J. E., Iwanowska, K. K., Parrott, R., Duffy, G., Lamplugh, M., and Griffin, J. (2008). “Inter-calibrating multi-source, multi-platform backscatter data sets to assist in compiling regional sediment type maps: Bay of Fundy,” Canadian Hydrographic and National Surveyors Conference (Victoria, BC). Paper 8-2. Conference proceedings. 26–29.
Kint, L., Barette, F., Degrendele, K., Roche, M., and Van Lancker, V. (2023). Sediment variability in intermittently extracted sandbanks in the Belgian part of the North Sea. Front. Earth Sci. 11, 1154564. doi:10.3389/feart.2023.1154564
Knudsen, H. P. (2009). Long-term evaluation of scientific-echosounder performance. ICES J. Mar. Sci. 66 (6), 1335–1340. doi:10.1093/icesjms/fsp025
Kongsberg-Discovery (2020). Kongsberg EM 2040 Multibeam echo sounder Software, Release 1.9.0. Horten, Norway: Kongsberg technical document.
Kongsberg-Discovery (2021). EM 2040 MKII data sheet. Available online at: https://www.kongsberg.com/globalassets/kongsberg-discovery/commerce/seafloor-mapping/em2040-mkii/em-2040-mkii-data-sheet.pdf (Accessed December 16, 2024).
Krabbendam, J. M., Roche, M., Van Lancker, V. R., Nnafie, A., Terseleer, N., Degrendele, K., et al. (2022). Do tidal sand waves always regenerate after dredging? Mar. Geol. 451, 106866. doi:10.1016/j.margeo.2022.106866
Ladroit, Y., Lamarche, G., and Pallentin, A. (2018). Seafloor multibeam backscatter calibration experiment: comparing 45°-tilted 38-kHz split-beam echosounder and 30-kHz multibeam data. Mar. Geophys. Res. 39, 41–53. doi:10.1007/s11001-017-9340-5
Lamarche, G., and Lurton, X. (2018). Recommendations for improved and coherent acquisition and processing of backscatter data from seafloor-mapping sonars. Mar. Geophys. Res. 39 (1), 5–22. doi:10.1007/s11001-017-9315-6
Le Bouffant, N., Berger, L., and Fezzani, R. Using seafloor echo-integrated backscatter for monitoring single beam echosounder calibration. Submitted to Front. Remote Sens. Special Issue Multibeam Echosounder Backscatter: Advances and Applications.
Lecours, V., Misiuk, B., Butschek, F., Blondel, P., Montereale-Gavazzi, G., Lucieer, V. L., et al. (2025). Identifying community-driven priority questions in acoustic backscatter research. Front. Remote Sens. 5, 1484283. doi:10.3389/frsen.2024.1484283
Levitus, S., Antonov, J. I., Baranova, O. K., Boyer, T. P., Coleman, C. L., Garcia, H. E., et al. (2013). The World Ocean Database. Data Sci. J. 12 (0), WDS229–WDS234. doi:10.2481/dsj.wds-041
Lopez Lopez, L., Degrendele, K., Roche, M., Barette, F., Van Lancker, V., Terseleer, N., et al. (2025). Macrobenthos and morpho-sedimentary recovery dynamics in areas following aggregate extraction cessation. Mar. Pollut. Bull. doi:10.2139/ssrn.5214303
Lucieer, V., Roche, M., Degrendele, K., Malik, M., Dolan, M., and Lamarche, G. (2018). User expectations for multibeam echo sounders backscatter strength data-looking back into the future. Mar. Geophys. Res. 39, 23–40. doi:10.1007/s11001-017-9316-5
Lurton, X., Lamarche, G., Brown, C., Lucieer, V., Rice, G., Schimel, A., and Weber, T. (2015). Backscatter measurements by seafloor-mapping sonars. Guidelines and recommendations. 200. doi:10.5281/zenodo.10089261
Malik, M., Lurton, X., and Mayer, L. (2018). A framework to quantify uncertainties of seafloor backscatter from swath mapping echosounders. Mar. Geophys. Res. 39, 151–168. doi:10.1007/s11001-018-9346-7
Malik, M., Schimel, A. C., Masetti, G., Roche, M., Le Deunf, J., Dolan, M. F., et al. (2019). Results from the first phase of the seafloor backscatter processing software inter-comparison project. Geosciences 9 (12), 516. doi:10.3390/geosciences9120516
Meetnet Vlaamse Banken. (2025). Meetnet Vlaamse banken - published by agency for maritime Services and coast. Available online at: https://meetnetvlaamsebanken.be. (Accessed May 13, 2025)
Montereale-Gavazzi, G. (2019). Development of seafloor mapping strategies supporting integrated marine management: application of seafloor backscatter by multibeam echosounders. Doctoral dissertation. Ghent. University of Ghent.
Montereale-Gavazzi, G., Roche, M., Degrendele, K., Lurton, X., Terseleer, N., Baeye, M., et al. (2019). Insights into the short-term tidal variability of multibeam backscatter from field experiments on different seafloor types. Geosciences 9 (1), 34. doi:10.3390/geosciences9010034
Montereale-Gavazzi, G., Roche, M., Lurton, X., Degrendele, K., Terseleer, N., and Van Lancker, V. (2018). Seafloor change detection using multibeam echosounder backscatter: case study on the Belgian part of the North Sea. Mar. Geophys. Res. 39, 229–247. doi:10.1007/s11001-017-9323-6
Mopin, I., Le Chenadec, G., Legris, M., Blondel, P., Zerr, B., and Marchal, J. (2024). Metrology of the acoustic seafloor response: how to accurately estimate backscatter and its intrinsic uncertainty using single-beam echosounder. in ICUA2024, 46, Pt1. Milton Keynes, U.K: Proceedings of the Institute of Acoustics.
MSFD (2008). Marine Strategy framework directive 2008/56/EC of the European parliament and of the Council. Available online at: https://eur-lex.europa.eu/legal-content/EN/TXT/?uri=celex:32008L0056 (Accessed May 13, 2025).
Novarini, J. C., and Caruthers, J. W. (1998). A simplified approach to backscattering from a rough seafloor with sediment inhomogeneities. IEEE J. Ocean. Eng. 23 (3), 157–166. doi:10.1109/48.701188
Physical State. (2023). Physical state of the Sea - Belgian coastal zone - COHERENS UKMO model. Available online at: https://erddap.naturalsciences.be/erddap/griddap/BCZ_HydroState_V1.html (Accessed May 13, 2025).
Pratomo, D. G., Hariyanto, I. H., Putri, N. A., Mudita, I., Hariyanto, D., Safi, A. F., et al. (2023). Multitemporal acoustic backscatter data analysis to monitor the dynamics of seabed surface sediments. Int. J. Adv. Sci. Eng. and Inf. Technol. 13 (6), 2073–2080. doi:10.18517/ijaseit.13.6.18675
Roche, M., Degrendele, K., Vrignaud, C., Loyer, S., Le Bas, T., Augustin, J. M., et al. (2018). Control of the repeatability of high frequency multibeam echosounder backscatter by using natural reference areas. Mar. Geophys. Res. 39, 89–104. doi:10.1007/s11001-018-9343-x
Runya, R. M., McGonigle, C., and Quinn, R. (2020). Examining the links between multi-frequency backscatter, geomorphology and benthic habitat associations in Marine Protected Areas, EGU General Assembly 2020, EGU2020-22399. doi:10.5194/egusphere-egu2020-22399
Schimel, A. C., Beaudoin, J., Parnum, I. M., Le Bas, T., Schmidt, V., Keith, G., et al. (2018). Multibeam sonar backscatter data processing. Mar. Geophys. Res. 39 (1), 121–137. doi:10.1007/s11001-018-9341-z
Schulze, I., Gogina, M., Schönke, M., Zettler, M. L., and Feldens, P. (2022). Seasonal change of multifrequency backscatter in three Baltic Sea habitats. Front. Remote Sens. 3, 956994. doi:10.3389/frsen.2022.956994
Service Hydrographique et Océanographique de la Marine (2008). “Rade de Brest, 7400”. SHOM publication 1995 n°2, 1: 22 500 (Brest, France).
Simmonds, J., and Maclennan, D. N. (2007). Fisheries Acoustics: Theory and Practice. 2nd ed. Hoboken, NJ, USA: Blackwell Publishing Ltd. 252. doi:10.1002/9780470995303
Stanic, S., Briggs, K. B., Fleischer, P., Sawyer, W. B., and Ray, R. I. (1989). High-frequency acoustic backscattering from a coarse shell ocean bottom. J. Acoust. Soc. Am. 85 (1), 125–136. doi:10.1121/1.397720
Stanton, T. K., Chu, D., Wiebe, P. H., Eastwood, R. L., and Warren, J. D. (2000). Acoustic scattering by benthic and planktonic shelled animals. J. Acoust. Soc. Am. 108 (2), 535–550. doi:10.1121/1.429584
Viberg, M., Lanne, M., and Lundgren, A. (2009). “Calibration in array processing,” in Classical and Modern Direction-of-Arrival Estimation. Burlington, USA: Academic Press. 93–124.
Vlaamse Hydrografie (2014). Belgische Noordzee van De panne tot Knokke-Heist BNZ, 1:100 000 scale. Oostende, Belgium: Vlaamse Hydrografie Publication.
Weber, T. C., Rice, G., and Smith, M. (2018). Toward a standard line for use in multibeam echo sounder calibration. Mar. Geophys. Res. 39, 75–87. doi:10.1007/s11001-017-9334-3
Wendelboe, G., Dahl, H., Maillard, E., and Bjorno, L. (2012). “Towards a fully calibrated multibeam echosounder,” in Proceedings of Meetings on Acoustics, 070025. doi:10.1121/1.4767979
Wyns, L., Roche, M., Barette, F., Van Lancker, V., Degrendele, K., Hostens, K., et al. (2021). Near-field changes in the seabed and associated macrobenthic communities due to marine aggregate extraction on tidal sandbanks: a spatially explicit bio-physical approach considering geological context and extraction regimes. Cont. Shelf Res. 229, 104546. doi:10.1016/j.csr.2021.104546
Keywords: multibeam echosounder, backscatter, temperature-dependence, calibration, reference area
Citation: Roche M, Lønmo TIB, Fezzani R, Berger L, Deleu S, Bisquay H, Gaillot A, Vanparys K, Vercaemst J, Degrendele K, Barette F, Fonseca LE, Verstraeten J, Echholt Nilsen K, Montereale-Gavazzi G, Lurton X and Augustin J-M (2025) Instrumental temperature-dependence of backscatter measurements by a multibeam echosounder: findings and implications. Front. Remote Sens. 6:1572545. doi: 10.3389/frsen.2025.1572545
Received: 07 February 2025; Accepted: 08 May 2025;
Published: 30 May 2025.
Edited by:
Philippe Blondel, University of Bath, United KingdomReviewed by:
Derek R. Olson, Naval Postgraduate School, United StatesGorm Wendelboe, Teledyne Reson, Denmark
Copyright © 2025 Roche, Lønmo, Fezzani, Berger, Deleu, Bisquay, Gaillot, Vanparys, Vercaemst, Degrendele, Barette, Fonseca, Verstraeten, Echholt Nilsen, Montereale-Gavazzi, Lurton and Augustin. This is an open-access article distributed under the terms of the Creative Commons Attribution License (CC BY). The use, distribution or reproduction in other forums is permitted, provided the original author(s) and the copyright owner(s) are credited and that the original publication in this journal is cited, in accordance with accepted academic practice. No use, distribution or reproduction is permitted which does not comply with these terms.
*Correspondence: Marc Roche, bWFyYy5yb2NoZUBlY29ub21pZS5mZ292LmJl