 Colby F. Rand
 Alia L. Khan
- Department of Environmental Sciences, College of the Environment, Western Washington University, Bellingham, WA, United States
Snow algae play an important role in reducing the surface albedo of snow surfaces worldwide and contributing to enhanced melt through a bio-albedo feedback loop. Traditional remote sensing approaches have relied on government-operated satellite platforms, such as Landsat and Sentinel-2, which provide freely available data but are limited by their coarse spatial resolution. Recent advancements in commercial satellite technologies, particularly SmallSats, offer higher spatial and temporal resolutions, enabling more precise detection and mapping of snow algae. This study evaluates the capabilities of commercial satellites, including SkySat, PlanetScope, BlackSky, and WorldView, for snow algae mapping on Mt. Baker, Washington, United States. Leveraging data from NASA’s Commercial SmallSat Data Acquisition (CSDA) program, we apply spectral indices to classify snow algae. Our findings highlight the advantages and limitations of commercial SmallSats compared to traditional government-operated satellites, emphasizing their potential for improving snow algae mapping in ecological and climate studies. The results of this study provide insights into the role of high spatial resolution commercial satellite imagery in advancing our understanding of snow algae distribution and its broader implications for climate feedback mechanisms.
1 Introduction
Snow algae are microscopic organisms inhabiting snow and ice surfaces worldwide and can form algal blooms up to hundreds of square meters in size (Davey et al., 2019). They typically appear bright red or green, depending on their taxonomy and pigments (Gray et al., 2020; Skiles et al., 2018). Snow algae serves as a light-absorbing particle (LAP) that plays a significant role in lowering the albedo of snow surfaces, which refers to the ratio of reflected to incident solar radiance (Flanner et al., 2007; Hotaling, 2021). This albedo reduction accelerates snowmelt by as much as 40% (Cook et al., 2020; Engstrom et al., 2022; Warren and Wiscombe, 1980). Since snow algae require liquid water to grow, this meltwater production facilitates increased algal growth, further reducing snow and ice surface albedo (Skiles et al., 2018). This creates a bio-albedo feedback loop, which is expected to further intensify with a warming climate and a longer melt season (Healy and Khan, 2023; Khan et al., 2021). Mapping the spatial and temporal distribution of snow algae is therefore crucial for understanding their ecological significance and role in broader climate dynamics.
Early efforts to map snow algae relied primarily on ground-based observations and airborne remote sensing, which were often labor-intensive and limited in their spatial coverage. The first study to remotely detect and quantify snow algae concentrations used the NASA/JPL AVIRIS (Airborne Visible Infrared Imaging Spectrometer), mounted on a Twin Otter airplane and flown over the Sierra Nevada in California, USA (Painter et al., 2001). Since this first study was conducted in 2001, advances in satellite remote sensing technologies have allowed researchers to detect and map snow algae around the globe, including in remote areas that would have been difficult to reach in person. Initial studies utilized government-operated satellite platforms such as Landsat, Sentinel-2, and SPOT (Satellite Probatoire d’Observation de la Terre) to detect snow algae based on their unique spectral signatures (Di Mauro et al., 2020; Engstrom et al., 2022; Engstrom and Quarmby, 2023; Ganey et al., 2017; Gray et al., 2020; Hisakawa et al., 2015; Huovinen et al., 2018; Takeuchi et al., 2006). These government-operated satellite platforms (SPOT was initially operated by the French Space Agency but is now owned and operated by Airbus Defence and Space, making SPOT a commercially operated system today) are widely used in remote sensing studies because their data are freely available and accessible, enabling researchers to conduct studies without financial barriers. However, a primary disadvantage of these government-operated satellite platforms is their relatively low spatial resolution, which can limit their ability to delineate small-scale algae blooms and other fine features accurately.
The rise of commercial satellites has advanced the field of remote sensing by introducing higher spatial resolutions and faster revisit times. In a 2021 study, researchers used high-resolution WorldView-2 and WorldView-3 satellites to track the growth of Antarctic snow algae blooms (Gray et al., 2021). They found that the high spatial resolution of the WorldView imagery (1.24–1.84 m/pixel) allowed them to detect small snow algae blooms where it was simply not possible with coarser spatial resolution Sentinel-2 imagery (10 m/pixel). Due to the novel ability of WorldView to detect small algae blooms, the researchers calculated that the total snow algae-covered area was 17.5 times greater than estimated with Sentinel-2 imagery. This suggests that the total snow algae-covered area in regions such as Antarctica may be far greater than previously estimated by the coarse spatial resolution imagery captured by government-operated satellites such as Sentinel-2 (Gray et al., 2021; 2020).
In recent years, the emergence of SmallSats (small satellites) by commercial satellite companies has further revolutionized the field of satellite remote sensing through greater cost-efficiency, even higher spatial and temporal resolutions, and improved flexibility (Curnick et al., 2022). SmallSats typically weigh less than 200 kg, which is much lighter than traditional satellites, making them cheaper to design, build, and launch. They are deployed as part of large constellations, where multiple satellites work in sync to monitor specific regions on Earth. These satellites are positioned in low Earth orbit (450–700 km above Earth’s surface) and are aligned to ensure consistent and widespread data coverage (Polat et al., 2016). PlanetScope and SkySat, operated by Planet Labs, are examples of SmallSats that capture imagery with greater spatial and temporal resolutions than traditional satellites, including WorldView. These SmallSats are, therefore, capable of detecting and mapping snow algae and other small-scale features in even greater detail.
In this study, we leverage imagery from NASA’s Commercial SmallSat Data Acquisition (CSDA) program to evaluate the performance of commercial satellite platforms for detecting and mapping snow algae on Mt. Baker, Washington, United States. Specifically, we will look at data from the following SmallSats: PlanetScope, SkySat, WorldView, and BlackSky. These satellites vary in spatial resolution, spectral coverage, and revisit frequency, offering a diverse range of data to assess. By comparing commercial SmallSats to traditional government-operated platforms, we aim to identify their strengths and limitations for snow algae mapping in the context of ecological and climate research.
2 Materials and methods
2.1 Commercial satellites
2.1.1 PlanetScope
First launched in 2016, PlanetScope is a constellation of over 200 SmallSats called Doves. New Doves are launched yearly, gradually increasing the number of SmallSats in orbit. The vast number of Doves in orbit allows the constellation to provide repeat daily coverage. Compared to other SmallSats, PlanetScope provides medium-resolution imagery (3–4 m/pixel). PlanetScope has a variable spectral resolution depending on the SmallSat generation. The initial Dove satellites collect imagery with four multispectral bands: blue, green, red, and near-infrared (NIR). The newer SuperDove satellites collect imagery with eight multispectral bands: coastal blue, blue, green I, green, yellow, red, red-edge, and NIR. The temporal resolution is 12 bits. Individual scenes have an image footprint of ∼400 km2, which is large enough to image the entirety of Mt. Baker in a single scene. PlanetScope is operated by Planet Labs, a commercial satellite imaging company based in San Francisco, CA, United States.
2.1.2 SkySat
First launched in 2013, SkySat is a constellation of 21 SmallSats operated by Planet Labs, designed to provide sub-daily revisit capabilities. On average, SkySat achieves six to seven revisits per day globally, with a maximum of 12 revisits in certain regions. SkySat offers the highest spatial resolution available for multispectral satellite imagery at 0.5 m/pixel. These SmallSats collect imagery in four multispectral bands: blue, green, red, and near-infrared (NIR), with a radiometric resolution of 16 bits. At nadir, individual scenes have a swath width ranging from 5.5 to 8 km, depending on the satellite generation. Planet Labs also provides a “Collect” product, which combines ∼60 scenes into a mosaic. A single SkySat Collect product can image the majority of Mt. Baker but not the mountain in its entirety.
2.1.3 Worldview
The WorldView series is a constellation of traditional Earth observation satellites owned by Maxar Technologies. WorldView-1 was launched in 2007 and only captures panchromatic imagery. WorldView-2, launched in 2009, captures 8-band multispectral imagery in the visible to near-infrared (VNIR) wavelengths with a spatial resolution of 1.85 m/pixel at nadir. WorldView-3, launched in 2014, captures 8-band multispectral imagery in the VNIR wavelengths with a spatial resolution of 1.24 m/pixel at nadir, 8-band imagery in the shortwave-infrared (SWIR) wavelengths at a spatial resolution of 3.70 m at nadir, and additional bands to measure atmospheric properties. WorldView-4 was launched in 2016 but is no longer operational.
2.1.4 BlackSky
First launched in 2016, BlackSky is a constellation of 60 SmallSats operated by BlackSky Global. These SmallSats collect 3-band (blue, green, red) multispectral imagery at a spatial resolution of 0.83–1.3 m/pixel (depending on the satellite generation). BlackSky’s next-generation Gen-3 satellites are expected to produce images with up to 0.35 m/pixel spatial resolution. BlackSky has the highest revisit rate of any SmallSat constellation, with a peak of 15 visits per day over certain locations.
2.2 Study site
Mt. Baker (3,286 m above sea level) is an active stratovolcano located in the Cascade Range of Washington State, USA (Figure 1). It is located approximately 50 km east of the Pacific Ocean, influencing its climate and bringing extremely high snowfall (Pelto, 1988). During the 1998–1999 winter, the nearby Mt. Baker Ski Area reported world record snowfall total of 1140 inches (30 m) in a single season (Leffler et al., 2001). Mt. Baker is an ideal study site due to its extensive snowfields and temperate alpine conditions that support snow algae growth. In recent years, a large red algae bloom has been observed growing on the Mazama glacier during the summer melt season. This bloom’s shape, temporal distribution, and intensity change each year.
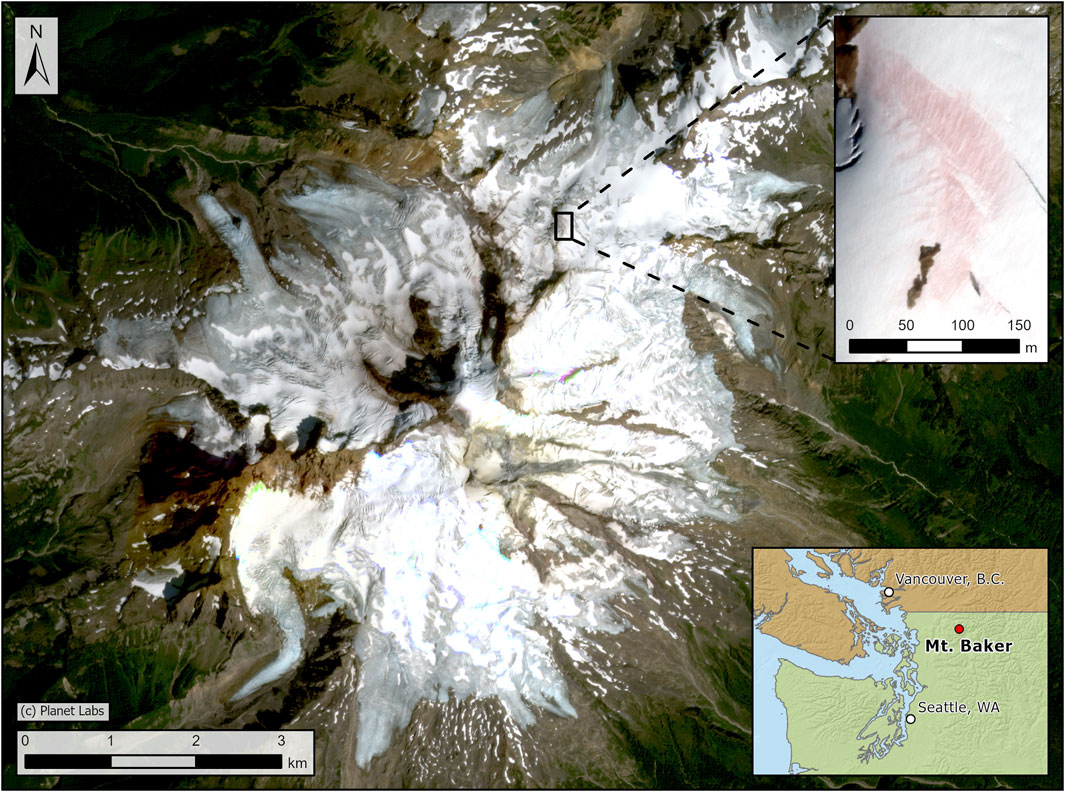
Figure 1. General reference map of Mt. Baker, Washington. The image of Mt. Baker was captured by a PlanetScope satellite on 17 August 2023 (Image ID: 20230817_181503_365_242d). The inset map in the upper right shows a large red algae bloom on the Mazama Glacier. This image was captured by a SkySat satellite on 4 August 2023 (Image ID: 20230804_180324_ssc2_u0001). The locator map in the bottom right shows Mt. Baker’s location in Northwest Washington, United States.
2.3 Snow algae classification
Applying spectral indices that calculate the relative difference in surface reflectivity between the red and green bands of multispectral satellite imagery allows for the detection and mapping of red snow algae (Engstrom et al., 2022; Engstrom and Quarmby, 2023; Ganey et al., 2017; Hisakawa et al., 2015; Takeuchi et al., 2006). In this study, we apply the red-green normalized difference (RGND) index to classify red snow algae, as shown in Equation 1:
where
Previous studies applied this index to Sentinel-2 imagery with a threshold of 0.025 (Engstrom et al., 2022; Engstrom and Quarmby, 2023), or 0.035 for intense blooms (Roussel et al., 2024). However, we found that when applied to multispectral imagery from other satellite sensors, a single threshold was unable to reliably classify snow algae blooms across various images. This may be due to differing satellite characteristics, such as the specific wavelengths captured by each band, or differences in lighting conditions in individual images. As an example, an RGND threshold of 0.025 accurately classified red snow algae on Mt. Baker in a Sentinel-2 image from 13 August 2023 (S2A_MSIL2A_20230813T190921_N0509_R056_T10UEV_20230814T022557.SAFE). In comparison, a SkySat image of Mt. Baker from 4 August 2023 (20230804_180324_ssc2_u0001) required a higher RGND threshold value of 0.06 to achieve an accurate classification. If a threshold value of 0.025 was used on this SkySat image, the entire snow-covered area would have been misclassified as snow algae. To address this classification variability, the RGND threshold was determined separately for each image by systematically testing multiple threshold values and selecting the one that best delineated algae blooms based on visual interpretation of the imagery and classified algae extent.
A known limitation of the RGND index is its inability to differentiate between red snow algae and dirty snow with high mineral dust content, as both exhibit similar spectral signatures in the red and green wavelengths (Di Mauro et al., 2024; Hisakawa et al., 2015; Huovinen et al., 2018; Painter et al., 2001). To address this, the green-blue normalized difference (GBND) index was applied, as shown in Equation 2:
where
Non-snow-covered areas, such as rock, crevasses, and vegetation were also filtered from our classification. The traditional method of classifying snow-covered areas is through the application of the normalized difference snow index (NDSI), as shown in Equation 3:
where
The commercial SmallSats analyzed in this study do not contain a SWIR band, and as such, are unable to compute the NDSI index. As an alternative method, a simple threshold can be applied to the blue band to remove non-snow-covered areas from our classification. Since snow has a very high albedo, snow-covered pixels will have a high blue band reflectance, and rock/vegetation pixels with have a lower blue band reflectance. Therefore, placing a threshold between these two classes can differentiate the two. Since lighting conditions can vary across satellite sensors, and even individual images from a single satellite, the threshold should be selected by systematically testing multiple threshold values and selecting the one that best classifies snow-covered areas.
One image from each of the six satellite sensors was classified using the following equations in ArcGIS Pro V3.4.0:
The selected satellite images (image IDs and dates shown in Figures 2–4) were chosen to be as close in date as possible; however, limitations in image availability, revisit frequency, tasking constraints, and cloud cover prevented a perfectly synchronized dataset. The SkySat image (4 August 2023) was prioritized as it captured the Mazama Glacier algae bloom at peak intensity and spatial coverage. While a BlackSky image from the 2023 melt season would have been ideal, none were available in our archive, so the closest alternative was from 26 July 2022, when the bloom was less intense. The PlanetScope image (17 August 2023) was the nearest cloud-free image that also covered the entirety of Mt. Baker. Similarly, the WorldView-3 image (8 September 2023) was the closest available to the SkySat acquisition. Given the longer revisit frequencies of Sentinel-2 and Landsat-8 compared to SmallSats, the closest cloud-free images covering Mt. Baker were selected: Sentinel-2 (13 August 2023) and Landsat-8 (16 August 2023).
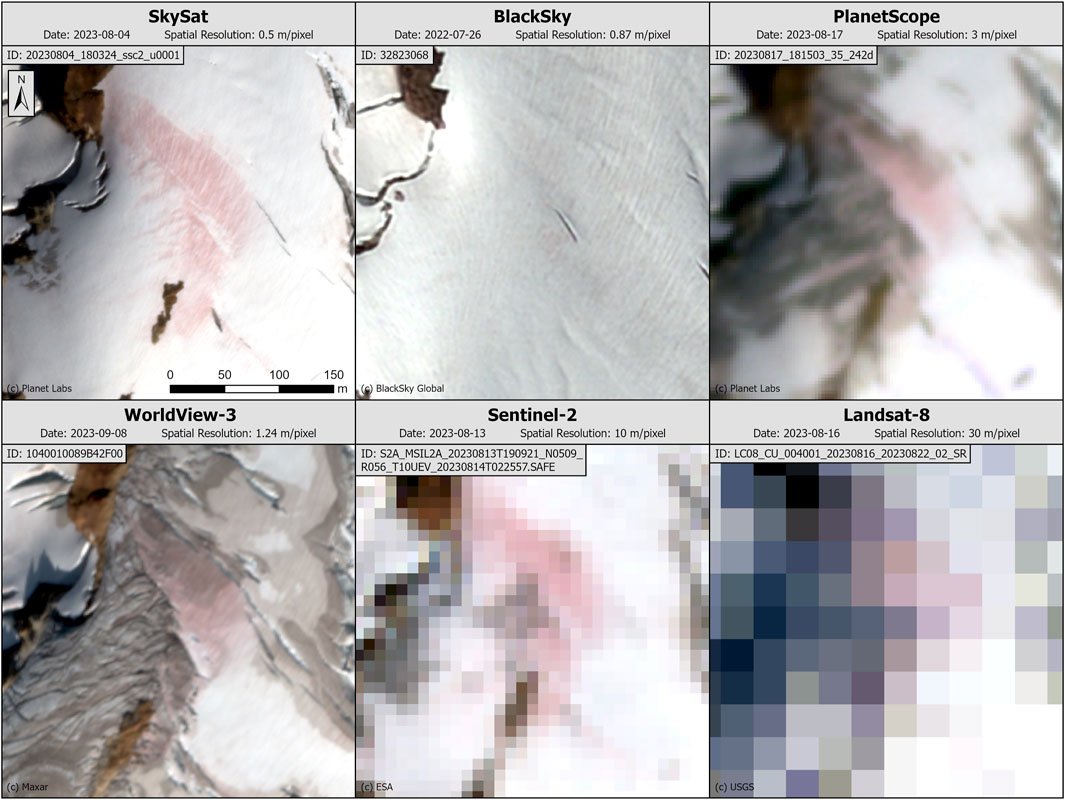
Figure 2. The impact of spatial resolution on visualizing a red snow algae bloom on the Mazama glacier, Mt. Baker, WA. The top row shows commercial SmallSats (SkySat, BlackSky, and PlanetScope), while the bottom row displays traditional satellites (WorldView-3, Sentinel-2, and Landsat-8). SkySat, with its 0.5-m spatial resolution (the highest among Earth observing satellites), is best suited for capturing fine-scale details such as snow algae blooms. All images are shown at the same scale and extent, with the scale bar and north arrow from the SkySat image applying to all. Note: Images were acquired on different dates and are not directly comparable.
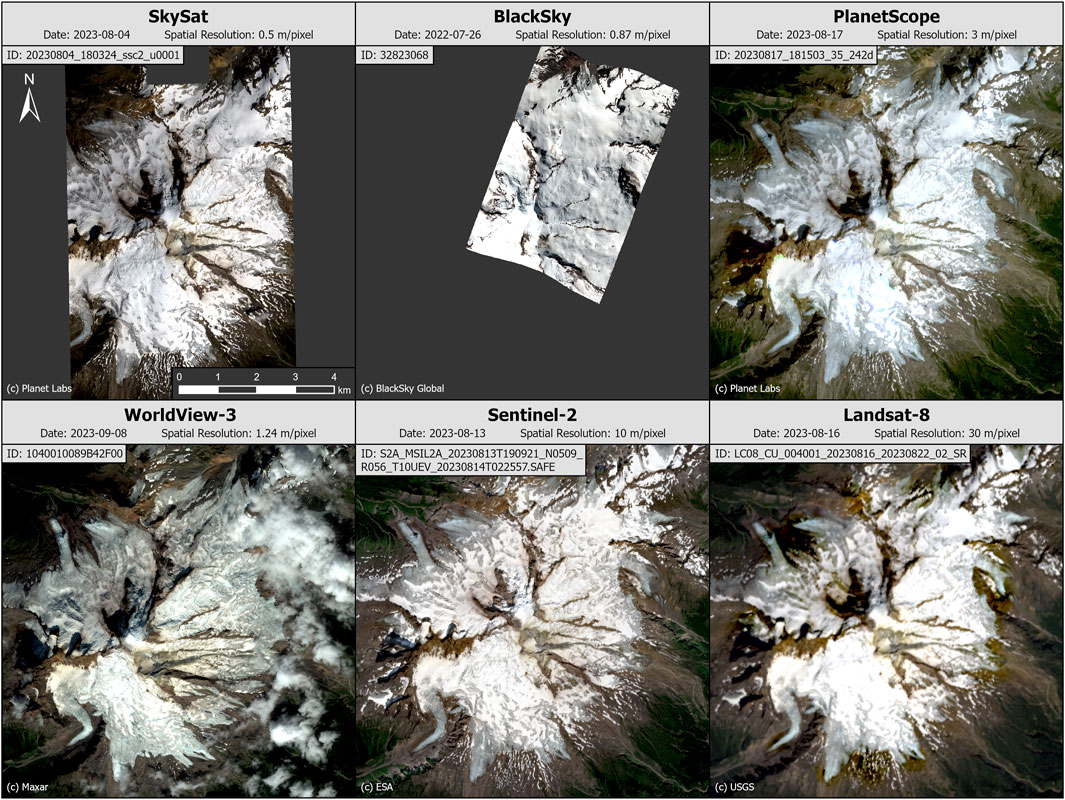
Figure 3. Comparison of image footprints in satellite imagery of Mt. Baker, WA. SkySat and BlackSky have high spatial resolution but limited coverage, capturing only a portion of the glacierized area. In contrast, PlanetScope, WorldView-3, Sentinel-2, and Landsat-8 provide full coverage of the mountain, highlighting the trade-off between spatial resolution and image footprint. All images are shown at the same scale and extent, with the scale bar and north arrow from the SkySat image applying to all.
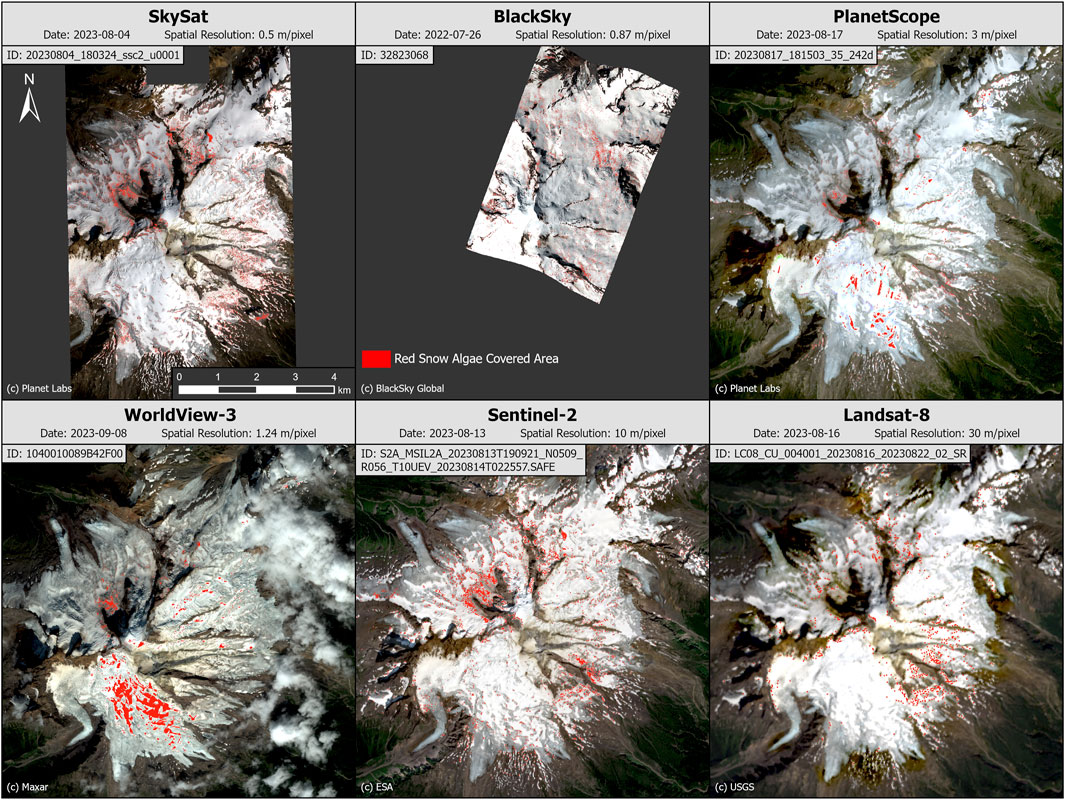
Figure 4. Red snow algae blooms mapped using a combination of the RGND, GBND, NDSI, and/or blue-band thresholding indices, with threshold values for each index varying on a per-image-basis. The specific equations used are described in the Methods section. The top row displays imagery from commercial SmallSats (SkySat, BlackSky, and PlanetScope), while the bottom row shows imagery from traditional satellites (WorldView-3, Sentinel-2, and Landsat-8). All images are shown at the same scale and extent, with the scale bar and north arrow from the SkySat image applying to all. Note: Images were acquired on different dates and are not directly comparable.
3 Results and discussion
3.1 Differences in spatial resolution and image footprint
Accurately mapping fine-scale features, such as the spatial distribution of snow algae blooms, requires high spatial resolution multispectral imagery. Among the commercial satellites evaluated in this study, SkySat offers the highest spatial resolution at 0.5 m/pixel, making it the most effective for delineating the bloom boundaries, distribution patterns, and changes over time to the red snow algae bloom on the Mazama glacier, Mt. Baker, WA. BlackSky provides the second highest resolution at 0.87–1.3 m/pixel, followed by WorldView-3 (1.24 m/pixel), and PlanetScope (3 m/pixel). These commercial satellites offer significantly higher spatial resolutions than the widely used government-funded platforms such as Sentinel-2 and Landsat-8. Figure 2 illustrates the spatial resolution of each satellite and their ability to visualize the Mazama red snow algae bloom.
Lower resolution sensors, such as Sentinel-2 and Landsat-8, are more susceptible to mixed pixels, where a single pixel contains contributions from multiple surface types (e.g., snow, ice, rock, dark crevasses). This blending effect reduces classification accuracy because spectral signatures become averaged, making it difficult to distinguish pure snow algae pixels from surrounding features. In contrast, higher-resolution sensors capture finer details and minimize the influence of mixed pixels, improving the precision of bloom delineation.
Despite the advantages of high spatial resolution imagery, one key limitation of commercial SmallSats is their relatively small image footprints. Neither SkySat nor BlackSky can capture the entire glacierized area of Mt. Baker in a single image, and as such, are unable to calculate the total snow-covered area, light absorbing particle (LAP)-covered area, or red snow algae-covered area of the mountain from a single image. PlanetScope, Worldview-3, Sentinel-2, and Landsat-8, by contrast, can image the entire glacierized area of the mountain and calculate these metrics (Figure 3).
3.2 Mapping red snow algae covered area with spectral indices
The spatial distribution of red snow algae on Mt. Baker was mapped using a combination of the red-green normalized difference (RGND) index, the green-blue normalized difference (GBND) index, the normalized difference snow index (NDSI), and/or the blue thresholding method. These indices were applied to SkySat, BlackSky, PlanetScope, WorldView-3, Sentinel-2, and Landsat-8 images. Snow algae was mapped across the entirety of the glacierized area of Mt. Baker, with pixels classified as red snow algae shown in red (Figure 4).
SmallSats’ enhanced spatial resolution enables more precise delineation of individual algae blooms, such as the recurring snow algae bloom on the Mazama Glacier. This increased precision improves estimates of the total snow algae-covered area at both the individual bloom and mountain scale. Figure 5 illustrates this advantage, demonstrating how SkySat (0.5 m spatial resolution) more accurately maps the extent of the Mazama Glacier algae bloom compared to the widely used Sentinel-2 (10 m spatial resolution). In the classified images, the total snow algae-covered area is 19,671 m2 for SkySat and 20,800 m2 for Sentinel-2. However, since these images were acquired 9 days apart, the snow algae-covered area is not directly comparable.
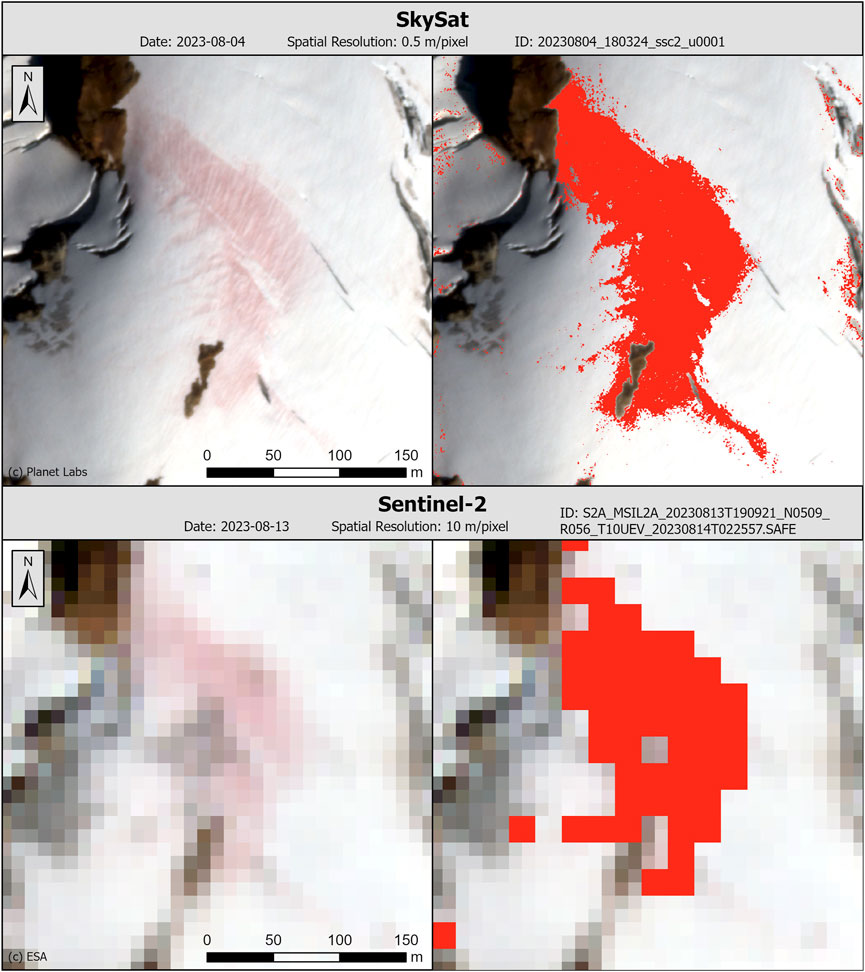
Figure 5. Mazama Glacier red snow algae bloom mapped in SkySat and Sentinel-2 imagery. The higher spatial resolution SkySat sensor (0.5 m/pixel) enables more accurate delineation of the bloom extent than the lower resolution Sentinel-2 sensor (10 m/pixel).
Classifying snow-covered area is a critical preprocessing step for mapping snow algae, as it filters out non-snow surfaces such as rock, vegetation, and crevasses. The normalized difference snow index (NDSI) is the most accurate method for snow classification; however, commercial SmallSats lack a shortwave infrared (SWIR) band, which is necessary for calculating NDSI. As an alternative, a threshold on the blue band was used, but this approach is less reliable, particularly in mountainous terrain such as Mt. Baker, where shadows are common. In shadowed areas, surface reflectance is lower, which can lead to the under classification of snow-covered regions. Additionally, light-colored rocks with a high albedo may reflect more light than some dirty snow surfaces, leading to their misclassification as snow. The blue thresholding method was applied to the imagery from SmallSats (SkySat, BlackSky, and PlanetScope), and NDSI was applied to the imagery from traditional satellites (WorldView-3, Sentinel-2, and Landsat-8). These classified layers were clipped to match the image extent shown in Figure 3, and the snow-covered area for each image was calculated (Table 1).
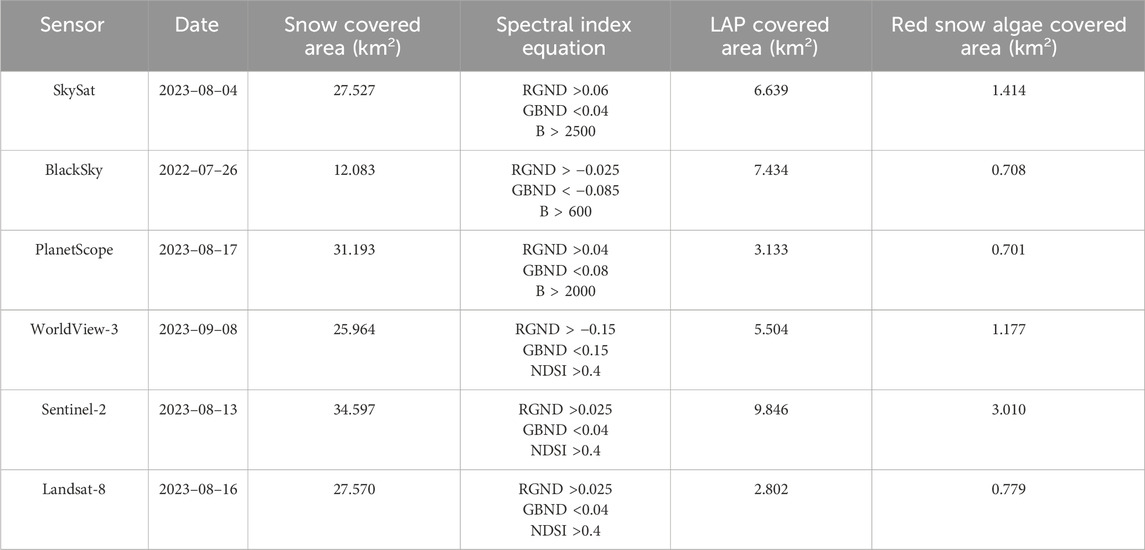
Table 1. Classified snow-covered area, light absorbing particle (LAP) covered area, and red snow algae covered area of each image used in Figure 3. The spectral index equation used to calculate red snow algae covered area is listed for each image.
The RGND index was applied to the snow-covered area of each image calculated in the previous step to classify the area covered by light absorbing particles (LAPs). The RGND index is unable to differentiate between dirty snow and red snow algae, so both particles contribute to this LAP classification. Pixels with a high RGND index (above the threshold value listed in Equations 4–9) were classified as containing LAPs, and pixels with a low RGND index (below the threshold value listed in Equations 4–9) were classified as LAP-free. The total LAP-covered area of Mt. Baker was then calculated from this layer (Table 1).
To isolate red snow algae and filter dirty snow from our classification, the GBND index was applied to the LAP-covered area of each image calculated in the previous step. Dirty snow exhibits a high GBND index value, and red snow algae exhibits a low GBND index value. Therefore, pixels with a low GBND index value (below the threshold value listed in Equations 4–9) were classified as containing red snow algae, and pixels with a high GBND index value (above the threshold value listed in Equations 4–9) were classified as dirty snow. The total red snow algae-covered area of Mt. Baker was then calculated from this layer (Table 1).
The high albedo of snow also presents challenges for remote sensing, as excessive reflectance can overwhelm satellite sensors, leading to oversaturation in certain bands. This effect can produce artifacts in the imagery that appear as unnatural colors. In PlanetScope images, for example, oversaturated regions may appear light blue, purple, or green, as seen in Figure 6. The vast majority of PlanetScope images captured of Mt. Baker in the spring and early summer months exhibit extensive oversaturation artifacts, rendering them unsuitable for analysis. Only images acquired from late July through September were of sufficient quality for snow algae mapping. Even when oversaturation does not produce noticeable visual artifacts, it can still impact classification accuracy. For instance, in Figure 4, large areas on the southern flank of Mt. Baker are classified as snow algae in the WorldView-3 image, though much of this is due to misclassification caused by oversaturation effects.
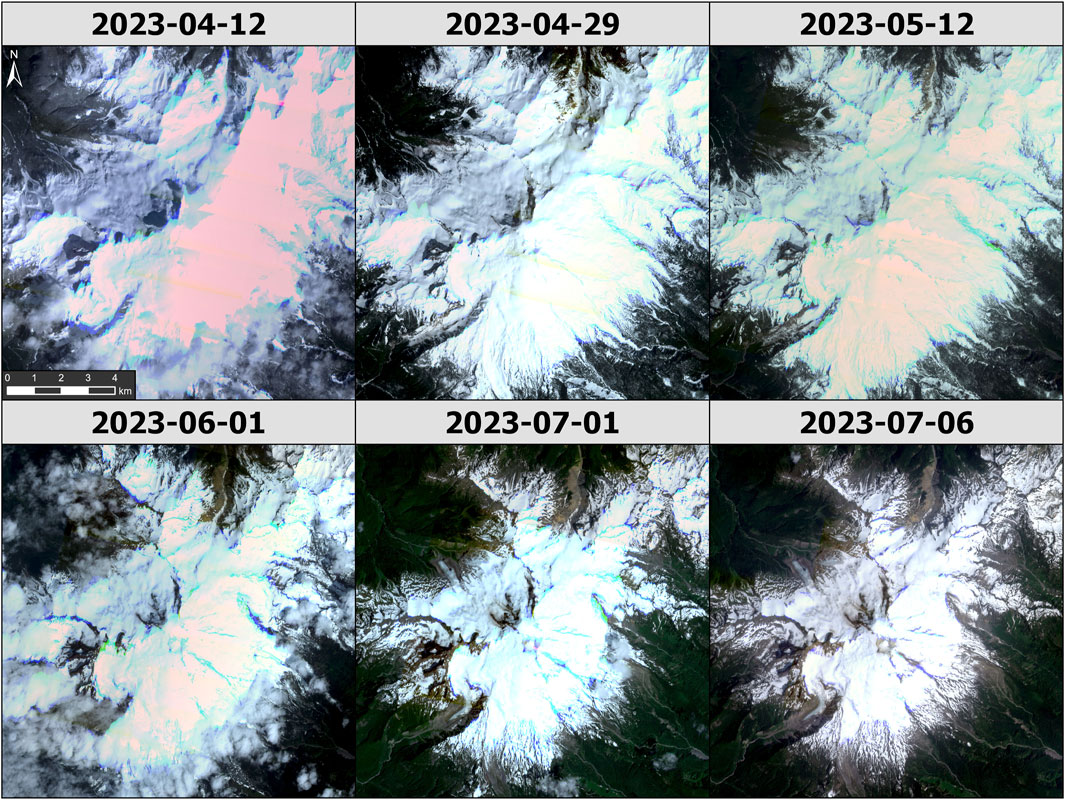
Figure 6. Oversaturation artifacts in PlanetScope images of Mt. Baker WA. Oversaturated pixels appear in various colors, including white, pink, blue, green, or purple, due to sensor saturation. These pixels cannot be used for snow algae mapping, as individual bands fail to capture accurate reflectance values. All images are shown at the same scale and extent, with the scale bar and north arrow from the 12 April 2023 image applying to all.
4 Conclusion
The design of satellite sensors involves trade-offs that impact their effectiveness in mapping snow algae. Commercial SmallSats (SkySat, BlackSky, and PlanetScope) offer exceptionally high spatial resolutions and revisit frequencies. This enables the visualization of fine-scale features, such as the Mazama algae bloom on Mt. Baker, WA, and allows for capturing multiple images in a single location daily. Such capabilities facilitate monitoring changes in the shape, temporal distribution, and intensity of algal blooms.
These advantages, however, come at a cost. The limited spectral capabilities of SmallSats–restricted to visible and near-infrared (VNIR) wavelengths–prevent them from calculating the normalized difference snow index (NDSI), the most reliable method for identifying snow-covered areas, as they lack a shortwave infrared (SWIR) band. Without NDSI, alternative methods, such as blue-band thresholding, must be used, though they are less accurate. Additionally, the high reflectivity of snow can oversaturate satellite sensors, leading to image artifacts or misclassification when applying spectral indices.
Despite these challenges, commercial satellites provide new opportunities for mapping snow algae previously unattainable with traditional government-funded satellites. They enable finer-scale and more frequent observations of features such as snow algae blooms.
Data availability statement
The raw data supporting the conclusions of this article will be made available by the authors, without undue reservation.
Author contributions
CR: Conceptualization, Formal Analysis, Investigation, Methodology, Visualization, Writing – original draft. AK: Conceptualization, Funding acquisition, Supervision, Writing – review and editing.
Funding
The author(s) declare that financial support was received for the research and/or publication of this article. Funding from this work came from NASA Award #80NSSC21K1166 and NSF CAREER Award # 2046240.
Acknowledgments
This work utilized data made available through the NASA Commercial SmallSat Data Acquisition (CSDA) program.
Conflict of interest
The authors declare that the research was conducted in the absence of any commercial or financial relationships that could be construed as a potential conflict of interest.
Generative AI statement
The author(s) declare that no Generative AI was used in the creation of this manuscript.
Publisher’s note
All claims expressed in this article are solely those of the authors and do not necessarily represent those of their affiliated organizations, or those of the publisher, the editors and the reviewers. Any product that may be evaluated in this article, or claim that may be made by its manufacturer, is not guaranteed or endorsed by the publisher.
References
Cook, J. M., Tedstone, A. J., Williamson, C., McCutcheon, J., Hodson, A. J., Dayal, A., et al. (2020). Glacier algae accelerate melt rates on the south-western Greenland Ice Sheet. Cryosphere 14, 309–330. doi:10.5194/tc-14-309-2020
Curnick, D. J., Davies, A. J., Duncan, C., Freeman, R., Jacoby, D. M. P., Shelley, H. T. E., et al. (2022). SmallSats: a new technological frontier in ecology and conservation? Remote Sens. Ecol. Conserv. 8, 139–150. doi:10.1002/rse2.239
Davey, M. P., Norman, L., Sterk, P., Huete-Ortega, M., Bunbury, F., Loh, B. K. W., et al. (2019). Snow algae communities in Antarctica: metabolic and taxonomic composition. New Phytol. 222, 1242–1255. doi:10.1111/nph.15701
Di Mauro, B., Garzonio, R., Baccolo, G., Franzetti, A., Pittino, F., Leoni, B., et al. (2020). Glacier algae foster ice-albedo feedback in the European Alps. Sci. Rep. 10, 4739. doi:10.1038/s41598-020-61762-0
Di Mauro, B., Garzonio, R., Ravasio, C., Orlandi, V., Baccolo, G., Gilardoni, S., et al. (2024). Combined effect of algae and dust on snow spectral and broadband albedo. J. Quantitative Spectrosc. Radiat. Transf. 316, 108906. doi:10.1016/j.jqsrt.2024.108906
Dozier, J. (1989). Spectral signature of alpine snow cover from the LANDSAT thematic mapper. Remote Sens. Environ. 28, 9–22. doi:10.1016/0034-4257(89)90101-6
Engstrom, C. B., and Quarmby, L. M. (2023). Satellite mapping of red snow on North American glaciers. Sci. Adv. 9, eadi3268. doi:10.1126/sciadv.adi3268
Engstrom, C. B., Williamson, S. N., Gamon, J. A., and Quarmby, L. M. (2022). Seasonal development and radiative forcing of red snow algal blooms on two glaciers in British Columbia, Canada, summer 2020. Remote Sens. Environ. 280, 113164. doi:10.1016/j.rse.2022.113164
Flanner, M. G., Zender, C. S., Randerson, J. T., and Rasch, P. J. (2007). Present-day climate forcing and response from black carbon in snow. J. Geophys. Res. 112, D11202. doi:10.1029/2006JD008003
Ganey, G. Q., Loso, M. G., Burgess, A. B., and Dial, R. J. (2017). The role of microbes in snowmelt and radiative forcing on an Alaskan icefield. Nat. Geosci. 10, 754–759. doi:10.1038/ngeo3027
Gray, A., Krolikowski, M., Fretwell, P., Convey, P., Peck, L. S., Mendelova, M., et al. (2020). Remote sensing reveals Antarctic green snow algae as important terrestrial carbon sink. Nat. Commun. 11, 2527. doi:10.1038/s41467-020-16018-w
Gray, A., Krolikowski, M., Fretwell, P., Convey, P., Peck, L. S., Mendelova, M., et al. (2021). Remote sensing phenology of Antarctic green and red snow algae using WorldView satellites. Front. Plant Sci. 12, 671981. doi:10.3389/fpls.2021.671981
Healy, S. M., and Khan, A. L. (2023). Albedo change from snow algae blooms can contribute substantially to snow melt in the North Cascades, USA. Commun. Earth Environ. 4, 142. doi:10.1038/s43247-023-00768-8
Hisakawa, N., Quistad, S. D., Hester, E. R., Martynova, D., Maughan, H., Sala, E., et al. (2015). Metagenomic and satellite analyses of red snow in the Russian Arctic. PeerJ 3, e1491. doi:10.7717/peerj.1491
Hotaling, S., Lutz, S., Dial, R. J., Anesio, A. M., Benning, L. G., Fountain, A. G., et al. (2021). Biological albedo reduction on ice sheets, glaciers, and snowfields. Earth-Science Rev. 220, 103728. doi:10.1016/j.earscirev.2021.103728
Huovinen, P., Ramírez, J., and Gómez, I. (2018). Remote sensing of albedo-reducing snow algae and impurities in the Maritime Antarctica. ISPRS J. Photogrammetry Remote Sens. 146, 507–517. doi:10.1016/j.isprsjprs.2018.10.015
Khan, A. L., Dierssen, H. M., Scambos, T. A., Höfer, J., and Cordero, R. R. (2021). Spectral characterization, radiative forcing and pigment content of coastal Antarctic snow algae: approaches to spectrally discriminate red and green communities and their impact on snowmelt. Cryosphere 15, 133–148. doi:10.5194/tc-15-133-2021
Leffler, R., Horvitz, A., Downs, R., Changery, M., Redmond, K. T., and Taylor, G. (2001). Evaluation of a national seasonal snowfall record at the Mount Baker, Washington, ski area. National Weather Digest, 25 (12), 15–20.
Painter, T. H., Duval, B., Thomas, W. H., Mendez, M., Heintzelman, S., and Dozier, J. (2001). Detection and quantification of snow algae with an airborne imaging spectrometer. Appl. Environ. Microbiol. 67, 5267–5272. doi:10.1128/AEM.67.11.5267-5272.2001
Pelto, M. S. (1988). The annual balance of North Cascade glaciers, Washington, U.S.A., measured and predicted using an activity-index method. J. Glaciol. 34, 194–199. doi:10.3189/S0022143000032238
Polat, H. C., Virgili-Llop, J., and Romano, M. (2016). Survey, statistical analysis and classification of launched CubeSat missions with emphasis on the attitude control method. J. Small Satell. 5, 513–530.
Roussel, L., Dumont, M., Gascoin, S., Monteiro, D., Bavay, M., Nabat, P., et al. (2024). Snowmelt duration controls red algal blooms in the snow of the European Alps. Proc. Natl. Acad. Sci. U.S.A. 121, e2400362121. doi:10.1073/pnas.2400362121
Skiles, S. M., Flanner, M., Cook, J. M., Dumont, M., and Painter, T. H. (2018). Radiative forcing by light-absorbing particles in snow. Nat. Clim. Change 8, 964–971. doi:10.1038/s41558-018-0296-5
Takeuchi, N., Dial, R., Kohshima, S., Segawa, T., and Uetake, J. (2006). Spatial distribution and abundance of red snow algae on the Harding Icefield, Alaska derived from a satellite image. Geophys. Res. Lett. 33, L21502. doi:10.1029/2006GL027819
Keywords: remote sensing, satellites, SmallSats, earth observation, snow algae, albedo, snowmelt, cryosphere
Citation: Rand CF and Khan AL (2025) How commercial SmallSats are revolutionizing the remote detection and mapping of snow algae. Front. Remote Sens. 6:1572973. doi: 10.3389/frsen.2025.1572973
Received: 08 February 2025; Accepted: 09 April 2025;
Published: 22 April 2025.
Edited by:
Yongxiang Hu, National Aeronautics and Space Administration, United StatesReviewed by:
Claudia Ravasio, University of Milano-Bicocca, ItalyYan Xie, University of Michigan, United States
Copyright © 2025 Rand and Khan. This is an open-access article distributed under the terms of the Creative Commons Attribution License (CC BY). The use, distribution or reproduction in other forums is permitted, provided the original author(s) and the copyright owner(s) are credited and that the original publication in this journal is cited, in accordance with accepted academic practice. No use, distribution or reproduction is permitted which does not comply with these terms.
*Correspondence: Alia L. Khan, YWxpYS5raGFuQHd3dS5lZHU=