 C. Poncelet
 A. Saunier
 A. Gaillot
 G. Billant
 L. Berger
- Underwater Acoustics Laboratory, DFO/NSE/ASTI, Institut Français de Recherche pour l’Exploitation de la Mer (Ifremer), Plouzané, France
In order to meet the needs of a wide scientific community and take advantage of large echo sounder datasets collected at sea, Ifremer has developed GLOBE (GLobal Oceanographic Bathymetry Explorer), an open-source software program that integrates tools for bathymetry, water column, and now advanced seafloor backscatter processing. GLOBE follows standardized formats and methodologies, including the International Council For the Exploration of the Sea (ICES) SONAR-netCDF4 standard and the Geohab Backscatter Working Group (BSWG) recommendations, ensuring interoperability and reproducibility. GLOBE provides a comprehensive 3D georeferenced environment for visualizing and analyzing echo sounder data by merging datasets acquired on different platforms at various spatial and temporal scales. The applicability of GLOBE software for seafloor backscatter processing is presented and compared with that of existing tools. Its use is illustrated with a dataset of the multibeam water column and seafloor backscatter acquired by a research vessel and an underwater vehicle of the French Oceanographic Fleet (FOF) in the Tyrrhenian Sea.
1 Introduction
The use of echo sounder technology aboard scientific research vessels, underwater vehicles, and seafloor observatories is essential for studying vast regions of the seafloor and the water column for a variety of oceanographic applications. These sensors can be divided into two categories: 1) multibeam echo sounders (MBES), primarily designed for bathymetric applications, and 2) quantitative calibrated echo sounders (also called a scientific echo sounder by the manufacturer Kongsberg), primarily designed for assessing backscattering quantities in the water column. They provide crucial insights into seafloor morphology, sediment properties, water column dynamics, and aquatic ecosystem resources. Each sensor is specifically designed to capture distinct acoustic properties of the marine environment, and dedicated tools have been developed by different communities for comprehensive marine research.
This paper introduces GLobal Oceanographic Bathymetry Explorer (GLOBE) as a unique open-source software solution developed by Ifremer and the French Oceanographic Fleet (FOF). GLOBE offers two key capabilities.
1) GLOBE was primarily designed to provide a full suite of tools for bathymetry-related processing, including support for advanced seafloor backscatter processing and enabling detailed seafloor characterization,
2) GLOBE is designed to integrate different kinds of datasets into a unified 3D georeferenced environment for enhancing seafloor analysis with water column backscatter data.
GLOBE enables researchers to seamlessly visualize the seafloor and the water column features and to combine data with georeferenced in situ measurements from other sensors. GLOBE is used in research programs aiming at monitoring biological and physical processes and helps to create a comprehensive picture of the ocean environment on a single platform.
This article provides an overview of GLOBE water column backscatter capabilities and offers a deeper look at seafloor backscatter processing and its potential contribution to the GeoHab Backscatter Working Group (Backscatter Working Group (BSWG), 2025; Lurton et al., 2015) as an implementation of the Open Backscatter Toolchain project (Masetti et al., 2020) improving the consistency, transparency, and reproducibility of seafloor backscatter data products. The article presents results from both water column and seafloor using GLOBE’s backscatter processing tools using datasets acquired by state-of-the-art deep-sea vehicles and research vessels of the FOF. These results illustrate how GLOBE helps end users manage data overload through dedicated visualization tools with an analysis example.
1.1 Rationale for developing an open-source platform
In the field of marine science and oceanographic research, the availability and interoperability of advanced data processing tools are critical for addressing complex scientific questions and managing marine environments effectively. For decades, Ifremer has been developing its own processing software for echo sounders installed on oceanographic vessels. This decision was driven by two key factors: first, when integrating new generations of equipment, no dedicated software was available for data processing; and second, developing in-house solutions provides greater control over data processing, fosters innovation, enables research linked to new observational capabilities, and strengthens user support within the scientific community.
With the establishment of the FOF operated by Ifremer in 2018, this approach has been maintained: continuing to develop and provide these processing tools not only to FOF users but also to the broader oceanographic community. As part of this commitment, GLOBE software is released under the GNU Lesser General Public License version 3 (LGPLv3). The terms of the LGPLv3 license ensure free access to the software by mandating source code availability and freedom of use. The license encourages redistribution through copyleft provisions, requiring modifications to be shared under the same license. This fosters community contributions and collaborative development, allowing scientists and end-users to obtain a free and accessible solution for processing and analyzing their data. The LGPLv3 also allows linking with proprietary software, promoting wider adoption while protecting open-source principles.
1.2 Review of software used for processing echo sounder data
Software development for processing echo sounder data has seen significant progress in recent years. Commercial bathymetric software packages predominantly focus on hydrographic survey processing. While most of these packages can process seafloor backscatter data, many do not disclose their processing pipeline, and large differences can be observed between the results produced by these different tools when used with the same dataset, as detailed by Malik et al. (2019). Water column data, when available, are often limited to quality control for bathymetry. However, vendors like Teledyne Geospatial, BeamworX, Xylem, and QPS offer robust tools for bathymetry and provide support for backscatter and water column visualization (Table 1).
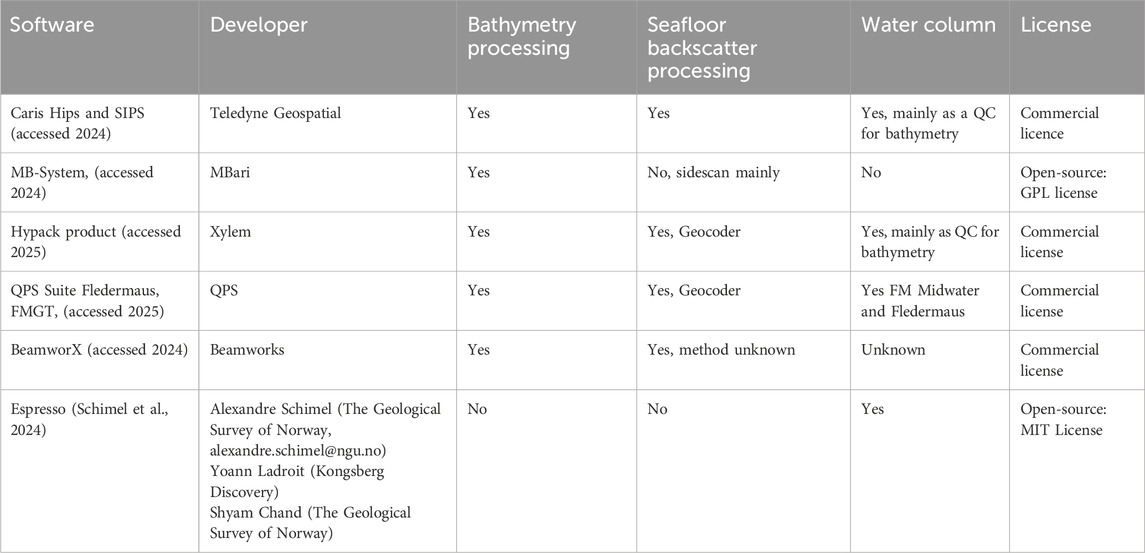
Table 1. Bathymetry processing software. Bathymetry, seafloor backscatter processing, and water column capacities are reported according to their respective online documentation and their licensing models.
Software tools such as Echoview, LSSS, and ESP3 are notable for their capabilities in applying calibration to raw echo sounder data, target detection, and classification. While Echoview stands out for its broad spectrum of sensor input compatibility, most of the tools primarily cater to water column calibrated echo sounders. The tools listed in Table 2 are predominantly designed for fishery acoustic data processing.
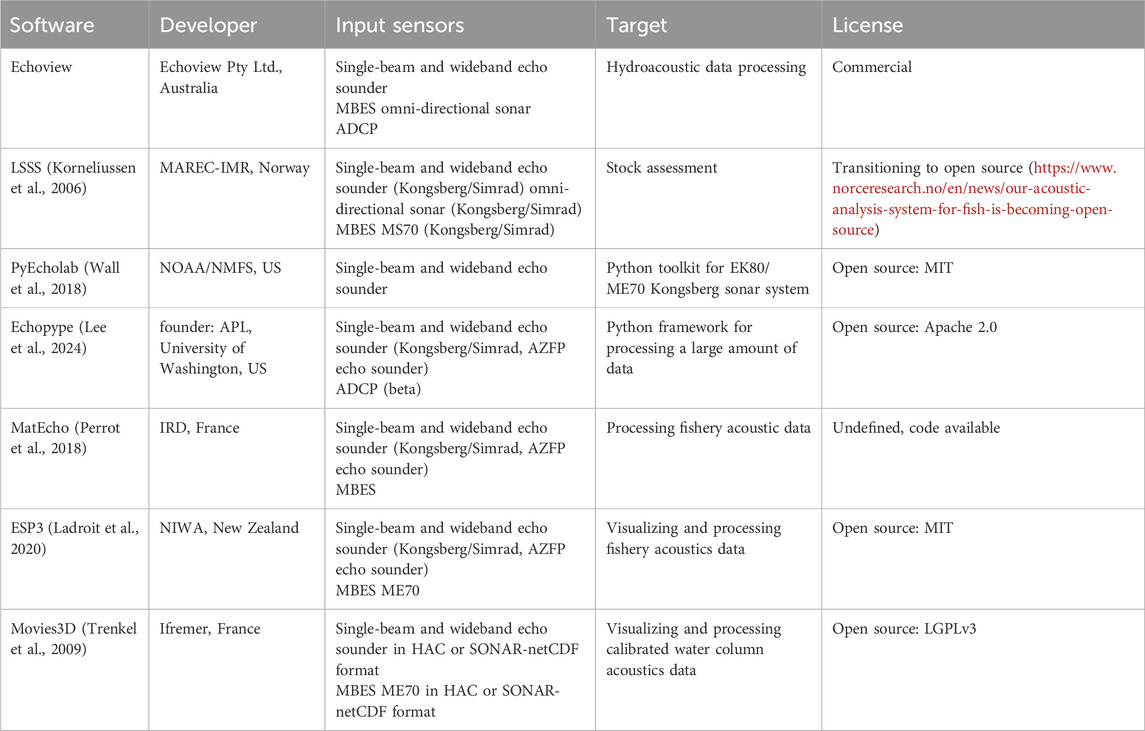
Table 2. Calibrated water column dedicated software detailing the supported input sensors, primary applications, and licensing models.
Unlike tools dedicated to a single family of sensors, GLOBE provides a unified open-source platform for visualizing and processing a wide variety of different echo sounder data types, including bathymetry, water column, and seafloor backscatter product generation.
2 Materials and methods
Echo sounders are the main sensors that can be displayed in GLOBE, with the software designed to offer extensible tools for the display and processing within a single 3D virtual environment, providing a platform within which to handle most of the data acquired during oceanographic surveys on an FOF vessel. GLOBE was primarily designed as a bathymetry processing tool for FOF users, replacing Ifremer’s Caraibes software (Le Gal and Edy, 1997). It implements a set of data processing methods allowing classical correction on bathymetric MBES sounder data and the creation of bathymetry products. Bathymetry processing is the first mandatory step as input data to the seafloor backscatter processing workflow detailed in this article, although a detailed description of bathymetry processing is out of the scope of this article. Regarding water column backscatter, GLOBE allows computing and displaying water column products on dedicated 2D views or in the centralized geographic view where all datasets can be displayed and georeferenced in a virtual globe.
2.1 A common format for echo sounder data
GLOBE made the choice to convert bathymetric multibeam echo sounder files recorded by the manufacturer’s software in their own data format (e.g., .all or .kmall file format for the Kongsberg bathymetry sounder, .s7k for Reson bathymetry sounders) to a standard common format that can be used as a working format to store processing result and metadata. In 2018, a working group of the International Council For the Exploration of the Sea (ICES) posted a report on a convention named SONAR-netCFD4 (Macaulay and Peña, 2018) for the storage of sonar data in netCDF4-formatted files with an initial focus on omni-directional sonars and allowing for a description of quantitative echo sounders. The intention for this format is to provide a well-founded convention that is supported by multiple sonar systems and multiple sonar analysis software packages, with the aim of facilitating the quantitative use of sonar data for research and survey purposes. Version 2 of the format published in 2022 considers more types of sounders, including sounders having separate emitting and receiving transducers, such as multibeam bathymetry echo sounders, and even acoustic Doppler current profiler (ADCP) sounders with a dedicated group for water current values.
GLOBE uses as its working format an extension to the SONAR-netCDF4 labeled XSF (as eXtended SONAR-netCDF Format). This extension allows storing the bathymetry and seafloor backscatter data through dedicated subgroups. GLOBE embeds XSF converters for the bathymetry echo sounders available on the FOF vessels (namely, Reson Seabat 7150, 7111, 7125, and most of the Kongsberg EM mapping echo sounders). Thanks to this format, GLOBE can share its functionality with systems using the SONAR-netCDF4 as a common description format at no cost. For example, GLOBE can display with the same tools water column content not only from bathymetric multibeam echo sounders but also from Kongsberg and Furuno quantitative single-beam echo sounders complying with this format (in continuous wave (CW) mode) for displaying water column backscatter.
2.2 Water column feature
GLOBE can read water column data from any echo sounder in a format compliant with SONAR-netCDF4 v2.0 and display the water column in several ways for single-beam or multibeam sonar systems. However, managing water column data presents significant challenges. More specifically, these data are cumbersome to store and process due to their large size, which is often several orders of magnitude greater than bathymetry and seafloor backscatter data. This size discrepancy arises from the fact that while the seafloor is represented by values in a two-dimensional ping and beam dimension, water column data incorporates a third dimension representing the range from the echo sounder to the seafloor. This additional dimension dramatically increases the size of the dataset and introduces new challenges for the visualization and interpretation of such multidimensional data.
To address this challenge, dimensionality reduction is available through dedicated views and filters. Water column data can be displayed ping per ping in either a dedicated 2D fan display (Figure 1A, up) or as a set of individual echoes displayed in 3D with respect to the beams opening of the echo sounders (Figure 1A, down).
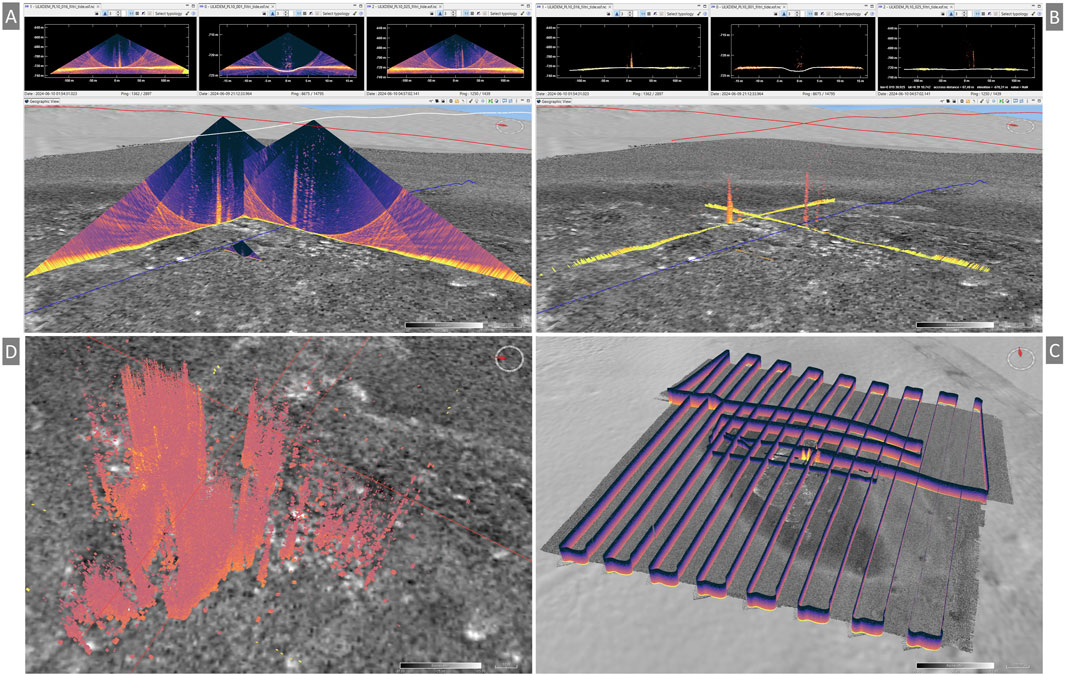
Figure 1. Water column backscatter from UlyX EM2040 data of dive #10. (A) Focus on the gas plumes area, with three water column echograms from three different survey lines, two at a constant altitude of 60 m above the seafloor and 300 kHz (red navigation lines), and one at 6 m altitude and 400 kHz (blue navigation line). Above, the same echograms are displayed in 2D views and synchronized with the geographic view. (B) Same view as (A), but with side-lobe filtering applied to water column backscatter data, showing the benefits of synchronization between views in the application: gas plumes are clearly highlighted in every view. (C) Vertical slices showing gas plumes in the middle of the area. (D) Volume backscatter water column data display, showing 400 pings from each 60-m altitude line with side-lobe filtering applied. This clearly shows that gas plumes are rooted in pockmarks visible on shaded bathymetry. Basemaps (A–C) UlyX EM2040 backscatter computed with GLOBE software (1 m resolution), (D) Atalante EM122 backscatter computed with GLOBE software (30 m resolution).
Water column data can be stacked using tools available to create water column products, allowing for rapid, broad-scale visualization of georeferenced water-column features, as shown in Figure 1C.
Water column stacking, dedicated to multibeam echo sounder data, is highly configurable (e.g., number of stacks, surface reference, filters, and side-lobe removal) and is computed as the mean linear values of echoes in the water column with respect to their geographic location. The stacking algorithm considers the real geolocation of each echo and is identical to the “vertically echo-integrated view” algorithm used by the Espresso software (Schimel et al., 2024). Stacks can be created (1) vertically along and parallel to the ship’s track or (2) horizontally as a projection of the water column with respect to a reference surface. For vertical stacking, a set of vertical surfaces is defined along a ship’s track with a regular across-track spacing. For horizontal stacking, the set of regularly spaced surfaces is defined relative to the sea surface or the seafloor. In both cases, all water column echoes are georeferenced, filters are optionally applied, and the contribution of each echo to the surface pixels is assessed by computing its projection vector to the nearest surface. The algorithm then computes the mean linear values of all contributing echoes to each surface pixel. For vertical stacking, the projection vector follows the vertical axis, whereas for horizontal stacking, the projection vector is horizontal, perpendicular to the nearest track position. To our knowledge, this algorithm is not currently implemented in any of the few commercial software programs available for visualizing multibeam water column data, especially allowing such stacking and display in a multipurpose geographic 3D environment.
All water column displays can be enhanced with a set of pre-processing algorithms to remove or filter unwanted features or noise that may otherwise increase scene complexity. The parameters combined with multiple ping displays bring the capacity to display 3D complex features in a water column scene, as illustrated in Figure 1D.
One of the next steps in water column analysis involves spatial and temporal feature labeling. GLOBE includes geo-picking capabilities, allowing users to record the location in space and time of the point of interest in the water column. The geo-picking can be augmented with metadata such as typology and confidence of classification, saved in a *.csv file format, and used for further analysis such as geostatistical algorithms or deep learning experiments similar to Perret et al. (2025).
2.3 Seafloor backscatter data processing workflow
Getting backscatter strength from the seafloor is not a straightforward operation and requires successive processing steps to achieve comparable and reproducible results. The various stages are identified in the standard workflow detailed in Schimel et al. (2018), and the intermediate backscatter levels obtained are named BL0 through BL4. GLOBE’s backscatter processing follows this workflow and is directly inspired by the SonarScope software formerly designed at Ifremer to offer an improved estimation of BS computed by the sounder manufacturer. This workflow, summarized in Figure 2, is fully integrated and simplified as much as possible so that it can be accessible to scientists without deep expertise in acoustics or sonar systems. GLOBE offers two forms of seafloor backscatter processing: 1) static processing, similar to the one of SonarScope, and 2) dynamic processing. The static method consists of computing angular response curves on a selected part of input files, which might be clipped by a geographic mask. The angular response curves are then used to compensate the angular dependency of the backscatter level of the entire files before gridding. The dynamic method applies the same operations but in a temporal manner, with angular response curves being computed on a sliding window over each swath of MBES data. The backscatter processing workflow is based on the XSF standard format but uses vendor-specific information. Consequently, only FOF echo sounders are currently fully supported.
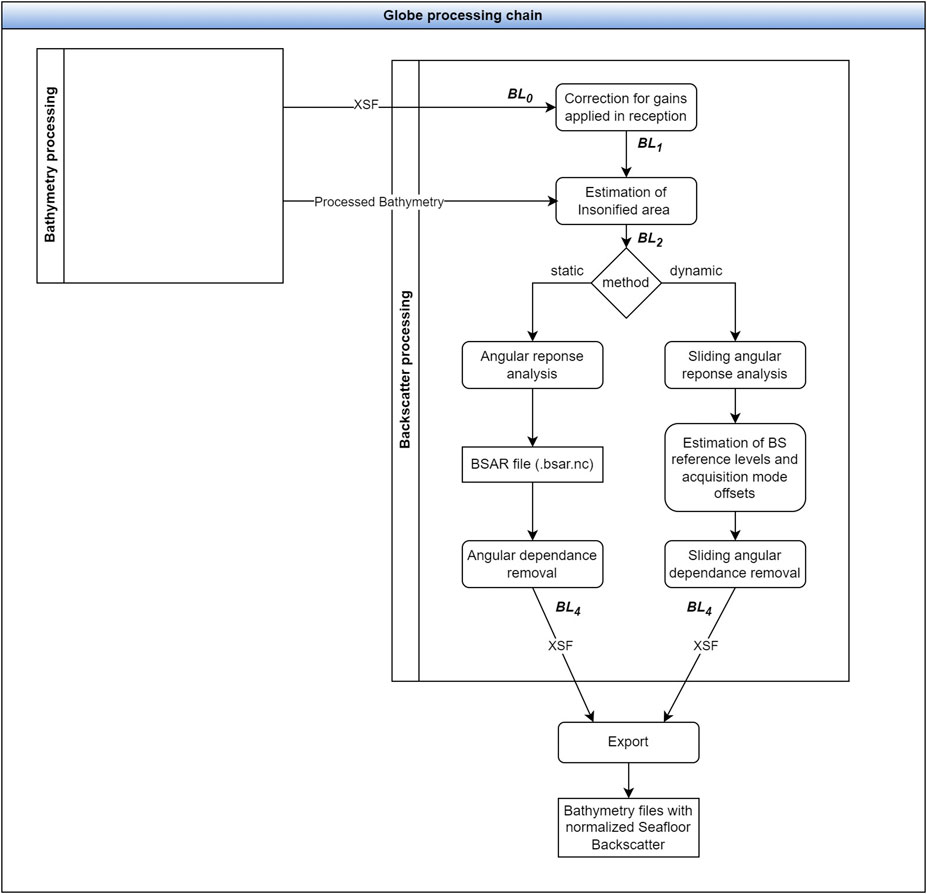
Figure 2. Representation of the GLOBE processing workflow: On the left side, the indicative bathymetry processing workflow and its outputs are shown: a raw file converted to XSF format, containing the results of the bathymetry process, along with its associated gridded product generated for bathymetry data. These outputs are then used on the right side for the subsequent steps of seafloor backscatter processing, which can be performed using either the static or the dynamic method. Matching levels BL0 to BL4 are indicated at their corresponding steps in the workflow.
2.3.1 BL0 raw data decoding and georeferencing
Several methods exist to compute a backscatter value per beam from raw files (Malik et al., 2019). Per-beam seafloor backscatter values are either retrieved directly from the vendor raw file (Kongsberg systems) or computed from raw snippets samples as in Reson systems. All these data are converted by GLOBE and stored in the pivot SONAR-netCDF4 format, used by GLOBE backscatter processing as its working format. When per-beam values are computed by GLOBE, snippets are converted to a ping-beam 2D data matrix through a simple mean in amplitude linear space (Equation 1) and associated to the corresponding beam-sounding geographic position.
2.3.2 BL1 correction for gains applied in reception (Kongsberg example)
The first processing step is to remove vendor-specific compensations. Depending on MBES manufacturers, real-time recorded BS data might be compensated to cope with incidence angle dependence. This compensation should be removed to retrieve uncompensated backscatter values (Hammerstad, 2000).
In the case of Kongsberg sounders, two terms are removed from BS, corresponding to specular and Lambert law correction.
With
Equation 2 is used to retrieve raw BS from Kongsberg recorded snippets.
In the case of Reson MBES (7,150/7,125), no real-time compensation is applied, so raw values from the snippets are used directly. However, without any details about how the insonified area is estimated, the next processing step is skipped, and consequently, we assume a worse correction.
The second processing step is to remove the vendor-specific insonified area. Bottom target strength (BTS) is approximated from the previously computed BS using the formula (Equation 3) from Lurton et al. (2015),
where
This estimation should be removed to retrieve an estimation without vendor compensation. At the end of this stage, assuming no correction on vendor computed transmission losses, the backscatter level is the level received at the transducer face prior to any application of gain follow and noted BL1 in the backscatter level notation (Schimel et al., 2018).
2.3.3 Reestimation of the insonified area
Given beam pointing angles, sound velocity profiles, and slopes from a processed bathymetry digital terrain model (DTM), full seafloor incidence angles (
The insonified area is either limited by the pulse length (normal incidence) or by beam width (oblique incidence), and the minimum of these two scenarios is retained (Equation 5).
It is assumed that these formulas are simplified versions of the real areas and are built by generalizing the previous ones to take into account seafloor slopes in both directions and the tilt angle of the sensor (Hammerstad, 2000; Lurton et al., 2015, Equation 25)
We have now Equation 6.
2.3.4 Angular response analysis
The next step is to determine and remove the angular response of the transducers and the seafloor. To achieve this, the current methodology is statistical and aims at separating the contributions of the transducer (beam pattern and source level) from the contribution of the seafloor type and geomorphology. The main problem to be solved here is that the two phenomena are entangled: the variation of the seabed backscattering strength, with the incidence angle, disturbs the measurement of the beam patterns, which vary with the transmission angles.
The static method relies on statistics computed on the largest possible amount of data. Given this set of data, ping-beam detections are sorted by incidence angle to apply a mean/median in linear units on backscatter values with bins of 1° that lead to a statistical model of BS response by incidence (
As the exact characteristics of each hardware and acquisition mode are not known or documented, the algorithm computes these statistics by acquisition mode, by emission sector, and by reception antenna. The analysis data are then written in a netCDF file with the extension “bsar.nc” for backscatter angular response. The curves contained in the bsar net.CDF file can be edited in GLOBE for quality control and outlier filtering. A set of tools for filtering and/or fitting these data to a parametric mathematical model is planned for future development. Because data used in this step depend on seafloor diversity, the algorithm considers a geographic mask to restrict the model to a specific part of the data, carefully chosen by the user.
The dynamic method approach consists of computing the same statistics but in a time-varying manner. For a given swath, all data enclosed in a temporal window around it and sharing the same acquisition mode are considered to build a specific model for that swath. For each swath, the backscatter reference level is also dynamically computed, considering BS levels in the window restricted to a user-defined range of incidence angles. BS level offsets between acquisition modes, mainly due to variations in source level, are estimated from these reference levels by minimizing variations around acquisition mode changes. This information is used to ensure the continuity of BS levels in the next step.
2.3.5 Angular dependence removal
The static angle dependence removal is done through the Backscatter angular renormalization process. From BL2 data and given a BS model file generated in the previous step, the backscatter level without any angular dependency is computed with (Equation 7).
The BS model is purely statistical and includes several physical contributions that prevent the possibility of a backscatter level BL3 computation at that time. Such computation will be considered in future development by adding a calibration step that uses third-party equipment, like data from a calibrated single-beam echo sounder. Through this approach, it is possible to retrieve absolute
The dynamic method, called the Backscatter sliding angular renormalization process, extends the static method by computing the model and applying correction along a temporal sliding window. Equation 7 becomes (Equation 8):
This temporal approach enables managing BS level gaps observed between acquisition modes. This feature is not yet available with the static method but could be proposed as a future improvement.
2.3.6 Export and mosaicking
The BL4 is finally saved in source SONAR-netCDF4 files (XSF). It overwrites previous raw backscatter values, and additional metadata are added to flag the file as processed. While various gridding algorithms exist (Schimel et al., 2018), GLOBE employs a simple yet effective gridding algorithm that fills the backscatter layer of the generated DTM by computing the mean in linear units from all backscatter data within each grid cell. The additional tool allows the remaining gaps to be filled using bilinear interpolation on valid cells.
2.4 Data description
The BSWG’s Backscatter Software Intercomparison Project (BSIP) conducted a study on the processing methods of several software (Malik et al., 2019) where SonarScope was used and compared with other processing software. One result of the BSIP project was that software packages diverge in a very early stage during processing and show large differences between them. The differences in backscatter data processing stem from varying methods used to compute a single representative value per beam from recorded snippets. These variations arise from (1) the choice of statistical measure (mean or median); (2) the selection criteria for backscatter samples (all samples vs. a subset around the bottom detect); (3) the calculation approach (directly averaging dB values vs. converting to linear scale before averaging). The raw datasets used in this project are still publicly available at https://bswg.github.io/bsip/; however, the processed datasets from each software are no longer available. The SonarScope/GLOBE benchmark described in the first section of the results in Section 3.1 uses only the first BSIP dataset, coming from the Kongsberg EM 302 (30 kHz) of NOAA Ship Okeanos Explorer.
The second section of the study, described in Section 3.2, uses datasets acquired during the ULYXDEMO 2024 technical cruise (Escartin et al., 2024). This marine expedition was conducted in the Tyrrhenian Sea, on board R/V L’Atalante, targeting areas in three types of terrain, with test sites depths ranging from 500 m to 3,700 m: a) sedimented areas with gentle relief (e.g., abyssal plain, Italian margin), <10°, b) areas with relief typically <20°, c) rugged terrain with scarps, slopes (>30° locally), and complex morphology. Some of these areas host hydrothermal vents and gas plumes. Data were acquired with the Atalante ship and UlyX, a state-of-the-art underwater vehicle tested during this technical cruise. The R/V Atalante is equipped with EM122 and EM710 multibeam echo sounders and surveyed all 17 sites prior to the dives. UlyX is equipped with an EM2040 multibeam echo sounder, a digital still camera (with two flash units), a conductivity, temperature, and depth (CTD) sensor, and several physico-chemical sensors, including oxygen, pH, redox, magnetometers, fluorimeter, and nephelometer.
3 Results
3.1 Benchmark of seafloor backscatter processing
The benchmark of seafloor backscatter processing uses SonarScope as a proxy to understand how GLOBE seafloor backscatter processing relates to the other processing software presented in the BSIP study and replicates some of the BSIP comparisons.
3.1.1 BL0 comparison
The BSIP study showed that differences appeared as soon as data were read by different tools (BL0). There are two ways to read the backscatter level for Kongsberg MBES data in both SonarScope and GLOBE. The first way is to directly read the data from beam reflectivity datagrams. Raw decoding of BS values stored in the depth XYZ 88 Kongsberg datagram is performed the same way in both SonarScope and GLOBE and gives the same results. In such a case, there is no difference for BL0. The second approach uses the snippets reflectivity datagrams. Each beam reflectivity can also be computed by averaging the full amplitude time series recorded within each beam from Seabed image 89 datagrams. Kongsberg snippet data are compensated at acquisition to lower specular reflection at the nadir and to cope with outer beam attenuation (Lambert’s law). Each of the two software packages can suppress this manufacturer correction to retrieve raw BS from snippets. As illustrated in Figure 3, data computed from snippets shows pretty close values from both SonarScope and GLOBE (with a maximum difference of 0.08 dB at the nadir, where the precision of the sounder record is 0.1 dB). In such a case, we consider that BL0 values are almost identical, and differences are likely due to numerical imprecision when computing and applying the manufacturer corrections.
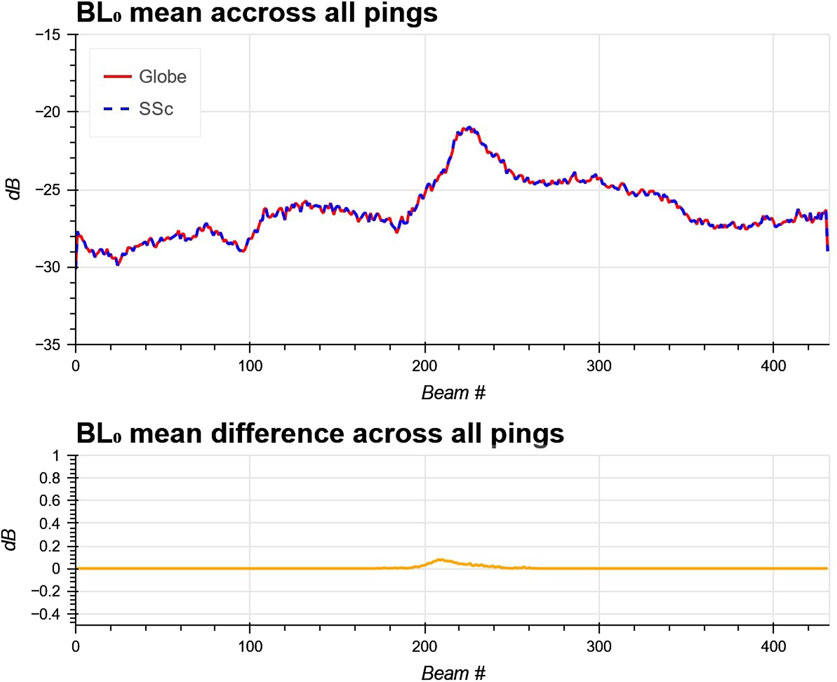
Figure 3. GLOBE and SonarScope BL0 comparison for the EM302 BSIP dataset: mean data along pings for BL0 and the differences between the two software packages.
3.1.2 Incidence angle comparison
Incidence angles are computed both in SonarScope and GLOBE from the same DTM. The result shown in Figure 4 highlights the main differences between each software package. SonarScope considers the calculated port side swath incidence angles as negative numbers (Figure 4A), while GLOBE reports positive incidence angles, regardless of the swath side (Figure 4C). In order to compare the angle, the benchmark uses SonarScope’s absolute angles (Figure 4B). The GLOBE computed incidence angles image shows a regular striped pattern along the ping dimension, compared to SonarScope, emphasized by the difference image (Figure 4D). This is because GLOBE’s algorithm considers the full beam incidence angle (relative to seafloor normal, accounting for across-track and along-track angles), compared to SonarScope, which only considers the projected incidence angle onto the swath plane (across-track angle).
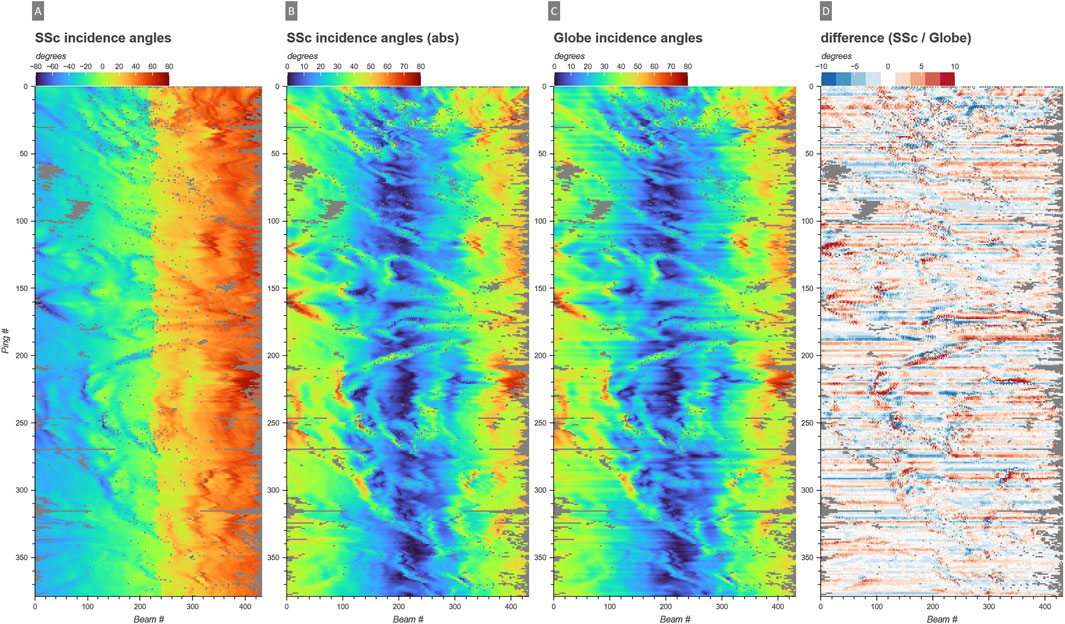
Figure 4. GLOBE and SonarScope incidence angles. From left to right: (A) SonarScope incidence angles, (B) absolute values of SonarScope incidence angles, (C) GLOBE incidence angles, and (D) differences between SonarScope absolute values and GLOBE.
3.1.3 BL3 comparison
BL3 (backscatter level after radiometric corrections but before compensation for angular dependence) was computed for both software, and the resulting mean across pings is shown in Figure 5. Both datasets consist of averaged snippet BS data, with Kongsberg compensations removed and with the modified insonified area recomputed from in-house incidence angle computation. The same DTM was used for both datasets to ensure that differences in angle were not linked to differences in bathymetry surface. The comparison shows mean differences across all pings being less than 0.5 dB at its maximum. Ping-beam BL3 matrices and associated differences are plotted as images in Figure 6. The beam-wise BL3 differences show an across-track striped pattern that is linked to the difference in incidence angles computation explained above.
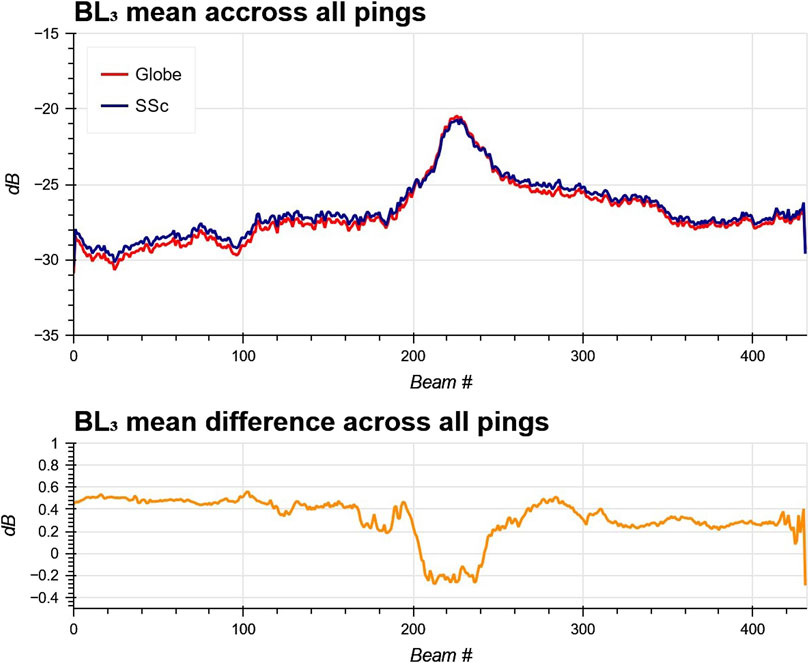
Figure 5. GLOBE and SonarScope BL3 comparison for the EM302 BSIP dataset: mean data along pings for BL3 and the differences between the two software packages.
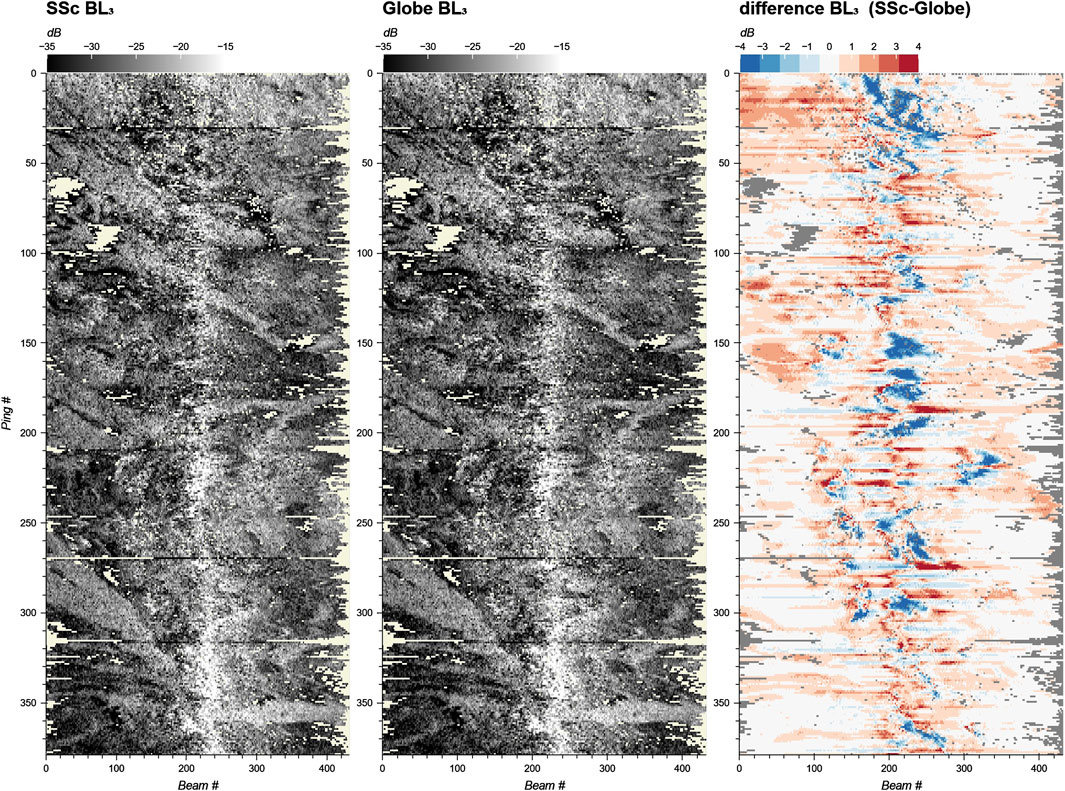
Figure 6. GLOBE and SonarScope BL3 comparison for the EM302 BSIP dataset.
3.1.4 Benchmark evaluation
As seen in Section 2.6, GLOBE seafloor backscatter processing retains SonarScope philosophy. Meanwhile, GLOBE differs from SonarScope in several ways. 1) Statistical calculations are performed via different binning strategies, leading to higher differences in backscatter curves per incidence angle. While GLOBE’s implementation uses centered bins, SonarScope uses left-binned statistics. For example, take a bin of 1 degree width at 0°: the binned mean will be calculated from samples in the interval [0°: 1°] for SonarScope, and [−0.5°: 0.5°] for GLOBE, resulting in slightly different results. Binning was modified in GLOBE for this study to track other differences but was reverted back to its origin afterward. If any study is to be conducted again, those differences will increase. 2) SonarScope considers the calculated port side swath incidence angles as negative numbers (Malik et al., 2019), while GLOBE reports positive incidence angles, regardless of the swath side. 3) The incidence angle computation diverges between SonarScope and GLOBE, the latter considering both along and across angles. This results in differences between BL3-level computation but without any strong visual effects on the final backscatter product. The main result of this benchmark is that GLOBE’s backscatter computation is equivalent to SonarScope, and therefore, GLOBE can be directly compared to FMGT and CARIS SIPS on this EM302 dataset.
3.2 Seafloor and water column backscatter processing in GLOBE during a scientific cruise for geoscience applications
This section showcases how GLOBE functionalities can help scientists analyze their data for scrutinizing seafloor pockmarks and gas seeps. The choice of examples seeks to illustrate (a) different kinds of bathymetry and backscatter data display to enhance the detection of phenomena of interest in the water column or on the seafloor; (b) seafloor backscatter processing results for interpretation of sediment types associated with fluid emissions.
Figure 7 shows the location of UlyX dive #10 during ULYXDEMO 2024 and the corresponding bathymetric data acquired. Dive #10 took place over a pockmark area at 800 m depth with already known fluid seeps (RMV area/B1 gas flare in Rovere et al. (2022)). UlyX dove 9 h over the area at two different altitudes, 70 m (acoustic survey) and 9 m above the seabed (optical survey). All available sensors were turned on, and all acquired data can be displayed in GLOBE. Orthophotomosaic (previously processed with Matisse (Arnaubec et al., 2023), physico-chemical sensors, and MBES data (bathymetry, seabed, and water column backscatter) are shown in Figure 1 and Figure 8.
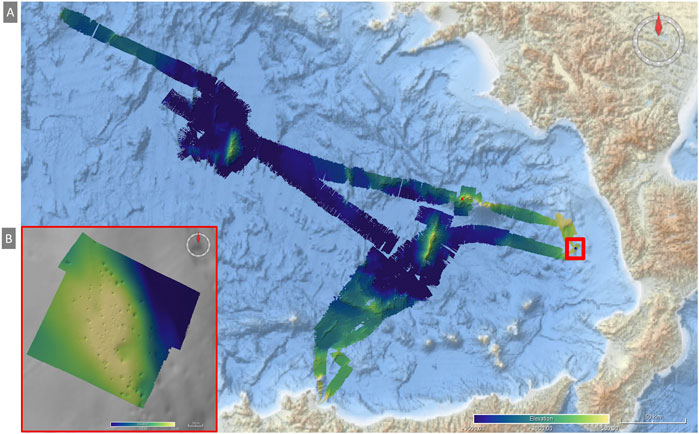
Figure 7. ULYXDEMO24 MBES digital terrain models of processed data: (A) Atalante EM122 data (30 m resolution) and UlyX EM2040 data and (B) dive #10 in propeller basin (1 m resolution). Basemaps: (A) EMODnet Bathymetry and (B) Atalante EM122 shaded DTM.
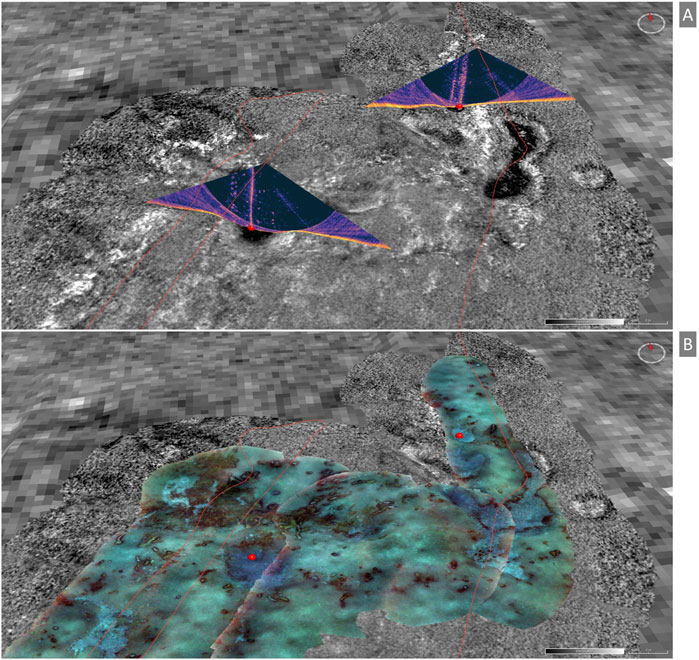
Figure 8. Illustration of geographic visualization capabilities for linking seafloor and water column backscatter observations. (A) Two water column backscatter echograms and the dynamically normalized seafloor backscatter mosaic (10 cm cell size), all from UlyX EM2040 data from dive 10 (400 kHz, 6 m altitude). (B) Orthophotomosaic superimposed on the backscatter mosaic. Manually selected gas plume feet are displayed as red spheres. It emphasizes the link between the area of weak seafloor backscatter visible in the pockmark trough, the gas plumes observed in the water column backscatter echograms above, and the blue areas on the orthophotomosaic corresponding to bacterial mats. The UlyX track is shown as red lines. Base maps: UlyX EM2040 seafloor backscatter mosaic (70 m altitude, 1 m cell size).
Figure 1 illustrates how water column backscatter data can be displayed in GLOBE. Water column echograms can be viewed in either a 2D view or a 3D geographic view (Figure 1A). The two views are temporally linked, and a slider allows the user to navigate between pings. They also share rendering properties, such as color palette, contrast range, opacity, and filters. The latter is shown in Figure 1B, which is the same view as (A), but with side-lobe filtering enabled. Figure 1D shows the advantage of using such a filter when rendering a range of ping echograms from multiple lines. This option easily delineates each gas plume and its connection to seafloor pockmarks. One can also slice the backscatter water-column data volume along the horizontal or vertical direction, as illustrated in Figure 1D, allowing quick inspection of the dataset.
Rovere et al. (2022) mentioned that the gas plumes observed over this area are all related to specific seafloor morphological features (e.g., mounds, pockmarks, and linear scarps) or seafloor backscatter anomalies. Gas seeps, depending on their composition, cause precipitation of methane-derived carbonate and/or fluidized mud at the seafloor, visible as local backscatter variations and often associated with depressions (pockmarks). Figure 8A illustrates how GLOBE allows scientists to quickly correlate the observed water column backscatter signals (gas plumes) with the corresponding seafloor backscatter structure (and eventually topography) by integrating a dynamically normalized seafloor backscatter mosaic (10 cm cell size) and water column echograms into the same 3D georeferenced view (all data coming from the same UlyX EM2040 dataset, 400 kHz, 6 m altitude data). It shows that the gas plumes observed in two water column backscatter echograms clearly originate from low backscatter seafloor areas visible on two corresponding pockmark troughs. Rovere et al. (2022) state that two box cores were collected over this area, from which subsequent analyses revealed the presence of gas in the sediment (mainly composed of CO2). Figure 8B shows the orthophotomosaic superimposed on the backscatter mosaic, with the two sources of the gas plumes represented by red dots in Figure 8A and Figure 8B. It highlights that the low backscatter areas of the seafloor correspond to the white–blue areas of the orthophotomosaic, which stand out from the rest of the surface and correspond to microbial mats developing in areas of active fluid and/or gas outflow at the seafloor.
The seafloor backscatter data were processed using the static and dynamic methods described in the previous sections. The resulting mosaics are shown in Figure 9, where we can see, clockwise from the top left: (A) the original raw backscatter data mosaic; (B) the statically normalized SonarScope backscatter data mosaic; (C) the statically normalized GLOBE backscatter data mosaic; and (D) the dynamically normalized backscatter mosaic. The dynamically normalized backscatter mosaic improves readability and shows fewer angular variations across the track than the statically normalized ones (Figure 9B,C) while preserving natural variations in the seafloor BS. Some incidence angle artifacts can also be seen on the two pockmarks (red arrows) located in the upper left and lower right corners of the SonarScope mosaic (Figure 9B): the side facing the sonar array appears brighter, while it is homogeneous on both mosaics processed by GLOBE. The GLOBE normalization algorithm effectively separates the variable gains of the array’s relative beam angle from the variable backscatter of the seafloor incidence angle, ensuring more accurate and consistent processing results.
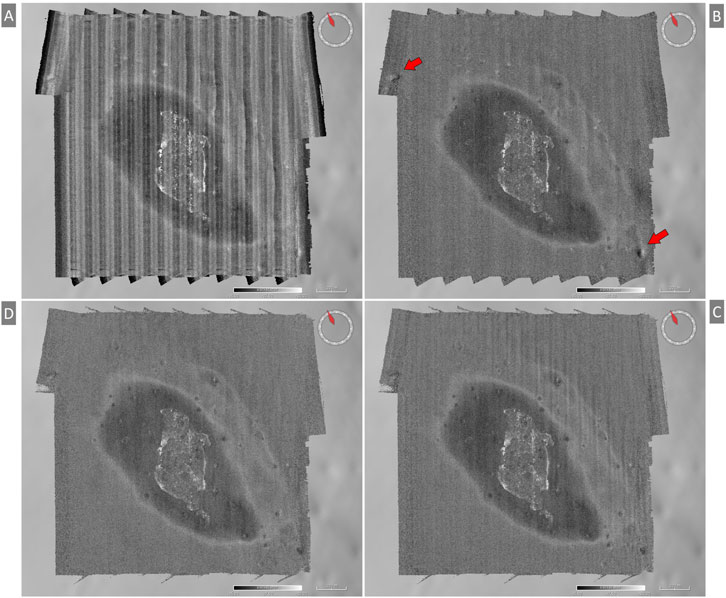
Figure 9. Seafloor backscatter mosaic (1 m) from UlyX EM2040 data of dive #10: clockwise from top left: (A) Raw backscatter as decoded from the original. All files use backscatter data normalized using the (B) SonarScope static method. Angular response curves are computed on the whole dataset, and red arrows indicate incidence angle artifacts. (C) The GLOBE static method, and (D) using the GLOBE dynamic method. Basemap: Atalante EM122 shaded bathymetry (30 m).
4 Discussion and future work
4.1 Significance of GLOBE for scientific studies
GLOBE allows researchers to process and scrutinize at sea the acoustic data collected from different sensors. By providing open-source software with operational graphical interfaces capable of handling large data sets produced by modern acoustic sensors, GLOBE significantly increases the possibilities of getting the most out of these data during or after cruises. This software, launched at the beginning of 2012, has evolved over the last 10 years and is now the official bathymetric processing software used by most FOF campaigns. Its water column and seabed backscatter processing module has been adopted by a large community of users, making it an essential tool for detecting gas seepage during geoscience surveys (Scalabrin and Dupre, 2018). The water column display, as either a 3D or a 2D stack, has been proven useful for several applications like seep gas detection and localization (Dupré et al., 2015; Mitchell et al., 2022; Urban et al., 2017) and habitat mapping (Lucieer et al., 2023).
Due to its extensive use within the EMODnet Bathymetry initiative (Schmitt et al., 2019), spanning over 24 European countries, GLOBE has also gained recognition within a wider international community, highlighting its widespread use for several years. This is supported by download statistics that show that GLOBE was downloaded more than 1,000 times across more than 50 countries in 2024, though these numbers should be interpreted with caution as this number shows the total number of downloads but not necessarily the number of total users.
At the same time, GLOBE was able to quickly open up to other acoustic scientific communities, allowing the display of other acoustic echo sounder data, such as quantitative echo sounders or ADCP. The Kongsberg EK80 acquisition software, which handles both quantitative single-beam echo sounders and ADCPs, has recently added native export to the latest SONAR-netCDF4 format, which will make the integration process into the GLOBE software even easier.
Thanks to its broad data import capacity (all sensor data acquired on the FOF and any CSV-like data), GLOBE allows for easy comparison of large-scale water column acoustic datasets with more localized georeferenced in situ measurements from physico-chemical sensors installed on a ship hull, an AUV/USV/glider, or a CTD, thus contributing to the constitution of a comprehensive 3D picture of the ocean environment. Geoscientists can also easily import and visualize sub-bottom profiles acquired from hull-mounted low-frequency echo sounders or seismic equipment, as well as gravimetric and magnetometric data processed by GLOBE.
4.2 Contributions to the backscatter working group community
The applications of seafloor backscatter data are expanding. One of the conclusions of the Seafloor Backscatter Intercomparison project from the Backscatter working group community (Malik et al., 2019) was that either an increased consistency among various software packages or at least a clear explanation for differences among software solutions is necessary. By delivering an open-source software package implementing a workflow close to the standard pipeline and nomenclature proposed by Schimel et al. (2018) as aimed by the OpenBST project (Masetti et al., 2020), GLOBE backscatter processing modules can be a significant step forward for the community and a proposal for a reference implementation for backscatter processing.
Key decisions were made and documented during development, such as how backscatter values are read from files (BL0) and how insonified areas are considered (BL2). Future work will focus on incorporating multibeam backscatter calibration tools and techniques (Eleftherakis et al., 2018), leading to an estimation of BL3. The open-source nature of these algorithms and their accessibility via the Python language allow for experimentations and modifications to assess the impact of various factors mentioned by Malik et al. (2019), such as the choice of central tendency, the selection of the backscatter samples, and the calculation methods.
The intermediate processing results are available and can be easily accessed at any step with the ability to add custom exports. This approach provides researchers with a tool that enhances the accuracy, consistency, and clarity regarding differences with other software, thereby advancing the standardization of backscatter processing. These efforts align with recommendations from Lurton et al. (2015) and Malik et al. (2019) and in continuation to the work presented by Masetti et al. (2020).
The backscatter processing algorithm offers users a choice between static and dynamic methods for removing angular sensitivity in MBES data, depending on the processing objectives. The dynamic method is ideal for scientists seeking a seafloor backscatter image free from artifacts caused by angular variations in the transducer and seafloor response. This processed image serves as a baseline map for further segmentation methods. Backscatter (BS) reference levels are automatically computed in this method, allowing the algorithm to adapt to seafloor variations without requiring additional expertise. However, the selection of the sliding window size is crucial: if it is too short, the BS natural variation may be lost, and if it is too long, the method resembles the static approach, negating the benefits of adaptability. The static method is beneficial for detailed seafloor analysis using backscatter curves and for processing data with localized seafloor variations. It consumes less memory and time. Additionally, the static method serves as a foundation for developing processing chains aimed at echo sounder calibration to achieve an absolute BS response (Eleftherakis et al., 2018).
The use of calibrated data and absolute backscatter response is essential to the community for ensuring greater objectivity and reproducibility. Standardizing the data enables results that are independent of the specific vessels, sonar models, equipment configurations, and environmental conditions when using echo sounders operating at the same acoustic frequency. Calibrating multifrequency echo sounders allowing spectral analysis of seafloor backscatter will be a step forward and will give new insights into the remote monitoring of the geoacoustic properties of the seafloor (Fezzani et al., 2021).
4.3 Perspectives and future work
The software is under continuous and active development. New functionalities are frequently added to meet further research requirements, and the source code is regularly improved to accelerate workflows and handle datasets of increasing size. In the near future, in addition to the development for absolute backscatter response of the seafloor, planned improvements of GLOBE include enhanced compatibility with the SONAR-netCDF4 format, like expansion of the software’s water column visualization capabilities to support a broader range of sonar equations and sounder ping modes.
In recent years, the volume of data produced by sensors has increased with new capacities and with an increasing number of sensors on research vessels. GLOBE adapted its architecture to make a clear separation between the graphical interface and its process. This led to building a process framework and library that can be used interactively in GLOBE or in batch mode to process datasets. This framework is shared and used in other projects within the FOF software ecosystem to deploy solutions for automated processing on the fleet ships, with the target to optimize and accelerate processing scientific workflows but also to be used to monitor and improve data acquisitions from the shore, as it is already needed in the unmanned surface vehicle (USV) use case (Handegard et al., 2024).
GLOBE is available for download on the Seanoe website (www.seanoe.org) at this address https://doi.org/10.17882/70460
Data availability statement
Publicly available datasets were analyzed in this study. These data can be found at https://doi.org/10.17600/18003780 and https://bswg.github.io/bsip/.
Author contributions
CP: conceptualization, project administration, software, supervision, visualization, writing – original draft, writing – review and editing, and validation. AS: conceptualization, methodology, software, validation, visualization, writing – original draft, and writing – review and editing. AG: data curation, methodology, validation, visualization, writing – original draft, and writing – review and editing. GB: conceptualization, software, visualization, writing – original draft, writing – review and editing, and validation. LB: project administration, supervision, writing – original draft, writing – review and editing, and validation.
Funding
The author(s) declare that financial support was received for the research and/or publication of this article. The development of the GLOBE software is funded by Ifremer and the French Oceanographic Fleet (FOF). EMODnet bathymetry-related development had been funded by the European Commission under contract number EASME/EMFF/2019/1.3.1.9/Lot1/SI2.836043: Lot 1 – Bathymetry.
Conflict of interest
The authors declare that the research was conducted in the absence of any commercial or financial relationships that could be construed as a potential conflict of interest.
Correction note
A correction has been made to this article. Details can be found at: 10.3389/frsen.2025.1703531.
Generative AI statement
The author(s) declare that no Generative AI was used in the creation of this manuscript.
Publisher’s note
All claims expressed in this article are solely those of the authors and do not necessarily represent those of their affiliated organizations, or those of the publisher, the editors and the reviewers. Any product that may be evaluated in this article, or claim that may be made by its manufacturer, is not guaranteed or endorsed by the publisher.
References
Arnaubec, A., Ferrera, M., Escartín, J., Matabos, M., Gracias, N., and Opderbecke, J. (2023). Underwater 3D reconstruction from video or still imagery: Matisse and 3DMetrics processing and exploitation software. J. Mar. Sci. Eng. 11, 985. doi:10.3390/jmse11050985
Backscatter Working Group (BSWG) (2025). GeoHab-Marine Geological and Biological Habitat Mapping. Ontario, Canada: GeoHab. Available online at: https://geohab.org/backscatter-working-group/ (Accessed 13 June, 2025).
Dupré, S., Scalabrin, C., Grall, C., Augustin, J.-M., Henry, P., Şengör, A. M. C., et al. (2015). Tectonic and sedimentary controls on widespread gas emissions in the Sea of Marmara: results from systematic, shipborne multibeam echo sounder water column imaging. J. Geophys. Res. Solid Earth 120, 2891–2912. doi:10.1002/2014JB011617
Eleftherakis, D., Berger, L., Le Bouffant, N., Pacault, A., Augustin, J.-M., and Lurton, X. (2018). Backscatter calibration of high-frequency multibeam echosounder using a reference single-beam system, on natural seafloor. Mar. Geophys. Res. 39, 55–73. doi:10.1007/s11001-018-9348-5
Escartin, J., Birard, T., Borremans, C., Fezzani, R., Durand, V., Feld, A., et al. (2024). UlyXDemo’24 test cruise. (Preliminary report No. v. 2024/07/04). Louisville, CO: Aechimer. Available online at: https://archimer.ifremer.fr/doc/00898/100967/.
Fezzani, R., Berger, L., Le Bouffant, N., Fonseca, L., and Lurton, X. (2021). Multispectral and multiangle measurements of acoustic seabed backscatter acquired with a tilted calibrated echosounder. J. Acoust. Soc. Am. 149, 4503–4515. doi:10.1121/10.0005428
Hammerstad, E. (2000). Backscattering and seabed image reflectivity. Available online at: https://www.kongsberg.com/globalassets/kongsberg-discovery/commerce/seafloor-mapping/em2040-mkii/em_technical_note_web_backscatteringseabedimagereflectivity.pdf (Accessed 10 January, 2025).
Handegard, N. O., De Robertis, A., Holmin, A. J., Johnsen, E., Lawrence, J., Le Bouffant, N., et al. (2024). Uncrewed surface vehicles (USVs) as platforms for fisheries and plankton acoustics. ICES. J. Mar. Sci. 81, 1712–1723. doi:10.1093/icesjms/fsae130
Korneliussen, R., Ona, E., Eliassen, I., Heggelund, Y., Patel, R., Godø, O., et al. (2006). The large scale survey system-LSSS. In: Proceedings of the 29th scandinavian symposium on physical acoustics. Bergen, Norway: Institute of Marine Research.
Ladroit, Y., Escobar-Flores, P. C., Schimel, A. C. G., and O’Driscoll, R. L. (2020). ESP3: an open-source software for the quantitative processing of hydro-acoustic data. SoftwareX 12, 100581. doi:10.1016/j.softx.2020.100581
Lee, W.-J., Setiawan, L., Tuguinay, C., Mayorga, E., and Staneva, V. (2024). Interoperable and scalable echosounder data processing with Echopype. ICES J. Mar. Sci. 81, 1941–1951. doi:10.1093/icesjms/fsae133
Le Gal, L., and Edy, C. (1997). CARAIBES: an integrated software for multibeam echosounder and sidescan sonar data mapping. In: MTS/IEEE conference proceedings; 1997 October 06–09; Halifax, NS, Canada: IEEE, 1242–1245. doi:10.1109/OCEANS.1997.624173
Lucieer, V., Flukes, E., Keane, J. P., Ling, S. D., Nau, A. W., and Shelamoff, V. (2023). Mapping warming reefs—an application of multibeam acoustic water column analysis to define threatened abalone habitat. Front. Remote Sens. 4. doi:10.3389/frsen.2023.1149900
Lurton, X., Lamarche, G., Brown, C., Lucieer, V., Rice, G., Schimel, A., et al. (2015). Backscatter measurements by seafloor-mapping sonars. In: Guidelines and recommendations. Ontario, Canada: GeoHab. doi:10.5281/zenodo.10089261
Macaulay, G., and Peña, H. (2018). The SONAR-netCDF4 convention for sonar data, Version 1.0. Copenhagen, Denmark: ICES Cooperative Research Report. doi:10.17895/ICES.PUB.4392
Malik, M., Schimel, A. C. G., Masetti, G., Roche, M., Le Deunf, J., Dolan, M. F. J., et al. (2019). Results from the first phase of the seafloor backscatter processing software inter-comparison project. Geosciences 9, 516. doi:10.3390/geosciences9120516
Masetti, G., Smith, M., Mayer, L., Malik, M., Augustin, J. M., Poncelet, C., et al. (2020). OpenBST Project–A community-vetted workflow for backscatter processing. In: Canadian Hydrographic Conference 2020; 2020 February 25–27. Québec, Canada: Canadian Hydrographic Association. Available online at: https://www.slideshare.net/slideshow/open-backscatter-toolchain-openbst-project-a-communityvetted-workflow-for-backscatter-processing/229396305 (Accessed 23 January, 2025) .
Mitchell, G. A., Mayer, L. A., and Gharib, J. J. (2022). Bubble vent localization for marine hydrocarbon seep surveys. Interpretation 10, SB107–SB128. doi:10.1190/INT-2021-0084.1
Perret, T., Le Chenadec, G., Gaillot, A., Ladroit, Y., and Dupré, S. (2025). Deep-learning-based detection of underwater fluids in multiple multibeam echosounder data. Front. Remote Sens. 6. doi:10.3389/frsen.2025.1532714
Perrot, Y., Brehmer, P., Habasque, J., Roudaut, G., Behagle, N., Sarré, A., et al. (2018). Matecho: an open-source tool for processing fisheries acoustics data. Acoust. Aust. 46, 241–248. doi:10.1007/s40857-018-0135-x
Rovere, M., Mercorella, A., Gamberi, F., and Zgur, F. (2022). Hydrothermal vent complexes control seepage and hydrocarbon release on the overriding plate of the tyrrhenian-ionian subduction system (paola basin). Front. Earth Sci. 10, 852786. doi:10.3389/feart.2022.852786
Scalabrin, C., and Dupre, S. (2018). Water column acoustics: remote detection of gas seeps. In: L. Ruffine, D. Broseta, and A. Desmedt, editors Gas hydrates 2: geoscience issues and potential industrial applications. London, UK: ISTE Ltd. p. 11–20. doi:10.1002/9781119451174.ch1
Schimel, A., Ladroit, Y., and Watson, S. (2024). Espresso: an open-source software tool for visualizing and analysing multibeam water-column data. Vienna, Austria: EGU General Assembly. doi:10.5194/egusphere-egu24-11043
Schimel, A. C. G., Beaudoin, J., Parnum, I. M., Le Bas, T., Schmidt, V., Keith, G., et al. (2018). Multibeam sonar backscatter data processing. Mar. Geophys. Res. 39, 121–137. doi:10.1007/s11001-018-9341-z
Schmitt, T., Spoelstra, G., Loubrieu, B., and Poncelet, C. (2019). “EMODnet Bathymetry a compilation of bathymetric data in the European waters. In: OCEANS 2019–marseille; 2019 June 17–20; Marseille, France. Marseille, France: IEEE, 1–7. doi:10.1109/OCEANSE.2019.8867250
Trenkel, V. M., Berger, L., Bourguignon, S., Doray, M., Fablet, R., Massé, J., et al. (2009). Overview of recent progress in fisheries acoustics made by Ifremer with examples from the Bay of Biscay. Aquat. Living Resour. 22, 433–445. doi:10.1051/alr/2009027
Urban, P., Köser, K., and Greinert, J. (2017). Processing of multibeam water column image data for automated bubble/seep detection and repeated mapping. Limnol. Oceanogr. Methods 15, 1–21. doi:10.1002/lom3.10138
Keywords: echo sounder, water column, acoustic backscatter, bathymetry, oceanography, open-source software
Citation: Poncelet C, Saunier A, Gaillot A, Billant G and Berger L (2025) Acoustic backscatter processing in GLOBE: an open-source software for echo sounder data analysis. Front. Remote Sens. 6:1574129. doi: 10.3389/frsen.2025.1574129
Received: 10 February 2025; Accepted: 30 May 2025;
Published: 08 July 2025; Corrected: 07 October 2025.
Edited by:
Craig John Brown, Dalhousie University, CanadaReviewed by:
Lukasz Janowski, Gdynia Maritime University, PolandMashkoor Malik, National Oceanic and Atmospheric Administration (NOAA), United States
Copyright © 2025 Poncelet, Saunier, Gaillot, Billant and Berger. This is an open-access article distributed under the terms of the Creative Commons Attribution License (CC BY). The use, distribution or reproduction in other forums is permitted, provided the original author(s) and the copyright owner(s) are credited and that the original publication in this journal is cited, in accordance with accepted academic practice. No use, distribution or reproduction is permitted which does not comply with these terms.
*Correspondence: C. Poncelet, Y3lyaWxsZS5wb25jZWxldEBpZnJlbWVyLmZy