 Inken Schulze
 Mischa Schönke
 Peter Feldens
 Svenja Papenmeier
- Marine Geophysics, Leibniz Institute for Baltic Sea Research Warnemünde (IOW), Rostock, Germany
Anchoring activities exert significant physical pressure on seabed, altering benthic habitats through mechanical disturbances. The European Marine Strategy Framework Directive mandates the assessment of such anthropogenic impacts. Evaluating seabed integrity requires an understanding of both the spatial extent of disturbance and the rate of recovery. This study presents multibeam echosounder bathymetry and backscatter from a heavily impacted area in the Bay of Eckernförde, German Baltic Sea, a region with intensive tourist and naval shipping traffic. The data reveal a dense network of anchor tracks, characterized by elongated furrows flanked by mounds to both sides and extensive abrasion zones caused by the anchor chains. The profile of a fresh anchor track shows a depth of −0.3 m and a mound elevation of 0.2 m, both features diminishing by approximately half after 1 year. Its initial anchor impact crater reaches maximum depth of 0.7 m in the silty sediments. Seafloor disturbance extends approximately 3 m to both sides from anchor tracks, affecting approximately 20% of the surveyed area, excluding widespread abrasion zones. To analyze track degradation, a relative timeline was constructed using a topological sorting algorithm and compared with absolute dating based on AIS data. Results indicate slope measurements effectively capture anchor track degradation until morphological equilibrium is reached. Beyond this stage, tracks remain visible in backscatter data by increased intensity along former mounds. This suggests that anchor tracks have a more persistent impact on seabed integrity than bathymetric data indicate. The spatial extent and the long-lasting effect of the anchor tracks highlight the necessity for explicit spatial management strategies to mitigate cumulative impacts on seabed integrity.
1 Introduction
Human activities in the coastal and marine habitats are increasing, particularly in densely populated regions such as the Southern Baltic Sea (Reckermann et al., 2022). These activities cover a broad range, including maritime construction, tourism and recreation (HELCOM, 2023), resource extraction like sand mining (Krause et al., 2010), and commercial fishing practices such as bottom trawling (Schönke et al., 2022; van der Reijden et al., 2023). In addition, the increase in maritime traffic and shipping has led to a greater demand for anchoring as the ships wait to berth (Davis et al., 2016). Similar to bottom trawling, anchoring by ships and boats impacts seafloor integrity (Davis et al., 2016). Seabed integrity is recognized as a critical parameter for offshore ecosystems and is a central element of descriptor D6 under the European Marine Strategy Framework Directive (European Parliament, Council of the European Union, 2008). Assessing the impact of anchoring on seabed integrity requires considerations of both the spatial extent of disturbances and the rate of recovery. Anchoring of a ship creates an impact crater on the seabed, followed by a furrow flanked by mounds to both sides as the anchor plows through. The anchor chain commonly scrapes the seabed and forms specific abrasion patterns due to vessel movements (Watson et al., 2022). Anchoring leads to notable physical changes to the seabed that may have complex and lasting ecological effects. Physical pressures arise due to the creation of furrows and mounds that alter the bathymetry of the seafloor. In addition, sediment layers are disrupted and substrate is displaced (Collins et al., 2010). Anchoring also contributes to habitat degradation as scouring anchors damage benthic ecosystems and disturb associated biota. Studies have shown that habitat-forming taxa like seagrass (Kelly et al., 2019; Collins et al., 2010), or corals (Flynn and Forrester, 2019) are significantly disturbed by anchoring processes, as well as the communities on rocky reefs (Broad et al., 2023). Anchoring activities can result in the resuspension of sediments, which increases turbidity and sedimentation in the water column (Broad et al., 2020; Watson et al., 2022; Broad et al., 2023). This can impact the light penetration, reduce water clarity, and affect the growth of benthic organisms and plants (Brodersen et al., 2017). When sediments are resuspended, nutrients like nitrogen and phosphorus enter the water column, supporting eutrophication (Rios-Yunes et al., 2023) and trigger algal blooms (Zhu et al., 2015; Rios-Yunes et al., 2023). Further, contaminated sediments might release pollutants such as heavy metals and organic compounds into the water column (Bradshaw et al., 2012), especially in the Baltic Sea with numerous account of offshore explosives (Wichert, 2011). These contaminants pose a risk to marine organisms and may affect human health through their potential accumulation in the food chain (Bradshaw et al., 2012). Finally, anchoring impacts the ability of marine sediments to store carbon. Disturbed sediments can release stored organic carbon and pyrite into the water column where it can be oxidized and release CO2, affecting carbon cycling in marine environments with possible implications for the global carbon budget (Epstein et al., 2022; Tiano et al., 2024; Zhang et al., 2024; Kalapurakkal et al., 2025).
The overall impact of anchoring on seafloor integrity depends on the local conditions, including hydrodynamics, sediment type, anchoring frequency, and duration at anchor. Sciberras et al. (2016) found a greater effect of trawling on biogeochemistry in muddy sediments than in sandy environments. Other studies note that macrobenthic communities in sandy, well-sorted sediment tend to be more resilient to physical disturbances compared to those in muddy, poorly sorted environments (Bolam et al., 2014). While the ecological implications of anchoring have been recognized and studied to varying degrees (e.g., Broad et al., 2020), the understanding of spatial and temporal dynamics of anchoring impacts is still poor. Estimates of anchoring pressure on habitats can be derived using AIS (Automated Identification System) data (Deter et al., 2017). Furthermore, the potential long-term persistence of anchoring footprints and their cumulative effects on habitat integrity require further investigation (Watson et al., 2022).
Hydroacoustic surveys, for example, by multibeam echosounder (MBES), offer a promising approach to understand the physical impact of anchoring on the seafloor. MBES surveys provide bathymetric data with cm-resolution in the vertical and decimeter resolution in the horizontal that can be used to detect anchoring tracks and monitor their changes over time (Watson et al., 2022; Schönke et al., 2022). Additionally, information on backscatter strength which are recorded simultaneously with bathymetry, offer insights into physical alterations to the seafloor surface resulting from anchoring. The acoustic signal from the MBES penetrates the seabed to a depth that varies with sediment type and frequency (typically a few centimeters to a few decimeters in shallow coastal waters for frequencies higher than 100 kHz (Huff, 2008; Lurton et al., 2015), and structures in the very-near subsurface affect the measured volume scatter component of the backscattered signal. Using a combination of multiple frequencies can improve the detection of features (Feldens et al., 2018; Brown et al., 2019), such as thin sediment layers (Gaida et al., 2019).
To evaluate the effects of anchoring on marine habitats, including the sediment composition, geochemical properties, and benthic communities, it is essential to monitor the long-term physical disturbances to the seabed and the subsequent sedimentological and morphological regeneration processes. Accurate detection of anchor tracks and seafloor alterations can support targeted sampling for ecological investigations. To reduce the need for extended and resource-intensive monitoring over several years, this study employs an integrative methodological approach that combines high-resolution multibeam bathymetry and backscatter data with chronological information based on a topological sorting algorithm and Automatic Identification System (AIS) data.
2 Materials and methods
2.1 Study area
The study area is located in the central Eckernförde Bay, which is bounded in three directions by the shoreline. The bay opens into the southwestern Baltic Sea about 20 km to the east (Figure 1). The water depth at the study site ranges between 14 m and 21 m, and the seabed is predominately composed of muddy sediments (Orsi et al., 1996; Bentley et al., 1996) with a high organic content of 4%–5% (Whiticar, 2002). Mean sedimentation rates in the central Eckernförde Bay are approximately 0.39 cm yr-1 (Nittrouer et al., 1998) with occasional peaks exceeding 1 cm yr-1 (Bentley et al., 1996). Sediment supply originates from the Baltic Sea and is redistributed by internal waves, as well as from shallower areas of the bay transported by downwelling associated with storm events (Nittrouer et al., 1998). The limited fetch of Eckernförde Bay reduces the likelihood of wind-driven waves resuspending consolidated sediment in the central bay, even during strong storm events (Friedrichs and Wright, 1995). The nearby city of Eckernförde with a population of about 22,000 inhabitants is a popular tourist destination with a sandy beach. Offshore, the bay is intensively used by small recreational, sailing and fishing boats as well as military vessels stationed at a naval base. In particular, the southern part of the study area falls within a designated warning area established by the German Navy, prohibiting anchoring or any similar ground contact.
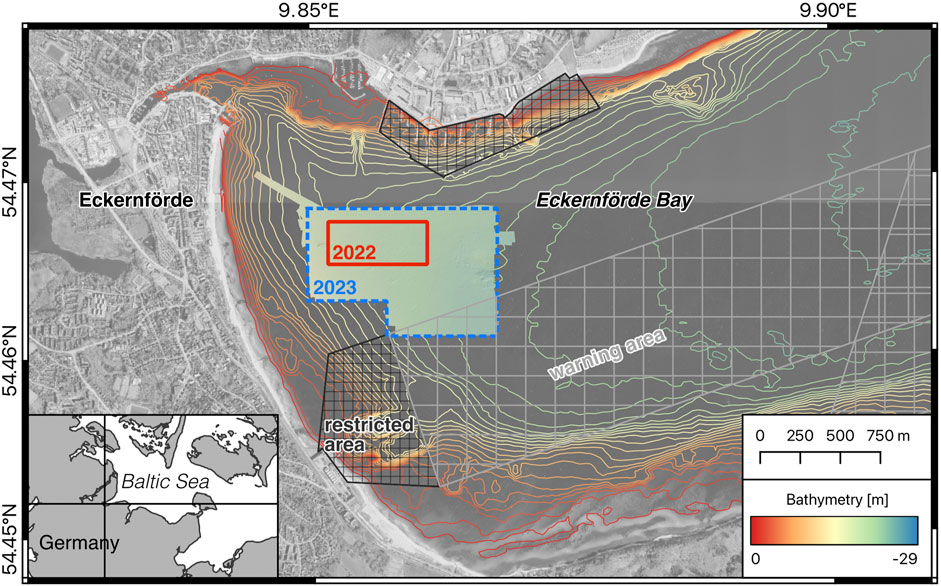
Figure 1. Map of the survey areas in August 2022 and September 2023, located in the inner part of the bay close to the city of Eckernförde. The background shows derived raster images of digital orthophotos DOP20 ⒸGeoBasis-DE/LVermGeo SH/CC BY 4.0. The location of Eckernförde Bay is indicated by the intersecting lines on the overview map.
2.2 Field work
The hydroacoustic dataset was collected during 1-week surveys in August 2022 and in September 2023. The initial survey area of 0.16 km2 in 2022 was extended to 0.84 km2 during the 2023 survey. The utilized NORBIT iWBMSe multibeam echosounder (MBES) with an integrated Applanix SurfMaster sensor for motion compensation was mounted on the 7 m long aluminum catamaran Klaashahn. The navigational accuracy was about 1 m during the survey in 2022 (EGNOS) and improved to a few centimeters during the survey in 2023 using received correction signals (RTK). The vessel maintained an average speed of around 3.5 knots throughout the surveys. Bathymetry and backscatter data were recorded using the NORBIT WMBS GUI, where the data were re-exported to apply a true heave calculation. The survey area was recorded twice each year, once at 200 kHz and once at 400 kHz frequency. The swath was set to 120° covered by 512 beams. The pulse length for data acquisition was set to 0.2 m. The hydroacoustic data were processed using the software QPS Qimera (2.6.3) for bathymetric maps and QPS FMGT (7.11.1) for backscatter maps. The bathymetry was gridded at 0.25 m and the backscatter mosaic at 0.1 m resolution.
2.3 Ground truthing
Sediment samples from the upper few centimeters were collected in both years using a small grab with a coverage area of 0.04 m2 on the seafloor. Following treatment with hydrogen chloride (HCl) to dissolve carbonate and hydrogen peroxide (H2O2) to eliminate organic matter, sediment sample grain sizes were optically analyzed using a Mastersizer 3000. While most samples were analyzed in suspension with water, the sample KH2309_3 was measured in a dry state. All results were classified according to grain size ranges outlined in Wentworth (1922).
2.4 Data analysis
Although a number of unidentified seafloor features were detected, the focus in this study is on the analysis of the abundant anchoring tracks in the survey area. Basis for this analysis were bathymetry and backscatter maps for both frequencies as well as maps derived from bathymetric data.
2.4.1 Digitization of tracks
The manual digitization of the anchoring tracks involved navigating between the different hydroacoustic maps, including bathymetry, backscatter, slope, and geomorphic classification (Jasiewicz and Stepinski, 2013). The primary focus was directed towards delineating the main anchor track, corresponding to the maximum depth of the furrow and including the impact crater. The track results from a combination of the initial anchoring and subsequent retrieval (Figure 2). The clarity of individual tracks plays a significant role in the accuracy of digitization and subsequent analysis. Fresher tracks with well-preserved features allow for more precise mapping of their central lines compared to older, more eroded tracks. This variability impacts the calculated averages for track characteristics, as less-defined tracks introduce more uncertainty into the data. Consequently, these variations need to be considered when analyzing and interpreting track morphology over time. Due to the varied and often ramified appearance with much overlap, an adjacent abrasion area created by the scraping anchor chain was excluded from the digitization. Anchor tracks that intersected were grouped into a cluster. The vertical order of anchor tracks allowed to differentiate their relative age, with younger anchor tracks intersecting and partially eroding older anchor tracks. An example of intersecting anchor tracks is shown in Figure 3. This temporal order at each intersection of the anchor tracks was manually determined based on the hydroacoustic maps.
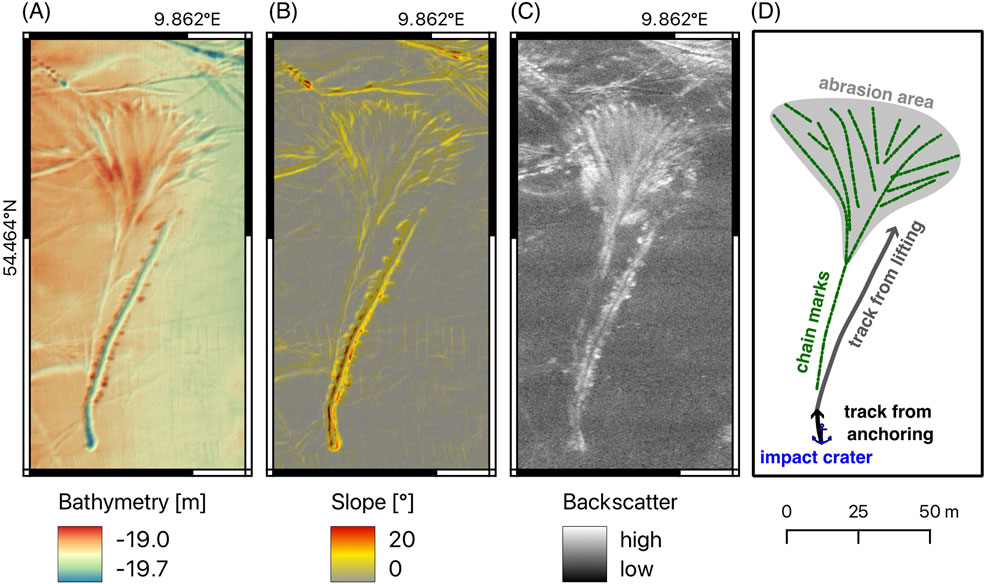
Figure 2. Impact of an anchoring process on the seabed shown in bathymetry (A), slope (B) and backscatter at 400 kHz (C). The different stages of the process are labeled in the schematic (D). For location within the survey area see Figure 5.
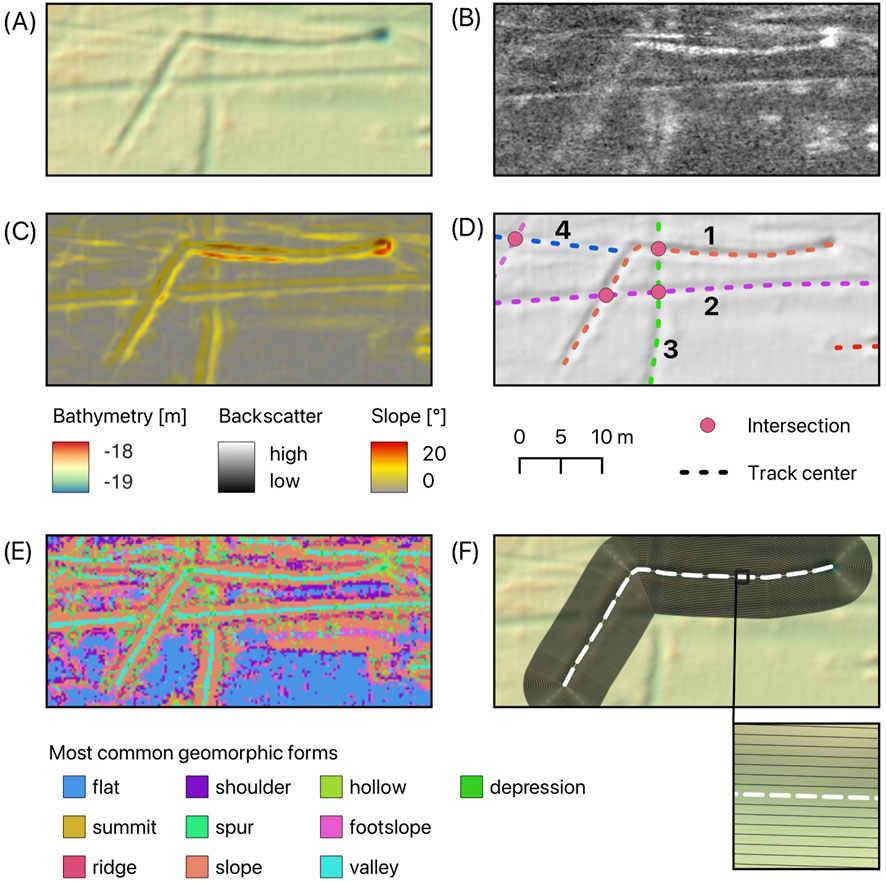
Figure 3. Tracks were manually digitized using the hillshaded bathymetry (A), backscatter map at 400 kHz (B) and slope data (C). (D) The centers of anchoring tracks were marked with dashed lines, where visible, and intersections (pink dots) were subsequently derived from these lines. In this example, Line 1 crosses over Lines 2 and 3, while Line 2 overlays Line 3. The relationship between Lines 1 and 4 cannot be clearly determined. Additionally, the most common geomorphic forms were derived in (E). (F) A multi-ring buffer centered on the furrow, extending 5 m on either side with 0.1 m intervals, generation a total of 50 rings for quantification. For location within the survey area see Figure 5.
2.4.2 Chronological order
The relative temporal order of anchoring tracks on the seafloor can be mathematically conceptualized as a directed acyclic graph (DAG). In this framework, a graph consists of nodes and edges connecting pairs of nodes. The graph is directed if the edges have a defined orientation and acyclic if cycles are absent. Each node of the graph represents an anchor track, while the edges represent the temporal order between two tracks. The temporal order has a defined orientation (one track is older than the other) and must be acyclic (an old track can never be younger than a younger track). The tracks within the large central cluster were ordered chronologically by using the intersection information as input for a topological sorting algorithm. The python package NetworkX (Hagberg et al., 2008) was used to generate a directed graph in form of a python class (nx.DiGraph), to fill the graph with the intersection information (add_edge) and to confirm that the graph is a DAG (nx.is_directed_acyclic_graph). After, the tracks are assigned to different generations (nx.topological_generations), ensuring that a preceding track is always in a previous generation and a subsequent track in a following generation, while placing the track in the earliest generation possible. Finally, the DAG is plotted (nx.draw) as a dependency tree.
2.4.3 Geospatial statistics
Geospatial analysis allows to quantify the impact of anchoring on the physical seafloor integrity. The geospatial analysis assumes symmetrical features on both sides of an anchor track. For evaluation, a multi-ring buffer with 0.1 m intervals was generated around each track line, extending up to 5 m on either side (see Figure 3F). The buffer rings of different tracks intersect and overlap, causing some data points to be included in the buffer rings of more than one track. Using the QGIS tool Zonal statistics, mean values for bathymetry, slope, and backscatter were calculated for each of the 50 buffer rings, separately for the two frequencies (200 and 400 kHz). These frequency-specific mean values were then utilized to generate average seafloor property profiles (depth, slope, backscatter) for the different generations of anchor tracks. To normalize bathymetric profiles relative to water depth, all mean values were adjusted by subtracting the weighted mean of the 3–5 m distance range. To estimate the volume of the anchor tracks, the cross-sectional area was calculated from the average seafloor depth profiles and doubled to account for symmetry. The mean cross-sectional area along an anchor track was then multiplied by the track length to determine the mean incision volume. This volume represents the sediment displacement per meter of anchor track. By multiplying this value with the total length of all digitized anchor tracks in the study area, a rough estimate of the total sediment displacement caused by anchoring activity is obtained.
2.4.4 False-color image
False-color imagery can facilitate the interpretation of complex spatial datasets by assigning different color channels to different data attributes (Tamsett et al., 2016). In this study, the backscatter intensities recorded at two frequencies (200 and 400 kHz) are allocated to the first two channels (red and green), while the slope derived from the 400 kHz bathymetry is assigned to the third channel (blue), creating an RGB composite image.
2.4.5 AIS data
Automatic identification system (AIS) data of the Baltic Sea were downloaded from the Danish Maritime Authority (https://www.dma.dk, last accessed 17 December 2024), which provides free access to historical AIS raw data and information on AIS usage. According to international regulations, all fishing vessels exceeding 15 m in length, all passenger vessels, and ships with a gross tonnage greater than 300 tons are required to carry class A AIS transmitters. Smaller vessels, such as recreational boats, may use class B AIS transmitters, but are not obliged to do so. All data were filtered to include only entries within a rectangle defined by the upper left (54.47° N, 9.845° E) and lower right (54.45° N, 9.87° E) corners. Additionally, only records reporting a navigation status of ‘Moored’ or ‘At Anchor’ were included. Entries from vessels reporting speeds exceeding one knot were excluded to ensure accurate identification of anchoring events. The dataset spans from covered time range is 02 May 2014, 09:35:33 to 06 December 2023, 10:11:12. However, data from January 2016 to June 2017 are missing due to corruption during the download process. A total of 118 unique vessels were identified as having anchored or moored within the investigation area during the specified time period, with many of them doing so multiple times. Most of these vessels reported a draught between 4 and 5 m. During anchoring, AIS data transmissions are expected at intervals of 3 minutes. Nevertheless, the dataset frequently shows longer gaps between successive entries. However, a minimum total anchor time in the area (Figure 4) can be estimated based on the number of anchor reports of each vessel’s AIS system, assuming that each entry corresponds to a 3-min interval.
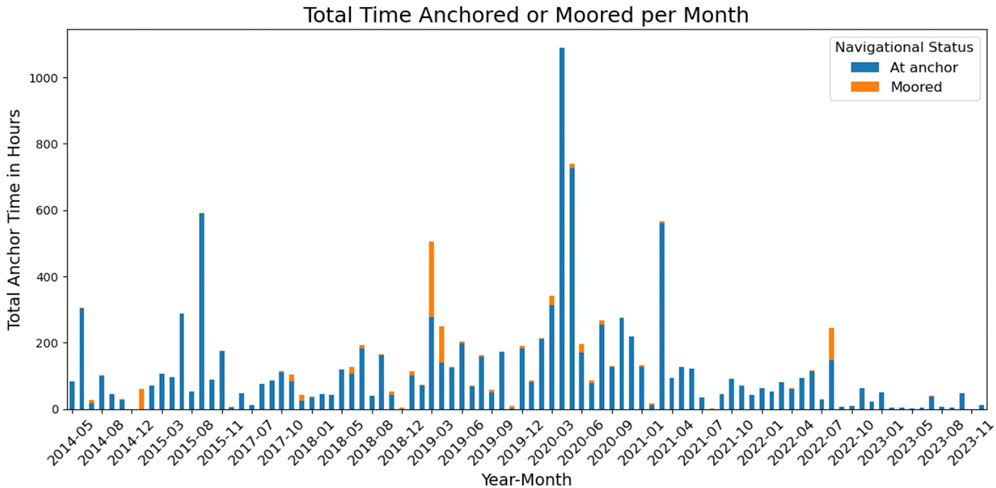
Figure 4. Total duration vessels reported a navigation status of ’At Anchor’ or ’Moored’ within the investigation area. Data from January 2016 to June 2017 are missing.
3 Results
3.1 Seafloor sediments
The grain size analysis of five stations in the central part of the study site reveals similar distribution of cohesive, fine-grained sediments (samples KH2208_07, KH2208_08, KH2208_09, KH2208_10, and KH2309_02). The majority of the grain size distribution at these stations is within the silt range (64.5%–71.8%), with minor parts in the sand (12.0%–16.5%) and clay (14.1%–17.7%) ranges (Figure 5B). The westernmost station KH2309_01 shows an increased percentage of sand (32.9%) and almost no clay (2.6%). The sediment from station KH2309_4 in the east shows an increase of the sand fraction (25.6%) and a slight decrease in the clay fraction (10.7%). Although located only 20 m away, the sediment sample KH2309_3 comprises a high percentage of sand (88.3%) and grain sizes in the range of gravel (4.3%).
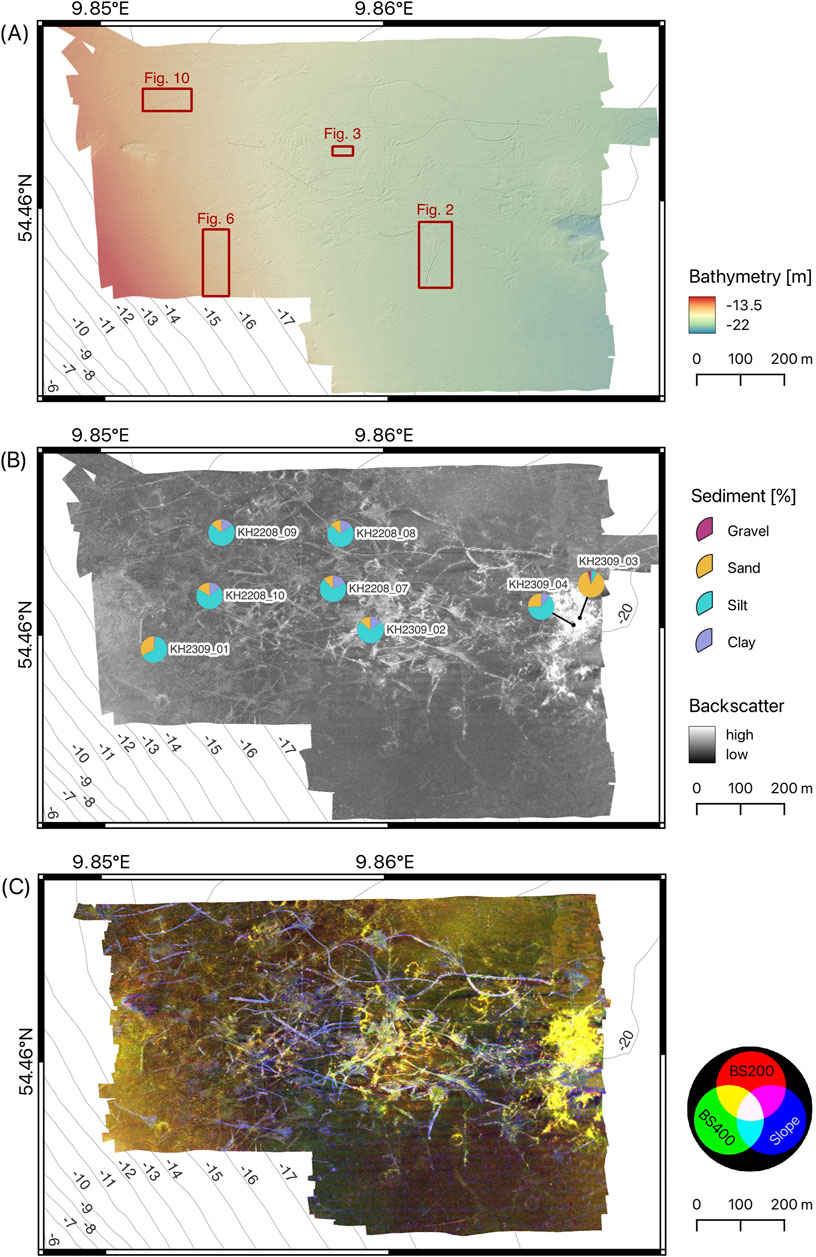
Figure 5. Hydroacoustic maps of the survey 2023. (A) The hillshaded bathymetry at 0.25 m resolution shows numerous anchor tracks and the location of maps used in Figures 2, 3, 6, 10. (B) Backscatter intensity at 400 kHz frequency and the grain size distribution at eight stations. (C) False-color image composed of backscatter intensity at 200 kHz (red), backscatter intensity at 400 kHz (green), and slope data at 400 kHz (blue).
3.2 Analysis of an anchor track network
In general, the seafloor at the survey site is gently sloping, with water depths ranging from −13 to −21 m (Figure 5A). Backscatter data reveal subtle changes in seafloor sediment composition, particularly towards the western and eastern sides of the area (Figure 5B), which is highlighted by yellowish colors in the false-color image (Figure 5C). Increased backscatter intensity at the western boundary of the survey site corresponds to a higher sand fraction in station KH2309_01. Very high backscatter intensities at the eastern boundary are related to the occurrence of gravel-sized sediment particles (station KH2309_03).
The central and northern parts of the survey site, while of similar sediment composition, exhibit numerous overlapping seabed features recognized in bathymetric and backscatter data, which are interpreted as remnants of anchor-related events. In addition to the anchoring tracks, the area exhibits other features such as ring-shaped formations (possibly from dumping activities (Díaz-Mendoza et al., 2023)), pockmarks (potentially caused by fluid flow (Hoffmann et al., 2020)) and isolated boulders. However, these additional features are not the focus of this study. Larger, undisturbed sections of the seafloor are limited to the southern region, where all bottom-contact activities are prohibited. The anchor tracks, likely from ships and buoys show different orientations, lengths, and depths. Some tracks are curved, while others display broomstick-like abrasion patterns of varying spatial extents. In backscatter maps, the anchor tracks are represented as continuous lines of medium backscatter intensity flanked by increased backscatter values to both sides. The majority of anchor tracks are recognized both in bathymetric and backscatter data. However, certain anchor tracks are not detectable in the bathymetric (Figure 6C) or slope data (Figure 6D) but become visible exclusively in the backscatter maps (Figures 6A, B). The backscatter patterns of these tracks are similar to those with pronounced elevation but less distinct and more faded. In the false-color image (Figure 6E), the high-backscatter flanks are represented by yellowish hues, in contrast to the bright blue and white tones depicting the mounds which are also visible in the bathymetry.
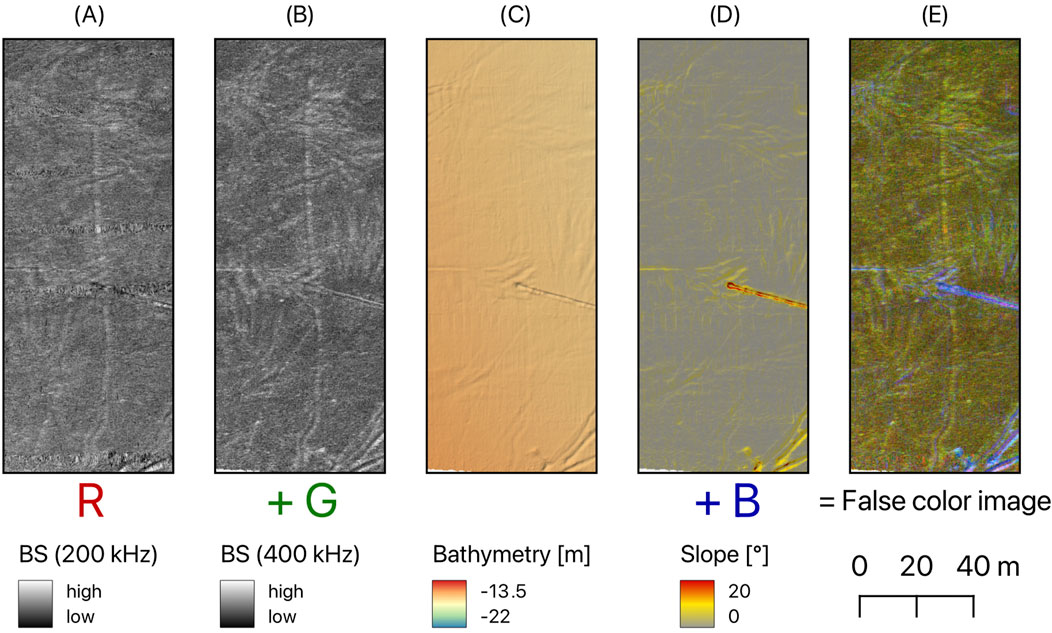
Figure 6. Hydroacoustic maps showing anchoring tracks of different stages of erosion: (A) backscatter intensity at 200 kHz, (B) backscatter intensity at 400 kHz, (C) hillshaded bathymetry at 400 kHz, (D) slope at 400 kHz, and (E) false-color image composed of backscatter intensity at 200 kHz (red), backscatter intensity at 400 kHz (green), slope at 400 kHz (blue). The red interference arises from along-track noise in the 200 kHz backscatter, while the slopes of the mounds are highlighted in bright blue. For location within the survey area see Figure 5.
The density of the anchor tracks changes across the site. The average orientation of all digitized track segments is 81°, aligning with the prevailing wind direction in Eckernförde Bay. A total of 585 tracks were digitized, with lengths (excluding abrasion features) varying from a few meters to 940 m (Figure 7). The most extensive network included 165 distinct, intersecting anchor tracks. A topological sorting algorithm was used to create a directed acyclic graph (DAG) of these 165 anchor tracks with 237 evaluated intersections, resulting in nine distinct generations (Figure 8). For simplification, the youngest generation with only two tracks, was merged into the previous generation. Generally, the number of tracks decreases with each successive generation, except for Generation 2.
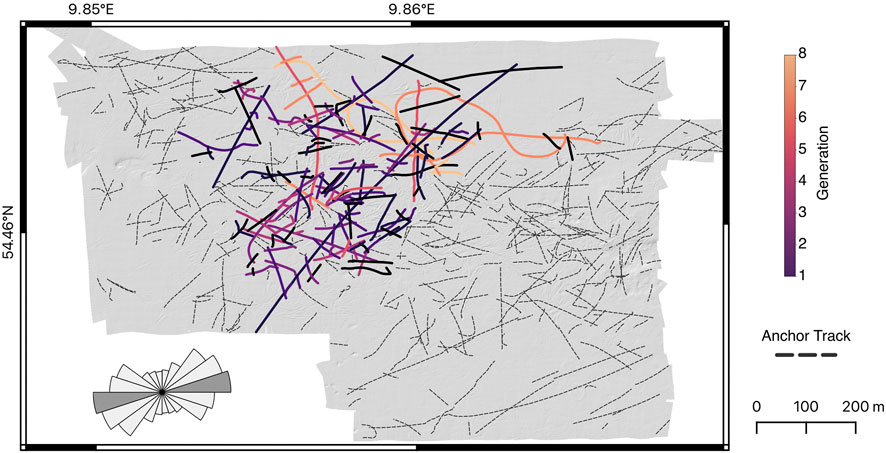
Figure 7. The largest network of anchor tracks in the survey area, with colors indicating the relative chronology from oldest generation to youngest based on a topological sorting algorithm. All other anchoring tracks identified, but not connected to the main cluster, are displayed as dotted lines. The background shows the hillshade based on the bathymetry. The rose plot shows the main orientation of the anchor tracks in the survey area of 81°.
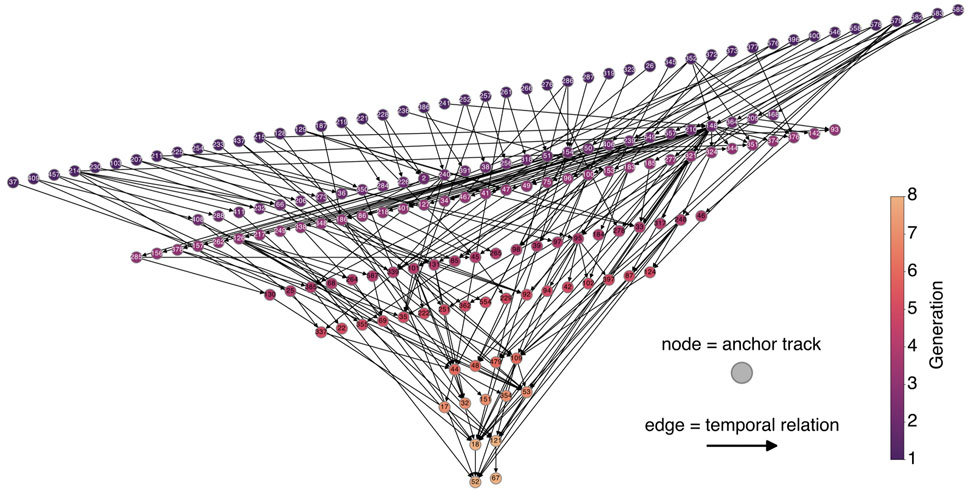
Figure 8. Directed acyclic graph (DAG) illustrating the temporal order of anchoring tracks as organized by a topological sorting algorithm. Each node corresponds to an individual anchoring track, while each directed edge indicates a temporal relationship between two tracks. The network is organized into distinct generations.
The averaged profiles derived from geospatial statistics provide the basis for extracting key characteristics of the anchor tracks from hydroacoustic data. The bathymetric profiles of these anchor tracks averaged by generation show a clear trend of morphological change over time (Figures 9A, D). Younger generations exhibit deeper furrows, reaching up to −0.15 m depth, while older generations are significantly shallower, with depth of approximately −0.05 m. Averaged mound elevations range from 0.01 to 0.02 m and gradually decrease over time. The oldest generation exhibits minimal to no measurable averaged mound elevation. The individual furrow depths and mound elevations are underestimated, as the tracks were averaged both by generation an within the buffer rings. The inner sides of the mounds are steeper than the outer ones, which are marked by a secondary peak in the slope that rapidly fades over time (Figures 9B, E). Slope values stabilize approximately 2.5 m from the track center, marking the lateral extend of measurable seabed disturbance. Backscatter data indicate a broader impact area than bathymetric profiles alone suggest. Intensities remain increased up to 4 m from the track center (Figures 9C, F). The highest backscatter values appear at the mound peaks and decline sharply toward the furrow centers. Right-skewed distributions of backscatter intensities suggest a more gradual transition from the outer edges of the mounds to the surrounding seafloor (Figures 9C, F). Overall, backscatter intensity decreases with each successive generation, except for generation 2, which exhibited relatively high values both on the mound and at greater distances. Tracks from this generation have a particularly large number of intersections, which likely contribute to the increased values at greater distances of the averaged profiles. Differences between the two frequencies, 200 kHz and 400 kHz, are minimal both for bathymetric parameters and backscatter intensity. Variations in mound elevation are negligible, but furrow depth is slightly greater at 400 kHz for all generations (with 0.3–2 cm). This results in steeper slopes, especially in younger generations. Relative backscatter intensities show a variation of approximately 3 dB within each frequency.
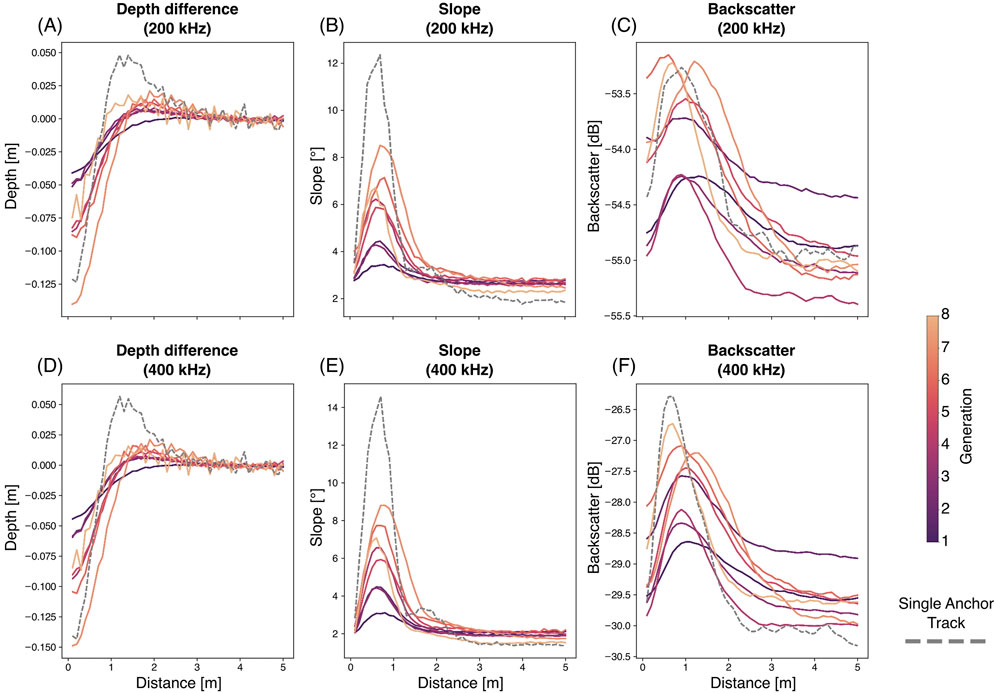
Figure 9. Averaged profiles for anchor track generations (colored) and the observed single anchoring track shown in Figure 10 (dashed gray) at 200 kHz and 400 kHz frequencies: (A, D) difference in bathymetry relative to the weighted mean over distances of 3–5 m, (B, E) slope, and (C, F) backscatter strength.
3.3 Analysis of an observed single anchoring event
In 2022, a single anchoring event occurred within the surveyed area at a depth of 16 m–17 m, coincidentally discovered during measurements. A subsequent survey was conducted approximately 12 h later after the 101 m-long ship left and 377 days later during the second survey in 2023 (Figures 10A–C). The anchoring imprint begins with an impact crater in the east, initially reaching a maximum depth of approximately −0.7 m compared to the surrounding seafloor in 2022, which diminished to −0.4 m in 2023 (Figure 10F). The subsequent 180 m-long track shows a furrow depth of approximately −0.3 m, while the mounds reach elevations of up to 0.2 m (Figure 10E). The averaged track profiles from 2022 reveal a maximum depth of −0.15 m for a frequency of 200 kHz, while it was −0.22 m for a frequency of 400 kHz (Figure 11A). One year later, the average maximum depth of the furrow decreased to −0.13 m (at 200 kHz) and −0.15 m (at 400 kHz). The mounds exhibited an averaged maximum height of 0.07 m (at 200 kHz) and 0.10 m (at 400 kHz) in 2022, which decreased to 0.05 m (at 200 kHz) and 0.04 m (at 400 kHz) in 2023 compared to the surrounding seafloor. The peak of the averaged mounds shifted several decimeter away from the center. Overall, the observed anchoring process altered the seafloor morphology within a distance of about 3 m on both sides of the track center. The highest slope values occur at a distance of approximately 0.8 m from the track center for both frequencies and survey years (Figure 11B). In 2022, the maximum averaged slope reached 18° (at 200 kHz) and 27° (at 400 kHz), decreasing to 12° (at 200 kHz) and 15° (at 400 kHz) in 2023. The outside of the averaged mounts (1.2–3 m distance) became less steep after 1 year, which was consistent for both frequencies. However, notable standard variations were observed, especially around the maxima. Increased backscatter intensities, available only for the 2023 survey, are observed within a distance of approximately 2.5 on either side of the track center (Figure 10D), corresponding with bathymetric changes (Figure 11C). The maxima for backscatter intensity align closely with slope peaks and are more pronounced at the 400 kHz frequency, particularly across the furrow and much of the mound.
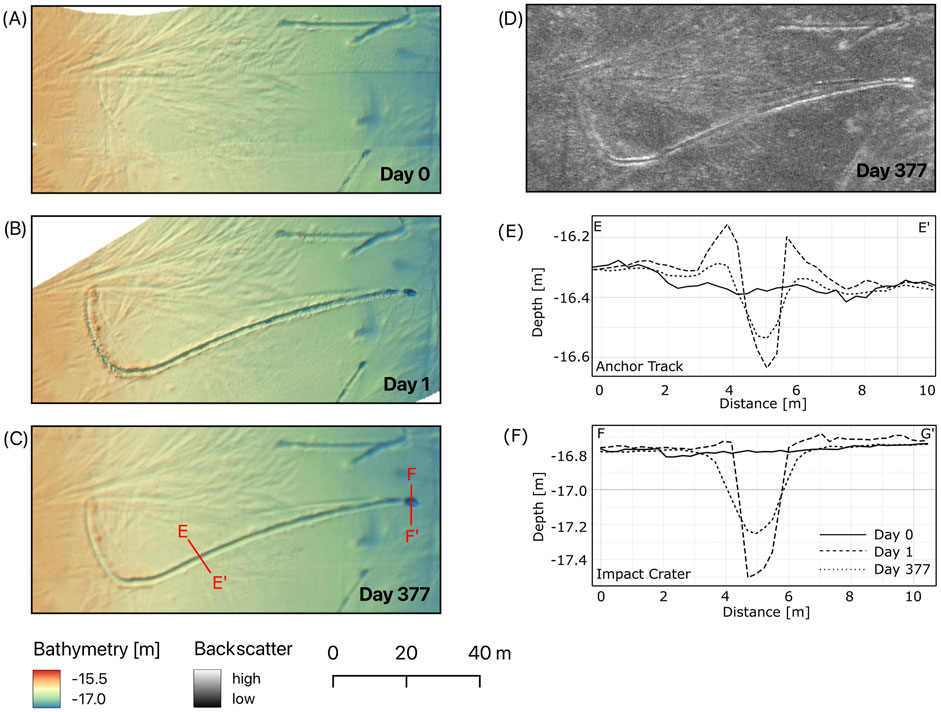
Figure 10. Hillshaded bathymetry (400 kHz) at 0.25 m resolution showing a single 180 m-long anchor track: (A) before disturbance at Day 0 in 2022, (B) at Day 1 after the creation in 2022, and (C) at Day 377 in 2023. (D) Backscatter at 400 kHz of the single anchor track in 2023. (E) Profile of the single anchor track. (F) Profile of the anchor impact crater. For location within the survey area see Figure 5.
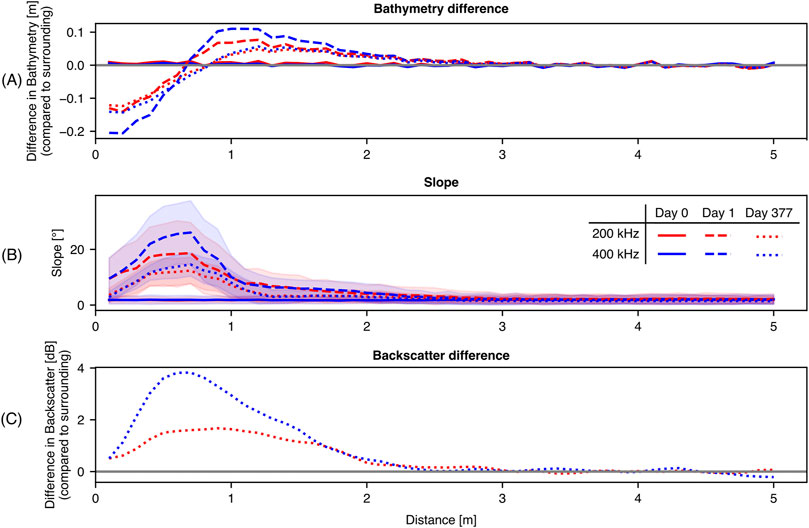
Figure 11. Averaged profile for the observed single anchoring track at three different time points: (A) difference in bathymetry relative to the weighted mean of distances of 3–5 m, (B) slope with standard deviation, (C) difference in backscatter relative to the weighted mean of distances 3–5 m (only for 2023).
3.4 AIS data
The analysis of AIS data provides detailed insights into the timing and location of the anchoring process for the investigated single anchor track (Figure 12A). The anchoring process of the ship began with the first recorded ‘At Anchor’ entry with a reported speed over ground of 0.8 knots in the navigational status, following the final ‘Under way using engine’. Due to the ship’s length of 101 m, the GPS antenna’s position creates an offset from the actual anchor location, further affected by the anchor chain length. Multiple AIS data entries during anchoring indicated positions approximately 135 m west of the final anchor position on the seafloor. The final ‘At Anchor’ entry marks the end of the anchoring period, with a total duration of approximately 2.5 h. This relatively short duration, combined with a steady wind direction, prevented the formation of a pronounced abrasion area at the seabed. The curved section of the anchor track, oriented northward, was likely attributed to the process of anchor retrieval and departure.
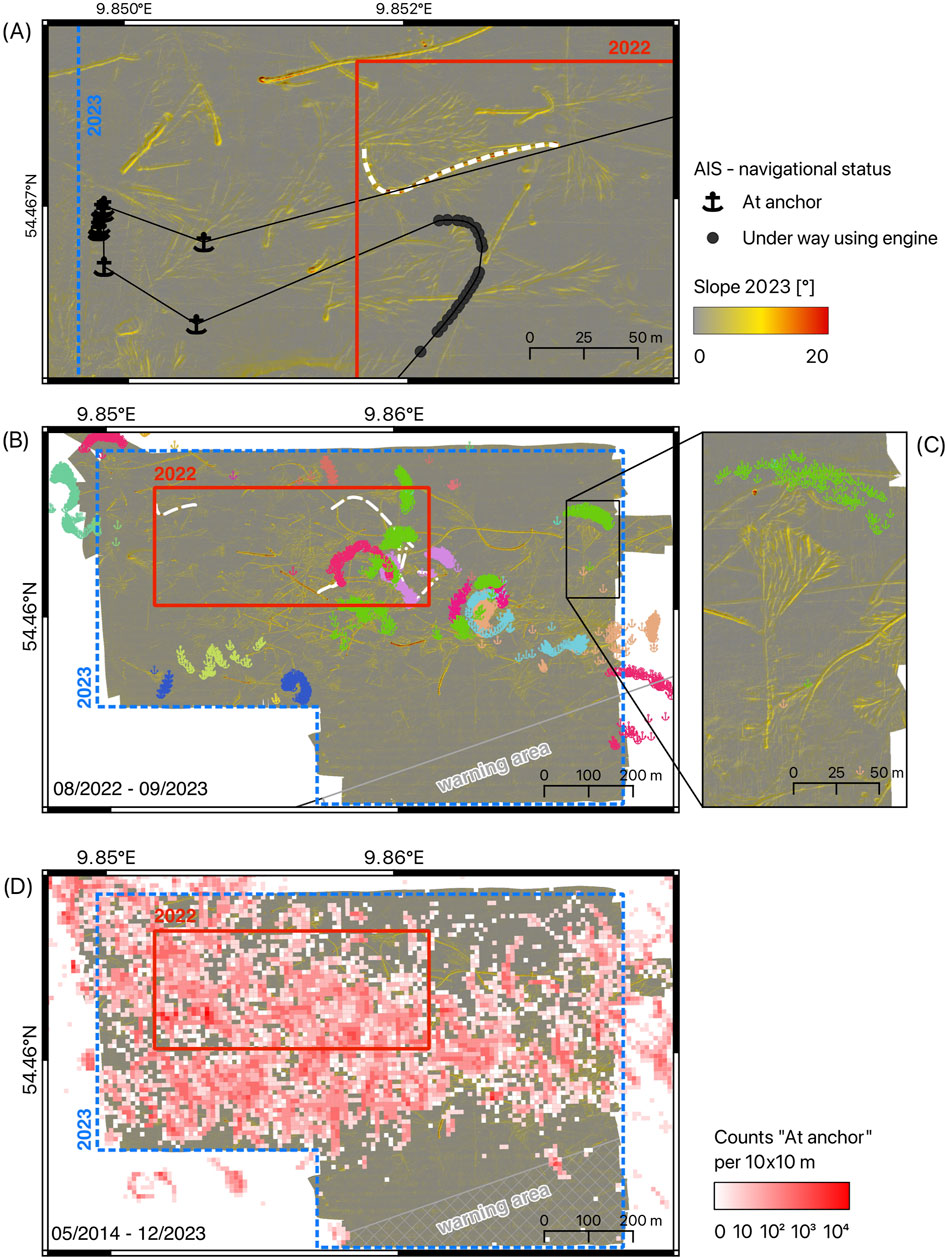
Figure 12. The AIS data overlaid on slope data of 2023 illustrate the position of the ships while at anchor. (A) Ship positions prior to (black dots) and during (black anchors) the creation of a single anchoring track (white dashed line). (B) AIS data with the navigational status ’At Anchor’ between the surveys in August 2022 and September 2023, colored by ship name. Seven new anchor tracks (white dashed lines) were formed in the overlapping area during this period. (C) Detailed view of an anchor track (304 days old) with its abrasion area and associated AIS data (green anchors) of the anchoring ship. (D) The counts of AIS data entries ‘At Anchor’ per 10 × 10 m grid for the time of May 2014 to December 2023, highlighting clusters of increased density.
Between August 2022 and September 2023, AIS data recorded anchoring events from 37 vessels within or near the study area of 2023 (Figure 12B). In the area overlapping with the survey of 2022, seven new anchor tracks were identified in 2023, while all other visible tracks predate the initial survey in 2022. In the central part, where anchor tracks overlap densely, directly matching individual tracks to specific AIS data entries was challenging due to the offset between the vessel’s GPS antenna position and the actual anchor location. However, for more isolated tracks, clear relations between anchor tracks, abrasion areas, and AIS data could be established (Figure 12C). The alignment of abrasion patterns with the ‘opening angle’ of curved AIS positions at specific distances supported these correlations. A total of 30 tracks were manually matched with AIS data. The oldest identifiable track dated back to 2018 and remained clearly visible in both bathymetric and backscatter data. AIS data from May 2014 to December 2023 revealed a concentration of ‘At Anchor’ entries in areas where numerous anchor tracks were identified and extensive abrasion features cover large parts of the seafloor (Figure 12D). The AIS data shows a distinct decline of anchoring towards the warning area in the south. Eight anchor tracks could both be matched to AIS data and were part of the topological sorted network. Their averaged bathymetric profiles (Figures 13A, D) indicate deeper furrows for younger tracks, with a maximum depth of −0.19 m and maximum mound elevation of 0.45 m. Slope profiles show peak values of 14.9° and 15.7° at a distance of 0.7 m, generally decreasing over time with some exceptions (Figures 13B, E). The averaged backscatter profiles show slight variations but no clear trend over time. However, a 236 day-old track shows unexpected profile characteristics (Figures 13C, F). It is situated in a heavily impacted area with multiple tracks and abrasion features. As a result, the averaged slope profiles display lower values approximately 5° for the peak and increased values around 4° at greater distances. The averaged backscatter profiles indicate high intensities across all distances, with a slight decrease of backscatter intensity toward the outer edges.
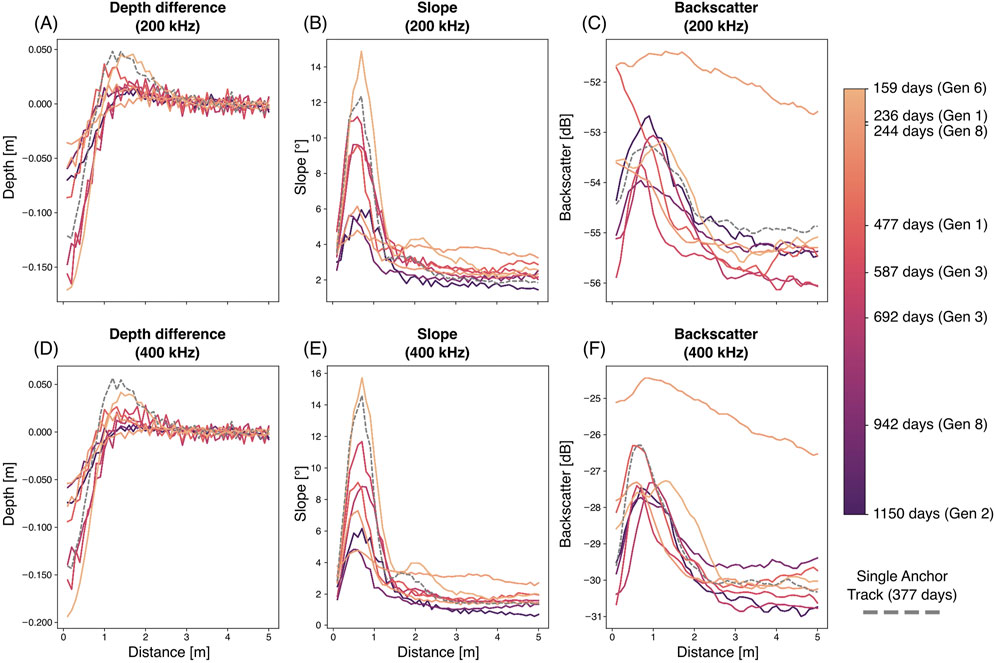
Figure 13. Averaged profiles of selected tracks within the large network, color-coded by age based on AIS data and the single anchoring track shown in Figure 10 (dashed gray), recorded at 200 kHz and 400 kHz frequencies: (A, D) bathymetric difference relative to the weighted mean over distances of 3–5 m, (B, E) slope, and (C, F) backscatter strength. All ships were between 72 and 101 m long.
4 Discussion
In terms of investigating the anthropogenic impacts on the marine environment, Descriptor D6 within the EU Marine Strategy Framework Directive (MSFD) specifically addresses the importance of seafloor integrity for benthic ecosystems (European Parliament, Council of the European Union, 2008). Furthermore, anchoring is identified as a physical damage that causes abrasion of the seabed. Understanding both, the alterations caused by anchor disturbance and the time required for benthic habitats to return to equilibrium is critical for monitoring the environmental status. In Eckernförde Bay, the presented multibeam echosounder data have revealed numerous anchor tracks on the seabed. The most prominent observed features are elongated or curved furrows formed by anchors moving across the seafloor, cutting into the substrate and increasing seafloor roughness. These anchor tracks transform an initially smooth seafloor surface into one characterized by furrows on the scale of decimeters.
Within the 0.84 km2 survey area, a total anchor track length of 34 km was identified. Based on an impact radius of 3 m derived from the digitized anchor tracks in the bathymetry and backscatter data, it is estimated that at least 20% (0.18 km2) of the survey area is directly affected by anchors plowing through the seabed, excluding the broomstick-like abrasion areas (Figure 2D). Measurements of sediment excavation, derived from the observed single anchor track recorded on Day 1 at a frequency of 400 kHz (Figure 11A) indicate an average displacement of 0.2 m3 of sediment per meter of track, resulting in a total sediment displacement of 36 m3 for the entire anchor track length of 180 m. Extrapolating this value across the 34 km of identified tracks suggests that approximately 6,800 m3 of sediment have been displaced by anchoring activities. However, this is a rather conservative estimate, as track depth is diminished to some extent by averaging, and sediment displacement caused by chain abrasions is not accounted for. Therefore, estimations for sediment displacement are significantly lower than found by Watson et al. (2022), who include the abrasion area and give maximum volumes based on a different approach.
Interannual comparison of the anchor tracks in the study site demonstrates the long-lasting impact anchoring has on seafloor morphology. The persistence of the single anchor track over 1 year confirms this impact (Figures 10A–C). Despite 1 year of exposure, the track slope shows high values and classifies as a ‘fresh’ track. This is in line with the results of related studies. For instance, Watson et al. (2022) documented anchor tracks in mud-dominated sediments remaining detectable for over 4 years based on bathymetric measurements. Jakobsson et al. (2024) reported that trawl tracks, with similar disturbance patterns as anchor tracks, can remain visible for over 8 years. These findings highlight the persistence of anchoring tracks, particularly in cohesive, fine-grained sediments within sheltered environments such as Eckernförde Bay, which are often selected for safe anchoring. As a result, such areas may be especially vulnerable to repeated anchor disturbances due to both their sedimentary characteristics and their preferential use as anchorages.
Physical alterations of the seafloor surface can be observed in the bathymetric data as reductions in mound elevation and furrow depth. The contrast between a smooth seafloor surface and one marked by furrows and mounds serves as the basis for assessing sediment displacement. Surface smoothing appears to be less pronounced at the low frequency, which is likely an artifact of the beam geometry. Frequency-dependent differences in footprint size (across track beam width at center frequency 1.8/0.9° and along-track beam width at center frequency 3.8/1.9° for 200/400 kHz), combined with the narrowness of the furrows, contributes to the observed depth differences. The MBES footprint sizes at nadir of 60 × 126 cm at 200 kHz and 30 × 63 cm for 400 kHz at 19 m water depth, lead to an underestimation of furrow depth by the lower frequency as the furrows are 1–2 m wide. By Day 377, the distinctions between the frequencies are diminished, with both depth differences and standard deviation decreasing, indicating the beginning infill of the furrows and return to bathymetric equilibrium seafloor conditions of the formerly rough mounds adjacent to the tracks (Figure 11).
Establishing a temporal framework for the various anchor tracks provides insights into their degeneration processes. Averaged track profiles reveal that early in the regeneration process, furrow refilling occurs rapidly, likely using material from the adjacent mound. This is evident from the observed single anchor track, where furrow widening and a simultaneous reduction in mound elevation were observed within 1 year (Figure 11A). Elevation differences at the outer rims of the mound show minor variations over both time scales and frequencies. Over time, this compensation movement of sediment decreases as mounds become nearly leveled and the slopes gradually decrease in older generations (Figure 9) and for tracks older than 942 days (Figure 13D). Since the oldest generation no longer shows mound elevations but still retains an average furrow depth of −0.04 m, it can be concluded that, of the two features, the furrow persists longer as a morphological structure on the seafloor.
The long-lasting effect of former tracks on the shallow subsurface is highlighted by the backscatter information. While the (averaged) slope profiles overall show a decline of the peak over time, backscatter values show almost no signs of change during the first years. The changes caused by an anchor track on the seafloor are so dominant that even after morphological equilibrium has been reached and anchor tracks are no longer detectable in the bathymetric data, they can still be observed in the backscatter intensity maps (Figure 6). The underlying causes of tracks detectable only in backscatter data remain uncertain within the scope of this study. However, the contribution of furrow and mound slopes, which significantly influence backscatter for fresher tracks, can be excluded as a determining factor in this case. A persistent change in sediment composition at the seafloor may explain the continued visibility of tracks in backscatter data. Sediment sorting at a regional scale, as observed in studies of long-term trawling, results in coarser mean grain sizes due to the removal of finer fractions by currents after resuspension (Trimmer et al., 2005; Jakobsson et al., 2024). However, in our study area, no evidence of such regional sorting due to anchoring is observed in the sediment samples of the upper centimeters. Instead, there is a tendency toward increased sand content in less disturbed zones. On a very local-scale, sediment sorting during anchor track erosion remains a plausible mechanism. The sediment in the survey area is composed of different grain sizes and during the initial anchor movement, finer resuspended sediment will settle farther from the track than coarser fractions. Due to the low hydrodynamic activity in Eckernförde Bay, the degradation of anchoring tracks is very slow as results have shown. Over time, it is possible that limited sediment transport gradually relocates finer fractions from the relatively exposed mounds into the shielded furrows or to surrounding areas. Consequently, the coarser fraction may persist in the former mound locations even after the bathymetric imprint has disappeared. Since coarser sediments typically generate higher backscatter intensities (Collier and Brown, 2005), increased backscatter values might remain along the track edges even in the absence of morphological features. Unfortunately, a detailed sediment sampling necessary to compare grain size distributions between mound and furrow areas could not be carried out during the survey. Another potential explanation for increased backscatter along tracks without slope is sediment compaction. An archaeological study in the intertidal zone of the North Sea has shown that the mechanical load of former structures during the 14th-century caused long-lasting subsurface compaction, which today facilitates the reconstruction of their locations using geophysical methods (Wilken et al., 2024). In the case of anchor tracks, mounds consist of older, more compacted subsurface material displaced during anchor scouring, effectively adding load to the underlying sediment. This enduring compaction may enhance backscatter intensity relative to undisturbed areas.
This study demonstrates that both topological sorting and AIS-based dating have their advantages and limitations. In areas with high track density and good data quality, topological sorting effectively reconstructs a relative chronology and shows erosion trends. This approach also allows the inclusion of tracks that either lack or no longer have an associated abrasion area. Potential inaccuracies of this method arise, particularly along the outskirts of the anchoring network or for shorter tracks, which have fewer intersections to link them with others. The dating errors become obvious when comparing the matched AIS data and the assigned generation derived by the topological sorting algorithm (Figure 13). For more isolated tracks, AIS-based dating data is more precise, particularly when a well-defined abrasion area is present to align with the reported positions of the vessel’s GPS antenna, and reconstruction of an absolute chronology is possible. Combining both methods improves the overall understanding of track degradation.
If anchoring leaves a long-term imprint on the seafloor and the shallow subsurface, it raises the possibility that other marine activities may have similarly persistent impacts, warranting further investigations into the cumulative effects of anthropogenic activities on seafloor integrity. The monitoring of such activities could benefit from including backscatter measurements, which can reveal subtle changes in the upper sediment layer. These changes, while are not always apparent in bathymetric data, may have long-lasting effects on seafloor integrity as shown in this study.
5 Conclusion
The spatial distribution and morphological shape of anchor tracks on the seafloor can be mapped with high accuracy using hydroacoustic methods. Chronological information can be obtained through intersections to determine relative generations, which is effective in areas with dense anchor tracks. Alternatively, AIS data provide exact dates, but allocation is more precise for isolated tracks. The tracks have a long-lasting impact on the predominantly silty seafloor of Eckernförde Bay. Even when the bathymetric evidence at the surface is eroded, differences in the sediment remain visible in backscatter intensities. The results of this study suggest that changes in backscatter likely caused by sediment grain size sorting during degeneration. However, biological and chemical mechanisms may also contribute but were not assessed in this study. While the primary focus of this study is methodological rather than ecological, the long-term physical impacts of anchoring tracks on sediment structure raise relevant questions for habitat integrity. Anchor tracks are considered a thread to the environment with a rising number of measurements to understand and define measures to reduce the impact (Broad et al., 2020; Argüello et al., 2022). Since the interest of the impact of anchoring ships to the environments by authorities is increasing, it might be valuable to also consider information provided by the often neglected backscatter data. This can be expanded to other human activities at the seafloor, e.g., construction, anchoring of other structures or bottom-trawling.
5.1 Permission to reuse and copyright
Figures, tables, and images will be published under a Creative Commons CC-BY licence and permission must be obtained for use of copyrighted material from other sources (including re-published/adapted/modified/partial figures and images from the internet). It is the responsibility of the authors to acquire the licenses, to follow any citation instructions requested by third-party rights holders, and cover any supplementary charges.
Data availability statement
The raw data supporting the conclusions of this article will be made available by the authors, without undue reservation.
Author contributions
IS: Conceptualization, Data curation, Formal Analysis, Investigation, Visualization, Writing – original draft, Writing – review and editing. MS: Conceptualization, Investigation, Writing – review and editing. PF: Data curation, Investigation, Writing – review and editing, Conceptualization, Resources, Formal Analysis. SP: Funding acquisition, Project administration, Writing – review and editing, Conceptualization, Investigation.
Funding
The author(s) declare that financial support was received for the research and/or publication of this article. This research resulted from the project CREATE (funded by the German Federal Ministry of Education and Research with grant no. 03F0910A), which is part of the research mission “Protection and Sustainable use of Marine Areas (SUSTAINMARE)” within the German Marine Research Alliance (DAM).
Acknowledgments
We would like to specially thank our technician Martin Karallus for his valuable support during the field campaigns. We are also grateful to the IOW workshop team for maintaining our small catamaran Klaashahn, and for always being ready to help when needed. The study contains AIS data from the Danish Maritime Authority that is used in accordance with the conditions for the use of Danish public data.
Conflict of interest
The authors declare that the research was conducted in the absence of any commercial or financial relationships that could be construed as a potential conflict of interest.
Generative AI statement
The author(s) declare that no Generative AI was used in the creation of this manuscript.
Publisher’s note
All claims expressed in this article are solely those of the authors and do not necessarily represent those of their affiliated organizations, or those of the publisher, the editors and the reviewers. Any product that may be evaluated in this article, or claim that may be made by its manufacturer, is not guaranteed or endorsed by the publisher.
References
Argüello, G., Krabbe, N., Langlet, D., Hassellöv, I.-M., Martinson, C., and Helmstad, A. (2022). Regulation of ships at anchor: safety and environmental implications. Mar. Policy 140, 105052. doi:10.1016/j.marpol.2022.105052
Bentley, S., Nittrouer, C., and Sommerfield, C. (1996). Development of sedimentary strata in eckernförde bay, southwestern baltic sea. Geo-Marine Lett. 16, 148–154. doi:10.1007/bf01204502
Bolam, S., Coggan, R., Eggleton, J., Diesing, M., and Stephens, D. (2014). Sensitivity of macrobenthic secondary production to trawling in the English sector of the Greater North Sea: a biological trait approach. J. Sea Res. 85, 162–177. doi:10.1016/j.seares.2013.05.003
Bradshaw, C., Tjensvoll, I., Sköld, M., Allan, I., Molvaer, J., Magnusson, J., et al. (2012). Bottom trawling resuspends sediment and releases bioavailable contaminants in a polluted fjord. Environ. Pollut. 170, 232–241. doi:10.1016/j.envpol.2012.06.019
Broad, A., Rees, M., Knott, N., Swadling, D., Hammond, M., Ingleton, T., et al. (2023). Anchor scour from shipping and the defamation of rocky reefs: a quantitative assessment. Sci. Total Environ. 863, 160717. doi:10.1016/j.scitotenv.2022.160717
Broad, A., Rees, M. J., and Davis, A. R. (2020). Anchor and chain scour as disturbance agents in benthic environments: trends in the literature and charting a course to more sustainable boating and shipping. Mar. Pollut. Bull. 161, 111683. doi:10.1016/j.marpolbul.2020.111683
Brodersen, K. E., Hammer, K. J., Schrameyer, V., Floytrup, A., Rasheed, M. A., Ralph, P. J., et al. (2017). Sediment resuspension and deposition on seagrass leaves impedes internal plant aeration and promotes phytotoxic H2S intrusion. Front. Plant Sci. 8, 657. doi:10.3389/fpls.2017.00657
Brown, C. J., Beaudoin, J., Brissette, M., and Gazzola, V. (2019). Multispectral multibeam echo sounder backscatter as a tool for improved seafloor characterization. Geosciences 9, 126. doi:10.3390/geosciences9030126
Collier, J., and Brown, C. J. (2005). Correlation of sidescan backscatter with grain size distribution of surficial seabed sediments. Mar. Geol. 214, 431–449. doi:10.1016/j.margeo.2004.11.011
Collins, K., Suonpää, A., and Mallinson, J. (2010). The impacts of anchoring and mooring in seagrass, Studland Bay, Dorset, UK. Underw. Technol. 29, 117–123. doi:10.3723/ut.29.117
Davis, A. R., Broad, A., Gullett, W., Reveley, J., Steele, C., and Schofield, C. (2016). Anchors away? The impacts of anchor scour by ocean-going vessels and potential response options. Mar. Policy 73, 1–7. doi:10.1016/j.marpol.2016.07.021
Deter, J., Lozupone, X., Inacio, A., Boissery, P., and Holon, F. (2017). Boat anchoring pressure on coastal seabed: quantification and bias estimation using ais data. Mar. Pollut. Bull. 123, 175–181. doi:10.1016/j.marpolbul.2017.08.065
Díaz-Mendoza, G. A., Krämer, K., von Rönn, G. A., Schwarzer, K., Heinrich, C., Reimers, H.-C., et al. (2023). Circular structures on the seabed: differentiating between natural and anthropogenic origins—examples from the southwestern baltic sea. Front. Earth Sci. 11, 1170787. doi:10.3389/feart.2023.1170787
Epstein, G., Middelburg, J. J., Hawkins, J. P., Norris, C. R., and Roberts, C. M. (2022). The impact of mobile demersal fishing on carbon storage in seabed sediments. Glob. Change Biol. 28, 2875–2894. doi:10.1111/gcb.16105
European Parliament, Council of the European Union (2008). Directive 2008/56/EC of the European Parliament and of the Council of 17 June 2008 establishing a framework for community action in the field of marine environmental policy (Marine Strategy Framework Directive). Official Journal of the European Union L164. Available online at: http://data.europa.eu/eli/dir/2008/56/oj
Feldens, P., Schulze, I., Papenmeier, S., Schönke, M., and Schneider von Deimling, J. (2018). Improved interpretation of marine sedimentary environments using multi-frequency multibeam backscatter data. Geosciences 8, 214. doi:10.3390/geosciences8060214
Flynn, R. L., and Forrester, G. E. (2019). Boat anchoring contributes substantially to coral reef degradation in the British Virgin Islands. PeerJ 7, e7010. doi:10.7717/peerj.7010
Friedrichs, C., and Wright, L. (1995). Resonant internal waves and their role in transport and accumulation of fine sediment in Eckernförde Bay, Baltic Sea. Cont. Shelf Res. 15, 1697–1721. doi:10.1016/0278-4343(95)00035-Y
Gaida, T. C., Mohammadloo, T. H., Snellen, M., and Simons, D. G. (2019). Mapping the seabed and shallow subsurface with multi-frequency multibeam echosounders. Remote Sens. 12, 52. doi:10.3390/rs12010052
Hagberg, A., Swart, P. J., and Schult, D. A. (2008). Exploring network structure, dynamics, and function using networkx, 11, 15. doi:10.25080/tcwv9851
HELCOM (2023). State of the Baltic Sea. Third HELCOM holistic assessment 2016-2021. Baltic sea environment proceedings n°194. Tech. Rep. Available online at: https://helcom.fi/post_type_publ/holas3_sobs (Accessed April 8, 2025).
Hoffmann, J., Schneider von Deimling, J., Schröder, J., Schmidt, M., Held, P., Crutchley, G. J., et al. (2020). Complex eyed pockmarks and submarine groundwater discharge revealed by acoustic data and sediment cores in eckernförde bay, SW Baltic Sea. Geochem. Geophys. Geosystems 21, e2019GC008825. doi:10.1029/2019gc008825
Huff, L. C. (2008). “Acoustic remote sensing as a tool for habitat mapping in Alaska waters,” in Marine habitat mapping technology for Alaska. Editors J. R. Reynolds, and H. G. Greene, 29–46.
Jakobsson, M., O’Regan, M., Sköld, M., Jonsson, P., and Bradshaw, C. (2024). The influence of seabed geology on the nature and preservation of bottom trawl marks in the Bornholm Basin, southern Baltic Sea. Cont. Shelf Res. 279, 105297. doi:10.1016/j.csr.2024.105297
Jasiewicz, J., and Stepinski, T. F. (2013). Geomorphons — a pattern recognition approach to classification and mapping of landforms. Geomorphology 182, 147–156. doi:10.1016/j.geomorph.2012.11.005
Kalapurakkal, H. T., Dale, A. W., Schmidt, M., Taubner, H., Scholz, F., Spiegel, T., et al. (2025). Sediment resuspension in muddy sediments enhances pyrite oxidation and carbon dioxide emissions in kiel bight. Commun. Earth and Environ. 6, 156. doi:10.1038/s43247-025-02132-4
Kelly, J. J., Orr, D., and Takekawa, J. Y. (2019). Quantification of damage to eelgrass (zostera marina) beds and evidence-based management strategies for boats anchoring in san francisco bay. Environ. Manag. 64, 20–26. doi:10.1007/s00267-019-01169-4
Krause, J. C., Diesing, M., and Arlt, G. (2010). The physical and biological impact of sand extraction: a case study of the western Baltic Sea. J. Coast. Res. 215–226.
Lurton, X., Lamarche, G., Brown, C., Lucieer, V., Rice, G., Schimel, A., et al. (2015). “Backscatter measurements by seafloor-mapping sonars,” in Guidelines and recommendations. Report, geohab. https://webstatic.niwa.co.nz/static/backscatter_measurement_guidelines.pdf (Accessed April 8, 2025)
Nittrouer, C. A., Lopez, G. R., Donelson Wright, L., Bentley, S. J., D’Andrea, A. F., Friedrichs, C. T., et al. (1998). Oceanographic processes and the preservation of sedimentary structure in eckernförde bay, Baltic Sea. Cont. Shelf Res. 18, 1689–1714. doi:10.1016/S0278-4343(98)00054-5
Orsi, T. H., Werner, F., Milkert, D., Anderson, A. L., and Bryant, W. R. (1996). Environmental overview of eckernförde bay, northern Germany. Geo-Marine Lett. 16, 140–147. doi:10.1007/BF01204501
Reckermann, M., Omstedt, A., Soomere, T., Aigars, J., Akhtar, N., Bełdowska, M., et al. (2022). Human impacts and their interactions in the Baltic Sea region. Earth Syst. Dyn. 13, 1–80. doi:10.5194/esd-13-1-2022
Rios-Yunes, D., Grandjean, T., Di Primio, A., Tiano, J., Bouma, T. J., Van Oevelen, D., et al. (2023). Sediment resuspension enhances nutrient exchange in intertidal mudflats. Front. Mar. Sci. 10, 1155386. doi:10.3389/fmars.2023.1155386
Schönke, M., Clemens, D., and Feldens, P. (2022). Quantifying the physical impact of bottom trawling based on high-resolution bathymetric data. Remote Sens. 14, 2782. doi:10.3390/rs14122782
Sciberras, M., Parker, R., Powell, C., Robertson, C., Kröger, S., Bolam, S., et al. (2016). Impacts of bottom fishing on the sediment infaunal community and biogeochemistry of cohesive and non-cohesive sediments: trawling impacts on ecosystem processes. Limnol. Oceanogr. 61, 2076–2089. doi:10.1002/lno.10354
Tamsett, D., McIlvenny, J., and Watts, A. (2016). Colour sonar: multi-frequency sidescan sonar images of the seabed in the inner sound of the pentland firth, scotland. J. Mar. Sci. Eng. 4, 26. doi:10.3390/jmse4010026
Tiano, J., De Borger, E., Paradis, S., Bradshaw, C., Morys, C., Pusceddu, A., et al. (2024). Global meta-analysis of demersal fishing impacts on organic carbon and associated biogeochemistry. Fish Fish. 25, 936–950. doi:10.1111/faf.12855
Trimmer, M., Petersen, J., Sivyer, D., Mills, C., Young, E., and Parker, E. (2005). Impact of long-term benthic trawl disturbance on sediment sorting and biogeochemistry in the southern North Sea. Mar. Ecol. Prog. Ser. 298, 79–94. doi:10.3354/meps298079
van der Reijden, K., Ernstsen, V., Olsen, J., Dinesen, G., Leth, J., and Eigaard, O. (2023). Improving seabed substrate mapping with high-resolution bottom trawl data. Mar. Environ. Res. 186, 105935. doi:10.1016/j.marenvres.2023.105935
Watson, S. J., Ribó, M., Seabrook, S., Strachan, L. J., Hale, R., and Lamarche, G. (2022). The footprint of ship anchoring on the seafloor. Sci. Rep. 12, 7500–7511. doi:10.1038/s41598-022-11627-5
Wentworth, C. K. (1922). A scale of grade and class terms for clastic sediments. J. Geol. 30, 377–392. doi:10.1086/622910
Whiticar, M. J. (2002). Diagenetic relationships of methanogenesis, nutrients, acoustic turbidity, pockmarks and freshwater seepages in Eckernförde Bay. Mar. Geol. 182, 29–53. doi:10.1016/S0025-3227(01)00227-4
Wichert, U. (2011). Problems in locating historic, unexploded ordnance in the Baltic Sea. Mar. Technol. Soc. J. 45, 19–25. doi:10.4031/MTSJ.45.6.4
Wilken, D., Hadler, H., Majchczack, B. S., Blankenfeldt, R., Auge, O., Bäumler, S., et al. (2024). The discovery of the church of Rungholt, a landmark for the drowned medieval landscapes of the Wadden Sea World Heritage. Sci. Rep. 14, 15576. doi:10.1038/s41598-024-66245-0
Zhang, W., Porz, L., Yilmaz, R., Wallmann, K., Spiegel, T., Neumann, A., et al. (2024). Long-term carbon storage in shelf sea sediments reduced by intensive bottom trawling. Nat. Geosci. 17, 1268–1276. doi:10.1038/s41561-024-01581-4
Keywords: Baltic Sea, multibeam echosounder, multifrequency backscatter, seafloor integrity, anthropogenic pressure, habitat, hydroacoustics
Citation: Schulze I, Schönke M, Feldens P and Papenmeier S (2025) Temporal evolution of anchor tracks on a silty seafloor (Eckernförde Bay/Baltic Sea). Front. Remote Sens. 6:1576192. doi: 10.3389/frsen.2025.1576192
Received: 13 February 2025; Accepted: 01 April 2025;
Published: 15 April 2025.
Edited by:
Craig John Brown, Dalhousie University, CanadaReviewed by:
Sally Joan Watson, National Institute of Water and Atmospheric Research (NIWA), New ZealandJames Asa Strong, University of Southampton, United Kingdom
Copyright © 2025 Schulze, Schönke, Feldens and Papenmeier. This is an open-access article distributed under the terms of the Creative Commons Attribution License (CC BY). The use, distribution or reproduction in other forums is permitted, provided the original author(s) and the copyright owner(s) are credited and that the original publication in this journal is cited, in accordance with accepted academic practice. No use, distribution or reproduction is permitted which does not comply with these terms.
*Correspondence: Inken Schulze, aW5rZW4uc2NodWx6ZUBpby13YXJuZW11ZW5kZS5kZQ==