 Weidong Zhu
 Yuelin Xu
 Lei Zhang
 Zitao Liu
 Shuai Liu2
- 1College of Oceanography and Ecological Science, Shanghai Ocean University, Shanghai, China
- 2Shanghai Engineering Research Center of Estuarine and Oceanographic Mapping, Shanghai Ocean University, Shanghai, China
- 3College of Surveying and Geo-Informatics, Tongji University, Shanghai, China
Introduction: Monitoring Ulva prolifera blooms over the long term is crucial for maintaining marine ecological balance. MODIS images, with their wide spatial coverage, high temporal resolution, and rich historical data, are commonly used for this purpose. However, their relatively low spatial resolution may lead to inaccuracies in precisely defining the bloom extents, thereby impeding the formulation of effective management strategies.
Methods: To address this issue, our study developed the WaveNet model. This model integrates VGG16 with the Bidirectional Feature Pyramid Network (BiFPN) and is further enhanced with a Convolutional Block Attention Module (CBAM). We applied this framework to MODIS imagery for the detection and monitoring of U. prolifera.
Results: WaveNet demonstrated superior performance in long-term sea surface U. prolifera monitoring compared to traditional methods, achieving an accuracy of 97.14% and an F1 score of 93.26%. This represents a significant improvement over existing techniques.
Discussion: These results highlight WaveNet’s improved capacity for accurate spatial recognition and classification, overcoming the limitations of previous methods. Applying this approach, we analyzed the spatiotemporal distribution of U. prolifera blooms in the Yellow Sea of China from 2018 to 2024. Our framework offers valuable insights for early prevention and targeted management of green tides, contributing to the development of more effective mitigation strategies.
1 Introduction
Green tide blooms, particularly those caused by U. prolifera (Ulva prolifera) in the Yellow Sea, have become a major environmental issue, causing significant ecological and socio-economic impacts (Ye et al., 2011; Liu et al., 2013). These blooms are fueled by U. prolifera’s remarkable tolerance to high temperatures and intense light (Cui et al., 2015), which enables rapid and persistent growth. The decomposition of these algae releases harmful gases like hydrogen sulfide and ammonia, threatening marine ecosystems, human health, and coastal economies (Ye et al., 2011; Smetacek and Zingone, 2013). This study aims to address this gap by developing a dynamic monitoring framework, which can serve as a foundation for constructing real-time monitoring systems for green tide blooms. Remote sensing, particularly satellite image analysis, offers a promising solution, but challenges remain in achieving a balance between spatial resolution, temporal coverage, and processing efficiency. This study aims to address this gap by developing a dynamic monitoring framework for real-time detection of green tide blooms. By leveraging advanced image-processing techniques, the study seeks to improve the accuracy, scalability, and efficiency of U. prolifera monitoring, providing valuable insights for timely intervention and sustainable management of green tides. This approach not only enhances monitoring but also contributes to the development of effective strategies for mitigating the environmental and socio-economic consequences of green tide blooms.
Satellite remote sensing, in contrast to field surveys, provides several advantages including wide coverage, rapid data acquisition, short update cycles, strong timeliness, and cost-effectiveness, rendering it an effective tool for monitoring and management of U. prolifera events (Hu et al., 2010; Hu et al., 2017). 10 m resolution Sentinel-2 imagery is suitable for monitoring smaller features like U. prolifera (Brisset et al., 2021), but its narrow swath width and coarse temporal resolution make it unsuitable for large areas like the Yellow Sea. Imagery from the Moderate Resolution Imaging Spectroradiometer (MODIS) has significantly advanced the assessment and prediction of algal bloom mechanisms (Lee et al., 2011; Cao et al., 2019; Hu et al., 2019; Xing et al., 2019). From May to June each year, U. prolifera blooms rapidly spread across the Yellow Sea. MODIS imagery, with its near-daily updates and 2,330 km2 coverage, effectively monitors the entire lifecycle of these blooms. However, the coarse resolution of MODIS images, with a maximum spatial resolution of only 250 m, introduces a degree of error in the extracted estimates of algal biomass (Hu et al., 2010; Hu et al., 2015). Minimizing this extraction error has emerged as a bottleneck in optical remote sensing for algae detection.
Various remote sensing threshold methods are used to extract U. prolifera information, utilizing the unique spectral characteristics of green algae in visible and infrared bands. Common approaches include the Normalized Difference Vegetation Index (NDVI) and the Normalized Difference Algae Index (NDAI) (Shi and Wang, 2009), applicable across multiple satellite sensors. Other methods, such as the Floating Algae Index (FAI) (Hu, 2009), Virtual-baseline Floating Macro Algae Height index (VB-FAH) (Xing and Hu, 2016), and RGB Floating Algae Index (Jiang et al., 2020), are robust to environmental variations, including thin cloud cover (Xu et al., 2016). However, these optical-based methods are hindered by challenges such as cloud interference, variable backgrounds, and the need for meticulous threshold selection, which often requires expert knowledge (Shi and Wang, 2009; Hu et al., 2010).
While deep learning methods show promise in overcoming these limitations (Schmidhuber, 2015; Li et al., 2020), existing studies, such as those utilizing ERISNet for Sargassum algae extraction in the coastal waters of Mexico and approaches employing AlexNet for large algae extraction from UAV images, have made progress in specific environments but still face challenges in achieving large-scale and accurate monitoring of green tides (Arellano-Verdejo et al., 2019; Wang et al., 2019). Recent advancements, like models designed to detect green tide information from both SAR and optical images, highlight the potential of deep learning in this domain, paving the way for more accurate, scalable, and efficient monitoring (Gao et al., 2022). This study aims to advance the application of deep learning for dynamic monitoring of U. prolifera, addressing the gap in real-time, large-scale, and precise green tide detection. It also focuses on improving the accuracy of U. prolifera extraction from low-resolution satellite imagery and enabling dynamic daily monitoring of green tides on a large scale.
The objectives of this paper includ 1) developing of a deep learning network to more effectively extract information about green tide from coarse-resolution optical imagery; 2) implementing of large-scale dynamic monitoring of green tide; and 3) extracting and analysing of the spatiotemporal distribution changes of green tide outbreaks in the Yellow Sea region from 2018 to 2024 on both interannual and intermonthly scales. The organization of the paper is as follows. Section 2 presents the study area and related datasets, including optical MODIS data, Sentinel-2 data, and the training dataset for the deep learning model. Section 3 introduces the proposed deep learning network model, encompassing physical model optimization and model performance verification methods. Section IV details the training of the model and the research findings. Discussions and conclusions are presented in Sections 4 and 5.
2 Study area and datasets
2.1 Study area
The study area, situated within the Yellow Sea between 32°N and 37°N and 119°E−124°E, is shown in Figure 1. Influenced by the East Asian monsoon, the climatic regime of the region under study is characterized by cold, arid winters and warm, humid summers (Xing and Hu, 2016; Qi et al., 2017; Zhang et al., 2019). The confluence of these climatic conditions with substantial terrestrial influences results in the Yellow Sea exhibiting moderate to high levels of turbidity, which are characteristic of the region (Shi and Wang, 2009; Zhang et al., 2010; Xing et al., 2019). These environmental parameters significantly influence the proliferation of U. prolifera, as its growth dynamics are intricately tied to water temperature and nutrient availability. Since the onset of the 21st century, U. prolifera has exhibited periodic summer blooms in the region, with each event demonstrating extensive areal coverage, substantial biomass accumulation, and significant long-distance transportation (Wang et al., 2015). These phenomena have had profound negative repercussions on the coastal tourism industry, aquaculture activities, and the integrity of the ecological environment, underscoring the urgency and relevance of our research in real-time, large-scale, and precise green tide detection.
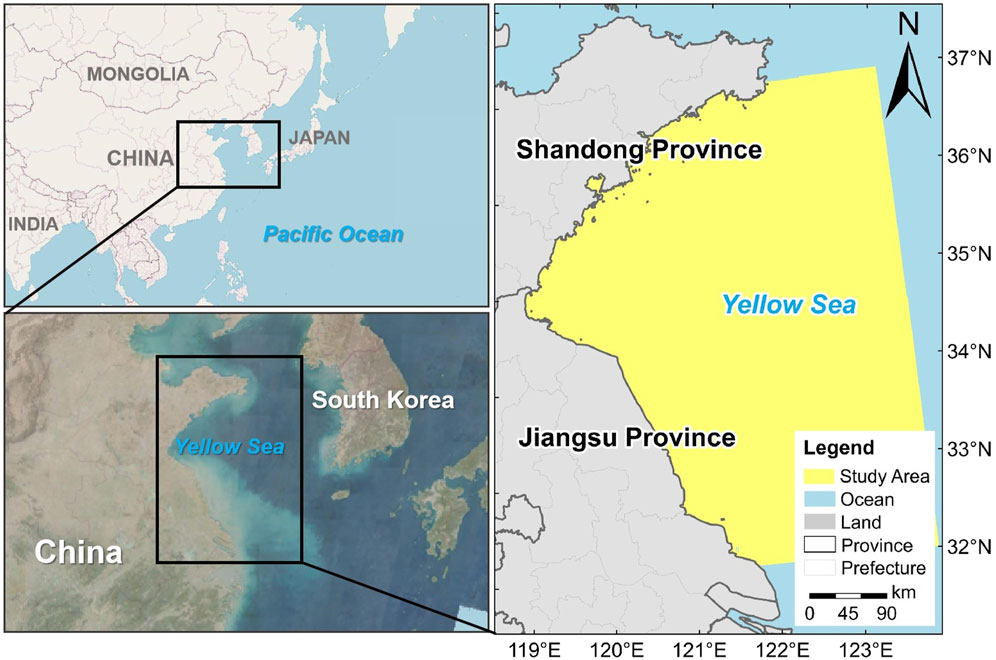
Figure 1. Location of the study area.
Given the influence of the East Asian monsoon, the climate in this region is marked by cold, dry winters and hot, humid summers (Xing and Hu, 2016; Qi et al., 2017; Zhang et al., 2019). These climatic conditions, coupled with the significant terrestrial impact, contribute to the Yellow Sea’s moderate to high turbidity levels, which are typical of the area (Shi and Wang, 2009; Zhang et al., 2010; Xing et al., 2019). Due to these geographical and climatic reasons, the proliferation of U. prolifera, a green tide-forming macroalga, is influenced, as its growth is closely linked to water temperature and nutrient availability. Understanding these environmental factors is crucial for this study, as they provide insights into the conditions that may favor or inhibit the development of U. prolifera blooms, which are the focus of our research. Since 2007, U. prolifera has periodically erupted in this region every summer. Its characteristics, such as broad coverage, large biomass, and extensive distance transport (Wang et al., 2015), have severely impacted coastal tourism, aquaculture, and the ecological environment.
2.2 Datasets
The MODIS satellite, initiated by NASA in 1999, is a prominent space remote sensing instrument, providing surface spectral reflectance estimates for 36 bands every 1–2 days. Research indicates that the peak U. prolifera period in the South Yellow Sea spans from May to August annually (Zhou et al., 2021). To extend monitoring to March, EOS MODIS 1B (Terra/Aqua) remote sensing dataset from March to August 2018–2024 were chosen from NASA’s data repository (https://ladsweb.modaps.eosdis.nasa.gov/search). This selection included MOD02QKM and MOD02HKM products with resolutions of 250 m and 500 m, respectively. Among126 images, those with minimal cloud cover during U. prolifera blooms from 2018 to 2024 were selected. Data were processed using SNAP software for reprojection, calibration, and band synthesis, with MOD02HKM resampled to 250 m. Subsequently, sea-land separation was conducted to extract relevant sea areas.
Sentinel-2, part of the European “Copernicus” program, consists of two satellites, Sentinel-2A (launched 23 June 2015) and Sentinel-2B (launched 27 March 2017). These satellites operate on a sun-synchronous orbit with individual revisit periods of 10 days and a collective revisit period of 5 days. Sentinel-2 Level-2A (L2A) dataset, comprising atmospherically corrected bottom-of-atmosphere reflectance dataset, were acquired from the European Space Agency’s Copernicus Open Access Hub (https://scihub.copernicus.eu/dhus/#/home). Cloud-free images with 10-m resolution overlapping with the MODIS data dates in the study area were selected. Red (R), Green (G), and Blue (B) bands were utilized to generate true-color composite images for subsequent U. prolifera extraction validation.
In this research, MODIS images were selected to create a dataset. Initially, bands 1 (red), 2 (near-infrared), and 4 (green) were chosen, corresponding to R, G, and B channels, respectively, to generate false-color composite images. Subsequently, these images were segmented into 512*512-pixel tiles using a sliding window approach. Within the MODIS images, U. prolifera exhibits more prominent green patches compared to seawater. Therefore, Lableme software was employed to label the segmented images with U. prolifera samples. Out of 608 sets of MODIS images and corresponding labels, 425 sets were allocated for training, and 183 sets were reserved for testing. During training, the dataset was divided into 70% for training and 30% for validation.
3 Methods
3.1 The structure of the WaveNet model
Figure 2 illustrates the architecture of the proposed model, which integrates VGG16, BiFPN, and CBAM in a collaborative hierarchy.
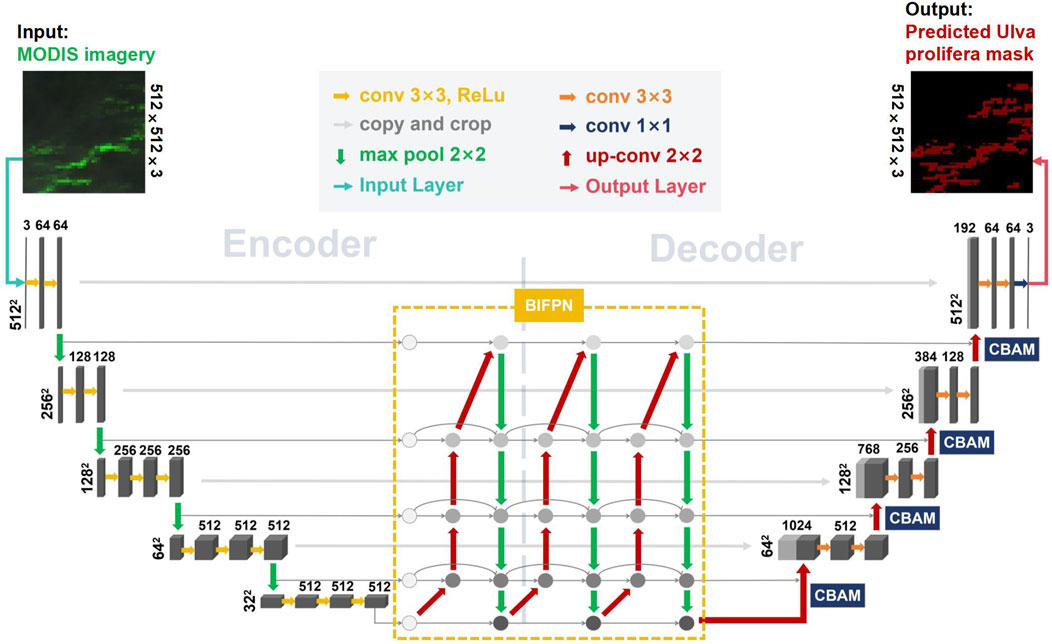
Figure 2. The structure of the WaveNet.
Firstly, the Visual Geometry Group 16-layer model (VGG16) is adopted as the backbone feature extraction network. It transforms the input MODIS image into multi-level feature maps through four convolutional and downsampling stages, effectively capturing both low-level textures and mid-level semantic patterns. Secondly, three layers of Bidirectional Feature Pyramid Network (BiFPN) are incorporated to enhance multi-scale feature fusion. BiFPN enables bidirectional information flow, allowing high-level semantic information from deep layers to guide low-level spatial details, and vice versa. This preserves fine-grained localization critical for identifying U. prolifera boundaries. Thirdly, four upsampling stages are applied to restore the spatial resolution of feature maps to match the original image dimensions. At each stage, a Convolutional Block Attention Module (CBAM) is introduced to emphasize the most relevant spatial regions and spectral channels. CBAM refines features by applying sequential channel and spatial attention, thereby improving feature saliency and reducing background noise.
This hierarchical design enables VGG16 to focus on core visual patterns, BiFPN to integrate information across scales, and CBAM to selectively enhance discriminative features. Together, they collaboratively improve the model’s accuracy in detecting green tide areas under complex oceanographic conditions.
3.2 Visual Geometry Group 16-layer model, VGG16
In our study, VGG16 was chosen as the backbone network due to its proven effectiveness in image feature extraction, particularly in tasks requiring high accuracy and localization precision, such as the ILSVRC-2014 ImageNet challenge. Its architectural design, which includes five sets of convolutional layers followed by max-pooling layers and three fully connected layers, allows for efficient feature representation and nonlinearity enhancement while preserving the perceptual field. The use of 3 × 3 convolutional kernels and 2 × 2 max-pooling layers increases the network depth, enabling the detection of intricate patterns critical for identifying U. prolifera in complex marine environments. VGG16 offers a deeper structure with more precise feature extraction, which is crucial for achieving the high accuracy (97.14%) and F1 score (93.26%) demonstrated in our green tide monitoring framework. This integration provides a robust foundation for the dynamic monitoring of U. prolifera, outperforming previous methods in large-scale green tide detection and classification.
3.3 Bidirectional feature pyramid network, BiFPN
The traditional VGG16 architecture fails to effectively utilize multiscale information from the backbone network, as it directly connects to fully connected layers after the fifth convolutional layer. To remedy this, we incorporate the BiFPN module, which processes shallow features and integrates multiscale information. BiFPN, introduced by Google in 2020 within the EfficientDet model (Tan et al., 2020), employs a weighted bidirectional feature pyramid network. This network consists of top-down and bottom-up pathways, enabling the propagation of both semantic and positional information, as shown in Figure 3.
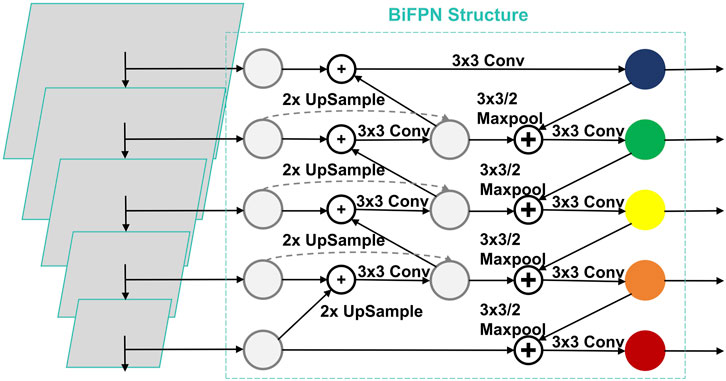
Figure 3. The structure of BiFPN.
To address the challenge of accurately classifying U. prolifera at the pixel level, we introduced a novel modification to the VGG16 architecture. Specifically, instead of relying on the traditional fully connected and softmax output layers, we replaced them with the fusion results generated by the BiFPN structure. This approach utilizes attribute maps extracted from multiple stages of the backbone network, capturing spatial and contextual information at different resolutions. By adaptively integrating these multi-scale features, the BiFPN structure enhances the model’s ability to preserve fine-grained details and resolve ambiguities in areas with similar spectral characteristics. This modification significantly improves the network’s feature representation capabilities, ensuring better accuracy in distinguishing U. prolifera from surrounding elements.
Mathematically, the fusion process in BiFPN can be expressed through Equations 1 and 2 as follows:
where
3.4 Convolutional Block Attention Module, CBAM
Attention mechanisms allow the network to focus on the most relevant features of the target and have been extensively capabilities of convolutional neural networks (Lian et al., 2018), and improve feature extraction efficiency and accuracy (Ma et al., 2023). In our work, attention mechanisms are central to enhancing feature deployed in deep learning applications, like natural language processing and visual recognition, to enhance the learning extraction and representation, addressing the challenge of accurately identifying U. prolifera in MODIS imagery. We employ the Convolutional Block Attention Module (CBAM), which integrates both channel and spatial attention mechanisms to refine feature representations dynamically, and its structure is illustrated in Figure 4. The channel attention component aggregates information across feature map channels, highlighting the most relevant spectral features for distinguishing U. prolifera. Simultaneously, the spatial attention mechanism focuses on critical spatial regions within each channel, enabling the model to capture localized patterns associated with green tides.
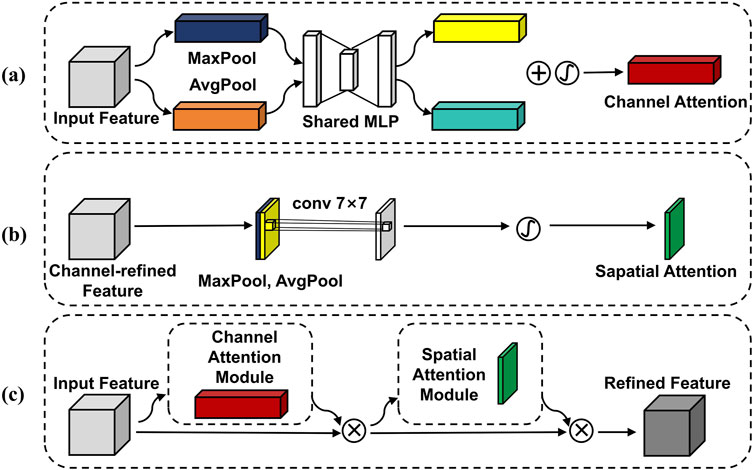
Figure 4. Structure of CBAM: (a) Channel attention module; (b) Spatial attention module; (c) CBAM.
To further enrich the model’s feature extraction capacity, we integrate CBAM within the last four upsampling layers of the network. By processing input feature maps and applying attention mechanisms, CBAM outputs weighted feature maps, emphasizing both channel and spatial information. This dual-focus strategy ensures the preservation of spectral and spatial nuances, significantly improving classification precision. Such an approach is particularly effective given the moderate spatial resolution and complex spectral characteristics of MODIS imagery, providing a robust framework for green tide detection.
3.5 Accuracy assessment
The U. prolifera extraction method underwent evaluation using standard metrics: accuracy, precision, recall, F1 score, mIoU, and mPA, with their calculation formulas detailed in Equation 3. Results were classified into four groups: True Positive (TP) for accurately identified U. prolifera pixels, True Negative (TN) for accurately classified background pixels, False Positive (FP) for background pixels erroneously identified as U. prolifera, and False Negative (FN) for U. prolifera pixels mistakenly classified as background. Manual determination of the true value was based on MODIS false-color images.
where denotes predicting i as j, which is a false negative (FN); denotes predicting j as i, which is a false positive (FP); denotes predicting i as i, which is a true positive (TP).
3.6 Estimation of Ulva prolifera area
Area of U. prolifera depicts the ground area size, which can be computed by the product of spatial resolution and the corresponding number of pixels (Cui et al., 2018), as outlined in Formula 4.
where,
4 Experiments and results
4.1 Training and experimental settings
The deep learning tasks were performed on a Windows 10 system equipped with an NVIDIA GeForce RTX 3060Ti GPU boasting 8 GB of storage. CUDA version 11.6 was utilized, alongside the PyTorch 11.0 deep learning platform for model construction. The software environment was Anaconda (Python 3.8). Throughout the training phase, the Adam optimization algorithm (Ronneberger et al., 2015) dynamically adjusted the network weights and biases. The parameters are set as follows:
4.2 Evaluation of model performance
This paper evaluates the detection performance of U. prolifera using the WaveNet deep learning model in comparison with the Normalized Difference Vegetation Index (NDVI) and the Adjusted Floating Algae Index (AFAI) methods, both widely applied in algae detection tasks.
The NDVI method, proposed by Rouse et al., leverages the characteristic spectral reflectance of vegetation in the near-infrared and red bands. Its adaptability to large floating algae, due to their spectral similarities with vegetation, makes it a commonly used approach for algae extraction. The calculation formula for NDVI is given in Equation 5.
where, and represent the reflectance of the near-infrared band (860 nm) and the red band (660 nm), respectively.
The AFAI method is designed to reduce the impact of atmospheric effects, thin clouds, and moderate solar glint. It employs a linear baseline between adjacent bands to compute near-infrared reflectance (Fang et al., 2018). It employs a linear baseline between adjacent bands to compute near-infrared reflectance. The formulas are given in Equations 6, 7:
where,
Both NDVI and AFAI have demonstrated effectiveness in detecting floating algae using satellite imagery, such as MODIS and Landsat. However, their accuracy is limited by manual threshold selection. In this study, the WaveNet model, trained on MODIS imagery, demonstrated superior performance in U. prolifera detection. Unlike NDVI and AFAI, the fixed threshold in WaveNet (0.5) relies on the model’s optimized weights, eliminating manual adjustments (Liu et al., 2009; Qi et al., 2016a; Hu et al., 2019; Zheng et al., 2022). Results show that WaveNet not only reduces threshold dependency but also achieves significantly higher precision and coverage accuracy, highlighting its potential for dynamic green tide monitoring.
Figure 5a shows the MODIS true color image of the Yellow Sea from 5 July 2023, where U. prolifera appears in light green. Our method, alongside the two index methods (NDVI and AFAI), confirmed that these colored patches are floating U. prolifera Figures 5b-f. Through our deep learning model, 1,319,611 algal pixels were identified. When using thresholds of >0 and >0.00000433, the NDVI index method identified 8,445,635 and 921,741 algal pixels, respectively. With thresholds of (0, 0.02) and (0.0025, 0.0176), the AFAI index method identified 1,892,314 and 339,040 algal pixels, respectively. Due to differences in threshold selection, both NDVI and AFAI methods exhibit considerable uncertainty; in fact, the algal identification results could vary by orders of magnitude (Hu, 2009; Liu et al., 2009; Xu et al., 2014; Qi et al., 2016b; Hu et al., 2019). In contrast, the deep learning-based model mitigates the potential bias introduced by selecting different extraction thresholds for NDVI or AFAI.
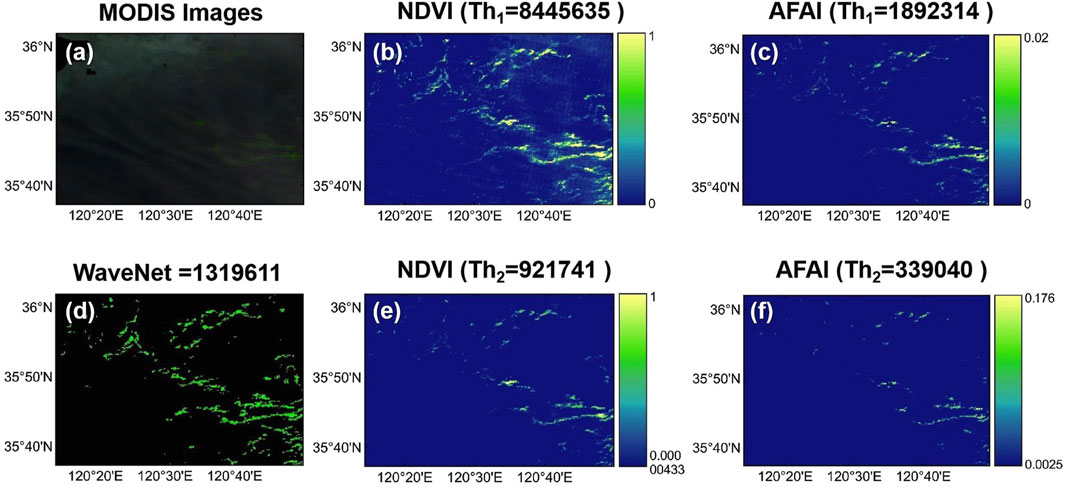
Figure 5. Comparison result of the WaveNet model and traditional biological index methods. (a) MODIS true color; (b,e) NDVI results; (c,f) AFAI results; (d) WaveNet result.
The WaveNet model achieved precision and recall metrics, as well as a comprehensive F1 score for U. prolifera extraction, all exceeding 90.0%. The accuracy reached 97.14%, which is 7.6% higher on average compared to the NDVI method and 4.3% higher on average compared to the AFAI method. In summary, our method excels at extracting U. prolifera from MODIS images, achieving the highest recognition accuracy. The outcomes are provided in Table 1.
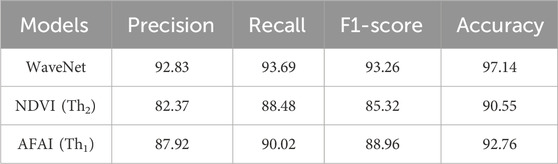
Table 1. Accuracy evaluation of the extraction effect.
Four areas were randomly selected to compare the segmentation results of the WaveNet, NDVI, and AFAI methods (Figure 6). In addition to MODIS false-color images, Sentinel-2 true-color images with a resolution of 10 m were added as references. Since MODIS images have a resolution of 250 m, the U. prolifera patches derived using these methods will appear larger than those in the Sentinel-2 images. Although the selected reference images were taken on the same day, slight differences in U. prolifera patches may occur due to different transit times.
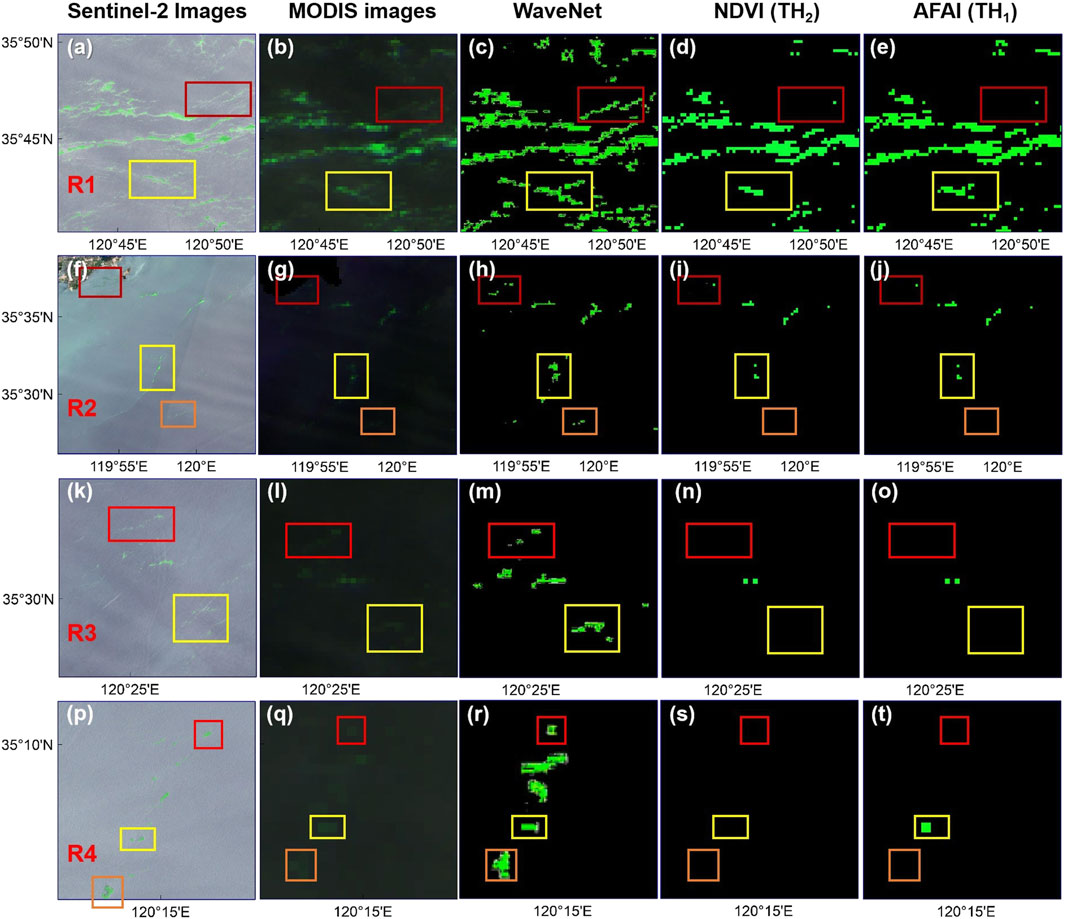
Figure 6. The comparison of U. prolifera extraction results. R1-R4 regions: (a,f,k,p) Sentinel-2; (b,g,l,q) MODIS; (c,h,m,r) WaveNet; (d,i,n,s) NDVI (TH2); (e,j,o,t) AFAI (TH1)
In Region 1 (R1), the aim was to compare the extraction performance of U. prolifera over a large area, while Regions 2 (R2), 3 (R3), and 4 (R4) focused on smaller areas. In the upper and lower parts of R1, both the NDVI and AFAI methods exhibited instances of under-segmentation, while the WaveNet method provided the most complete extraction of U. prolifera. However, in R2, both the NDVI and AFAI methods had instances of under-segmentation in the nearshore area on the upper left, and the WaveNet method showed misclassification in the central part.
In R3, both the NDVI and AFAI methods exhibited a significant amount of under-segmentation. In R4, the extraction performance of all three methods was relatively poor, with instances of under-segmentation in the NDVI and AFAI methods, and misclassification in the WaveNet model. As shown in Table 2, the pixel count and area of extracted U. prolifera using different methods were also compared, with the same conclusions as depicted in Figure 6.
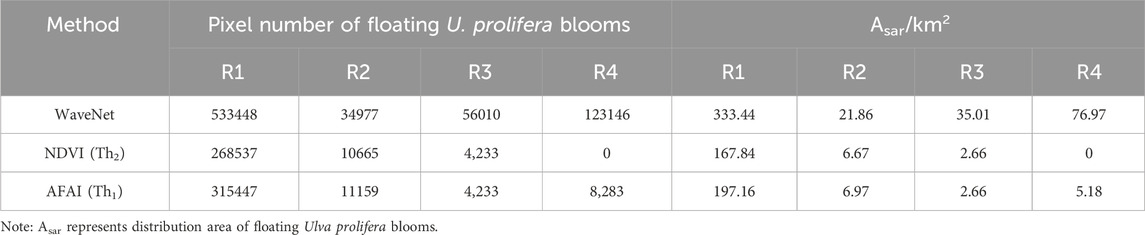
Table 2. The comparison of pixel count and area of extract.
5 Discussion
5.1 Performance evaluation of different composite models
Group 1: VGG16+(BiFPN + SA). This group integrates the Spatial Attention (SA) mechanism into the BiFPN module within the VGG16 framework. The design focuses on enhancing spatial perception, improving feature fusion efficiency, and minimizing information loss. However, as shown in the heatmap comparison (Figure 7), the performance of this configuration remains limited. The mean Intersection over Union (mIoU) reaches only 86.15%, and the F1 score achieves 92.36%, both of which are lower than those of attention-enhanced dual-dimensional models. This indicates that spatial-only attention mechanisms may be insufficient for robust green tide discrimination and comprehensive feature preservation.
Group 2: VGG16+(BiFPN + CBAM). This model group substitutes the SA mechanism with CBAM while maintaining other aspects unchanged to compare the two attention mechanisms. SA emphasizes spatial information, while CBAM integrates channel and spatial attention, enhancing the model’s perception of both types of information. This adjustment aims to enhance overall model performance. As depicted in Figure 7, the replacement leads to slight improvements in mIoU, Precision, F1 score, and Accuracy, ranging from 0.5% to 1%.
Group 3: VGG16+skip (BiFPN + CBAM). This group introduces skip connections to directly transfer low-level features into upper layers, theoretically improving representation comprehensiveness. Nevertheless, the model shows decreased accuracy compared to Group 2. Specifically, the mIoU drops to 83.69%, and the F1 score declines to 90.75%. These results may stem from redundant or noisy features introduced via the skip paths, which interfere with semantic abstraction and reduce final prediction quality.
Group 4: VGG16+[BiFPN + dual (CBAM + SA)]. This model incorporates both CBAM and SA as a dual-attention mechanism. Although it expands the model’s attention diversity, the additional complexity leads to performance degradation. As shown in Figure 7, the mIoU is only 83.50%, and the F1 score is 90.61%. This suggests that overly complex attention fusion may introduce conflicts or overfitting, limiting the effectiveness of feature integration.
Group 5: VGG16 + 3*BiFPN + CBAM. As the proposed WaveNet configuration, this group employs a triple BiFPN structure for deep multi-scale fusion and integrates CBAM during the upsampling stages. According to the comparative heatmap (Figure 7), this model achieves the highest overall performance: the mIoU reaches 87.79%, and the F1 score improves to 93.26%, with an accuracy of 97.14%. These results confirm that deeper fusion layers and attention refinement significantly enhance both feature preservation and perceptual discriminability
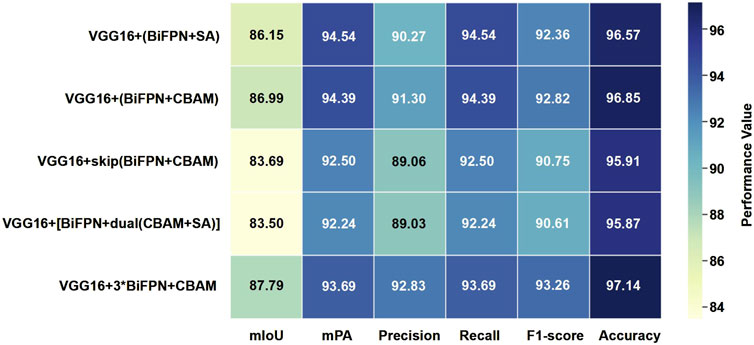
Figure 7. Heatmap of accuracy metrics for different model combinations.
5.2 Monthly spatial-temporal distribution characteristics of Ulva prolifera
Based on MODIS remote sensing satellite imagery, the spatial coverage area and impact scope of U. prolifera were extracted for different years from 2018 to 2024 (Figure 8).
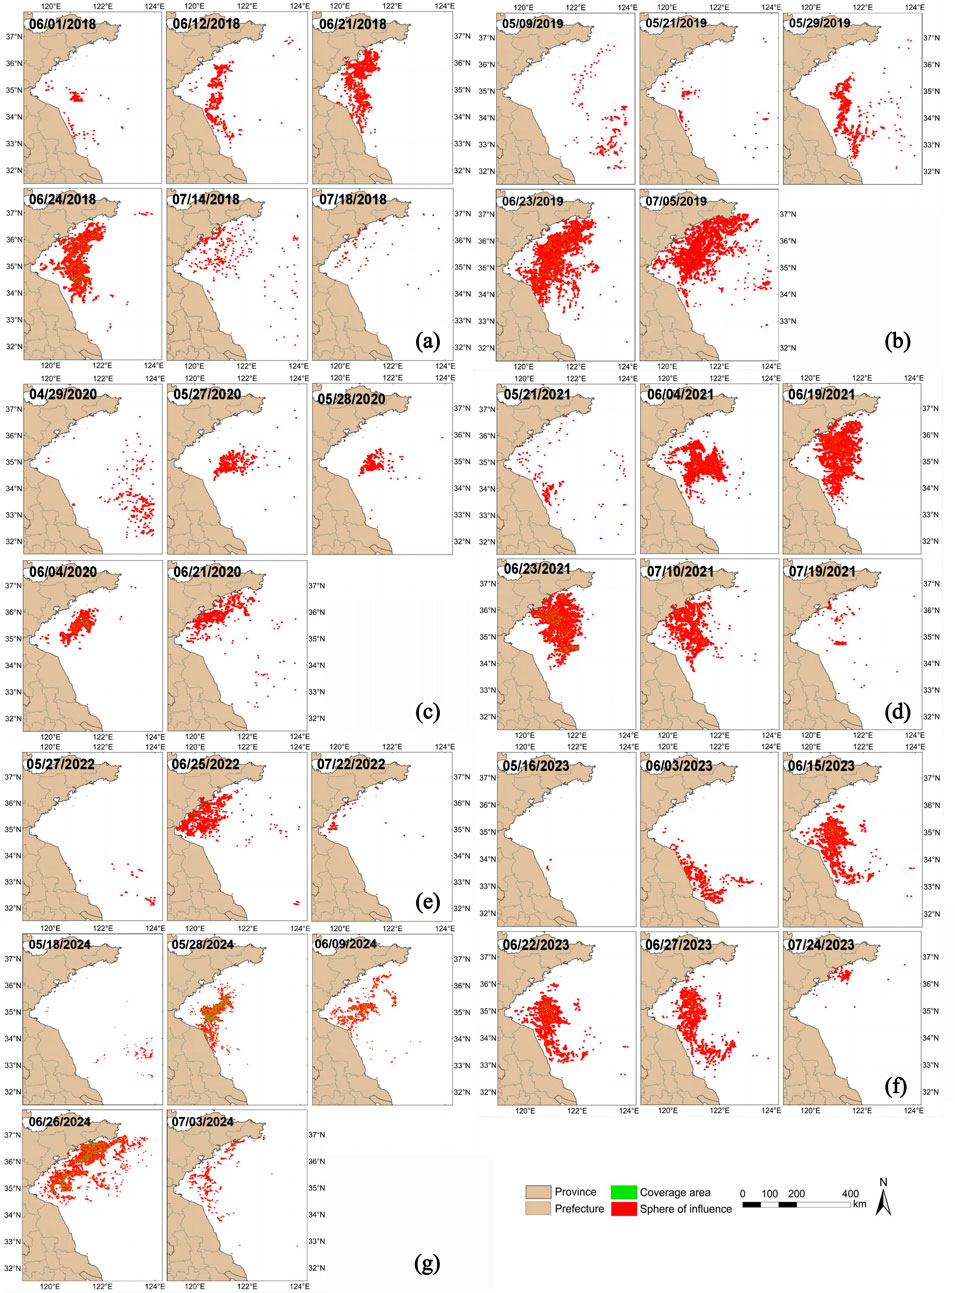
Figure 8. Figures (a–g) present the spatiotemporal distribution patterns of U. prolifera in the Yellow Sea during the period from 2018 to 2024.
In late May and early June 2018, U. prolifera was first detected in the shallow waters of northern Jiangsu Province, China. It then drifted northeastward, affecting the coastal waters of the northern Yellow Sea. Initially, its coverage area was only 80 km2, but within 11 days, it sharply increased to 164 km2. Subsequently, U. prolifera drifted northward, accumulating extensively in the coastal areas of the northern Yellow Sea by the end of June, reaching its maximum coverage area and impact range. On July 14, U. prolifera extensively landed in coastal cities in the northern Yellow Sea. Gradually, its coverage area decreased and disappeared, with only sporadic patches remaining in the region by July 18.
In 2019, U. prolifera was first spotted in the southeastern Yellow Sea on May 9, covering an area of 14 km2. Towards the end of May, it appeared in the shallow waters off the coast of northern Jiangsu Province, China, before drifting eastward and merging with the existing U. prolifera in the southeastern Yellow Sea, then moving northward. By June 23, it reached its peak coverage area of 2,127 km2. In early July, U. prolifera landed in the northern Yellow Sea, with coverage shrinking to 703 km2 before gradually fading away.
In 2020, the observation of U. prolifera was about 2 weeks later than the previous year. Initially appearing in the southeastern Yellow Sea on April 29, it covered an area of 18 km2. From late April to late May, it drifted northwestward, steadily expanding its coverage. By May 27, it reached 219 km2, growing to 302 km2 the next day. Peaking at 950 km2 on June 4, it then moved northward, landing in the northern Yellow Sea by the end of June and dissipating approximately 2 weeks earlier than in 2019. Overall, the U. prolifera bloom in 2020 was less severe than in 2019.
In 2021, U. prolifera was first spotted on April 8, initially appearing in scattered amounts in the southeastern Yellow Sea. By May 21, it had drifted northward, covering 55 km2 in the shallow waters off northern Jiangsu. Throughout June, U. prolifera proliferated extensively in the central Yellow Sea. From June 19 to July 10, a severe U. prolifera bloom affected coastal cities in the northern Yellow Sea, peaking at an extent of 3,534 km2. By mid-July, the bloom gradually dissipated, with coverage shrinking to 31 km2 by July 19. Compared to previous years, 2021 experienced the largest coverage area, longest duration, and most severe U. prolifera disaster, with the widest coverage area four times that of the previous year.
In 2022, U. prolifera was first spotted on May 27 in the southeastern Yellow Sea, a month and a half later than the previous year. By June 25, it had reached coastal cities along the northern Yellow Sea, peaking at a coverage area of 548 km2 before gradually dissipating over the following month. Compared to 2021, the U. prolifera coverage area significantly decreased in 2022, suggesting a relatively mild U. prolifera bloom overall.
On 16 May 2023, scattered U. prolifera patches were spotted in the shallow waters of northern Jiangsu, covering just 4 km2. Within 2 weeks, the area surged to 276 km2 by June 3, drifting northward thereafter. By the end of June, U. prolifera had proliferated massively in the central Yellow Sea, peaking at 2,170 km2 on June 22, four times larger than in 2021. By July 24, it had dissipated significantly, leaving only 8 km2 scattered off Qingdao and Yantai. Overall, the U. prolifera bloom in 2023 ranked second only to 2021 in severity.
On 18 May 2024, sparse patches of U. prolifera were initially detected in the shallow waters off northern Jiangsu and in the southeastern Yellow Sea, spanning an area of merely 17 km2. Within just 10 days, however, U. prolifera proliferated rapidly from the northern Jiangsu shallows to the northern Yellow Sea, with its coverage expanding by a factor of 13. By mid-June, the U. prolifera extent had decreased to approximately 128 km2. On June 26, it experienced a notable resurgence, reaching a peak area of 454 km2, before gradually dissipating by mid-July. In summary, the U. prolifera bloom in 2024 demonstrated significant improvement, with a shorter duration and the smallest maximum coverage observed in the past 7 years.
5.3 Yearly spatial-temporal distribution characteristics of Ulva prolifera
Figure 9 illustrates the temporal and spatial dynamics of green tide (U. prolifera) coverage area in the Yellow Sea from 2018 to 2024. The trends indicate that peak green tide coverage varies significantly each year. For instance, 2021 shows the highest recorded green tide coverage, with a peak area exceeding 3,500 km2, observed between June and July. In contrast, 2024 reflects a noticeable improvement, with substantially reduced peak coverage. The annual progression generally follows a similar pattern: a gradual increase in early year, peaking around late June, and decreasing in July.
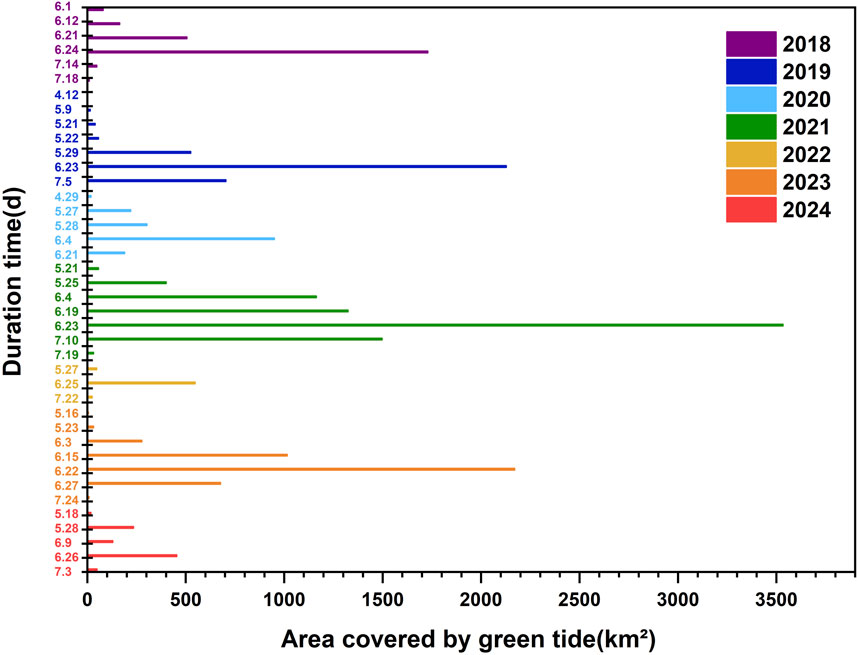
Figure 9. The changes in U. prolifera area in the Yellow Sea from 2018 to 2024.
This temporal pattern, along with area fluctuations, aligns with existing research suggesting that annual environmental conditions, such as temperature, nutrient availability, and ocean currents, significantly influence the extent and duration of green tides (Qi et al., 2016a; Zhang et al., 2019). Our identification results corroborate these findings, demonstrating that years with higher peak coverage often correspond to elevated sea surface temperatures and increased nutrient inputs, potentially driven by anthropogenic activities and seasonal upwelling. Furthermore, the spatial distribution of U. prolifera mirrors the prevailing ocean currents, which likely facilitate its dispersal across the Yellow Sea. These insights underscore the interplay between biological processes and physical drivers in shaping green tide dynamics, highlighting the importance of integrating environmental monitoring with algae detection systems.
The comprehensive analysis of U. prolifera’s yearly distribution patterns from 2018 to 2024 (Figure 10) reveals significant fluctuations in the intensity and extent of U. prolifera blooms over the past 7 years. Notably, 2021 experienced the most severe bloom within the study period, with the coverage area peaking of approximately 3,534 km2on June 23. In contrast, 2022 marked a milder bloom and the lowest peak area of roughly 548 km2. However, in 2023, the bloom coverage area surged to the second-highest value in nearly 7 years, underscoring the ongoing need for robust and consistent management strategies to mitigate green tide impacts.
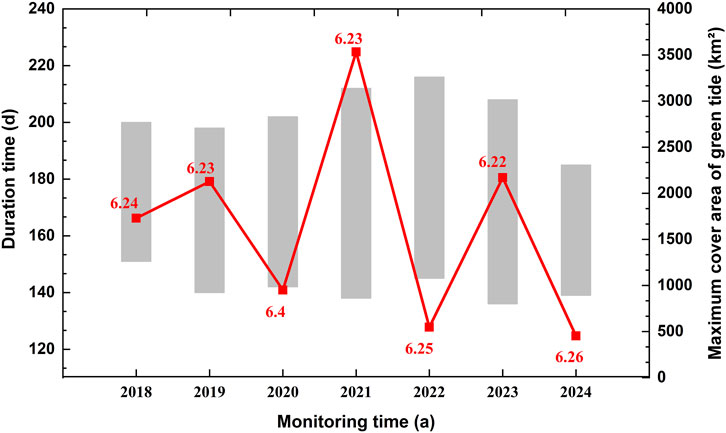
Figure 10. Duration and maximum coverage area of U. prolifera in the Yellow Sea from 2018 to 2024.
This consistency, along with the observed peak times, typically around late June, aligns with previous findings on U. prolifera bloom cycles and suggests that these blooms may be influenced by recurring environmental conditions, such as temperature and nutrient availability, during this period. Notably, the unprecedented bloom in 2021, with its record-high coverage, was strongly linked to the impact of typhoons. Typhoons enhance nutrient enrichment in coastal waters by stirring sediments and promoting upwelling, creating ideal conditions for U. prolifera growth. This exceptional event underscores the significance of incorporating extreme weather events into bloom analyses. The temporal alignment of peak coverage across years, including the typhoon-induced surge in 2021, highlights the importance of targeted monitoring in late June to better anticipate and manage bloom intensity. By integrating factors such as extreme weather events, more effective prediction and management strategies can be developed to mitigate the impact of green tides (Liu et al., 2009; Cui et al., 2018; Fang et al., 2018).
6 Conclusion
U. prolifera, known for forming green tides, poses significant ecological threats in coastal regions. We propose a tailored WaveNet deep learning model for U. prolifera detection using MODIS images, taking advantage of their extensive coverage and high data collection frequency. WaveNet employs VGG16 as its backbone feature extraction network and integrates BiFPN feature pyramid network, replacing fully connected layers and softmax outputs, to enhance feature extraction across various resolutions. We also introduce a lightweight CBAM attention mechanism to filter background noise, ensuring more accurate and efficient feature extraction. With 608 annotated sample pairs, WaveNet achieved a detection accuracy of 97.14%, precision of 92.83%, recall of 93.69%, and an F1 score of 93.26%, significantly outperforming the NDVI and AFAI methods by mitigating uncertainties arising from threshold selection discrepancies. Through analyzing U. prolifera bloom dynamics in the Yellow Sea from 2018 to 2024, we confirmed a significant increase in U. prolifera area every June. Through our analysis, we observed that the maximum coverage area of U. prolifera exhibited an oscillating trend, initially increasing and then decreasing on an interannual basis. Furthermore, our research identified the southeastern Yellow Sea as the source of U. prolifera blooms in 2019, 2020, 2021, 2022, and 2024. These findings provide valuable insights into the early detection, prevention, and control of green tide formation, especially in identifying key geographical sources and underlying factors contributing to U. prolifera.
Data availability statement
The raw data supporting the conclusions of this article will be made available by the authors, without undue reservation.
Author contributions
WZ: Funding acquisition, Resources, Writing – original draft, Writing – review and editing. YX: Investigation, Methodology, Software, Writing – original draft, Writing – review and editing. LZ: Supervision, Validation, Writing – review and editing. ZL: Conceptualization, Data curation, Writing – review and editing. SL: Methodology, Software, Writing – review and editing. YL: Formal Analysis, Validation, Writing – review and editing.
Funding
The author(s) declare that no financial support was received for the research and/or publication of this article.
Conflict of interest
The authors declare that the research was conducted in the absence of any commercial or financial relationships that could be construed as a potential conflict of interest.
Generative AI statement
The author(s) declare that no Generative AI was used in the creation of this manuscript.
Publisher’s note
All claims expressed in this article are solely those of the authors and do not necessarily represent those of their affiliated organizations, or those of the publisher, the editors and the reviewers. Any product that may be evaluated in this article, or claim that may be made by its manufacturer, is not guaranteed or endorsed by the publisher.
References
Arellano-Verdejo, J., Lazcano-Hernandez, H. E., and Cabanillas-Teran, N. (2019). ERISNet: deep neural network for Sargassum detection along the coastline of the Mexican Caribbean. PeerJ 7, e6842. doi:10.7717/peerj.6842
Brisset, M., Van Wynsberge, S., Andréfouët, S., Payri, C., Soulard, B., Bourassin, E., et al. (2021). Hindcast and near real-time monitoring of green macroalgae blooms in shallow coral reef lagoons using sentinel-2: a new-caledonia case study. Remote Sens. 13 (2), 211. doi:10.3390/rs13020211
Cao, Y., Wu, Y., Fang, Z., Cui, X., Liang, J., and Song, X. (2019). Spatiotemporal patterns and morphological characteristics of Ulva prolifera distribution in the Yellow Sea, China in 2016–2018. Remote Sens. 11 (4), 445. doi:10.3390/rs11040445
Cui, J., Zhang, J., Huo, Y., Zhou, L., Wu, Q., Chen, L., et al. (2015). Adaptability of free-floating green tide algae in the Yellow Sea to variable temperature and light intensity. Mar. Pollut. Bull. 101 (2), 660–666. doi:10.1016/j.marpolbul.2015.10.033
Cui, T., Liang, X., Gong, J., Tong, C., Xiao, Y., Liu, R., et al. (2018). Assessing and refining the satellite-derived massive green macro-algal coverage in the Yellow Sea with high resolution images. ISPRS J. Photogrammetry 144, 315–324. doi:10.1016/j.isprsjprs.2018.08.001
Fang, C., Song, K., Shang, Y., Ma, J., Wen, Z., and Du, J. (2018). Remote sensing of harmful algal blooms variability for Lake Hulun using adjusted FAI (AFAI) algorithm. J. Environ. Inf. 34 (2), 108–122. doi:10.3808/jei.201700385
Gao, L., Li, X., Kong, F., Yu, R., Guo, Y., and Ren, Y. (2022). AlgaeNet: a deep-learning framework to detect floating green algae from optical and SAR imagery. IEEE J. Sel. Top. Appl. Earth Observations 15, 2782–2796. doi:10.1109/JSTARS.2022.3162387
Hu, C. (2009). A novel ocean color index to detect floating algae in the global oceans. Remote Sens. Environ. 113 (10), 2118–2129. doi:10.1016/j.rse.2009.05.012
Hu, C., Li, D., Chen, C., Ge, J., Muller-Karger, F. E., Liu, J., et al. (2010). On the recurrent Ulva prolifera blooms in the Yellow Sea and East China sea. J. Geophys. Res. Oceans 115 (C5). doi:10.1029/2009JC005561
Hu, C., Feng, L., Hardy, R. F., and Hochberg, E. J. (2015). Spectral and spatial requirements of remote measurements of pelagic Sargassum macroalgae. Remote Sens. Environ. 167, 229–246. doi:10.1016/j.rse.2015.05.022
Hu, L., Hu, C., and Ming-Xia, H. (2017). Remote estimation of biomass of Ulva prolifera macroalgae in the Yellow Sea. Remote Sens. Environ. 192, 217–227. doi:10.1016/j.rse.2017.01.037
Hu, L., Zeng, K., Hu, C., and He, M.-X. J. R. s.o.e. (2019). On the remote estimation of Ulva prolifera areal coverage and biomass. Remote Sens. Environ. 223, 194–207. doi:10.1016/j.rse.2019.01.014
Jiang, X., Gao, M., Gao, Z., and Science, S. (2020). A novel index to detect green-tide using UAV-based RGB imagery. Estuar. Coast. 245, 106943. doi:10.1016/j.ecss.2020.106943
Lee, J. H., Pang, I. C., Moon, I. J., and Ryu, J. H. (2011). On physical factors that controlled the massive green tide occurrence along the southern coast of the Shandong Peninsula in 2008: a numerical study using a particle-tracking experiment. J. Geophys. Res. Oceans 116 (C12), C12036. doi:10.1029/2011JC007512
Li, X., Liu, B., Zheng, G., Ren, Y., Zhang, S., Liu, Y., et al. (2020). Deep-learning-based information mining from ocean remote-sensing imagery. Natl. Sci. Rev. 7 (10), 1584–1605. doi:10.1093/nsr/nwaa047
Lian, S., Luo, Z., Zhong, Z., Lin, X., Su, S., and Li, S. (2018). Attention guided U-Net for accurate iris segmentation. J. Vis. Commun. 56, 296–304. doi:10.1016/j.jvcir.2018.10.001
Liu, D., Keesing, J. K., Xing, Q., and Shi, P. J. M. p.b. (2009). World’s largest macroalgal bloom caused by expansion of seaweed aquaculture in China. Mar. Pollut. Bull. 58 (6), 888–895. doi:10.1016/j.marpolbul.2009.01.013
Liu, D., Keesing, J. K., He, P., Wang, Z., Shi, Y., and Wang, Y. (2013). The world's largest macroalgal bloom in the Yellow Sea, China: formation and implications. Estuar. Coast. 129, 2–10. doi:10.1016/j.ecss.2013.05.021
Ma, X., Xu, J., Pan, J., Yang, J., Wu, P., and Meng, X. (2023). Detection of marine oil spills from radar satellite images for the coastal ecological risk assessment. J. Environ. Manag. 325, 116637. doi:10.1016/j.jenvman.2022.116637
Qi, L., Hu, C., Xing, Q., and Shang, S. (2016a). Long-term trend of Ulva prolifera blooms in the western Yellow Sea. Harmful Algae 58, 35–44.
Qi, L., Hu, C., Xing, Q., and Shang, S. J. H. A. (2016b). Long-term trend of Ulva prolifera blooms in the western Yellow Sea. Harmful Algae 58, 35–44. doi:10.1016/j.hal.2016.07.004
Qi, L., Hu, C., Wang, M., Shang, S., and Wilson, C. (2017). Floating algae blooms in the East China sea. Geophys. Res. Lett. 44 (22), 501–511. doi:10.1002/2017GL075525
Ronneberger, O., Fischer, P., and Brox, T. (2015). Medical image computing and computer-assisted intervention–MICCAI 2015: 18th international conference, Munich, Germany, October 5-9, 2015, proceedings, part III 18. Springer. doi:10.1007/978-3-319-24574-4_28
Schmidhuber, J. (2015). Deep learning in neural networks: an overview. Neural Netw. 61, 85–117. doi:10.1016/j.neunet.2014.09.003
Shi, W., and Wang, M. (2009). Green macroalgae blooms in the Yellow Sea during the spring and summer of 2008. J. Geophys. Res. Oceans 114 (C12). doi:10.1029/2009JC005513
Smetacek, V., and Zingone, A. (2013). Green and golden seaweed tides on the rise. Nature 504 (7478), 84–88. doi:10.1038/nature12860
Tan, M., Pang, R., and Le, Q. V. (2020). Proceedings of the IEEE/CVF conference on computer vision and pattern recognition.
Wang, Z., Xiao, J., Fan, S., Li, Y., Liu, X., and Liu, D. (2015). Who made the world's largest green tide in C hina? an integrated study on the initiation and early development of the green tide in Yellow Sea. Limnology 60 (4), 1105–1117. doi:10.1002/lno.10083
Wang, S., Liu, L., Qu, L., Yu, C., Sun, Y., Gao, F., et al. (2019). Accurate Ulva prolifera regions extraction of UAV images with superpixel and CNNs for ocean environment monitoring. Neurocomputing 348, 158–168. doi:10.1016/j.neucom.2018.06.088
Xing, Q., and Hu, C. (2016). Mapping macroalgal blooms in the Yellow Sea and East China Sea using HJ-1 and Landsat data: application of a virtual baseline reflectance height technique. Remote Sens. Environ. 178, 113–126. doi:10.1016/j.rse.2016.02.065
Xing, Q., An, D., Zheng, X., Wei, Z., Wang, X., Li, L., et al. (2019). Monitoring seaweed aquaculture in the Yellow Sea with multiple sensors for managing the disaster of macroalgal blooms. Remote Sens. Environ. 231, 111279. doi:10.1016/j.rse.2019.111279
Xu, Q., Zhang, H., Ju, L., and Chen, M. (2014). Interannual variability of Ulva prolifera blooms in the Yellow Sea. Int. J. Remote Sens. 35 (11-12), 4099–4113. doi:10.1080/01431161.2014.916052
Xu, Q., Zhang, H., Cheng, Y., Zhang, S., and Zhang, W. (2016). Monitoring and tracking the green tide in the Yellow Sea with satellite imagery and trajectory model. IEEE J. Sel. Top. Appl. Earth Observations Remote Sens. 9 (11), 5172–5181. doi:10.1109/jstars.2016.2580000
Ye, N.-h., Zhang, X.-w., Mao, Y.-z., Liang, C.-w., Xu, D., Zou, J., et al. (2011). ‘Green tides’ are overwhelming the coastline of our blue planet: taking the world’s largest example. Ecol. Res. 26, 477–485. doi:10.1007/s11284-011-0821-8
Zhang, M., Tang, J., Dong, Q., Song, Q., and Ding, J. (2010). Retrieval of total suspended matter concentration in the Yellow and East China Seas from MODIS imagery. Remote Sens. Environ. 114 (2), 392–403. doi:10.1016/j.rse.2009.09.016
Zhang, Y., He, P., Li, H., Li, G., Liu, J., Jiao, F., et al. (2019). Ulva prolifera green-tide outbreaks and their environmental impact in the Yellow Sea, China. Neurosurgery 6 (4), 825–838. doi:10.1093/nsr/nwz026
Zheng, L., Wu, M., Cui, Y., Tian, L., Yang, P., Zhao, L., et al. (2022). What causes the great green tide disaster in the South Yellow Sea of China in 2021? Ecol. Indic. 140, 108988. doi:10.1016/j.ecolind.2022.108988
Keywords: deep learning model, green tide detection, MODIS, satellite remote sensing, yellow sea
Citation: Zhu W, Xu Y, Zhang L, Liu Z, Liu S and Li Y (2025) A deep-learning framework to detect green tide from MODIS images. Front. Remote Sens. 6:1578841. doi: 10.3389/frsen.2025.1578841
Received: 18 February 2025; Accepted: 28 July 2025;
Published: 10 September 2025.
Edited by:
Chao Chen, Suzhou University of Science and Technology, ChinaReviewed by:
Dušan P. Nikezić, University of Belgrade, SerbiaXinyue Yang, Curtin University, Australia
Copyright © 2025 Zhu, Xu, Zhang, Liu, Liu and Li. This is an open-access article distributed under the terms of the Creative Commons Attribution License (CC BY). The use, distribution or reproduction in other forums is permitted, provided the original author(s) and the copyright owner(s) are credited and that the original publication in this journal is cited, in accordance with accepted academic practice. No use, distribution or reproduction is permitted which does not comply with these terms.
*Correspondence: Yuelin Xu, bTIyMDIwMDcwMEBzdC5zaG91LmVkdS5jbg==