 Abdessamad Elmotawakkil1
 Adil Moumane2
 Assia Zahi1Abdelkhalik Sadiki2Jamal Al Karkouri2Mouhcine Batchi2
 Suraj Kumar Bhagat3*Tiyasha Tiyasha4Nourddine Enneya1
- 1Department of Computer Science, Faculty of Sciences, University Ibn Tofail, Kenitra, Morocco
- 2Department of Geography, Faculty of Humanities and Social Sciences, University Ibn Tofail, Kenitra, Morocco
- 3Marwadi University Research Center, Department of Civil Engineering, Faculty of Engineering & Technology, Marwadi University, Gujarat, Rajkot, India
- 4Faculty of Civil Engineering, Ton Duc Thang University, Ho Chi Minh City, Vietnam
Introduction: Groundwater recharge mapping is crucial for sustainable water resource management in arid and semi-arid regions, particularly in hydro-climatically stressed areas such as the Feija Basin in southeastern Morocco. Characterized by shallow aquifers, irregular rainfall, and over-extraction for agriculture, this region faces increasing groundwater depletion. Recent extreme rainfall events during the 2024–2025 season have highlighted both the vulnerability and opportunity for recharge, emphasizing the need for data-driven, proactive strategies.
Methods: This study introduces a GeoAI-based framework combining remote sensing, geospatial analysis, and advanced artificial intelligence (AI) models to predict optimal groundwater recharge zones. Ten conditioning factors (e.g., elevation, slope, topographic wetness index, NDVI, rainfall, soil permeability, geomorphology) were used to construct the input dataset. Five AI models TabNet, TabTransformer, Multilayer Perceptron (MLP), CatBoost, and AdaBoost were trained and optimized using grid search and particle swarm optimization (PSO). Performance was evaluated using accuracy, AUC-ROC, Cohen’s Kappa, and feature importance. Spatial validation was conducted using in-situ borehole data.
Results: Among the tested models, TabNet achieved the highest performance (accuracy = 97.8%, AUC = 0.99), followed closely by TabTransformer (accuracy = 97.6%). Both models demonstrated strong generalization and produced spatially coherent recharge maps. Predicted optimal zones corresponded with low-lying, vegetated, and permeable areas, aligning with known hydrogeological features.
Discussion: This study presents a novel application of tabular deep learning models in groundwater science, enhancing the precision and interpretability of recharge zone mapping. The results provide actionable insights for water resource planners, especially in light of recent anomalous hydrological events. The proposed framework supports the development of rainwater harvesting and artificial recharge systems to ensure long-term groundwater sustainability in climate-sensitive areas.
Introduction
Groundwater is a fundamental component of water security in arid and semi-arid regions, acting as a buffer against the variability and scarcity of surface water resources. A global synthesis of well data reveals rapid declines often exceeding 0.5 m/year in dry-region aquifers, underscoring their crucial role in sustaining ecosystems, agriculture, and livelihoods in the absence of reliable rivers or reservoirs (Jasechko et al., 2024). In Morocco’s southern and southeastern provinces, including the Middle Drâa Valley, groundwater similarly underpins agricultural activity, domestic supply, and ecological balance. For example, the Feija watershed is overwhelmingly reliant on pumped groundwater, and intensifying farming and aridity have led to overexploitation of the aquifers (Moumane et al., 2021).
Although agriculture remains central to the Feija Plain’s economy, the shift toward large-scale, export-driven watermelon cultivation has dramatically intensified groundwater pumping. Socio-hydrological research (Bossenbroek et al., 2023; Fico and Kenti, 2023; Fico, 2024; Silva-Novoa Sánchez et al., 2025) confirms that this expansion has not only depleted aquifers but also aggravated social inequities and ecological fragility. Crucially, this over-extraction has diminished the aquifer’s natural buffering capacity, making the system highly susceptible to both prolonged drought and episodic floods. Between late 2024 and early 2025, southern Morocco experienced a spate of intense flash floods even as the region faced one of the worst droughts in decades, the most striking being the September 7–8, 2024 Atlantic-origin extratropical cyclone that dumped more than a year’s worth of rain in only 2 days (Moumane et al., 2025; Egbejule, 2024; NASA Earth Observatory, 2024), temporarily filling Lake Iriqui after more than 50 years (Moumane et al., 2025). Yet, despite this dramatic influx, key oases like Ternata remain groundwater-stressed, weakened by persistent extraction pressure and upstream dam regulation. In May 2025, a violent 10-min storm in Zagora Province destroyed fields and thousands of watermelon crops (Freshplaza, 2025), illustrating that even extreme, short-duration rainfall events fail to recharge deep aquifers without intentional capture and storage systems. These compounding factors highlight the urgent need for targeted infrastructure such as managed aquifer recharge, retention basins, and infiltration ponds to convert episodic floods into reliable groundwater reserves and enhance both water security and agricultural resilience (Moumane et al., 2024).
Recent studies have shown that deep learning techniques are increasingly used across various scientific fields, including hydrology, physics, and speech recognition (Kheddar, Hemis, and Himeur, 2024; Tripathy and Mishra, 2024; Bezekci, 2025; Bezekci and Kuru, 2025; Bezekçi, 2025), demonstrating their flexibility and problem-solving potential across disciplines. They have also proven effective in extracting water surfaces from satellite imagery using semantic segmentation models such as U-Net (Elmotawakkil and Enneya, 2025).
While machine learning techniques have gained considerable attention in hydrogeological studies, most conventional models, such as random forest, support vector machines, or decision trees, are limited in their ability to capture complex, nonlinear interactions among environmental variables (Maity et al., 2024; Biazar et al., 2025). These models often rely on predefined feature hierarchies and may struggle to generalize in heterogeneous, data-scarce contexts like arid and semi-arid regions (Borzì, 2025). Furthermore, traditional machine learning (ML) approaches frequently lack mechanisms for automated feature selection and spatial awareness, which are critical for accurately delineating recharge zones (Roy et al., 2025). This gap highlights the need for more sophisticated models capable of learning intricate spatial and hydrological patterns directly from structured data without extensive manual preprocessing.
To address the pressing challenges of groundwater recharge assessment in the Feija Basin, this study presents an integrated GeoAI-based modeling framework. The approach leverages five advanced AI algorithms: TabNet, TabTransformer, MLP, CatBoost, and AdaBoost. Despite the growing availability of geospatial data in structured tabular formats derived from environmental layers such as soil, geomorphology, and hydrology, there remains a significant research gap in applying tabular deep learning models to groundwater recharge prediction, particularly in arid regions. While ML methods have gained traction in hydrogeology (Jari et al., 2023; Al Atawneh et al., 2024; Liu et al., 2024; Sarkar et al., 2024; Hosseini et al., 2025), deep learning (DL) architectures like TabNet and TabTransformer are rarely explored in this field. These models offer a distinct advantage in handling high-dimensional, heterogeneous tabular data. Their application in this study represents a novel attempt to adapt state-of-the-art DL techniques to the specific demands of recharge zone mapping in arid, fragile environments such as the Middle Drâa Valley.
This study pursues two principal aims. First, it explores the novel application of tabular DL architectures, specifically TabNet and TabTransformer, for hydrogeological modeling in arid environments, leveraging structured geospatial datasets to predict groundwater recharge zones with enhanced spatial accuracy. These models are systematically evaluated using robust performance metrics and validated against in situ borehole data to ensure empirical reliability. Second, the study aims to develop high-resolution groundwater recharge maps capable of identifying priority zones for artificial recharge. These outputs are intended to inform and accelerate the design of strategic water harvesting infrastructure, such as infiltration ponds and recharge basins, particularly in anticipation of increasing numbers of flood events projected under future climate scenarios (Amiha et al., 2024; Rieder et al., 2025). By aligning advanced AI techniques with geospatial intelligence, the research provides actionable insights to support sustainable water management and reduce the vulnerability of agriculture, especially watermelon production, in the water-stressed Feija Basin.
Related work
Groundwater resources in arid and semi-arid regions are increasingly under pressure due to anthropogenic overuse and climate variability. In southeastern Morocco, particularly the Feija Basin and the wider Middle Drâa Valley, this issue is acute. Lamqadem and Pradhan (2019) employed multi-temporal Landsat imagery to monitor land use transformations, documenting a shift from traditional pastoralism to agriculture, driven primarily by informal groundwater abstraction. Complementing this, Moumane et al. (2021) used a combination of remote sensing and geostatistical tools to assess groundwater salinization and drawdown in the Feija region, revealing significant degradation between 2013 and 2018.
Beyond hydrological metrics, sociopolitical studies such as those by Bossenbroek et al. (2023) and Fico (2024) have highlighted the role of land commodification, the expansion of commercial crops (e.g., watermelon), and unequal water access in intensifying the groundwater crisis in the region. Although these studies provide critical insights, they predominantly rely on GIS-based multi-criteria evaluation or qualitative assessments, with limited incorporation of predictive, data-driven modeling tools such as machine learning (ML) or deep learning (DL).
In other parts of the world, machine learning and deep learning have been successfully applied to groundwater potential mapping. Nugroho et al. (2024) evaluated the performance of random forest (RF), support vector machine (SVM), and artificial neural network (ANN) for predicting groundwater zones in West Java, Indonesia, using GIS and remote sensing layers. RF was found to outperform the other models in both accuracy and spatial coherence. Sarkar et al. (2024) applied a suite of ML models, including ANN and logistic regression, to assess groundwater potential in Bangladesh under climate change scenarios, demonstrating that integrating hydroclimatic variables into the modeling framework enhances spatial prediction accuracy. In Morocco, Ragragui et al. (2024) compared multiple ML classifiers and concluded that a voting ensemble model yielded the highest predictive accuracy for groundwater potential mapping, underscoring the effectiveness of ensemble strategies in data-scarce arid regions. Similarly, Elmotawakkil et al. (2024) explored the integration of geospatial data and ML techniques to improve groundwater level prediction and support sustainable water resource management in the Rabat–Salé–Kénitra region.
Recent developments in deep learning have led to the emergence of models tailored specifically for tabular data, such as TabNet and TabTransformer. These architectures address limitations of traditional CNN and LSTM models when applied to non-sequential, structured datasets (Arik and Pfister, 2021; Huang et al., 2021) by enabling efficient feature selection and improved interpretability. While DL approaches like ANN have been adopted in recent groundwater studies, most applications continue to focus on conventional ML techniques such as random forest or logistic regression. Few studies attempt to compare these models statistically or explore newer tabular DL frameworks like Igwebuike et al. (2024). Moreover, model evaluation remains largely dependent on singular performance metrics such as receiver operating characteristic (ROC)-AUC or accuracy, without multi-criteria decision-making or significance testing. Tools such as the Friedman test and the Technique for Order Preference by Similarity to Ideal Solution (TOPSIS) method, which enable rigorous model comparison and selection, are rarely employed in this context (Yariyan et al., 2021; Atenidegbe and Mogaji, 2023). This study introduces TabNet and other advanced models for groundwater potential mapping in the Feija Basin, offering a novel contribution by integrating tabular deep learning with rigorous statistical validation and spatial performance assessment.
In summary, the literature reveals that while GIS- and multi-criteria decision analysis (MCDA)-based approaches are commonly used for groundwater potential mapping in southeastern Morocco, the adoption of machine learning and DL techniques remains limited. International studies highlight the potential of these models, yet they often lack rigorous comparative validation and spatial assessment. To address these gaps, the present study implements and compares five advanced models, including TabNet, TabTransformer, MLP, CatBoost, and AdaBoost, for groundwater potential mapping in the Feija Basin. By integrating spatial accuracy evaluation with robust statistical techniques such as confusion matrices, ROC analysis, the Friedman test, and the TOPSIS ranking method, this study provides a comprehensive and reproducible framework for groundwater assessment in complex arid environments.
Methodology
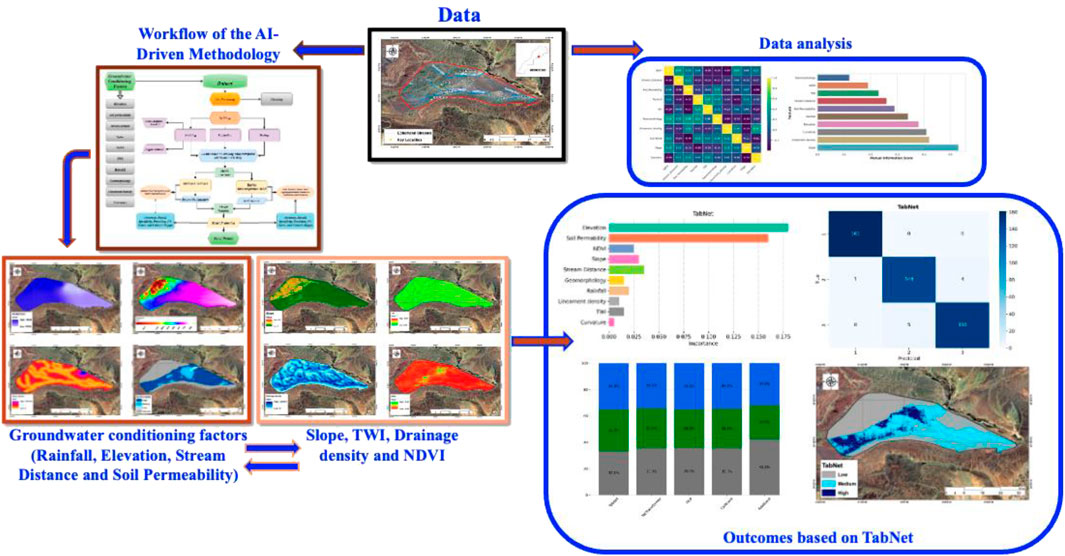
This study presents a comprehensive ML pipeline designed to classify groundwater potential zones based on remote sensing and geospatial features. The methodology consists of sequential stages, including data preprocessing, augmentation, feature scaling, model selection, hyperparameter optimization, model training, and performance evaluation Figure 1.
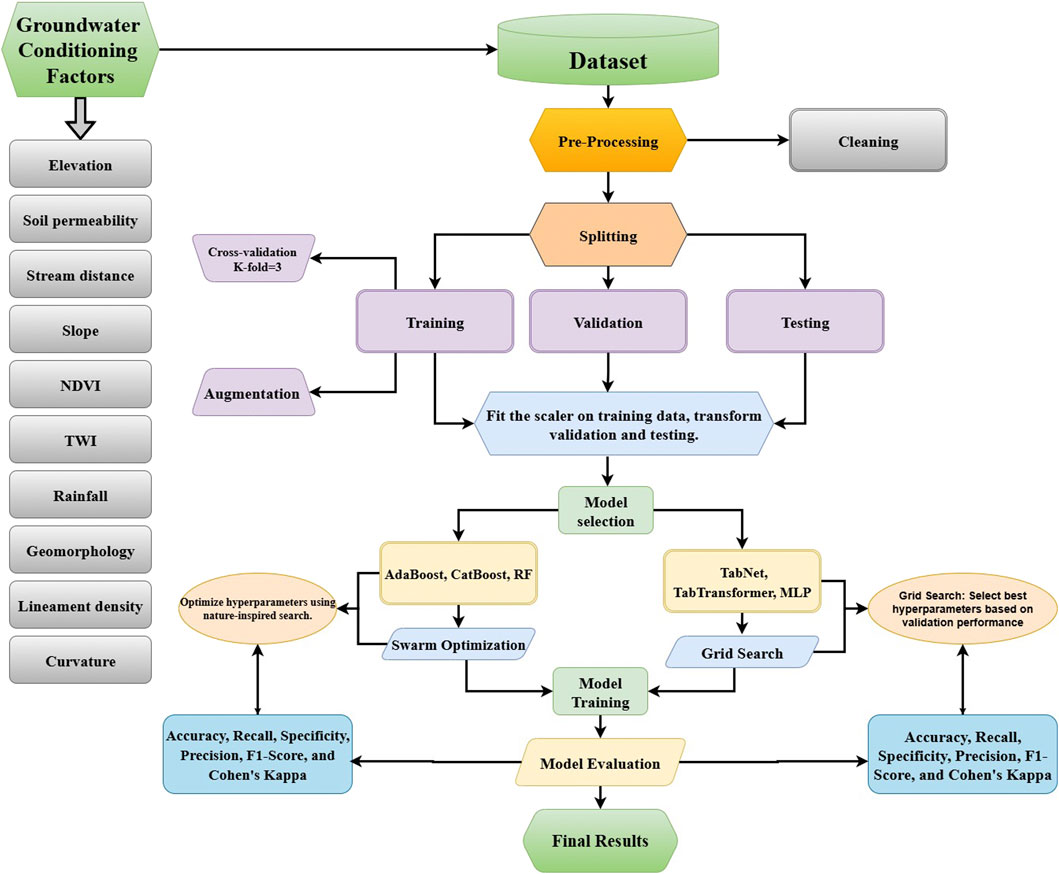
Figure 1. Methodological flowchart of the AI-driven framework for groundwater potential mapping.
Study area description
The Feija Plain is located in southeastern Morocco within the Middle Drâa Valley (MDV). This region, historically characterized by subsistence agriculture and seasonal pastoralism, is ecologically fragile and climatically arid (Schulz and Manfred, 2013). It lies along the western flank of the Drâa River near the city of Zagora and forms part of an interconnected oasis system extending over 200 km (Karmaoui and Adil, 2016).
Over the past 2 decades, Feija has undergone a rapid transformation toward intensive, export-oriented agriculture (Lamqadem and Pradhan, 2019). In particular, watermelon farming has emerged as the dominant land use, incentivized by government-subsidized drip irrigation systems and the widespread availability of high-yield hybrid seeds from international agribusinesses (Fico, 2022; Silva-Novoa Sánchez, 2024). The region’s warm winter climate allows for two harvests per season prior to the main production peaks in competing regions, granting it a comparative advantage in the national market (Bossenbroek et al., 2023).
Hydrogeologically, the Feija Plain is primarily underlain by shallow, unconfined phreatic aquifers hosted in Quaternary alluvial deposits, which have traditionally been accessed through hand-dug wells (Aoubouazza and Elmeknassi, 1996; Klose, 2013; Bassin Hydraulique de Souss Massa et de DraaABHSMD Agence du, 2014). However, the intensification of irrigated agriculture, particularly for high-demand crops such as watermelon, has triggered a dramatic increase in groundwater abstraction. As a result, deep boreholes, often exceeding 100 m in depth, are now being drilled into older, confined aquifer systems embedded within Ordovician and Cambrian geological formations. These deep aquifers exhibit low recharge rates due to their lithological composition and structural confinement, rendering them highly vulnerable to overexploitation. The cumulative impact has been a significant decline in piezometric levels, raising critical concerns over long-term aquifer sustainability, ecological degradation, and the socioeconomic viability of agricultural livelihoods in the region (Moumane et al., 2021; 2024).
The area is also traversed by ephemeral watercourses, including Oued Feija and Oued Boutious, which become active during high-intensity rainfall events. During the 2024–2025 hydrological season, both streams experienced significant flash floods Figures 2, 3, with at least five episodic flow events recorded. A particularly destructive storm occurred in early May 2025, when torrential rains and hail struck the Feija Plain. This event devastated nearly 4,000 to 5,000 tons of watermelon crops, only 1 week before the main harvest. According to field reports, more than 700 farmers lost 90%–95% of their production, leading to severe financial distress and widespread concerns about the repayment of agricultural loans (Freshplaza, 2025). Many cultivation areas were rendered inaccessible due to waterlogged tracks, and no water harvesting or artificial recharge systems were in place to capture the millions of cubic meters of floodwater lost to the desert.
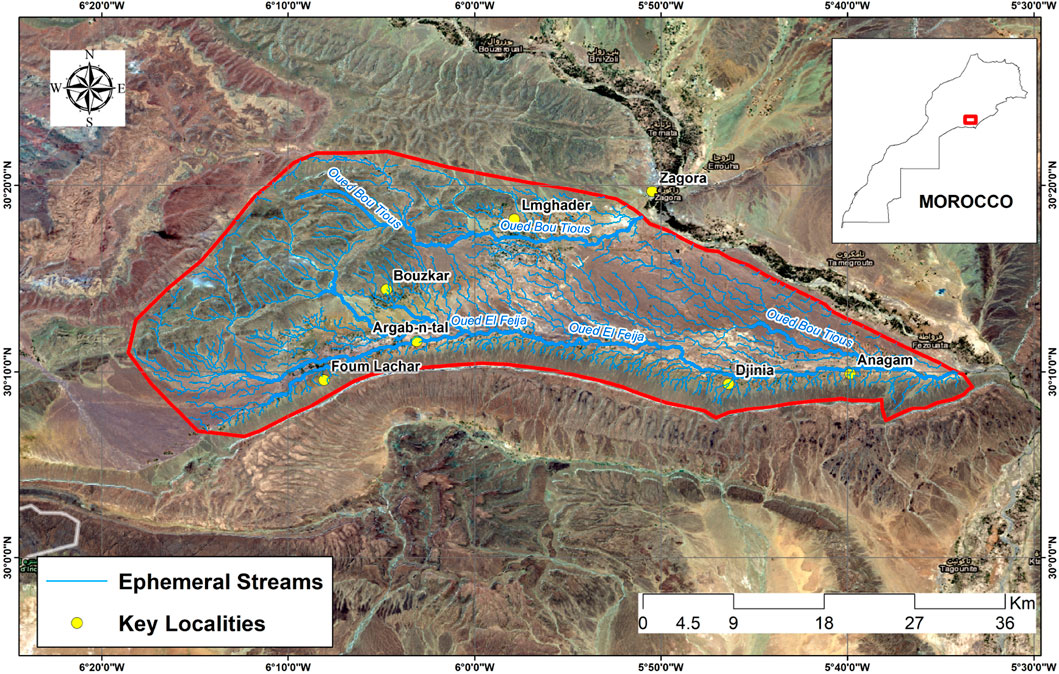
Figure 2. Delineation of the Feija Watershed and ephemeral stream network on Sentinel-2 imagery (18 March 2025). This map delineates the Feija watershed in southeastern Morocco, outlined in red and overlaid on a Sentinel-2 L2A true color image acquired on 18 March 2025. The background satellite imagery illustrates the topographic and land use contrasts. The map highlights the ephemeral stream network (in blue), including Oued El Feija and Oued Bou Tiouas, which are typically dry but become active during flash flood events. Several key localities, such as Lmghader, Bouzkar, and Foum Lachar, are marked. These transient channels played a major role in surface runoff transport during storm events, underscoring the urgent need for floodwater harvesting and aquifer recharge infrastructure in the plain.
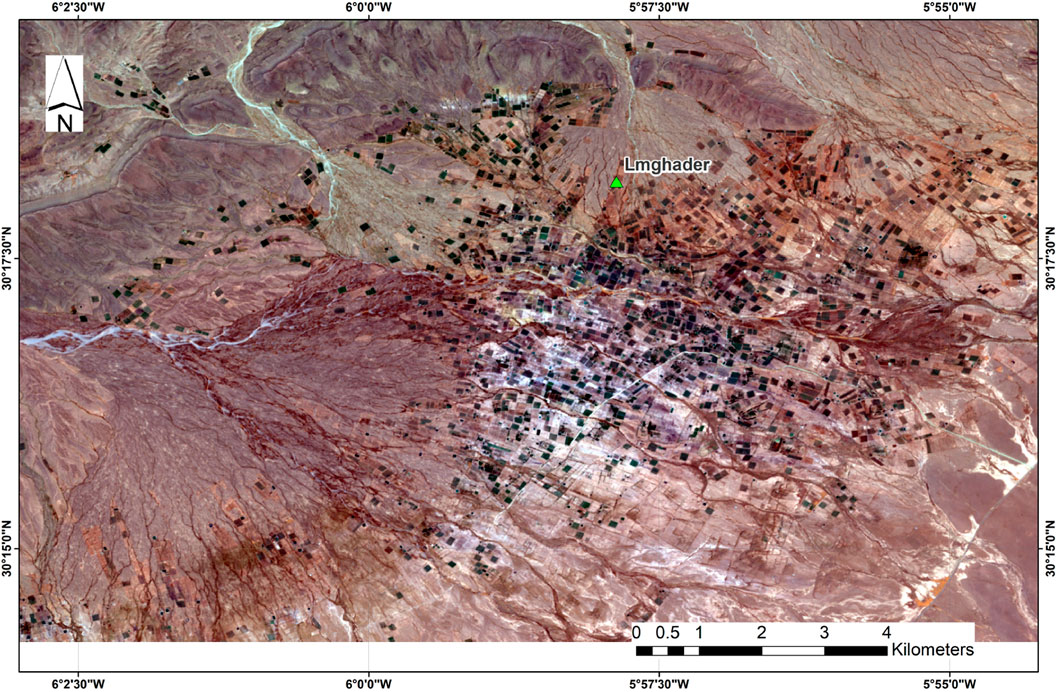
Figure 3. Post-flood Sentinel-2 image of the Feija Plain (2 May 2025) depicting agricultural damage following the early May 2025 flash floods. This Sentinel-2 L2A true color image, acquired on 2 May 2025, captures the Feija Plain in the immediate aftermath of severe flash floods that struck the region in early May. The area, including the agricultural zones around the village of Lmghader, was heavily impacted by torrential rains and hail. The ephemeral streams Oued Feija and Oued Boutious, visible as bright sediment-laden channels, overflowed and inundated surrounding farmland. According to field reports, approximately 4,000 to 5,000 tonnes of watermelon were destroyed 1 week before harvest, affecting more than 700 farmers who lost up to 95% of their crop. The absence of floodwater retention infrastructure resulted in widespread waterlogging and the total loss of cultivable land parcels across the plain.
Dataset description
The dataset used in this study integrates both remote sensing-derived features and in situ observations to support accurate classification of groundwater potential zones. The in situ component consists of field-based groundwater potential assessments or borehole productivity data, which serve as ground-truth labels for supervised machine learning. Predictor variables were extracted from multiple geospatial and satellite data sources, including stream distance, drainage density, soil permeability, rainfall, topographic wetness index (TWI), geomorphology, lineament density, curvature, slope, elevation (DEM), and the Normalized Difference Vegetation Index (NDVI). These features were obtained from processed satellite imagery (e.g., Sentinel-2), digital elevation models (e.g., SRTM), and thematic layers such as geological or hydrological maps. All spatial layers were resampled and reprojected to a common spatial resolution and coordinate system to ensure consistency. After preprocessing and integration, the dataset was formatted as a structured table where each entry corresponds to a geospatial unit associated with the input variables and a labeled groundwater potential class. Summary statistics for all input features, including their mean, standard deviation, minimum, and maximum values, are presented in Table 1.
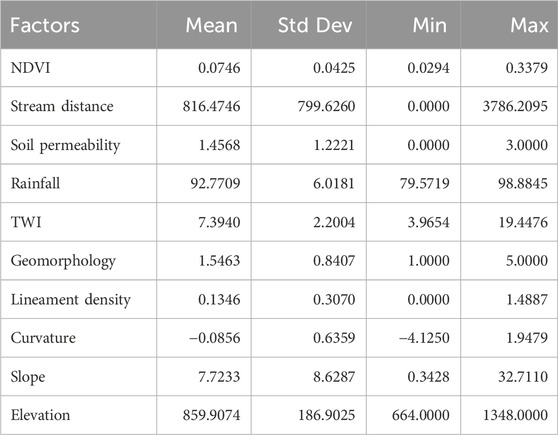
Table 1. Descriptive statistics of input features.
Data preprocessing
The preprocessing workflow began with handling missing values, ensuring consistent data formats, and detecting and removing outliers to improve data quality. The dataset was then partitioned into training (64%), validation (16%), and testing (20%) subsets using stratified sampling to maintain a balanced distribution of groundwater potential classes across all sets.
To address class imbalance and improve model robustness, data augmentation was applied exclusively to the training set. Synthetic samples were generated by injecting Gaussian noise into the original features, with noise parameters constrained within the observed feature ranges. This technique preserved the statistical characteristics of the original data while increasing the diversity of training samples, thereby reducing the risk of overfitting and improving model generalization in underrepresented classes.
Feature scaling was performed using the StandardScaler from Scikit-learn. The scaler was fitted on the training data and then applied consistently to the validation and testing sets to prevent data leakage and ensure uniform scaling across the entire modeling pipeline.
Selection of predictor variables for groundwater modeling
Groundwater recharge is fundamentally controlled by hydrological, hydrogeological, and land-surface characteristics that affect infiltration, flow paths, and storage. We selected ten conditioning factors: elevation, slope, curvature, TWI, soil permeability, geomorphology, rainfall, NDVI, stream distance, and lineament density, based on their established roles in recharge processes and support in recent hydrogeological studies:
Elevation, slope, curvature, and TWI: These topographic indices determine runoff potential and soil moisture accumulation. The use of TWI and slope as recharge proxies is demonstrated in global hydrology models and distributed watershed frameworks (Mathewos et al., 2024; Patel et al., 2024; Ajayakumar and Reghunath, 2025).
Rainfall: As the principal source of recharge, precipitation is universally included in recharge assessments across Indian, African, and Chinese basins (Kaewdum and Chotpantarat, 2021; Mezali et al., 2025; Tabassum et al., 2025).
Soil permeability and geomorphology: Soil texture and landform types strongly influence infiltration rates. These factors have been weighted heavily in analytical hierarchy process (AHP) and MCDA studies (Moumane et al., 2025).
NDVI and LULC: Vegetation significantly impacts evapotranspiration and soil moisture. Plant cover, estimated via NDVI, is essential in recharge studies (Meng et al., 2024).
Stream (drainage) distance: Areas close to streams or with low drainage density often indicate greater infiltration potential (Sedghi and Zhan, 2023).
Lineament density: Fracture and fault frequency control subsurface fluid pathways. High-density lineament zones positively correlate with recharge (Sander, 2007).
These factors are widely recognized across hydrological literature, from GIS-based MCDA/AHP frameworks to data-driven predictive schemes. Table 2 includes a detailed summary of each variable’s data source, unit type, and hydrological relevance, citing these foundational studies to enhance transparency and methodological robustness.
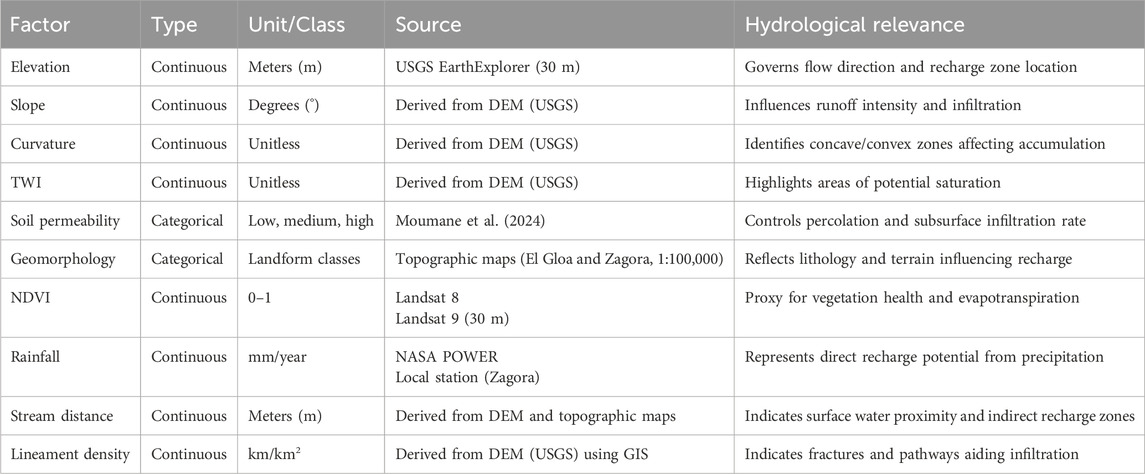
Table 2. Groundwater conditioning factors used in the study, along with their data characteristics and hydrological relevance.
Feature selection
To improve model robustness and reduce redundancy in the input space, feature selection was conducted using both linear and nonlinear dependency analyses. First, a Pearson correlation matrix (Figure 4) was computed to identify pairs of features with high collinearity. Features exhibiting strong correlations (i.e.,
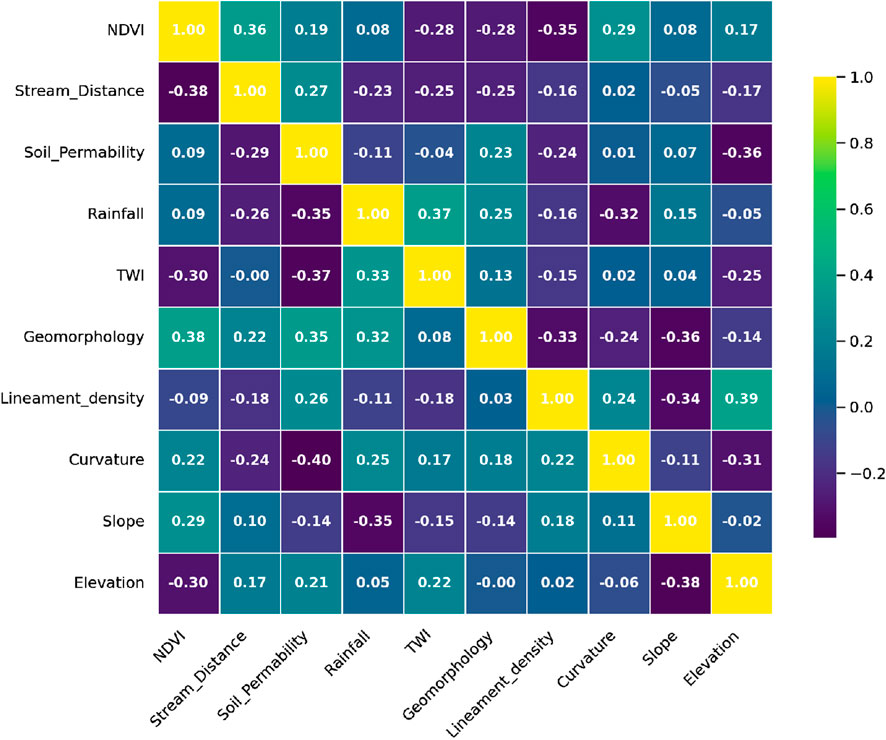
Figure 4. Feature correlation matrix among input variables.
In parallel, mutual information (MI) was computed between each input feature and the target groundwater potential class to capture nonlinear dependencies Figure 5. Features with low MI scores, indicating weak predictive relevance, were excluded from the final feature set. This dual approach allowed for the retention of variables that were both independent and informative, thereby optimizing the input space used for model training and reducing computational complexity.
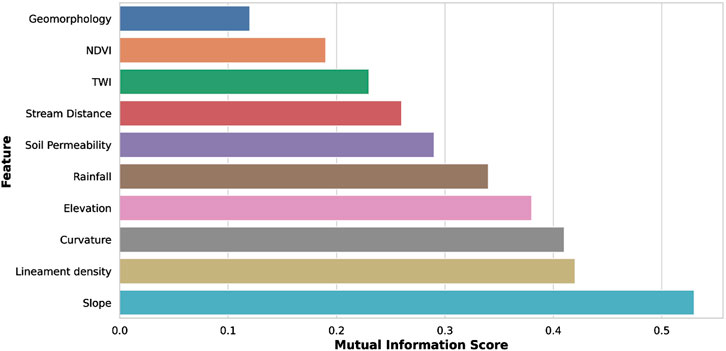
Figure 5. Mutual information scores between features and groundwater potential classes.
Machine learning and deep learning models
In this study, a combination of traditional ML algorithms and modern DL architectures was employed to classify groundwater potential zones based on a set of geospatial and environmental features. The chosen models were selected to provide a comprehensive comparison between interpretable, efficient classifiers and more complex, representation-learning-based models. Specifically, the ML models used include CatBoost and AdaBoost. These algorithms are known for their robustness, generalization capabilities, and suitability for structured data.
To complement these, three DL models, MLP, TabNet, and TabTransformer, were implemented to evaluate their ability to capture high-order feature interactions and complex patterns. TabNet and TabTransformer are recent architectures designed specifically for tabular data, offering attention-based mechanisms that improve interpretability and learning efficiency. The diversity of models allows for a comprehensive evaluation of predictive performance, computational cost, and interpretability across different learning paradigms.
AdaBoost classifier
AdaBoost (adaptive boosting) is an ensemble method that combines multiple weak classifiers, typically decision stumps, to form a strong classifier. It improves performance by focusing on the training instances that were previously misclassified. At each iteration, AdaBoost assigns a weight to the weak learner based on its accuracy and updates the weights of the training samples to emphasize difficult examples.
Given a dataset of
where:
•
•
•
•
After each iteration, the weights of the training samples are updated according to their classification outcome, thereby guiding the model to focus on harder-to-classify examples. This adaptive mechanism helps AdaBoost improve the overall prediction accuracy while maintaining good generalization.
AdaBoost has demonstrated robust performance across various classification tasks and has solid theoretical foundations, particularly in reducing both bias and variance (Schapire, 1999).
CatBoost
CatBoost is a gradient boosting decision tree (GBDT) algorithm developed to handle categorical features efficiently without extensive preprocessing (Dorogush, Ershov, and Gulin, 2018). The model constructs an ensemble of decision trees, where each tree
where
Multilayer perceptron (MLP)
MLP is a fundamental DL architecture composed of multiple layers of interconnected neurons, where each neuron applies an affine transformation followed by a nonlinear activation function (Goodfellow, Bengio, and Courville, 2016). Given an input feature vector
where
where
TabNet
TabNet is a unified DL architecture that employs a sequential multi-step decision process to enhance both feature selection and the representation of high-dimensional data (Arik and Pfister, 2021). At each step in the sequence, a D-dimensional feature vector is processed and passed through a Feature Transformer module. This module comprises several layers that may be either shared across all decision steps or uniquely assigned to individual steps. Within each Transformer block, fully connected layers are integrated with batch normalization and gated linear unit (GLU) activations. The GLU is further enhanced with a residual connection followed by normalization, which contributes to maintaining stable variance across the network. This hierarchical structure not only facilitates effective feature selection but also optimizes the model’s parameter usage.
At each decision step, TabNet uses an Attentive Transformer to generate a sparse mask that selects relevant features. This mask is computed as follows:
where
The final prediction is computed as follows:
This step-wise attention mechanism enables TabNet to focus on the most informative features at each stage, offering both high predictive performance and interpretability for structured datasets.
TabTransformer with self-supervised learning
The TabTransformer is a DL architecture tailored for tabular data, effectively modeling both categorical and numerical features through contextual embeddings and self-attention mechanisms (Huang et al., 2021). In this framework, each categorical feature
These embeddings are processed through Transformer encoder layers utilizing multi-head self-attention to capture inter-feature dependencies. The output embeddings are then concatenated with normalized numerical features
This representation
Model optimization
Hyperparameter optimization was critical for maximizing the predictive performance of the models. Two different strategies were applied depending on the model type: grid search for DL models and particle swarm optimization (PSO) for classical ML models.
Grid search optimization
Grid search (Bergstra and Bengio, 2012) is a systematic approach that exhaustively explores a manually defined subset of the hyperparameter space. In Table 3, grid search was applied to optimize DL models such as TabNet, TabTransformer, and MLP. Although computationally intensive, grid search guarantees the identification of the optimal hyperparameter combination within the predefined grid. It is particularly effective when the search space is moderate in size and model training times are relatively manageable. Cross-validation was used during the search process to ensure the robustness and generalization capability of the selected hyperparameters.
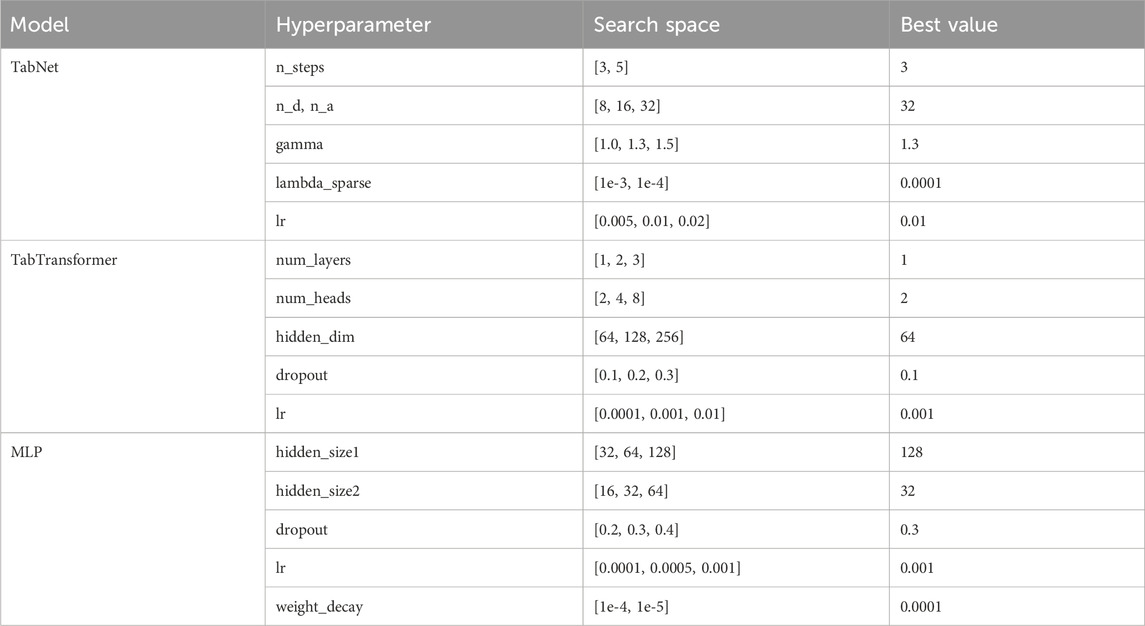
Table 3. Grid search: hyperparameter ranges and best settings for deep learning models.
Swarm optimization
Particle swarm optimization (PSO) (Kennedy and Russell, 1995) was utilized for classical ML models, including support vector machine (SVM) and AdaBoost. PSO is a nature-inspired metaheuristic algorithm modeled after the collective behavior of bird flocking and fish schooling. It optimizes hyperparameters by initializing a swarm of candidate solutions that move through the search space guided by their own best-known positions and the global best-known position Table 4. PSO is particularly advantageous for efficiently exploring large, non-convex, and multi-modal search spaces, offering faster convergence and better avoidance of local minima than grid-based methods.
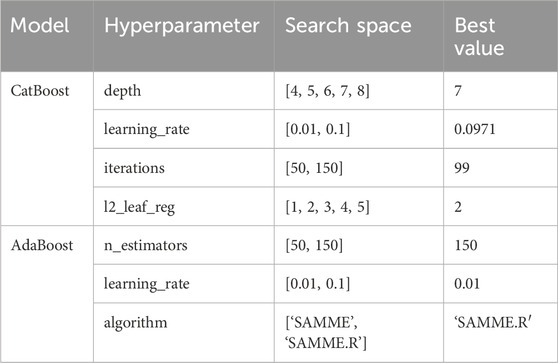
Table 4. Swarm optimization: hyperparameter ranges and best settings for machine learning models.
The reason PSO, and more generally, swarm optimization (SO), is often preferred for ML models rather than DL models comes down to efficiency, scalability, and internal training complexity. ML models typically have fewer parameters and faster evaluation cycles, making SO-based tuning more computationally feasible. In contrast, DL models involve expensive gradient-based internal optimization during training, making external swarm-based hyperparameter tuning impractical due to high computational cost and time requirements.
Model evaluation
We employed several standard evaluation metrics to comprehensively assess the performance of the developed classification models, including accuracy, precision, recall (sensitivity), F1-score, specificity, and Cohen’s kappa score. These metrics are essential for evaluating both overall and class-wise performance, especially in the presence of class imbalance (Sokolova and Lapalme, 2009; Chicco and Jurman, 2020; Kumar and Singh, 2022).
The following equations define the metrics used:
Table 4 evaluation metrics (mathematical definitions).
where
All metrics were computed using weighted averages to accommodate class imbalance, and models were evaluated on both training and testing data to ensure generalization. In addition, receiver operating characteristic (ROC) and precision-recall (PR) curves were plotted to assess classification thresholds and model discrimination capacity (Davis and Goadrich, 2006).
Model selection using the Friedman test and TOPSIS
To identify the best-performing ML model among multiple candidates, we adopted a dual evaluation strategy based on (1) the Friedman test with post hoc ranking and (2) TOPSIS. These methods were chosen for their robustness in multi-metric and multi-model comparison scenarios, where conventional single-metric evaluations may lead to biased or inconsistent conclusions.
The Friedman test is a nonparametric statistical test used to detect significant differences in the performance rankings of models across multiple metrics or datasets. It does not assume normality and is particularly suitable for ML experiments involving repeated measures. In our case, we applied the Friedman test across six performance metrics (accuracy, recall, specificity, precision, F1-score, and Cohen’s kappa) to evaluate six models. A significant test result indicates that at least one model performs differently. If significance is confirmed, post hoc analyses (e.g., the Nemenyi test) can identify which models differ significantly (Demšar, 2006).
The Friedman test was employed in parallel to compare the performance of each model based on multiple evaluation metrics. This test ranks the models by considering their performance across all metrics (classification accuracy, AUC-ROC, Cohen’s kappa, and feature importance) and identifies statistically significant differences between them (Hwang and Yoon, 1981). This approach allows for the selection of the best-performing model without the need for aggregation into a single composite score.
Combining both the Friedman test and TOPSIS allows for statistically grounded, robust, and interpretable model selection. The former ensures that differences are not due to randomness, while the latter facilitates holistic evaluation across all performance aspects.
The proposed methodology integrates advanced data preparation techniques, including cleaning, augmentation, and feature scaling, with tailored optimization strategies adapted to each model type. Deep learning models (TabNet, TabTransformer, and MLP) are fine-tuned using grid search, while machine learning models (CatBoost and AdaBoost) benefit from swarm optimization to efficiently explore large hyperparameter spaces. Finally, model evaluation is conducted using a comprehensive set of metrics to ensure robust and interpretable groundwater potential classification.
Results
Groundwater conditioning factors
The spatial distribution of the selected groundwater conditioning factors is illustrated in Figures 6–8. These factors, derived from remote sensing and geospatial datasets, were carefully selected based on their relevance to groundwater recharge dynamics in arid and semi-arid environments. Topographic features such as elevation, slope, curvature, and the TWI influence surface runoff, water accumulation, and infiltration capacity. Soil permeability and geomorphological classes reflect lithological and structural controls that govern the percolation of water through subsurface formations. The Normalized Difference Vegetation Index (NDVI) serves as an ecological proxy for vegetation cover, which is often indicative of groundwater availability in shallow aquifers. Hydrological parameters, including rainfall, lineament density, and stream distance, capture climatic inputs and structural pathways that facilitate recharge. Together, these twelve factors provide a comprehensive representation of the hydro-environmental variability across the Feija Basin and form a robust input set for data-driven groundwater potential modeling.
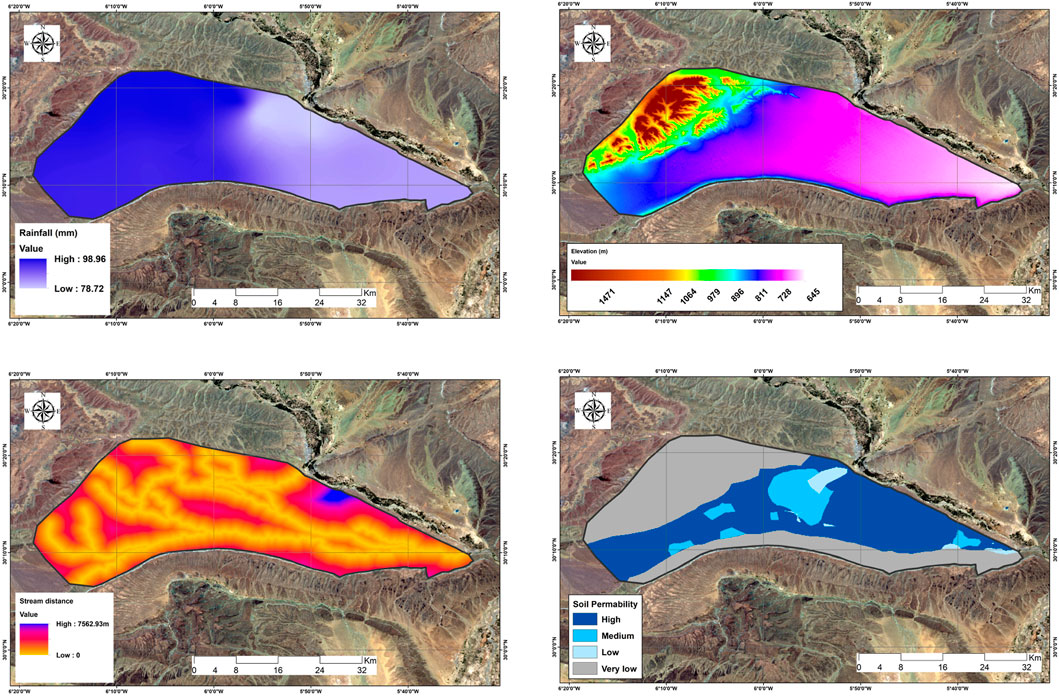
Figure 6. Spatial distribution of four of the ten groundwater conditioning factors used in the study: rainfall, elevation, stream distance, and soil permeability.

Figure 7. Spatial distribution of four of the ten groundwater conditioning factors used in the study: slope, TWI, drainage density, and NDVI.
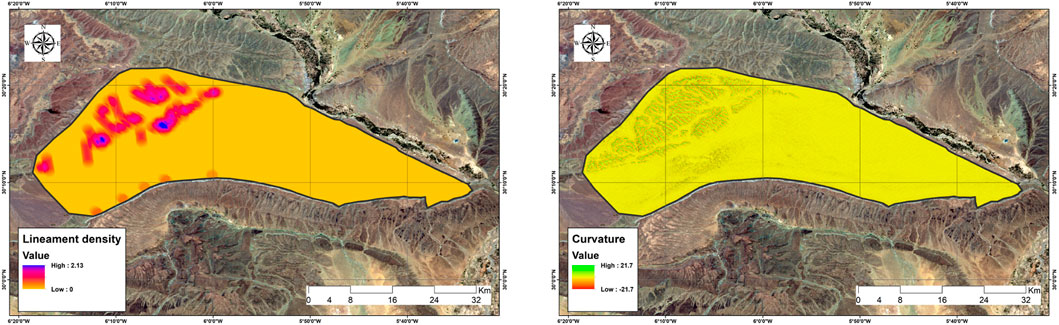
Figure 8. Spatial distribution of two of the ten groundwater conditioning factors used in the study: curvature and lineament density.
Model performance evaluation
All performance results presented in this section are based on the optimal hyperparameter configurations obtained through the tuning procedures outlined in the Methodology section. To ensure a comprehensive evaluation, the classification performance of the five models (TabNet, TabTransformer, MLP, CatBoost, and AdaBoost) was assessed separately on the training and testing datasets. A range of standard evaluation metrics was computed, including accuracy, recall, specificity, precision, F1-score, and Cohen’s kappa. Figure 9 presents radar plots that visualize and compare the performance of each model across these metrics for both phases, providing clear insight into learning effectiveness and generalization capability.
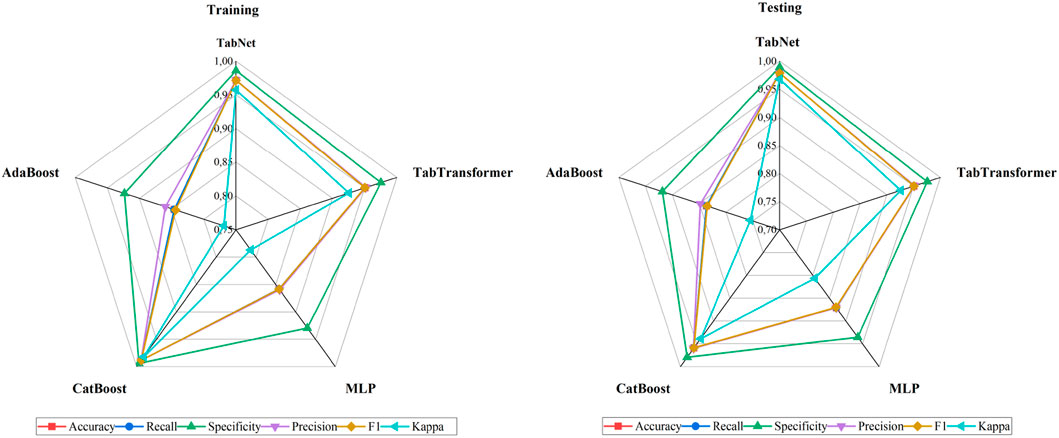
Figure 9. Radar plots of performance metrics for training (left) and testing (right) sets across all models.
Overall, TabNet and TabTransformer exhibited superior and consistent performance, attaining high scores across all evaluation metrics during the testing phase. AdaBoost and CatBoost also demonstrated competitive results, whereas MLP displayed moderate performance, reflecting limited generalization capacity.
Figure 10 presents the confusion matrices for each model on the test dataset. TabNet and TabTransformer achieved the most balanced predictions across the three groundwater potential (GWP) classes, misclassifying only a small number of samples. CatBoost also performed reasonably well but showed minor misclassification between Class 2 and Class 3. MLP and especially AdaBoost displayed noticeable confusion, particularly with Class 2 instances being predicted as Class 3.
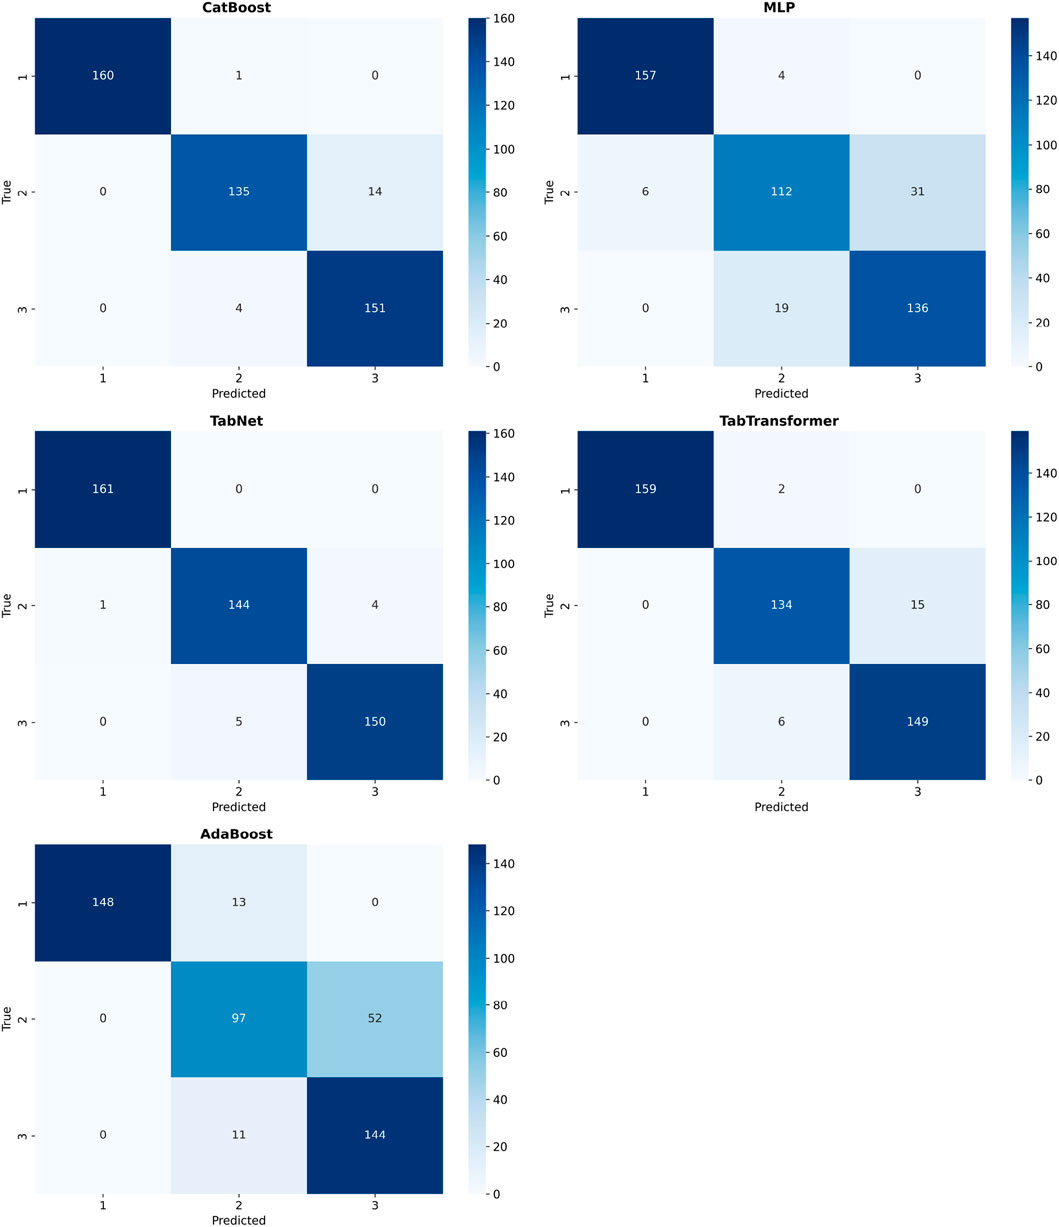
Figure 10. Confusion matrices for each model evaluated on the test set.
Receiver operating characteristic (ROC) analysis
To assess the discriminative power of the classifiers beyond accuracy-based metrics, we conducted a ROC analysis using the micro-average AUC approach, suitable for multi-class classification scenarios. Figure 11 presents the ROC curves for all models on both training and testing datasets.
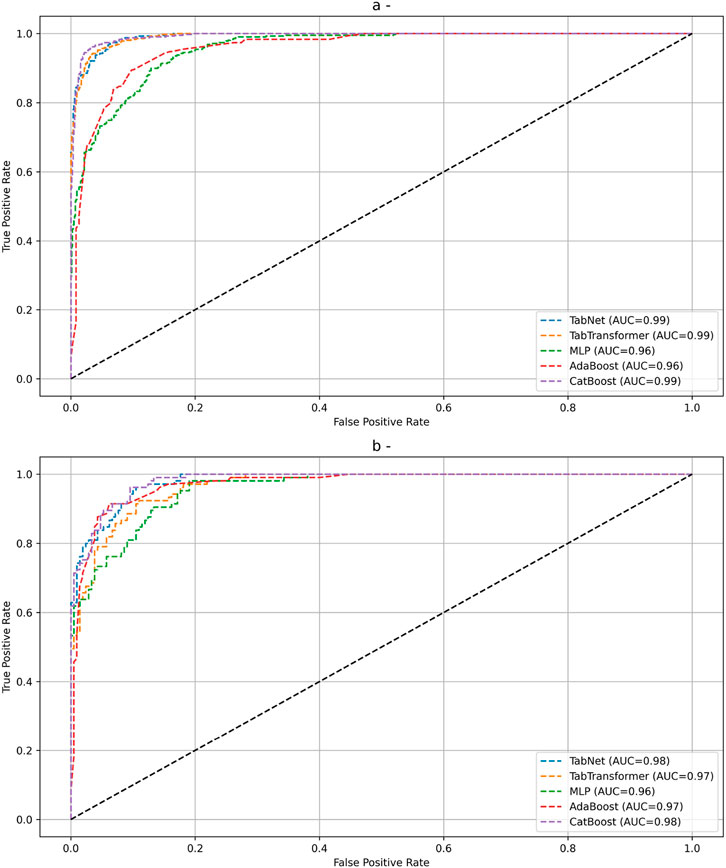
Figure 11. ROC curves (micro-average) for all models on (a) training and (b) testing datasets.
The ensemble-based and DL models (TabNet, TabTransformer, and CatBoost) achieved near-perfect AUC values of 0.99 on both training and testing phases, reflecting excellent separability among the GWP classes. MLP and AdaBoost exhibited slightly lower AUC scores, with values of 0.96 and 0.97 on the test set, respectively. These results corroborate earlier observations from confusion matrices and classification metrics, indicating that TabNet and TabTransformer not only classify accurately but also maintain strong discriminatory performance across all classes.
Feature influence and model sensitivity
The correlation matrix and mutual information analysis (not shown here) provided insights into the relationships and relevance of input features. These analyses highlighted that factors such as elevation, slope, and soil permeability have a strong influence on GWP classification. Feature importance scores obtained from each model (Figure 12) further confirmed these findings, with elevation consistently ranked as the most influential variable.
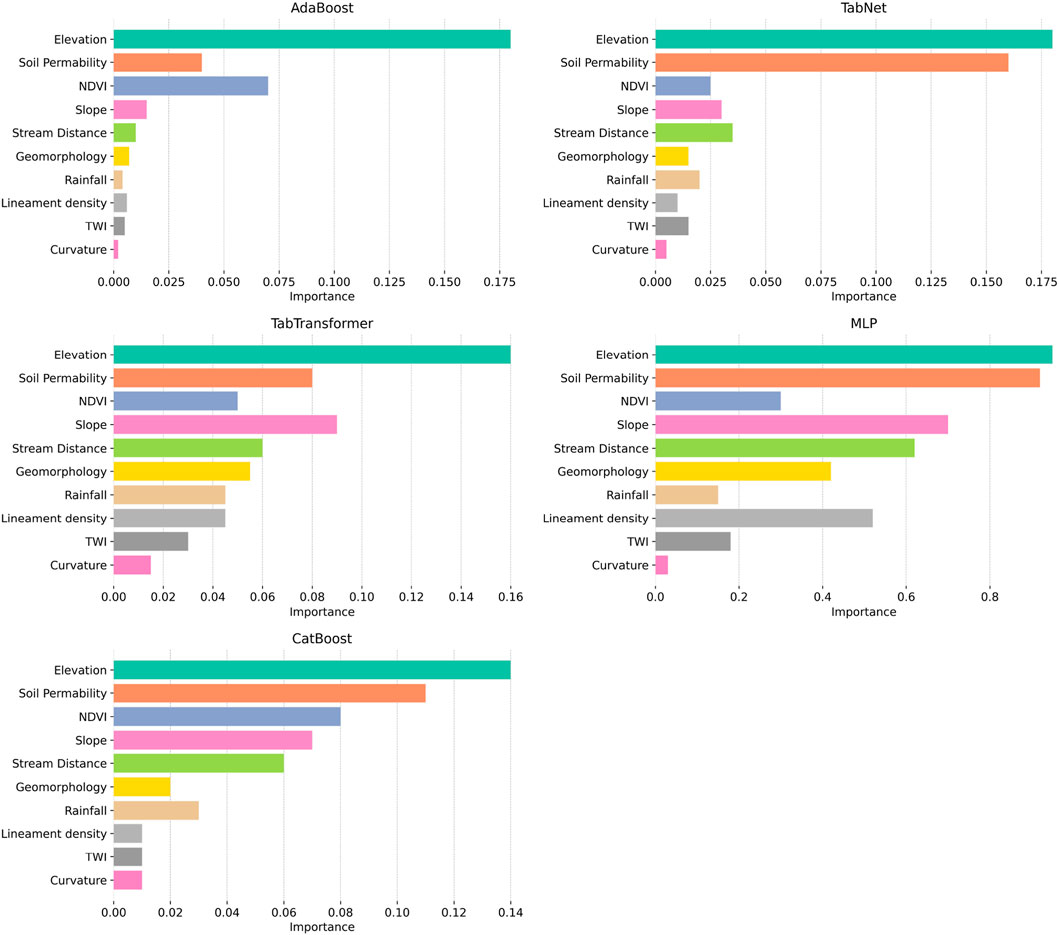
Figure 12. Feature importance scores across all models.
Groundwater class distribution and spatial mapping
The distribution of predicted groundwater classes across models is visualized in Figure 13. Most models exhibited relatively balanced classifications among the three GWP categories. However, AdaBoost disproportionately predicted Class 3 (42.2%), indicating bias toward higher groundwater potential zones.
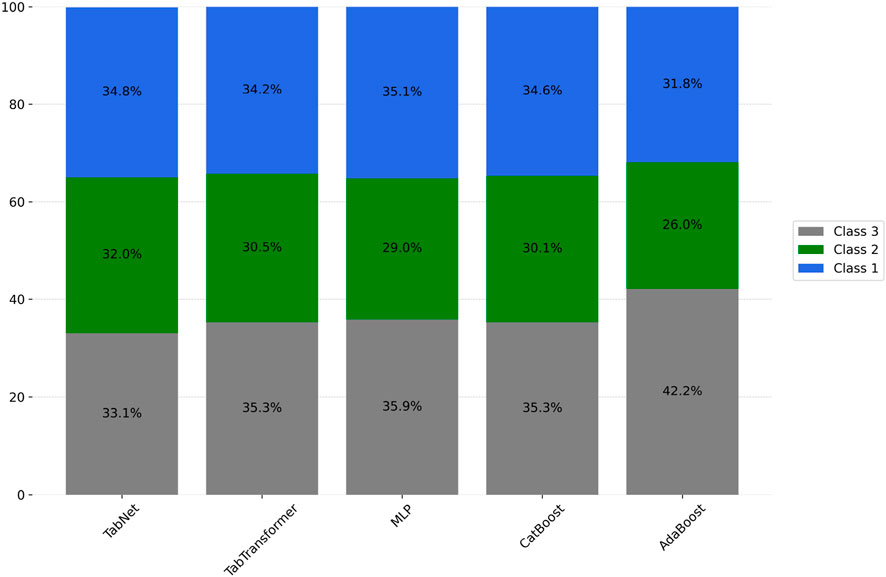
Figure 13. Percentage distribution of groundwater potential classes for each model on the test set.
The spatial predictions generated by each model are presented in Figures 13, 14, 15. Models such as TabNet, TabTransformer, and CatBoost produced coherent and geographically consistent patterns that aligned well with known hydrogeological and topographic features of the study area. These models accurately delineated high-potential groundwater zones typically located in low-lying alluvial plains, valley corridors, and areas characterized by high soil permeability and vegetation density features often associated with groundwater accumulation. The spatial transitions between different GWP classes were smooth and well-localized, reflecting each model’s capacity to learn complex spatial and geophysical relationships from the input data.
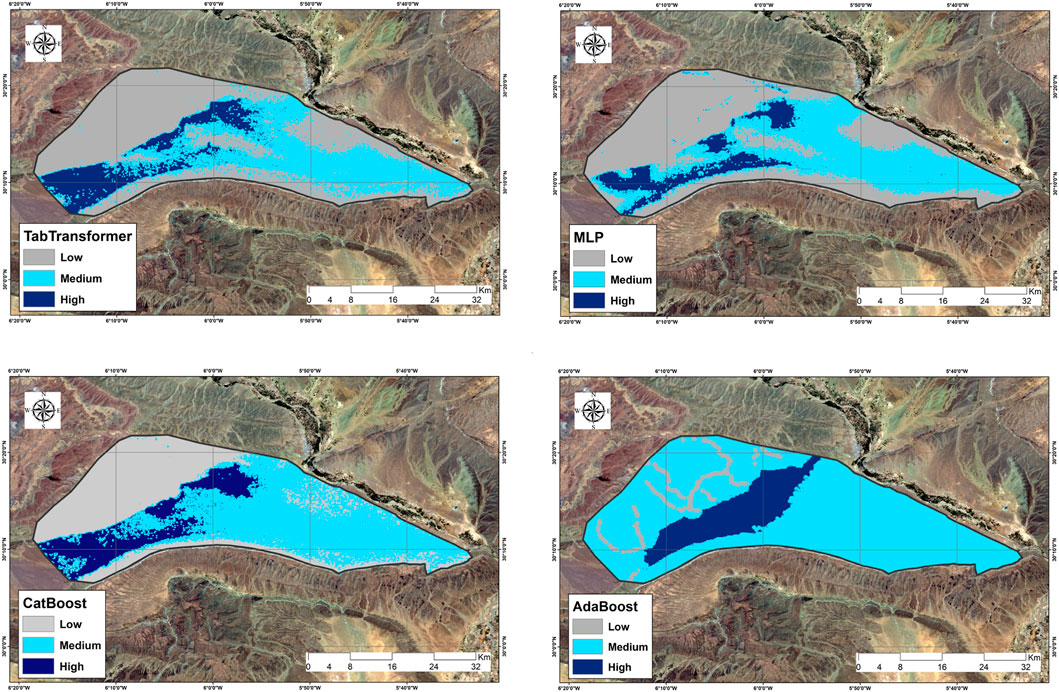
Figure 14. Spatial prediction maps of groundwater potential generated by AdaBoost, CatBoost, MLP, and TabTransformer.
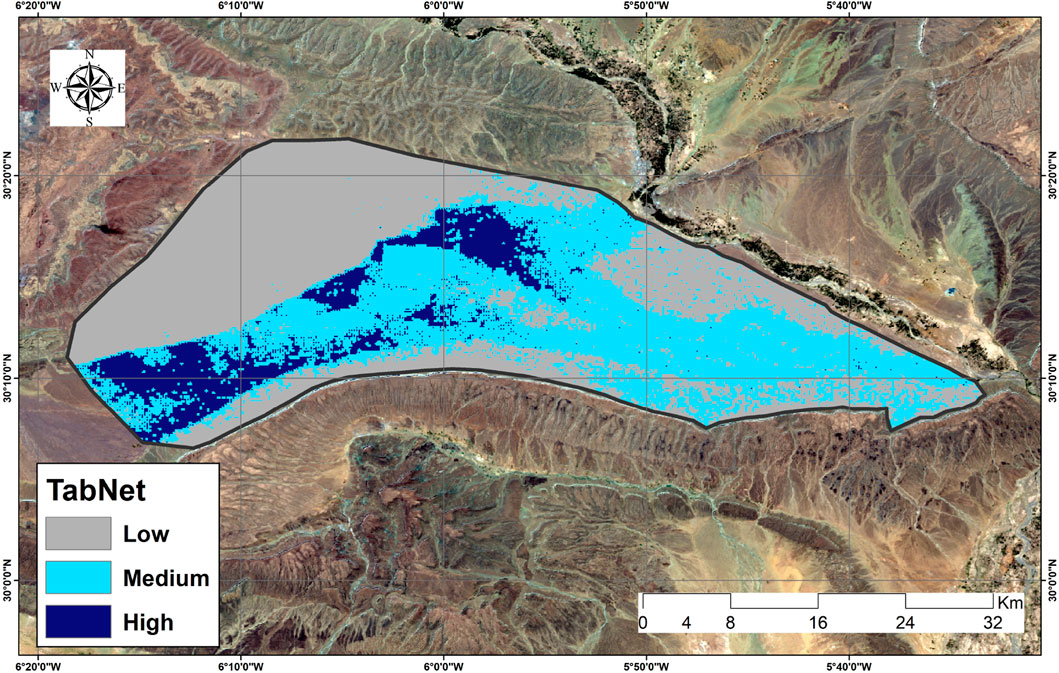
Figure 15. Spatial prediction maps of groundwater potential generated by Tabnet.
From a technical standpoint, these models exhibited stronger generalization capabilities, benefiting from deep representation learning (TabNet), ensemble-based robustness (TabTransformer), and gradient-boosted refinement (CatBoost). In contrast, MLP and AdaBoost produced noisier and more fragmented spatial outputs. These inconsistencies were particularly evident in transition zones, such as the interfaces between moderate and high GWP areas, where these models often failed to capture subtle environmental gradients. AdaBoost tended to overpredict Class 3 (high potential), generating spatial overestimation and reducing practical utility for hydrogeological planning. These results emphasize the necessity of selecting models that are not only accurate in classification metrics but also capable of preserving spatial coherence and geographic relevance in the context of groundwater potential mapping.
Statistical comparison and model ranking
Two robust evaluation methods were applied to provide a statistically grounded comparison of model performance: the Friedman test and the TOPSIS ranking method. The Friedman test (Figure 16, left) showed statistically significant differences among models (
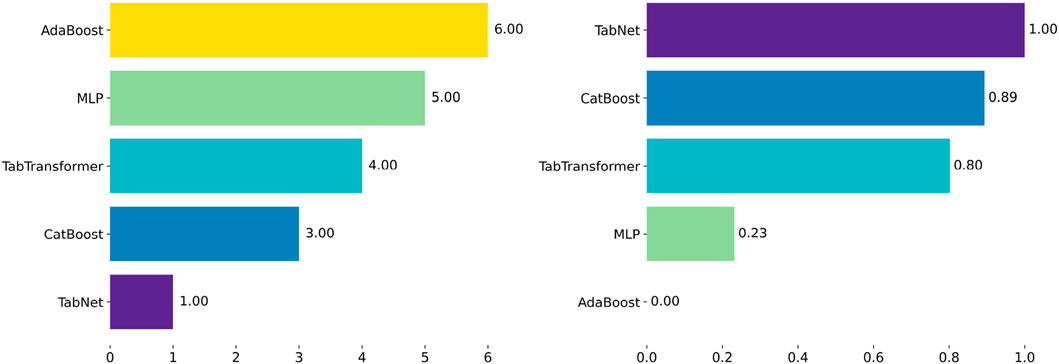
Figure 16. Friedman test average ranking (left) and TOPSIS closeness score (right) for all models.
To complement this analysis, the TOPSIS method was employed to evaluate the closeness of each model to the ideal solution across all metrics. The results (Figure 16, right) aligned with the Friedman rankings. TabNet scored highest (1.0000), indicating optimal performance, followed closely by CatBoost (0.8935) and TabTransformer (0.80). MLP and AdaBoost were assigned significantly lower scores, reinforcing their inferior metric consistency.
The aggregated evaluation from both tests is summarized in Table 5, where models were qualitatively categorized based on their combined scores.
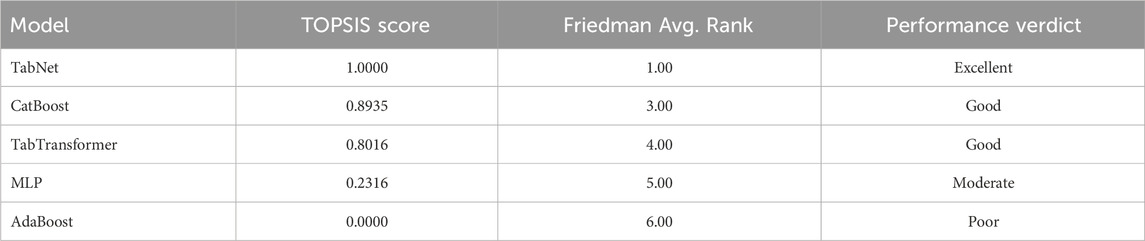
Table 5. Model comparison using TOPSIS score and Friedman test ranking.
Table 5 summarizes the integrated ranking of models based on statistical (Friedman) and multi-criteria (TOPSIS) evaluations. TabNet achieved the best overall performance, while AdaBoost was ranked lowest in both methods.
Discussion
This study systematically evaluated five advanced machine learning and DL models, TabNet, TabTransformer, MLP, CatBoost, and AdaBoost, for predicting groundwater potential zones in the Feija Basin. Among these, TabNet demonstrated superior predictive capabilities. Specifically, it achieved a test accuracy of 97.8%, a recall of 97.8%, and a kappa coefficient of 0.97. TabNet’s sparse attention mechanism enabled selective prioritization of relevant features from heterogeneous tabular datasets, thereby enhancing both interpretability and performance (Arik and Pfister, 2021; Shah et al., 2022).
The methodological framework was comprehensive and data-driven. A structured dataset was constructed using field sampling and remote sensing-derived features and was subjected to rigorous preprocessing and stratification. Feature relevance and independence were ensured using both linear (Pearson correlation) and nonlinear (mutual information) techniques. DL models were fine-tuned via grid search, while classical models were optimized using PSO. This dual optimization strategy mitigated overfitting while preserving computational efficiency (Wu et al., 2025).
TabNet’s strong performance underscores the promise of tabular DL architectures in environmental modeling (Li et al., 2025). Compared to MLP, which lacks embedded attention and feature selection capabilities, TabNet effectively captured complex interactions within structured environmental data. While TabTransformer and CatBoost also performed well, their outputs lacked the spatial consistency observed in TabNet.
In terms of interpretability, this study also provides insights into both global and local model behavior. Globally, feature importance scores and mutual information analysis revealed that elevation, slope, and soil permeability were consistently influential across all models. At the local level, models such as TabNet and TabTransformer demonstrated stable and context-aware predictions in transition zones between moderate and high groundwater potential areas. These models were able to respond adaptively to subtle variations in input features, resulting in smoother spatial transitions. This highlights their suitability not only for overall prediction accuracy but also for context-specific decision-making in spatially heterogeneous environments.
Previous groundwater studies in the Feija region, such as those by Moumane et al. (2024), primarily employed GIS-based and multi-criteria decision analysis (MCDA) approaches. While effective for integrating thematic layers and expert judgment, these methods generally lack the dynamic learning capacity and predictive accuracy of data-driven models. Additionally, they are inherently static and less responsive to evolving climatic or land use conditions.
This study represents a methodological advance by integrating tabular deep learning with rigorous model evaluation. To date, few studies have simultaneously combined spatial validation and holistic evaluation frameworks (e.g., Friedman and TOPSIS) in a hydrogeologically vulnerable, data-scarce environment like the Feija Basin.
Beyond its methodological contributions, this work addresses a critical issue in the Feija Basin: the sustainable management of rainwater and groundwater resources. By accurately identifying recharge-prone zones, the models offer actionable tools for policymakers and engineers to optimize the allocation and capture of scarce hydrological inputs. Targeting these high-potential zones for the implementation of artificial recharge basins, percolation tanks, subsurface dams, or rainwater harvesting ponds would allow for the strategic retention of stormwater that would otherwise be lost through runoff or deep infiltration. Even partial capture could substantially augment aquifer recharge (Kebede et al., 2024), particularly in geomorphological zones with favorable permeability characteristics.
From an economic standpoint, improved groundwater recharge would increase irrigation reliability for high-value crops such as watermelon, reduce dependence on costly deep-well pumping, and safeguard yields during drought periods. Additionally, increased groundwater availability would alleviate pressure on potable water systems in rural communities (Gebreslassie et al., 2025), contributing to economic resilience. This strategy also helps mitigate land degradation, supports ecosystem services, and contributes to the long-term hydrological balance of the basin (Howard et al., 2023; Woldearegay et al., 2024). Moreover, the modeling approach enhances institutional capacity by delivering a replicable and interpretable framework that can inform similar groundwater planning efforts across other arid, semi-arid, and drought-prone regions.
Despite its contributions, this study has a few limitations. First, the sparse availability of in situ monitoring wells constrains the capacity for comprehensive validation. Second, class imbalance within the training dataset may have impacted model stability, particularly for MLP and AdaBoost.
Conclusion
This study presents a robust GeoAI-based framework for groundwater recharge zone mapping in the Feija Basin, a climate-vulnerable and agriculturally stressed region in southeastern Morocco. By integrating multi-source geospatial data with advanced ML and DL algorithms, the framework achieved high predictive accuracy and spatial consistency. Among the five evaluated models, TabNet exhibited superior performance, accurately delineating recharge-prone zones that closely aligned with known hydrogeological features. The methodology incorporated in situ borehole validation, feature importance analysis, and comprehensive evaluation metrics (e.g., accuracy, AUC-ROC, and Cohen’s kappa), confirming both the reliability and interpretability of the modeling outputs. The results particularly highlight the strength of tabular DL models, especially TabNet, in capturing complex environmental interactions within structured datasets. The resulting high-resolution recharge potential maps provide actionable insights for groundwater managers and decision-makers, supporting the strategic planning of artificial recharge structures, rainwater harvesting systems, and sustainable land use practices. These tools are especially timely in light of the unusually high rainfall recorded during the 2024–2025 hydrological year, offering a critical opportunity to increase aquifer replenishment and improve long-term water resilience.
Looking ahead, future work should incorporate temporal groundwater monitoring, including piezometric time series, to enable dynamic and predictive modeling. The inclusion of socio-economic factors, land use changes, and climate change projections would further improve model realism and policy relevance. Moreover, hybridizing data-driven models with physically based hydrological simulations may enhance interpretability and facilitate scenario-based planning. Collaborating with local stakeholders such as farmers, water authorities, and development agencies will be key to translating technical insights into practical, adaptive groundwater governance. Ultimately, this study contributes to the growing body of evidence supporting the integration of artificial intelligence in groundwater resource assessment, particularly in arid and data-scarce environments.
Data availability statement
Publicly available datasets were analyzed in this study. These data can be found here: NA.
Author contributions
AE: Writing – original draft, Data curation, Conceptualization, Writing – review and editing. AM: Writing – review and editing, Writing – original draft, Data curation, Conceptualization. AZ: Writing – original draft, Writing – review and editing, Visualization, Methodology. AS: Writing – review and editing, Writing – original draft, Methodology, Visualization. JK: Formal Analysis, Investigation, Writing – review and editing, Writing – original draft. MB: Writing – review and editing, Investigation, Writing – original draft, Formal Analysis. SB: Writing – review and editing, Investigation, Supervision, Writing – original draft. TT: Writing – original draft, Formal Analysis, Investigation, Writing – review and editing. NE: Writing – review and editing, Writing – original draft, Supervision, Investigation.
Funding
The author(s) declare that no financial support was received for the research and/or publication of this article.
Acknowledgments
The authors would like to express their sincere gratitude to all contributors who supported the development of this research. Special thanks are extended to the Faculty of Sciences and the Faculty of Humanities and Social Sciences at Ibn Tofail University for providing technical resources and academic guidance. The authors also thank the Marwadi University Research Centre for its valuable methodological input, particularly in the domain of artificial intelligence.
Conflict of interest
The authors declare that the research was conducted in the absence of any commercial or financial relationships that could be construed as a potential conflict of interest.
Generative AI statement
The author(s) declare that no Generative AI was used in the creation of this manuscript.
Publisher’s note
All claims expressed in this article are solely those of the authors and do not necessarily represent those of their affiliated organizations, or those of the publisher, the editors and the reviewers. Any product that may be evaluated in this article, or claim that may be made by its manufacturer, is not guaranteed or endorsed by the publisher.
Abbreviations
AI, artificial intelligence; ANN, artificial neural network; AUC-ROC, area under the receiver operating characteristic curve; CHIRPS, Climate Hazards Group InfraRed Precipitation with Station Data; DEM, digital elevation model; DL, deep learning; FAO, Food and Agriculture Organization; GeoAI, geospatial artificial intelligence; GIS, geographic information system; GWP, groundwater potential; kappa, Cohen’s kappa coefficient; LULC, land use/land cover; MCDA, multi-criteria decision analysis; MDV, Middle Drâa Valley; ML, machine learning; MLP, multilayer perceptron; MODIS, Moderate Resolution Imaging Spectroradiometer; NASA POWER, Prediction of Worldwide Energy Resources (NASA); NDVI, Normalized Difference Vegetation Index; PSO, particle swarm optimization; RF, random forest; SVM, support vector machine; TOPSIS, Technique for Order Preference by Similarity to Ideal Solution; TWI, topographic wetness index; USGS, United States Geological Survey.
References
Ajayakumar, A., and Reghunath, R. (2025). Delineation of groundwater recharge zones in lateritic terrains using geospatial techniques. Discov. Geosci. 3, 6. doi:10.1007/s44288-025-00110-z
Al Atawneh, D., Cartwright, N., Doble, R., Janardhanan, S., and Bertone, E. (2024). “Predicting groundwater net recharge using machine learning models”. doi:10.2139/ssrn.4848392
Amiha, R., Kabbachi, B., Ait Haddou, M., Hamma, K., Bouchriti, Y., and Gougueni, H. (2024). Climate vulnerability and adaptation strategies in the Zagora oasis, southern Morocco: a time series analysis and projection to 2050. Theor. Appl. Climatol. 155, 9767–9781. doi:10.1007/s00704-024-05213-0
Aoubouazza, M., and Elmeknassi, Y. E. (1996). “Hydrologie Et Hydrogéologie Du Bassin de La Feija de Zagora (Province de Ouarzazate),” in Maroc: étude sur la lutte contre la désertification dans la vallée moyenne de l’Oued Drâa.
Arik, S. Ö., and Pfister, T. (2021). TabNet: attentive interpretable Tabular learning. Proc. AAAI Conf. Artif. Intell. 35, 6679–6687. doi:10.1609/aaai.v35i8.16826
Atenidegbe, O. F., and Mogaji, K. A. (2023). Modeling assessment of groundwater vulnerability to contamination risk in a typical basement terrain using TOPSIS-Entropy developed vulnerability data mining technique. Heliyon 9 (7), e18371. doi:10.1016/j.heliyon.2023.e18371
Bassin Hydraulique de Souss Massa et de Draa, ABHSMD Agence du (2014). “Etude Hydrologique de La Nappe de La Feija.” Morocco: Agence du Bassin Hydraulique de Souss Massa et de Draa.
Bergstra, J., and Bengio, Y. (2012). Random search for hyper-parameter optimization. J. Mach. Learn. Res. 13, 281–305. JMLR.
Bezekci, B. (2025). Deep learning-enhanced regularization of irregular traveling pulses in the FitzHugh-Nagumo model. SN Comput. Sci. 6, 206. doi:10.1007/s42979-025-03752-5
Bezekçi, B. (2025). The refined physics-informed neural networks for nonlinear convection-reaction-diffusion equations using exponential schemes. Black Sea J. Eng. Sci. 8, 7–8. doi:10.34248/bsengineering.1645207
Bezekci, B., and Kuru, G. (2025). Deep learning-based approach for modeling threshold curves. Alexandria Eng. J. 129, 40–52. doi:10.1016/j.aej.2025.05.072
Biazar, S. M., Golmohammadi, G., Nedhunuri, R. R., Shaghaghi, S., and Mohammadi, K. (2025). Artificial intelligence in hydrology: advancements in soil, water resource management, and sustainable development. Sustainability 17 (5), 2250. doi:10.3390/su17052250
Borzì, I. (2025). Modeling groundwater resources in data-scarce regions for sustainable management: methodologies and limits. Hydrology 12 (1), 11. doi:10.3390/hydrology12010011
Bossenbroek, L., Ftouhi, H., Kadiri, Z., and Kuper, M. (2023). Watermelons in the desert in Morocco: struggles around a groundwater commons-in-the-making. Water Altern. 16 (February), 87–107.
Chicco, D., and Jurman, G. (2020). The advantages of the Matthews Correlation Coefficient (MCC) over F1 Score and accuracy in binary classification evaluation. BMC Genomics 21 (1), 6. doi:10.1186/s12864-019-6413-7
Davis, J., and Goadrich, M. (2006). “The relationship between precision-recall and ROC curves,” in Proceedings of the 23rd international conference on machine learning (ICML), 233–240. doi:10.1145/1143844.1143874
Demšar, J. (2006). Statistical comparisons of classifiers over multiple data sets. J. Mach. Learn. Res. 7 (Jan), 1–30.
Dorogush, A. V., Ershov, V., and Gulin, A. (2018). “CatBoost: gradient boosting with categorical features support,” in Proceedings of the workshop on ML systems at NeurIPS. doi:10.48550/arXiv.1810.11363
Egbejule, E. (2024). Dramatic images show the first floods in the sahara in half a century. Guard. Available online at: https://www.theguardian.com/environment/2024/oct/11/dramatic-images-show-the-first-floods-in-the-sahara-in-half-a-century.
Elmotawakkil, A., and Enneya, N. (2025). “Boosting artificial intelligence performance in Sentinel-2 imagery analysis: a DL approach for water bodies detection,” in Remote sensing and GIS techniques in hydrology. Editors M. Batchi,, and A. Moumane (Hershey, PA: IGI Global), 133–152. doi:10.4018/979-8-3693-9651-3.ch005
Elmotawakkil, A., Sadiki, A., and Enneya, N. (2024). Predicting groundwater level based on remote sensing and machine learning: a case study in the Rabat-Kénitra region. J. Hydroinformatics 26 (10), 2639–2667. doi:10.2166/hydro.2024.494
Fico, J. (2022). Watering the desert, draining the oasis: navigating drought, development, and irrigation politics in the draa Valley, Morocco. Master's thesis. Syracuse: Syracuse University. Available online at: https://surface.syr.edu/thesis/693/.
Fico, J. (2024). Frontiers of fortune: mobilising land, water, and collective identity for watermelon production in Southeastern Morocco. J. North Afr. Stud. Sept., 1–24. doi:10.1080/13629387.2024.2404952
Fico, J., and Kenti, A. (2023). Living on luck: the story behind Zagora’s watermelons. Heinrich Böll Stift. Rabat Maroc. Available online at: https://ma.boell.org/fr/node/1283.
Freshplaza (2025). A storm hits Zagora and destroys watermelon plantations. Available online at: https://www.freshplaza.com/north-america/article/9728581/a-storm-hits-zagora-and-destroys-watermelon-plantations/.
Gebreslassie, H., Berhane, G., Gebreyohannes, T., Hagos, M., Hussien, A., and Walraevens, K. (2025). Water harvesting and groundwater recharge: a comprehensive review and synthesis of Current practices. Water 17, 976. doi:10.3390/w17070976
Goodfellow, I., Bengio, Y., and Courville, A. (2016). Deep learning. MIT Press. Available online at: https://www.deeplearningbook.org/.
Hosseini, F. S., Jafari, A., Zandi, I., Alesheikh, A. A., and Rezaie, F. (2025). Groundwater potential mapping using optimized decision tree-based ensemble learning model with local and global explainability. Water 17 (10), 1520. doi:10.3390/w17101520
Howard, J. K., Dooley, K., Brauman, K. A., Klausmeyer, K. R., and Rohde, M. M. (2023). Ecosystem services produced by groundwater dependent ecosystems: a framework and case Study in California. Front. Water 5, 1115416. doi:10.3389/frwa.2023.1115416
Huang, X., Khetan, A., Cvitkovic, M., and Karnin, Z. (2021). TabTransformer: tabular data modeling using contextual embeddings. Proc. AAAI Conf. Artif. Intell. 35, 5669–76.
Hwang, C. L., and Yoon, K. (1981). Multiple attribute decision making: methods and applications. Springer-Verlag.
Igwebuike, N., Ajayi, M., Okolie, C., Kanyerere, T., and Todd, H. (2024). Application of machine learning and deep learning for predicting groundwater levels in the West Coast Aquifer System, South Africa. Earth Sci. Inf. 18 (1), 6. doi:10.1007/s12145-024-01623-w
Jari, A., Bachaoui, E. M., Hajaj, S., Khaddari, A., Khandouch, Y., El Harti, A., et al. (2023). Investigating machine learning and ensemble learning models in groundwater potential mapping in arid Region: case Study from Tan-Tan water-scarce Region, Morocco. Front. Water 5, 1305998. doi:10.3389/frwa.2023.1305998
Jasechko, S., Seybold, H., Perrone, D., Fan, Y., Shamsudduha, M., Taylor, R. G., et al. (2024). Rapid groundwater decline and some cases of recovery in aquifers globally. Nature 625 (7996), 715–721. doi:10.1038/s41586-023-06879-8
Kaewdum, N., and Chotpantarat, S. (2021). Mapping potential zones for groundwater recharge using a GIS technique in the lower khwae hanuman sub-basin area, prachin Buri Province, Thailand. Front. Earth Sci. 9, 717313. doi:10.3389/feart.2021.717313
Karmaoui, A., and Adil, M. (2016). Changes in the environmental vulnerability of Oasean System (Desert oasis), pilot Study in middle draa Valley, Morocco. Expert Opin. Environ. Biol. 5 (January). doi:10.4172/2325-9655.1000135
Kebede, M. M., Kumar, M., Mekonnen, M. M., and Clement, T. P. (2024). Enhancing groundwater recharge through nature-based solutions: benefits and barriers. Hydrology 11, 195. doi:10.3390/hydrology11110195
Kennedy, J., and Russell, E. (1995). “Particle swarm optimization,”Proc. ICNN’95 - Int. Conf. Neural Netw, 4, 1942–1948. doi:10.1109/ICNN.1995.488968
Kheddar, H., Hemis, M., and Himeur, Y. (2024). Automatic speech recognition using advanced Deep Learning Approaches: a Survey. Inf. Fusion 109, 102422. doi:10.1016/j.inffus.2024.102422
Klose, S. (2013). Regional hydrogeology and groundwater budget modeling in the arid middle draa catchment (South-Morocco). Bonn, Germany: Universitäts- und Landesbibliothek Bonn. Available online at: https://bonndoc.ulb.uni-bonn.de/xmlui/handle/20.500.11811/5752.
Kumar, A., and Singh, S. (2022). Performance evaluation metrics for machine learning classification models: a comparative analysis. Int. J. Sci. Res. Comput. Sci. 10 (1).
Lamqadem, A., Pradhan, B., and Pradhan, B. (2019). “Long-term monitoring of transformation from pastoral to agricultural land use using time-series landsat data in the feija Basin Southeast Morocco.” Earth Syst. Environ. 3. 3, 525, 538. doi:10.1007/s41748-019-00110-3
Li, X., Zhou, Y., Li, Y., Wang, S., Bian, W., and Sun, H. (2025). HSDT-TabNet: a dual-path deep learning model for severity grading of soybean frogeye leaf spot. Agronomy 15, 1530. doi:10.3390/agronomy15071530
Liu, B., Sun, Y., and Gao, L. (2024). Enhancing groundwater recharge prediction: a feature selection-based Deep Forest model with bayesian optimisation. Hydrol. Process. 38, e15309. doi:10.1002/hyp.15309
Maity, R., Srivastava, A., Sarkar, S., and Khan, M. I. (2024). “Revolutionizing the future of hydrological science: impact of machine learning and deep learning amidst emerging explainable AI and transfer learning.” Appl. Comput. Geosciences 24: 100206. doi:10.1016/j.acags.2024.100206
Mathewos, Y., Abate, B., Dadi, M., and Mathewos, M. (2024). Evaluation of the groundwater prospective Zone by coupling hydro-meteorological and geospatial evidence in Wabe River catchment omo Gibe River Basin, Ethiopia. Water Cycle 5, 37–58. doi:10.1016/j.watcyc.2024.01.002
McHugh, M. L. (2012). Interrater reliability: the Kappa statistic. Biochem. Medica 22 (3), 276–282. doi:10.11613/bm.2012.031
Meng, F., Khan, M. I., Naqvi, S. A. A., Sarwar, A., Islam, F., Ali, M., et al. (2024). Identification and mapping of groundwater recharge zones using multi influencing factor and analytical hierarchy process. Sci. Rep. 14, 19240. doi:10.1038/s41598-024-70324-7
Mezali, F., Chetibi, M., Naima, K., Derdour, A., Benmamar, S., Almohamad, H., et al. (2025). Enhancing groundwater recharge assessment in mediterranean regions: a comparative Study using analytical hierarchy process and fuzzy analytical hierarchy process integrated with geographic information systems for the algiers watershed. Sustainability 17, 3242. doi:10.3390/su17073242
Moumane, A., El Ghazali, F. E., Jamal, Al K., Delorme, J., Batchi, M., Chafiki, D., et al. (2021). Monitoring spatiotemporal variation of groundwater level and salinity under land use change using integrated field measurements, GIS, geostatistical, and remote-sensing approach: case Study of the feija aquifer, middle draa watershed, Moroccan Sahara. Environ. Monit. Assess. 193 (December), 769. doi:10.1007/s10661-021-09581-2
Moumane, A., Enajar, A., El Ghazali, F. E., Khouz, A., Ahmed, K., Jamal, Al K., et al. (2024). GIS, remote sensing, and analytical hierarchy Process (AHP) approach for rainwater harvesting site selection in arid regions: feija Plain case Study, Zagora (Morocco). Appl. Geomatics 16 (September), 861–880. doi:10.1007/s12518-024-00585-4
Moumane, A., Bahouq, T., Ahmed, K., Laghfiri, D., Mohamed, Y., Karkouri, J., et al. (2025). Lake iriqui’s remarkable revival: field observations and a Google Earth engine analysis of its recovery after over half a century of desiccation. Land 14 (1), 104. doi:10.3390/land14010104
NASA Earth Observatory (2024). A deluge for the Sahara. Available online at: https://earthobservatory.nasa.gov/images/153320/a-deluge-for-the-sahara.
Nugroho, J. T., Indah Lestari, A., Gustiandi, B., Sofan, P., Suwarsono, I. P., Rahmi, K. I. N., et al. (2024). “Groundwater potential mapping using machine learning approach in West Java, Indonesia.” Groundw. Sustain. Dev. 27: 101382. doi:10.1016/j.gsd.2024.101382
Patel, D. K., Thakur, T. K., Thakur, A., Karuppannan, S., Swamy, S. L., and Pant, R. R. (2024). Groundwater potential Zone mapping using AHP and geospatial techniques in the upper Narmada Basin, central India. Discov. Sustain. 5, 355. doi:10.1007/s43621-024-00560-4
Ragragui, H., Aouragh, M., El-Hmaidi, A., Ouali, L., Saouita, J., Iallamen, Z., et al. (2024). “Mapping and modeling groundwater potential using machine learning, deep learning and ensemble learning models in the saiss Basin (Fez-Meknes Region, Morocco).” Groundw. Sustain. Dev. 26: 101281. doi:10.1016/j.gsd.2024.101281
Rieder, J. C., Aemisegger, F., Dente, E., and Armon, M. (2025). Meteorological ingredients of heavy precipitation and subsequent lake-filling episodes in the northwestern Sahara. Hydrology Earth Syst. Sci. 29, 1395–1427. doi:10.5194/hess-29-1395-2025
Roy, D. K., Kumar Sarkar, T., Hossain Munmun, T., Paul, C. R., and Datta, B. (2025). A review on the applications of machine learning and deep learning to groundwater salinity modeling: present status, challenges, and future directions. Discov. Water 5, 16. doi:10.1007/s43832-025-00207-z
Sander, P. (2007). Lineaments in groundwater exploration: a review of applications and limitations. Hydrogeology J. 15, 71–74. doi:10.1007/s10040-006-0138-9
Sarkar, S. K., Rudra, R. R., Talukdar, S., Chandra Das, P., Sadmin Nur, Md., Alam, E., et al. (2024). Future groundwater potential mapping using machine learning algorithms and climate change scenarios in Bangladesh. Sci. Rep. 14 (1), 10328. doi:10.1038/s41598-024-60560-2
Schapire, R. E. (1999). “A brief introduction to boosting,” in International joint conference on artificial intelligence (IJCAI), 1401–1406.
Schulz, O., and Manfred, J. (2013). “IMPETUS Atlas Morocco (digital versions in English and French),”Unknown Editors O. Schulz,, and M. Judex, doi:10.1594/PANGAEA.821918
Sedghi, M. M., and Zhan, H. (2023). Groundwater mounding due to recharge from ephemeral streams. Adv. Water Resour. 174, 104421. doi:10.1016/j.advwatres.2023.104421
Shah, C., Du, Q., and Xu, Y. (2022). Enhanced TabNet: attentive interpretable tabular learning for hyperspectral image classification. Remote Sens. 14, 716. doi:10.3390/rs14030716
Silva-Novoa Sánchez, L. M. (2024). Water governance challenges in the middle drâa Valley of Morocco: analysing policies, practices and conflict. Doctoral dissertation. Rheinland-Pfälzische Technische Universität Kaiserslautern-Landau.
Silva-Novoa Sánchez, L. M., Schilling, J., Bossenbroek, L., Ezzayyat, R., and Berger, E. (2025). Drivers of conflict over customary land in the Middle Drâa Valley of Morocco. World Dev. 188, 106872. doi:10.1016/j.worlddev.2024.106872
Sokolova, M., and Lapalme, G. (2009). A systematic analysis of performance measures for classification tasks. Inf. Process. and Manag. 45 (4), 427–437. doi:10.1016/j.ipm.2009.03.002
Tabassum, A., Sajjad, A., Sajid, G. H., Ahmad, M., Iqbal, M., and Khan, A. H. A. (2025). Assessing recharge zones for groundwater potential in Dera Ismail Khan (Pakistan): a GIS-Based analytical hierarchy process approach. Water 17, 1586. doi:10.3390/w17111586
Tripathy, K. P., and Mishra, A. K. (2024). Deep learning in hydrology and water resources disciplines: concepts, methods, applications, and research directions. J. Hydrology 628, 130458. doi:10.1016/j.jhydrol.2023.130458
Vyas, S., and Bertsimas, D. (2024). Deep learning with tabular data: a self-supervised approach. arXiv. doi:10.48550/arXiv.2401.15238
Woldearegay, K., Grum, B., Hessel, R., Van Steenbergen, F., Fleskens, L., Yazew, E., et al. (2024). Watershed management, groundwater recharge and drought resilience: an integrated approach to adapt to rainfall variability in Northern Ethiopia. Int. Soil Water Conservation Res. 12, 663–683. doi:10.1016/j.iswcr.2023.08.009
Wu, H., Liu, R., Lu, C., Sun, Q., Wu, C., Yan, L., et al. (2025). Predicting groundwater level dynamics and evaluating the impact of the south-to-north water diversion Project using stacking ensemble learning. Sustainability 17, 6120. doi:10.3390/su17136120
Keywords: machine learning, groundwater research, arid region, TabNet, Morocco
Citation: Elmotawakkil A, Moumane A, Zahi A, Sadiki A, Karkouri JA, Batchi M, Bhagat SK, Tiyasha T and Enneya N (2025) Artificial intelligence for groundwater recharge prediction in an arid region: application of tabular deep learning models in the Feija Basin, Morocco. Front. Remote Sens. 6:1622360. doi: 10.3389/frsen.2025.1622360
Received: 03 May 2025; Accepted: 29 July 2025;
Published: 03 September 2025.
Edited by:
Romulus Costache, National Institute of Hydrology and Water Management, RomaniaReviewed by:
Salim Heddam, University of Skikda, AlgeriaBurhan Bezekci, Kilis 7 Aralık University, Türkiye
Copyright © 2025 Elmotawakkil, Moumane, Zahi, Sadiki, Karkouri, Batchi, Bhagat, Tiyasha and Enneya. This is an open-access article distributed under the terms of the Creative Commons Attribution License (CC BY). The use, distribution or reproduction in other forums is permitted, provided the original author(s) and the copyright owner(s) are credited and that the original publication in this journal is cited, in accordance with accepted academic practice. No use, distribution or reproduction is permitted which does not comply with these terms.
*Correspondence: Suraj Kumar Bhagat, ZHJzdXJhamVudkBnbWFpbC5jb20=