 Orion S. E. Cardenas-Ritzert1
 Shahriar Shah Heydari1
 Daniel T. Rode1
 Steven K. Filippelli1
 Melinda Laituri2Melissa R. McHale3
 Jody C. Vogeler1*
- 1Natural Resource Ecology Laboratory, Colorado State University, Fort Collins, CO, United States
- 2Department of Ecosystem Science and Sustainability, Colorado State University, Fort Collins, CO, United States
- 3Department of Forest Resources Management, University of British Columbia, Vancouver, BC, Canada
Urban green and open spaces (UGOS) provide essential social, cultural, environmental, and economic benefits to a city; therefore, monitoring UGOS is critical for guiding management and strengthening urban resilience. Spatial analysis of Earth Observation data provides a practical means of evaluating UGOS, and with the availability of high and very-high spatial resolution (VHR) satellite imagery (≤10 m), UGOS can be accurately characterized across broad spatial and temporal scales. While VHR satellite imagery (≤3 m) can enable more refined characterizations of land cover (LC), its use may be constrained by high monetary costs, accessibility barriers, and reduced spatial and temporal coverage. This study investigates the implications of utilizing imagery sources of varying spatial resolution (≤10 m) and differing classification approaches—pixel-based versus object-based—on LC characterizations and subsequent UGOS spatial assessments in two urbanizing cities: Mekelle, Ethiopia and Polokwane, South Africa in 2020. LC classifications were derived from Sentinel-2 imagery (10 m), PlanetScope SuperDove imagery (3 m), and Maxar WorldView-3 multispectral (2 m) and pansharpened (0.5 m) imagery. Mapping accuracy and UGOS characteristics were evaluated for each city, including the composition of undeveloped versus developed land, tall vegetation cover, and LC within selected public spaces. Additionally, the share of streets and open space under Sustainable Development Goal Indicator 11.7.1 were assessed. WorldView-3 multispectral (2 m) LC maps consistently achieved the highest overall classification accuracies, at 92% in Mekelle and 86% in Polokwane, suggesting that spatial resolution alone does not guarantee higher mapping accuracy, and that spectral richness is an important characteristic for mapping complex vegetation. Although VHR imagery enhanced the detection of small and fragmented landscape features, such as trees, classification performance depended heavily on context, resolution, method, and image characteristics. Coarser imagery like Sentinel-2 proved to be practical for broader assessments (e.g., SDG 11.7.1) but based on our results, still may underrepresent total undeveloped space and fails to capture fine-scale spatial variation. The results revealed clearer spatial patterns and resolution-dependent trends in Mekelle, while findings in Polokwane were more variable, suggesting that local landscape structure and urban form may influence classification outcomes and UGOS metrics. Overall, this study highlights the importance of carefully selecting and interpreting Earth Observation imagery based on sensor characteristics, spatial and spectral resolution, classification method, acquisition timing, and local landscape context, especially when data options are limited.
1 Introduction
Urban green and open spaces (UGOS) refer to natural vegetated areas and open spaces utilized by urban residents and wildlife, including forests, parks, gardens, playgrounds, streets, and squares (SDG Indicators Metadata repository, 2020). These spaces offer a range of ecological and social benefits: they support biodiversity by providing habitat and food sources, mitigate the negative effects of climate change and urbanization, and promote human wellbeing by improving air quality, reducing heat, and fostering opportunities for recreation and social interaction (Lee and Maheswaran, 2011; Woolley, 2003; Rakhshandehroo et al., 2017; Zhang and Qian, 2024). While UGOS are an integral component of high-quality urban systems (Cilliers, 2015), their effectiveness depends not just on their presence, but on key spatial characteristics such as composition, accessibility, size, shape, and spatial distribution (Egerer et al., 2024). For example, tall vegetation, such as trees, play a critical role in climate regulation and habitat provisioning (Turner-Skoff and Cavender, 2019; Maseko et al., 2019), making them a compositional element that should be prioritized in UGOS planning and management. Strategies to optimize UGOS performance include preserving existing spaces, implementing multi-faceted urban planning approaches, and consistently monitoring UGOS accessibility and function (Haaland and van den Bosch, 2015; Jim, 2013; Chamanara and Kazemeini, 2016; Fan et al., 2017).
However, cities in the Global South, particularly across Africa (Rigolon et al., 2018), often face significant constraints in managing UGOS amid rapid urbanization. In response, the United Nations has undertaken extensive efforts to promote sustainable urban development and improve urban living standards in these rapidly urbanizing regions. In 2015, the United Nations launched the Sustainable Development Goals (SDG) under the 2030 Agenda for Sustainable Development (United Nations Transforming Our World, 2015), with SDG 11 aiming to make cities and human settlements inclusive, safe, resilient, and sustainable (United Nations Transforming Our World, 2015), and Target 11.7 aiming to ensure universal access to adequate public open spaces. To support consistent monitoring, the United Nations introduced SDG Indicator 11.7.1, which geospatially assesses the share and accessibility of public open space in urban areas (Table 1). Research investigating SDG Indicator 11.7.1 and related dimensions of UGOS can offer critical insights to inform the design, planning, and management of green and open spaces in developing urban regions.
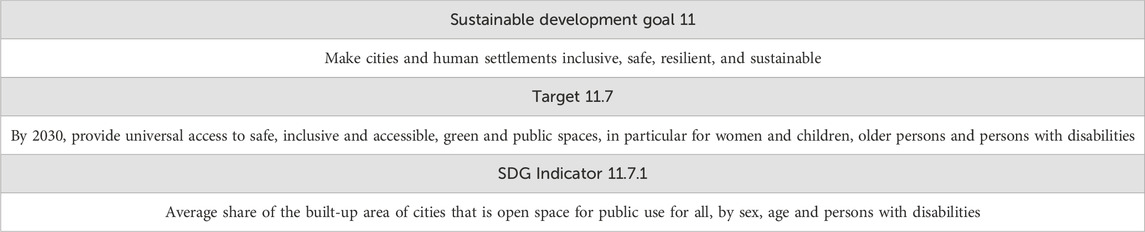
Table 1. Description of sustainable development goal 11, target 11.7and SDG indicator 11.7.1.
Geospatial analysis of satellite data is a widely used and effective approach for evaluating the status of UGOS, including SDG Indicator 11.7.1, particularly in African cities where official monitoring data is limited or absent. One critical aspect of these assessments is the spatial resolution of satellite imagery employed. The emergence of satellite missions such as Sentinel-2, which offers multispectral imagery at 10 m spatial resolution with global coverage, bridges the gap between moderate resolution sensors such as Landsat at 30 m and very-high spatial resolution (VHR) imagery (≤3 m). In this study, we refer to Sentinel-2 imagery (10 m) as “high resolution”, in contrast to moderate (20–30 m) and VHR imagery (≤3 m). The Sentinel-2 mission’s balance of spatial resolution, revisit frequency, open accessibility, and global coverage has made it a favorable source for carrying out pixel-based land cover (LC) classifications and subsequent assessments of UGOS (Ismayilova and Timpf, 2022; Ju et al., 2022; Xiao et al., 2022; Ludwig et al., 2021). Nevertheless, comparative studies have consistently shown that VHR imagery and object-based classification strategies allows for more precise detection of fragmented, informal, and, overall, more heterogeneous landscapes in urban environments (Hu et al., 2024; Momeni et al., 2016). Further research is needed to better understand the capabilities and limitations of high-resolution datasets like Sentinel-2 for accurately mapping and evaluating UGOS in such settings.
This study adds to existing literature comparing UGOS mapping outcomes derived from Earth Observation imagery of varying resolutions (See Section 2). Specifically, it investigates how object and pixel-based LC classifications applied to Sentinel-2 (10 m), PlanetScope SuperDove (3 m), and Maxar WorldView-3 (0.5–2 m) imagery represent UGOS in two rapidly urbanizing cities: Mekelle, Ethiopia, and Polokwane, South Africa. The objectives are to: 1) compare UGOS mapping accuracy across resolution tiers and classification approaches; 2) analyze landscape-level metrics including green space composition, tall vegetation coverage, and open space availability in developed versus undeveloped areas as well as selected public spaces; and 3) evaluate variation in SDG Indicator 11.7.1 and related metrics across imagery sources.
2 Literature review
Recent research underscores that Earth Observation technologies are essential for mapping and monitoring UGOS, though their effectiveness depends on three interrelated factors: the spatial resolution of the imagery, the classification approaches employed, and the urban landscape under analysis. High resolution sensors such as Sentinel-2, with 10 m spatial resolution, 5-day revisit cycle, and global coverage, are widely used for regional-scale vegetation and land cover monitoring (Drusch et al., 2012; Le Saint et al., 2024). However, dense and heterogeneous urban environments often require VHR imagery (≤3 m) from platforms such as Maxar, Pleiades, or PlanetScope to accurately identify small greenery like street trees, fragmented parks, and informal vegetation patches (Georganos et al., 2021; Recanatesi et al., 2025).
The choice of classification method further shapes mapping accuracy. Pixel-based classifiers, such as Random Forest, excel in terms of ease and reproducibility when applied to high-resolution imagery (Belgiu and Drăguţ, 2016; Amani et al., 2020). Though, in complex urban landscapes, they may struggle to accurately discriminate between impervious surfaces and small greenery due to spectral mixing, where individual pixels may contain multiple land cover types (Myint et al., 2024; Weng, 2012). Object-based image analysis (OBIA) addresses this limitation by segmenting images into spatially coherent objects based on shape, texture, and contextual information prior to classification. OBIA has consistently demonstrated higher accuracy in VHR urban applications, as it more effectively captures the complex spatial and contextual patterns characteristic of heterogeneous urban environments (Georganos et al., 2021; Blaschke, 2010). That said, OBIA can introduce under-segmentation errors, requires substantial parameter tuning, and often demands technical expertise and in-depth knowledge of the study area to accurately classify spatial objects, limitations that may hinder its application in capacity-constrained settings (Liu and Xia, 2010; Mudau and Mhangara, 2023).
Studies across Sub-Saharan Africa highlight the need for aligning imagery resolution and methods with the urban landscape being analyzed. For instance, long-term monitoring of Landsat imagery (30 m) in Eldoret, Kenya revealed a steep decline in vegetation cover from approximately 9.7%–2.7% over 25 years (Ro et al., 2022). Similar patterns of green space fragmentation and decline have been documented in rapidly urbanizing cities such as Lagos, Accra, and Kigali, where unplanned settlement growth, limited land-use regulation, and infrastructure pressures have significantly altered urban landscapes (Twumasi et al., 2020; Gilbert and Shi, 2023; Mugiraneza et al., 2020; Puplampu and Boafo, 2021; Nshimiyimana et al., 2023). While some of these studies did not explicitly address spatial resolution limitations, their reliance on moderate-resolution data and pixel-based classification suggests that fine-scale green features, such as narrow vegetated corridors, informal open spaces, or fragmented green patches, may not have been captured accurately due to spectral mixing and coarse pixel size. This challenge is echoed in other urban studies; Noelke, (2021) demonstrated that Landsat imagery substantially underestimated urban tree cover in Bengaluru, India, missing individual trees and small green clusters due to its inability to resolve fine-scale vegetation patterns. In such fragmented and heterogeneous environments, moderate-resolution imagery may obscure key UGOS elements, underestimate their extent, and misclassify them as impervious surfaces.
High-resolution Sentinel-2 (10 m) imagery improves granularity but still faces similar constraints in complex urban settings. Xu, Heremans and Somers (Xu et al., 2022) found that Sentinel-2’s spatial resolution often fails to resolve mixed land cover in dense urban mosaics, leading to blurred classification boundaries and mislabeling. Similarly, Ludwig et al. (2021) reported that Sentinel-2 alone cannot distinguish fine-grained urban structure due to pixel size limitations and mixed spectral signals. Together, these findings suggest that despite its high revisit frequency and open-access nature, Sentinel-2’s 10 m resolution and pixel-based classification may not be sufficient for accurately mapping fragmented or informal green and open spaces in data-constrained African urban environments.
In contrast, object-based classifications applied to VHR imagery have shown significant improvements in mapping accuracy and spatial detail. For example, Georganos et al. (2021) employed WorldView-3 imagery (0.3–3.7 m) and OBIA techniques to successfully detect fine-scale vegetation structures and objects specific to informal settlements in Nairobi, including waste piles and vehicles. Their approach capitalized on the spectral detail and spatial richness of VHR data, and the contextual segmentation capabilities of OBIA, enabling the differentiation of features that would likely be missed using coarser imagery and pixel-based classification.
These findings underscore three key considerations for Earth Observation-based UGOS mapping: 1) spatial resolution directly affects the ability to detect and characterize small and fragmented green patches; 2) the choice of classification method, object-based versus pixel-based, strongly affects mapping accuracy in complex urban landscapes; and 3) socio-spatial context, including land tenure, urban morphology, and governance capacity, must inform the design of Earth Observation assessment strategies. In settings where field validation is limited or informal land use dominates, OBIA applied to VHR imagery can improve the delineation of green spaces by leveraging spatial context and structural detail. However, these methods require greater technical expertise, computing resources, and often incur higher data costs. In contrast, while high-resolution, open-access imagery like Sentinel-2 offers scalable and cost-effective solutions, it may necessitate advanced processing techniques or ancillary data to adequately capture UGOS structure in heterogeneous urban landscapes. Understanding these trade-offs is essential for selecting Earth Observation strategies that balance precision, feasibility, and local capacity, particularly in rapidly urbanizing regions where green space preservation is critical, but resources are limited.
In light of these trade-offs, this study presents a comparative analysis of pixel and object-based classification methods applied to Sentinel-2 (10 m), PlanetScope SuperDove (3 m), and Maxar WorldView-3 (0.5–2 m) imagery. We focus on the rapidly urbanizing urban landscapes of Mekelle, Ethiopia, and Polokwane, South Africa for evaluating classification accuracy and UGOS representation across varying spatial resolutions and classification approaches. While similar comparisons have been conducted in other global contexts, few studies have compared such multi-resolution, multi-method analyses in African cities, where remote sensing tools are often most needed due to rapid urban growth, limited field data, and institutional constraints. This research aims to inform more context-sensitive and resource-appropriate strategies for Earth Observation-based monitoring, with implications for both scientific research and urban green space planning in data-limited settings.
3 Materials and methods
3.1 Study areas
The study areas selected for analysis include two rapidly urbanizing cities, Mekelle, Ethiopia and Polokwane, South Africa. Mekelle is located in northern Ethiopia and is the capital of the Tigray region (Figure 1). Current official population statistics are unavailable for Mekelle, but estimates agree that the population almost doubled from approximately 283,000 in 2010 to 524,000 in 2020 (Author Anonymous, 2025a; Author Anonymous, 2025b). Mekelle’s climate is classified as a dry-winter subtropical highland climate, with an annual average rainfall of 914 mm, however, the area is drought prone (Climate Data, 2025; Aberra, 2004; Araya and Stroosnijder, 2011). Open and green spaces in Mekelle consist of streets, parks, arable fields, home gardens, urban forests, church compound vegetation, and various other vegetated features (Wilson, 2020). Mekelle’s increasing urban population is driving urban land use and land cover change (Weldegebriel and Yeshitela, 2021; Cardenas-Ritzert et al., 2024; Fenta et al., 2017), leading to a loss of functioning agricultural land, reducing local food production, and, overall, hindering the supply of ecosystem services (Hadush and Gebrekiros, 2024; Kiros). Furthermore, Mekelle’s urban dwellers face inadequate water supply (Asgedom, 2014; Oyedotun, 2017), poor waste management and a lack of physical addresses, which hinders social interaction and benefits received by mail (Njoh et al., 2020). In 2013, Mekelle was selected as a pilot city to participate in the Ethiopian Urban Expansion Initiative. Over the last 10 years, the city has realized successes in its urban plan, including constructing over 120 km of asphalt roads and developing expansion areas, improving housing availability and basic services. As Mekelle continues to face challenges from urbanization, long term, pro-active planning is needed to guide sustainable urban development (https://Www.Citiesalliance.Org/Newsroom/News/Results/Mekelle-Regional-Commitment-Urban-Expansion-Planning).
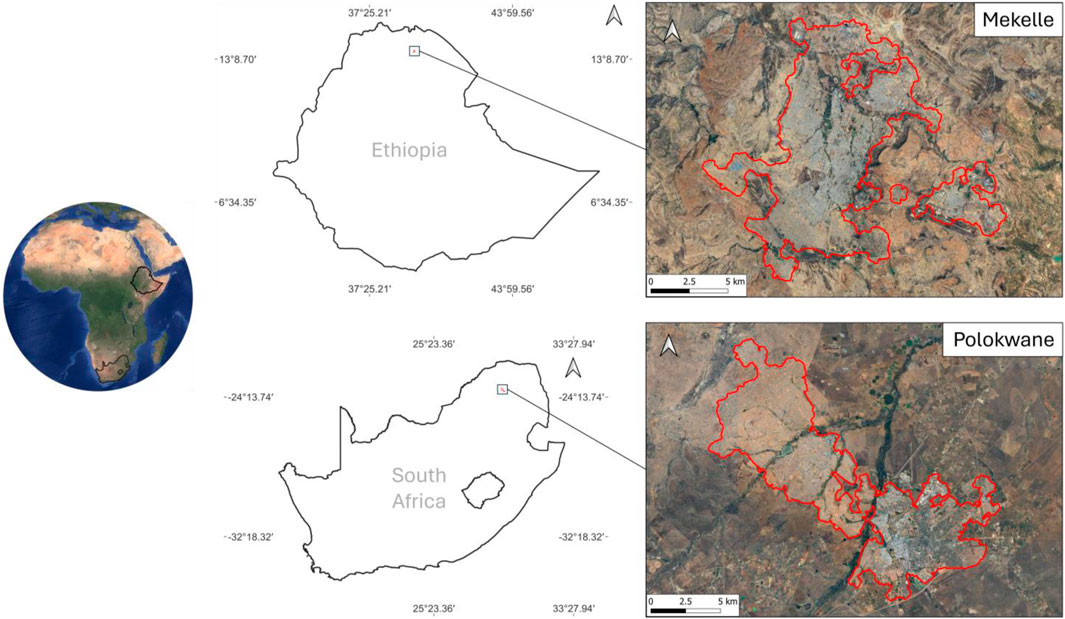
Figure 1. Location and boundaries of study cities Mekelle, Ethiopia and Polokwane, South Africa in 2020.
Polokwane is the capital city of the Limpopo province in South Africa and is the largest city north of Gauteng (Figure 1). Polokwane mirrors several of the characteristics of urban growth and management observed in Mekelle. The population is estimated to have almost doubled from 244,000 in 2010 to 426,000 in 2020 (a). Polokwane’s climate is also classified as a dry-winter subtropical highland climate, with slightly less annual average rainfall than Mekelle at 661 m but is drought prone. The city is projected to see increasing temperatures and drought over time as a result of climate change and currently suffers from water supply shortages due to operational challenges (https://Www.Sabcnews.Com/Sabcnews/Polokwane-Water-Crisis/). In response, the local government has discouraged the planting of trees and lawns (Mokoele, 2023). Polokwane faces many challenges from urbanization, and initiatives have been taken to address losses in green LC and optimize urban cover composition and spatial arrangement. In 2010, Polokwane was a host city for the World Cup and agreed to fulfill greening programmes and projects required for all host cities, which the city achieved to some extent (Nicci Polokwane Local Municipality). More recently, the city of Polokwane proposed a new planning instrument, the Integrated Development Plan, which spans 2021 to 2026 and includes objectives related to sustainable urban development and greening (City of Polokwane, 2025). Developing resources of current land cover composition and distribution could aid such planning initiatives.
3.2 Earth observation data
Four reference image sources at varying spatial resolutions were designated for comparison in this study. Imagery sources included Sentinel-2 at 10 m, PlanetScope SuperDove at 3 m, Maxar WorldView-3 multispectral at 2 m, and Maxar WorldView-3 pansharpened at 0.5 m (Table 2). For brevity, these are hereafter referred to as Sentinel-2, SuperDove, WorldView-3 multispectral, and WorldView-3 pansharpened, respectively. An initial quality assessment was conducted, focusing on image sharpness, radiometric consistency, and cloud contamination prior to classification. For WorldView-3 and SuperDove imagery, cloud-free, high-quality scenes were not available at the height of the growing season, thus the most appropriate scenes were selected within the listed collection dates for 2020 (Table 2). We selected cloud-free imagery from periods that best represented peak green vegetation cover in each city. Due to their locations in different hemispheres, the optimal months for capturing vegetation varied across the study sites. Pan sharpening of the WorldView-3 multispectral and panchromatic imagery was completed using the Gram-Schmidt method (Maurer, 2013) to create 0.5 m multispectral images. The Gram-Schmidt method produced the best overall output compared to the other available algorithms explored in preliminary analyses, and pan-sharpened images were selected based on visual inspections of the outputs.
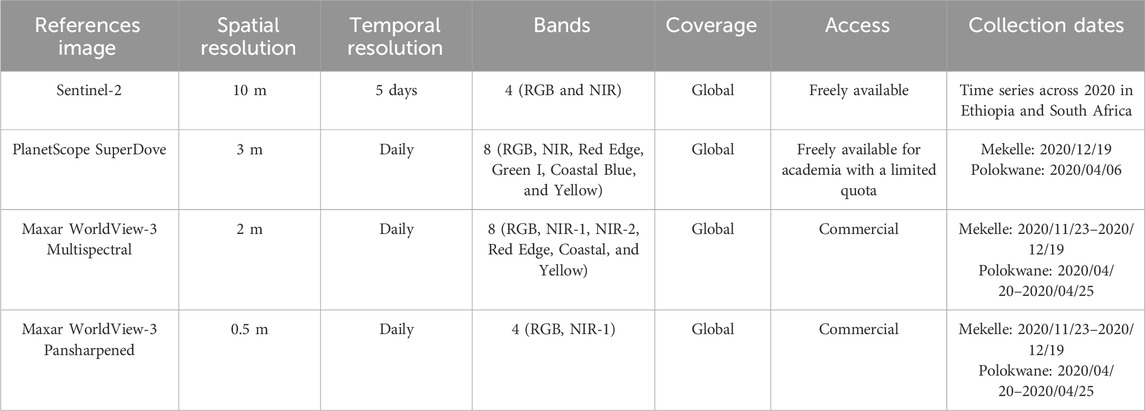
Table 2. Characteristics of satellite imagery sources employed in this study. Sentinel-2 imagery was collected through Google Earth Engine. Commercial imagery was acquired at no cost through the NASA Commercial SmallSat Data Acquisition Program as a funded NASA research project. Additional information about this program can be found at the following webpage: https://www.earthdata.nasa.gov/about/csda.
3.3 Land cover classification
Pre-processed high-resolution and VHR satellite imagery were used to generate pixel-based and object-based LC classification products, respectively. Sentinel-2 (10 m) imagery was classified in a recent national-scale urban mapping effort by Shah Heydari et al. (2024) using a pixel-based approach. Their methodology employed a time-series methodology, incorporating various spectral indices and auxiliary information (e.g., topography, Sentinel-1, night-time light data), to train random forest models that predicted LC at the pixel level across urban areas in Ethiopia, Nigeria, and South Africa from 2016 to 2020. While these models included multiple supporting predictors, Sentinel-2 imagery remained the primary data input. Aligned with the VHR LC products generated in this study, the Sentinel-2 LC maps contained seven classes: barren, short vegetation, tall vegetation, water, wetland, and impervious. Though, it did not include a shadow class, which was incorporated only in the VHR classifications. The resulting Sentienl-2 LC maps were clipped to each study city for use in this analysis. The reported overall accuracies of the Sentinel-2 LC maps for 2020 were 78.3% for Ethiopia and 62.8% for South Africa (Shah Heydari et al., 2024).
In contrast, VHR LC classification was performed directly in this study using an OBIA approach. Input imagery included SuperDove (3 m), WorldView-3 multispectral (2 m), and WorldView-3 pansharpened (0.5 m) (Table 2). Initial segmentation was conducted using the LargeScaleMeanShift algorithm in the Orfeo Toolbox (Grizonnet et al., 2017) within QGIS. Three parameters, Spatial Radius, Range Radius, and Minimum Segment Size were optimized to balance over-segmentation and under-segmentation. The Minimum Segment Size was set first based on the smallest features of interest, with the other parameters adjusted iteratively. For both cities, SuperDove segmentation used a Spatial Radius of 25, Range Radius of 75, and Minimum Segment Size of 10. These settings were also applied to all WorldView-3 imagery for Mekelle, while for Polokwane, reducing the Range Radius to 50 improved segmentation results.
We calculated per-band summary statistics for each polygon, including the number of pixels, mean, median, minimum, maximum, majority, minority, variety, and variance. Land cover labels were assigned through manual image interpretation using natural color, false color, and NDVI visualizations. Validation data were randomly selected first, approximately 300–500 polygons per city and sensor combination, followed by the selection of training data from the remaining polygons. Initial training samples focused on visually clear and confidently labeled polygons. Although we did not explicitly test for spatial autocorrelation, samples were independent and spatially dispersed. The training dataset was incrementally expanded over multiple iterations through both random and manual selection until classifier performance stabilized, and no further improvements were observed (Lv et al., 2020). The final number of training samples was constrained by available time and personnel, ranging from 1,000 to 1,500 for SuperDove imagery and 1,500–3,000 for WorldView-3 imagery.
Reference labels were generated using SuperDove and WorldView-3 imagery, supplemented by historical VHR imagery available through Google Earth Pro. Although the resolution of Google Earth imagery varies and typically does not exceed that of pansharpened Maxar data, it provided valuable contextual information to support visual interpretation. Labels were assigned through careful human interpretation, drawing on historical imagery and expert judgment to ensure the most accurate classification possible under the circumstances. We acknowledge some uncertainty in label assignment, particularly near object boundaries, but given the absence of ground truth data from 2020, this approach represented the most practical and feasible solution (Olofsson et al., 2014).
Classification was performed using the Random Forest algorithm in the Orfeo Toolbox’s TrainVectorClassifier. Classifier parameters, including number of trees, maximum depth, and minimum leaf size, were tuned over multiple runs. The final configuration used 100 trees, a depth of 14, and a minimum of three samples per leaf. Feature selection was iterative with forward adding of variables, beginning with mean and variance of each predictor variable, and expanding to include additional statistics. Highly correlated features were excluded using dendrogram-based grouping. Each feature set was tested over 32 runs using randomized training splits, and mean accuracy and variance were used to determine the optimal configuration. All accuracy metrics for tuning and feature selection were computed on an independent validation set but not the final validation set. The final models were trained using all available reference data and applied using VectorClassifier in QGIS to generate the final LC maps (Figure 2). All VHR LC products generated in this study are publicly available via the ORNL DAAC (Cardenas-ritzert et al., 2020).
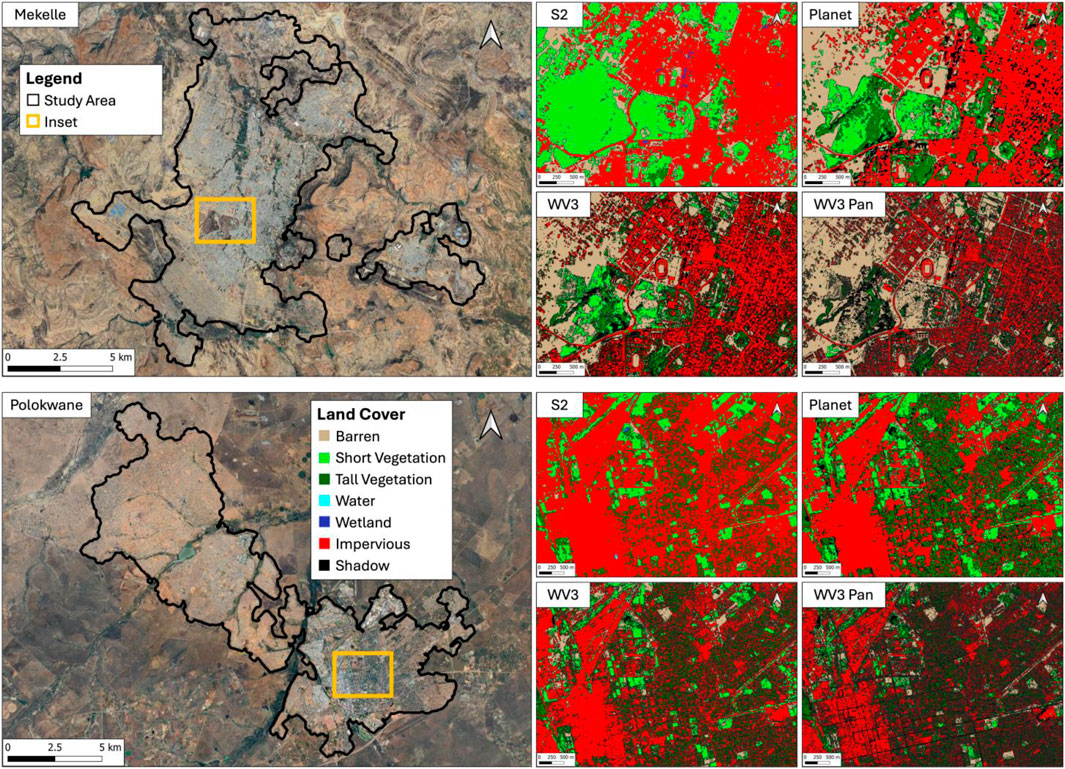
Figure 2. Land cover classification in study area insets (2020). The study area and inset locations are shown on the left side of the figure. The right side of the figure shows land cover within the inset area for each image source. S2 is Sentinel-2 10 m, Planet is SuperDove 3 m, WV3 is WorldView-3 multispectral at 2 m, and WV3 Pan is WorldView-3 panchromatic at 0.5 m.
3.4 Urban delineation
An automated approach developed by Cardenas-Ritzert et al. (Cardenas-Ritzert et al., 2024) was used to delineate the urban extent of Mekelle and Polokwane in 2020. The approach combines various spatial datasets, tools, and techniques to identify individual urban agglomerations across entire countries. Urban delineation is achieved using spatial analysis techniques, population thresholds, geographic data from OpenStreetMap (Wiki, 2025), and transportation analyses from the openrouteservice API (Openrouteservice, 2025). The order of analytical operations includes identifying urban clusters, differentiating urban clusters into classes, assessing connectivity between cluster classes, and, finally, classifying the urban agglomerations (Cardenas-Ritzert et al., 2024). Urban delineation was carried out by applying this process to national scale LU maps produced by Vogeler and Shah Heydari (Shah Heydari and Vogeler, 2024) and the WorldPop data described in Section 2.2 with associated Python scripts provided by Cardenas-Ritzert et al. (2024) on GitHub: (https://github.com/VogelerLab/SDG-11.3.1-Automated-Urban-Delineation-Code).
WorldPop population count data was used to carry out urban delineation following the methods of Cardenas-Ritzert et al. (2024). WorldPop’s 100 m resolution population count datasets were downloaded from the WorldPop website: www.worldpop.org/(accessed on 18 July 2024) for Ethiopia and South Africa in 2020. WorldPop’s top-down unconstrained population datasets are developed by extracting the count of people per administrative unit from census data, combining said data with ancillary data (e.g., land cover), and employing them in a Random Forest model. The result is a grid with an estimate of the total number of people in each 100 m × 100 m cell for a specified year (WorldPop). It is important to acknowledge that WorldPop is constrained by the data which it is modeled on, including census and remotely sensed data. While it has known limitations, including under and over estimations in certain contexts, it generally proves to be accurate and reliable (Ma et al., 2021; Láng-Ritter et al., 2025; Bai et al., 2018; Thomson et al., 2022). WorldPop is consistently used in a variety of GIS applications, including modeling disease incidence, urban heat island impacts by demographics, and projecting future population values (Rakuasa and Lasaiba, 2024; Palanisamy et al., 2024; Nethery et al., 2021).
To assess alignment with local context, we compared the resulting urban extents with previously mapped boundaries. This included relating our urban extents with administrative units and Africapolis 2020 urban boundaries (Heinrigs, 2020) for Mekelle and Polokwane, as well as conducting visual verification using recent high-resolution basemaps (e.g., high-resolution Google imagery). The delineated boundaries closely matched built-up development patterns visible in the imagery, though very minor discrepancies occurred at the urban fringes, particularly in peri-urban areas with rapidly changing land use. Additionally, we acknowledge the limitations of relying on WorldPop data, particularly in regions with outdated census baselines, and recognize how this may affect delineation accuracy (Cardenas-Ritzert et al., 2024). Nonetheless, the method provides a consistent delineation framework for comparing UGOS metrics across the two cities.
3.5 Landscape metrics
To evaluate how image resolution and classification schemes influence urban landscape characterization, we calculated a suite of landscape metrics across each LC product. This analysis focused on four core components. First, we examined the differences between grouped developed and undeveloped land cover classes, allowing for a direct comparison of broad land cover composition and spatial variation across imagery. Second, we assessed variation in tall vegetation to better understand how well different products capture vegetated structure. Third, we applied the same metrics to individual public spaces in Mekelle and Polokwane to explore how resolution affects the measured composition and configuration of green space at the local scale. Lastly, we investigated elements of SDG Indicator 11.7.1, including the share of open space and space allocated to streets. Together, these steps provide insight into the implications of using varying LC products for urban ecological, planning, and monitoring assessments.
To examine differences specifically across the developed versus undeveloped LC classes from the LC products, the original LC classes required merging. Each reference image was reclassified into a binary raster with an undeveloped and developed class. The undeveloped class consisted of barren, short vegetation, tall vegetation and water/wetland and the developed class consisted of impervious surface cover. For the SuperDove and WorldView-3 products, the shadow class was assigned to the undeveloped or developed class based on the classification of the lower resolution LC image. For instance, the shadow class from the SuperDove LC image was overlaid onto the Sentinel-2 LC image, which did not have a shadow class. The shadow class from the SuperDove LC image was then assigned to the developed or undeveloped class based on the classification of the Sentinel-2 LC image using the Join by Location tool in QGIS. This process was repeated for the shadow class of the WorldView-3 multispectral and WorldView-3 pansharpened LC images, with WorldView-3 multispectral using the binary classified SuperDove image as a reference and WorldView-3 pansharpened using the binary classified WorldView-3 multispectral as a reference. The original tall vegetation class from each individual data product was used for the tall vegetation comparison.
Once the undeveloped versus developed and tall vegetation rasters were created, landscape metrics were calculated using Fragstats 4.2.681 (McGarigal, 2015). The following landscape metrics were calculated for each raster: Percentage of the Landscape (PLAND), Class Area (CA), Number of Patches (NP), Largest Patch Index (LPI), Mean Patch Area (AREA_MN), Patch Density (PD), and Mean Euclidean Nearest Neighbor (ENN_MN) (Table 3).
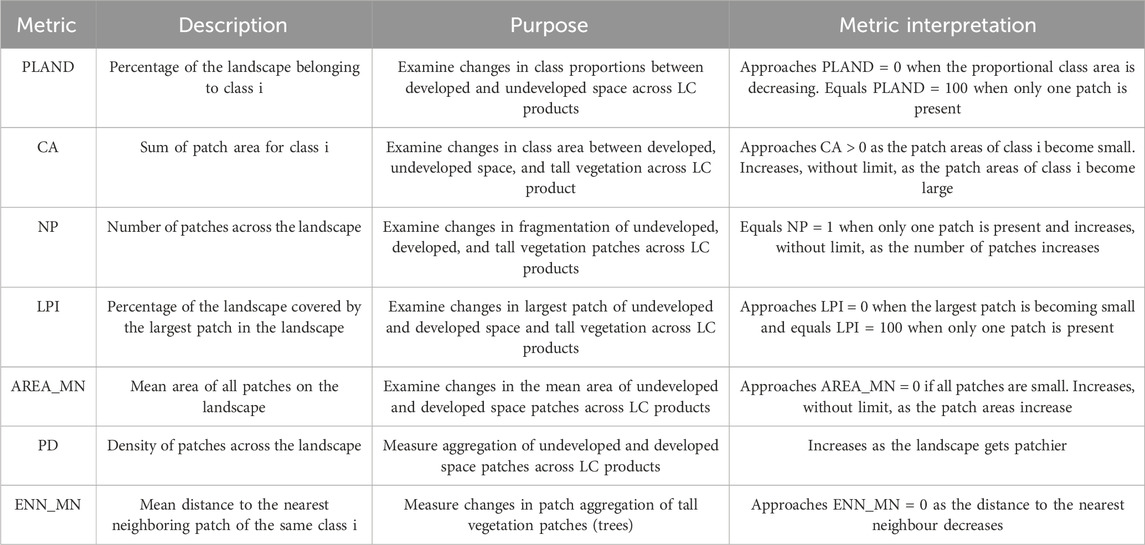
Table 3. Landscape metrics calculated using Fragstats software for the city scale analyses of the undeveloped versus developed classes and the tall vegetation class.
3.6 Configurations of sample public spaces
We calculated landscape metrics for individual public spaces in Mekelle and Polokwane to examine finer differences in land cover composition and tall vegetation detection across image resolutions. One public space in each Mekelle and Polokwane were identified using OSM labels and confirmed via imagery on Google Earth Pro. A shared boundary was digitized around each public space to maintain consistency in the analysis area; the land cover products were then clipped to the extent of the digitized boundary. For each public space, the landscape metrics we calculated included two previously declared metrics, PLAND and NP (Table 3). An additional metric was included, the number of tall vegetation patches per km2 of the sample public space (Table 4). The objective was to examine the composition of land cover classes covering each public space and tall vegetation distribution within them.

Table 4. Additional metric calculated for sample public space analysis.
3.7 SDG Indicator 11.7.1
Calculating SDG Indicator 11.7.1 metrics requires delineating the urban extent, street space, and public open spaces. The urban extent was delineated using the approach developed by Cardenas-Ritzert et al. (Cardenas-Ritzert et al., 2024) as described in the earlier section. For each LC product and given the urban extent in 2020, the total built-up area was computed.
Street width data was not available in the study cities. OpenStreetMap (OSM) data was used to delineate street space. Related OSM street types were aggregated into street groups (Table 5). To calculate the total street area, 100 random points were generated on the lines of each street group and manual measurements were made of sample streets in each group using high resolution imagery on Google Earth Pro. We calculated an average width value for each street group, which was used to buffer each street group line. The buffered street groups were now polygons with a total area calculated for each, which we then summed to acquire the total land area allocated to streets.
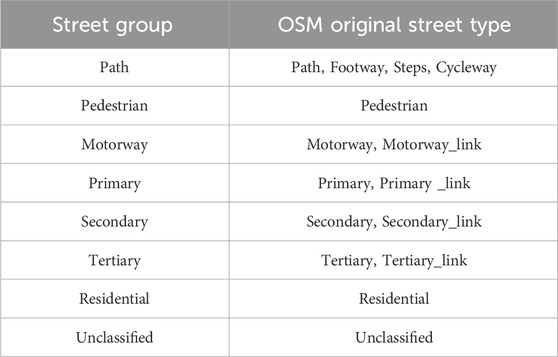
Table 5. OSM street types extracted for calculating street width.
To obtain public open spaces, we utilized the undeveloped class from each LC product and data from OSM. The undeveloped class was initially used to represent potential public open spaces. OSM data offers the possibility to identify public and non-public spaces with various tags. Upon examination of the data that could be used to identify public areas, we found that the public space data was inadequate for this purpose. The data for areas that were likely non-public were more complete. As an alternative, the selected non-public polygons (Table 6) were clipped to the undeveloped space extent and their total area was subtracted from the total undeveloped space area to identify the more probable public open spaces.
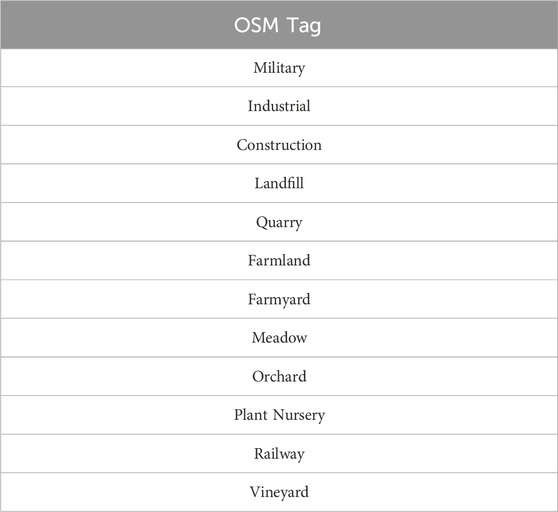
Table 6. OSM keys and tags used to identify non-public space land uses.
Three metrics were calculated under SDG Indicator 11.7.1: the amount of undeveloped space allocated to streets (USATS), the land allocated to public open spaces (LAPOS), and the share of the built-up area of the city that is open space in public use (Share of open space) (SDG Indicators Metadata repository, 2020), using the following equations:
LAPOS =
USATS =
Share of open space (%) =
4 Results
4.1 Land cover classification
Map validation results, including overall map accuracy (OA) and F1 score, are presented for the VHR land cover products generated for Mekelle and Polokwane in 2020 (Table 7). We restricted the calculation of OA and F1 scores to the VHR maps only as the high-resolution Sentinel-2 LC map was not directly produced for each study city within this study and was meant to be used as an alternative product for comparison within subsequent steps of the analyses. The WorldView-3 multispectral LC maps had the highest OA obtained in both Mekelle and Polokwane at 92.3% and 86.1%, respectively. In Mekelle, the SuperDove LC map had the lowest OA at 75.8%, and, in Polokwane, the WorldView-3 pansharpened LC map had the lowest OA at 67.5%, respectively. The average F1 score for all maps remained above 58%. Additionally, the individual class F1 scores are provided for the 2020 land cover maps generated for Polokwane and Mekelle (Tables 8–10).

Table 7. Map validation results for SuperDove, WorldView-3 multispectral, and WorldView-3 pansharpened LC products in Mekelle and Polokwane for 2020. WV3 is WorldView-3.
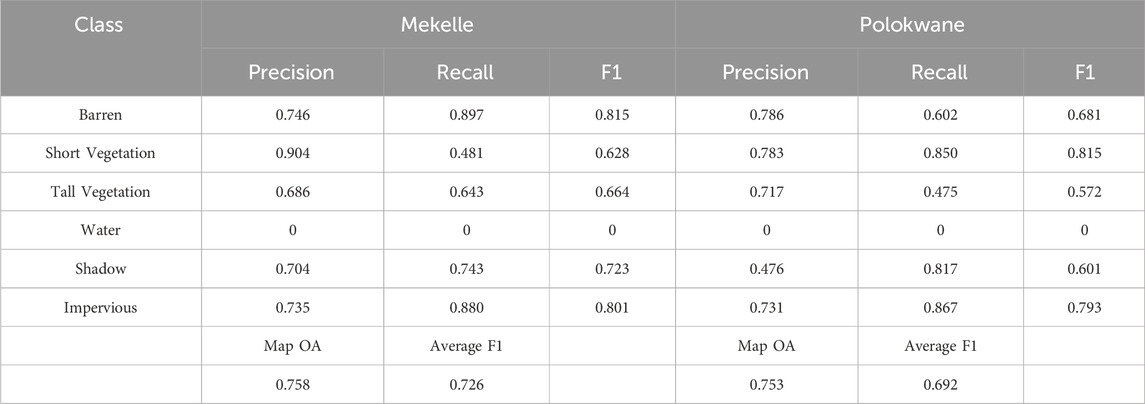
Table 8. Map validation results by class for the SuperDove land cover products in Mekelle and Polokwane for 2020.
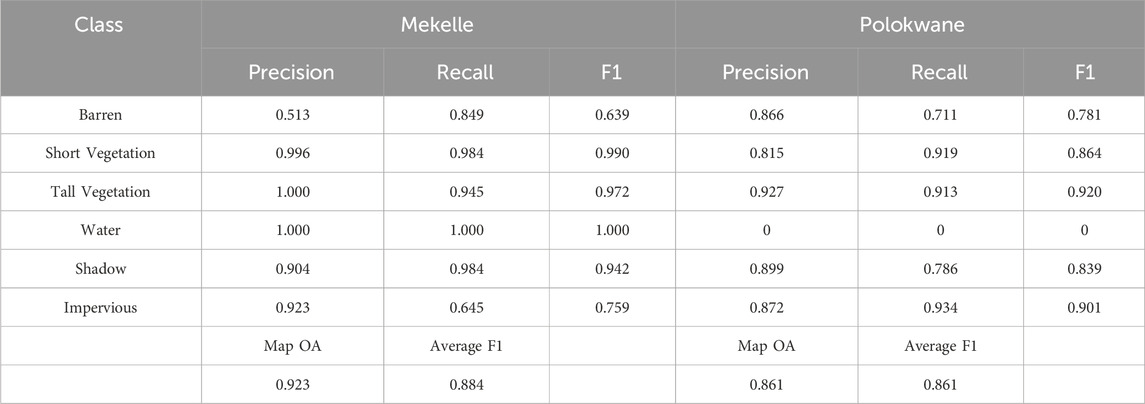
Table 9. Map validation results by class for the WorldView-3 multispectral land cover products in Mekelle and Polokwane for 2020.

Table 10. Map validation results by class for the WorldView-3 pansharpened land cover products in Mekelle and Polokwane for 2020.
4.2 Developed versus undeveloped space
In Mekelle, the PLAND metric quantifying the proportion of developed and undeveloped space remained relatively unaffected across the classified image products. The proportions of developed versus undeveloped space only shifted by approximately one to two percent between the classified Sentinel-2, SuperDove, MaxarWorldView-3 multispectral, and WorldView-3 pansharpened products. The greatest difference in PLAND of developed and undeveloped space was between the coarsest resolution map, Sentinel-2, and finest resolution map, WorldView-3 pansharpened. According to the assessment, undeveloped space comprised 74%–77% of Mekelle’s landscape in 2020, while developed space accounted for the remaining 23%–26% (Figure 3).
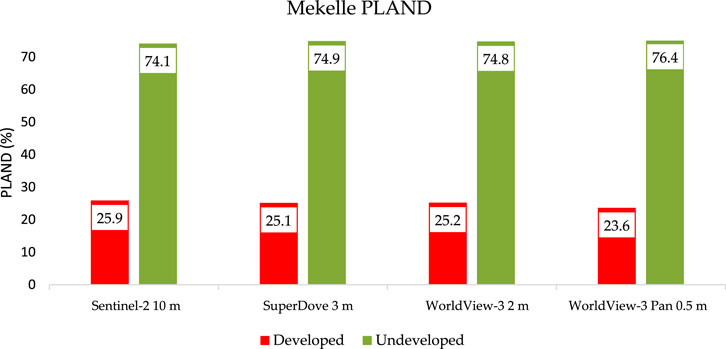
Figure 3. PLAND values for developed (green bars) and undeveloped (red bars) space across image sources in Mekelle in 2020. PLAND is the percentage of a landscape comprised by a specific class.
Conversely, in Polokwane, a greater shift in the proportion of developed and undeveloped areas of the landscape was observed across the imagery sources. From Sentinel-2 to SuperDove, the proportion of developed and undeveloped space varied by approximately 11%, with the increase concentrated in the undeveloped class (Figure 4). Between SuperDove, WorldView-3 multispectral and WorldView-3 pansharpened, the difference in proportions was less than 3%. According to the WorldView-3 multispectral product, which exhibited the highest accuracy in Polokwane, undeveloped land accounted for approximately 70% of Polokwane’s landscape in 2020 and developed land accounted for the remaining 30%.
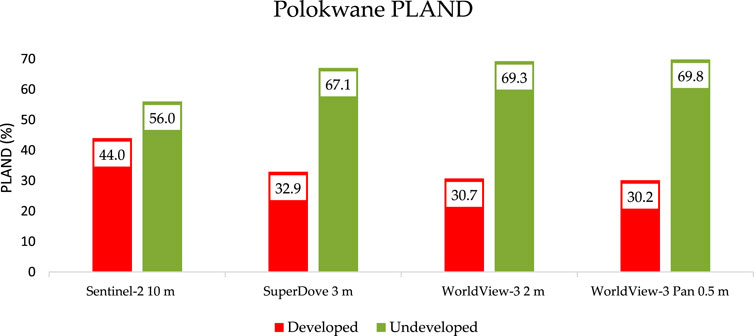
Figure 4. PLAND values for developed (green bars) and undeveloped (red bars) space across image sources in Polokwane in 2020. PLAND is the percentage of a landscape comprised by a specific class.
Patch metrics for developed and undeveloped land differed between Mekelle and Polokwane and varied across image sources. In Mekelle, both developed and undeveloped mean patch areas (AREA_MN) decreased as spatial resolution increased (Table 11). Under WorldView-3 pansharpened imagery, the average patch area for both classes was less than 7% of the corresponding mean patch areas derived from Sentinel-2. Similarly, the largest patch index (LPI) tended to decline with increasing spatial resolution for both classes. For example, the largest undeveloped patch in the Sentinel-2 image accounted for 58% of the landscape, but this dropped sharply to 28% in the WorldView-3 pansharpened product (Table 11). Patch density (PD) followed the opposite trend, increasing with finer resolution. It rose only slightly from Sentinel-2 to SuperDove but increased substantially under WorldView-3 multispectral and pansharpened imagery.
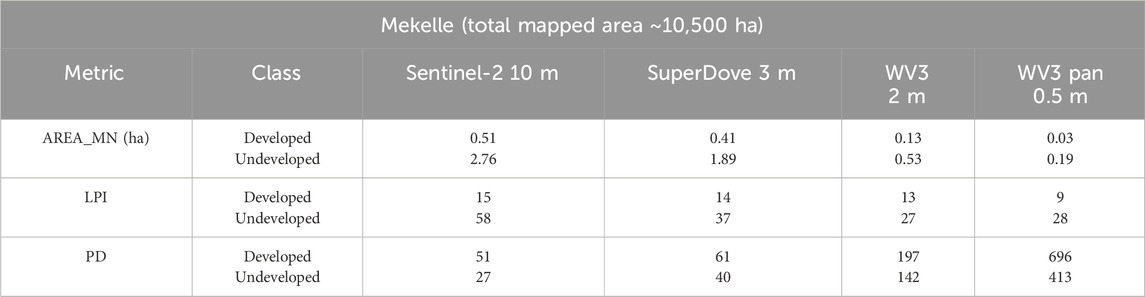
Table 11. Patch characteristics of developed and undeveloped classes across image sources for Mekelle (2020). AREA_MN is the mean patch area in hectares, LPI is the Largest Patch Index, and PD is Patch Density. WV3 is WorldView-3.
In Polokwane, patch characteristics also varied with image resolution. Mean patch area generally decreased with finer resolution for both classes, except for an increase in undeveloped patch area at the 3 m resolution (Table 12). Unlike in Mekelle, the LPI values in Polokwane did not follow a consistent trend, fluctuating across image sources for both developed and undeveloped classes, suggesting that factors beyond spatial resolution may be influencing these patterns. Patch density in Polokwane, however, showed a more consistent increase with higher resolution imagery as expected.
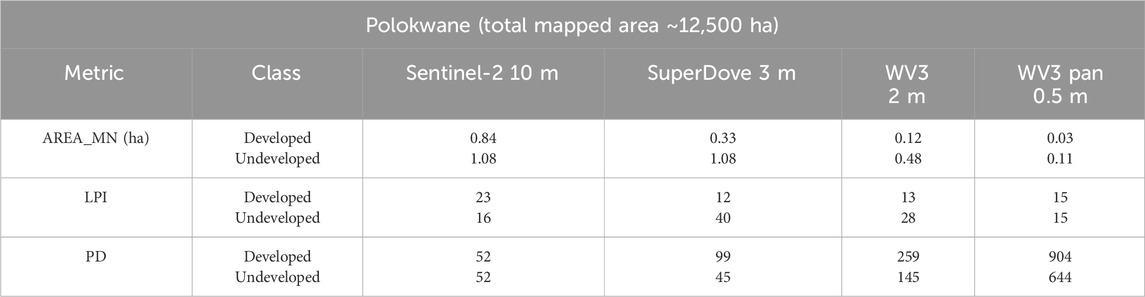
Table 12. Patch characteristics of developed and undeveloped classes across image sources for Polokwane (2020). AREA_MN is the mean patch area in hectares, LPI is the Largest Patch Index, and PD is Patch Density. WV3 is WorldView-3.
4.3 Tall vegetation class comparison
The tall vegetation class comparison across imagery yielded comparable results between Mekelle and Polokwane. The area of tall vegetation (CA) and number of individual tall vegetation patches (NP) detected increased noticeably with the increase in spatial resolution. In Mekelle, the area of tall vegetation increased more than ten-fold from Sentinel-2 10 m to the VHR image products (Table 13). In Polokwane, the area nearly doubled from Sentinel-2 10 m to the SuperDove 3 m and WorldView-3 2 m, and it nearly tripled to the WorldView-3 Pan product. The largest patch of tall vegetation (LPI) comprising each city landscape changed across image resolutions but with no consistent trends. The mean patch area of tall vegetation (AREA_MN) generally decreased in size as the spatial resolution increased, but the mean patch area under SuperDove 3 m was greater than Sentinel-2 10 m in both Mekelle and Polokwane (Table 14). Lastly, the average distance (ENN_MN) between neighboring tall vegetation patches decreased as the spatial resolution increased.
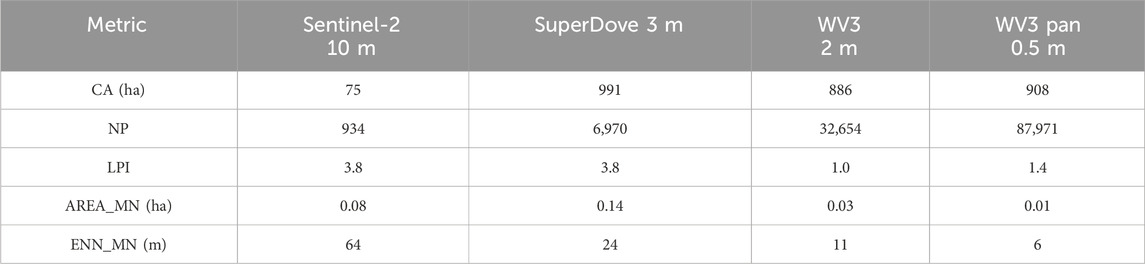
Table 13. Tall vegetation patch characteristics across image sources for Mekelle (2020). CA is Class Area in hectares, NP is number of patches, LPI is largest patch index, AREA_MN is the mean patch area in hectares, and ENN_MN is the average Euclidean distance between patches in meters. WV3 is WorldView-3.
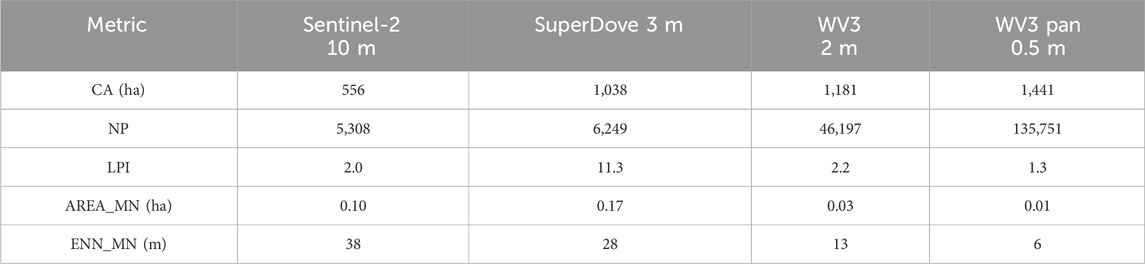
Table 14. Tall vegetation patch characteristics across image sources for Polokwane (2020). CA is Class Area in hectares, NP is number of patches, LPI is largest patch index, AREA_MN is the mean patch area in hectares, and ENN_MN is the average Euclidean distance between patches in meters. WV3 is WorldView-3.
4.4 Case study public space analyses
The two identified case study public spaces included Hewalti Semaetat and Martyr’s Memorial Monument in Mekelle, and Tom Naude Park and Nooderland High School in Polokwane (Figure 5). The initial metric considered to best explain LC in the sample public spaces was the percentage of the landscape comprised by each class (PLAND). PLAND in Mekelle’s sample public space was primarily made up of barren land and tall vegetation under the WorldView-3 pan product but shifted to being made up of short vegetation, barren, and impervious surface across the other image products (Table 15). The number of tall vegetation patches (i.e., trees) generally increased with image resolution, where WorldView-3 pansharpened exhibited the highest density of tall vegetation patches. When comparing the cities, Mekelle’s case study public open space had a greater density of tall vegetation patches per km2 compared to Polokwane, regardless of imagery source (Table 16). PLAND in Polokwane’s case study public space was dominated by short vegetation under Sentinel-2, SuperDove, and WorldView-3 multispectral, but was spread across classes more evenly under WorldView-3 pansharpened. Similar to Mekelle, the tall vegetation patches were also more aggregated under VHR imagery in Polokwane’s case study public space.

Figure 5. Figure showing sample public space locations in Mekelle and Polokwane, and 2020 land cover composition within each across imagery. STL is Sentinel-2, PLAN is SuperDove (3 m), WV3 is WorldView-3 multispectral (2 m), and WV3 Pan is WorldView-3 pansharpened (0.5 m).

Table 15. Land cover composition across image resolutions for Hewalti Semaetat and Martyr’s Memorial Monument in Mekelle and Polokwane. PLAND is the percentage of a landscape comprised by a specific class. WV3 is WorldView-3.
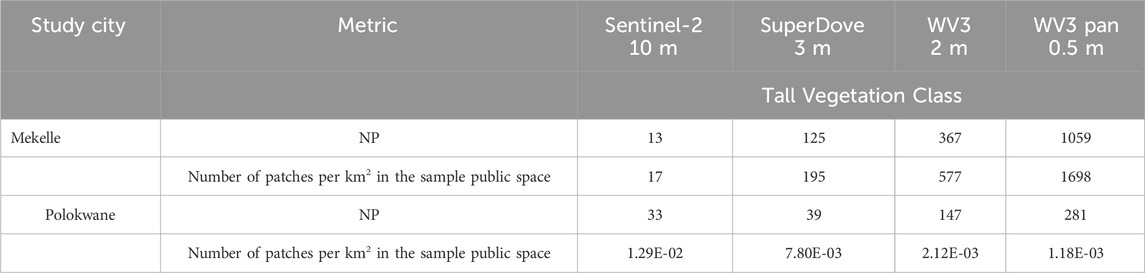
Table 16. Configuration metric for tall vegetation across image resolutions for Tom Naude Park and Nooderland High School in Mekelle and Polokwane. NP is number of patches. WV3 is WorldView-3.
4.5 SDG Indicator 11.7.1
SDG Indicator 11.7.1 metrics were applied to investigate the land of undeveloped space dedicated to streets (USATS), the land allocated to presumable public open spaces (LAPOS), and the share of the built-up area of the city that is open space presumably in public use (Share of open space). Both cities were similar in their share of spaces related to SDG Indicator 11.7.1 across all LC products, including those derived from Sentinel-2. Across image resolutions, Mekelle did not change drastically, varying by less than one percent for USATS, seven percent for LAPOS, and seven percent for Share of open space. The change across image resolutions was greater for Polokwane, with a maximum difference of around 5% for USATS, 19% for LAPOS, and 19% for Share of open space (Table 17).
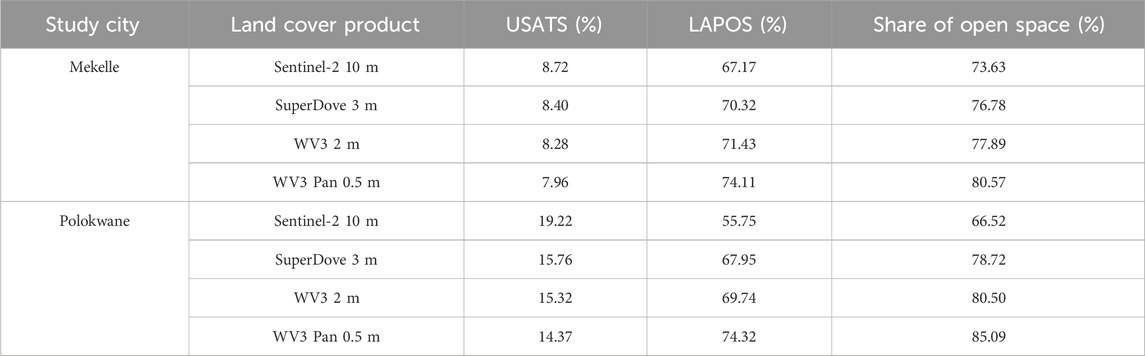
Table 17. USATS, LAPOS, and Share of open space calculations across image resolutions for Mekelle and Polokwane in 2020. USATS is the share of undeveloped space allocated to streets, LAPOS is the land allocated to potentially public open spaces, and SOOS is the share of the built-up area of the city that is open space in public use. WV3 is WorldView-3.
5 Discussion
This study highlights the opportunities and challenges associated with mapping and analyzing UGOS using commonly accessible Earth Observation datasets that differ in spatial and spectral resolutions. Through comparative analysis of Sentinel-2 (10 m), SuperDove (3 m), and WorldView-3 (0.5–2 m) imagery in the contrasting urban environments of Mekelle and Polokwane, we found that image characteristics, classification method, and land cover heterogeneity influenced UGOS representation, landscape metrics, and SDG Indicator 11.7.1 estimates.
5.1 VHR classification accuracy and image selection
Among the tested imagery sources, WorldView-3 multispectral data consistently achieved the highest classification accuracy in both cities, with overall map accuracies exceeding 86% and average F1 scores above 0.86. Conversely, WorldView-3 pansharpened imagery, despite its finer spatial resolution (0.5 m), yielded lower classification performance, especially in Polokwane, indicating that increased spatial resolution does not necessarily translate into improved accuracy. SuperDove imagery (3 m) showed intermediate performance, with average F1 scores around 0.72 in Mekelle and 0.69 in Polokwane, demonstrating its potential for mapping impervious surfaces but more limited reliability in mapping diverse vegetation features.
Class-specific variations in accuracy offer further insights. Impervious surfaces were classified with high precision and recall across most sources, especially using WorldView-3 multispectral. Water was consistently misclassified across all imagery products, likely due to the absence of substantial water bodies in our study areas or confusion with shadow and impervious surfaces. Vegetation classes presented additional challenges: short vegetation in Mekelle and tall vegetation in Polokwane showed notably lower F1 scores under SuperDove and pansharpened WV3, reflecting spectral confusion with barren or impervious areas and emphasizing the probable sensitivity of vegetation detection to seasonal timing and contextual factors.
Previous studies have shown that increasing spatial resolution through pansharpening resulted in higher overall accuracies when detecting tree species in mixed forest stands (Deur et al., 2021). Other research has shown that higher-band WorldView-3 datasets yield better performance in stratified vegetation classification when used with OBIA, due to improved spectral differentiation (Panđa et al., 2024; Varin et al., 2020). Furthermore, urban heterogeneity is well documented as a challenge for land cover mapping, especially for intermediate vegetation types (Georganos et al., 2021). Our findings suggest that balancing high spatial resolution with spectrally rich information enhances object-based classification of urban land cover, particularly for UGOS mapping in data-limited settings. This is especially relevant when attempting to improve class separability and mapping accuracy for important UGOS elements such as trees.
Practitioners should therefore carefully consider sensor characteristics, spatial and spectral resolution, classification method, acquisition timing (e.g., seasonality, cloud cover, time of day), and local landscape context when selecting imagery for urban land cover mapping. When imagery options are limited, it is essential to acknowledge these constraints and interpret results in light of accuracy metrics and class-specific uncertainties.
5.2 UGOS metrics and the impact of resolution
Estimates of undeveloped and developed space varied across imagery sources for both Mekelle and Polokwane. In Mekelle, the proportion of developed versus undeveloped land (PLAND) was relatively insensitive to changes in image resolution, likely due to a more distinct spatial separation between land cover types. In contrast, slightly larger variation was observed in Polokwane, particularly between Sentinel-2 and SuperDove. This insinuates that finer spatial resolution and other aspects of mapping may be more critical for accurately capturing broader landscape composition in heterogeneous environments. Nonetheless, the PLAND metric remained relatively stable overall, indicating that Sentinel-2 may still be suitable for broader-scale UGOS analyses.
For patch-based metrics, pronounced differences were observed between Sentinel-2 and VHR products, where mean patch size (AREA_MN), largest patch index (LPI), and patch density (PD) generally decreased with increasing spatial resolution (Tables 9, 10). This pattern indicates that coarser-resolution imagery tends to generalize fine-scale green and open spaces into fewer, larger patches, which can mask landscape fragmentation. In contrast, finer-resolution imagery revealed more detailed patterns, capturing small and spatially dispersed features (e.g., isolated tree clusters and interstitial open spaces). Consistent with prior research (Hu et al., 2024), this generalization can misrepresent ecological complexity and reduce the reliability of detailed land cover assessments.
Additionally, the mapped extent and number of patches of tall vegetation increased markedly with spatial resolution in both cities, supporting previous findings that tree crowns are often too small to be resolved in 10 m imagery (Xu et al., 2022). For example, in Mekelle, the class area of tall vegetation increased more than tenfold between the Sentinel-2 and VHR LC maps (Table 13). Given the critical role that trees play in supporting urban vitality (Turner-Skoff and Cavender, 2019; Wood and Esaian, 2020), accurately assessing their distribution and abundance is important for guiding urban planning and management (Morabito et al., 2021; Endreny et al., 2020). These results underscore the value of VHR imagery in fragmented and highly heterogeneous urban environments, particularly for quantifying tree-based UGOS. Higher spatial resolution enables for more precise detection of small, heterogeneous, and intermixed landscape elements that can be overlooked or misclassified in coarser-resolution datasets.
However, unlike in Mekelle, the expected pattern of decreasing patch size with higher resolution did not hold for Polokwane. For example, the percentage of the landscape occupied by the largest undeveloped patch (LPI) followed a non-linear trend, rising from 16 at 10 m to 40 at 3 m, then declining to 28 at 2 m and 15 at 0.5 m (Table 10). This deviation may be partly attributed to the shift in classification method: Sentinel-2 (10 m) was classified using a pixel-based approach, while higher-resolution imagery used object-based image analysis (OBIA). At 3 m, the use of OBIA may have overestimated undeveloped and tall vegetation by merging nearby features or misclassifying elements like shadows or roadside vegetation. Such issues align with previous findings that OBIA can misclassify mixed-use or ambiguous areas in complex urban environments (Moskal et al., 2011).
Classification accuracy for SuperDove in Polokwane supports this interpretation, with relatively high precision (0.717) but low recall (0.475) for tall vegetation, indicating that while identified patches were mostly correct, many actual tree patches were missed. At finer resolutions (2 m and 0.5 m), the greater spatial detail of WorldView-3 helped distinguish mixed land types more effectively, breaking up large patches and reducing LPI. In contrast, Mekelle exhibited a steady decline in LPI with increasing resolution, suggesting a more fragmented landscape is less prone to overestimation. These findings reinforce that resolution effects are highly context-dependent, shaped not only by classification strategy but also by local landscape structure, and possibly, image quality, acquisition conditions, and seasonal variability.
5.3 Street and open space
SDG Indicator 11.7.1 metrics reveal that both Polokwane and Mekelle are made up of largely open space (Table 17) but allocate significantly less urban land to streets than the 30%–35% recommended by the United Nations (UN-Habitat, 2018), with estimates of just 8% and 14%, respectively (Table 17). This shortfall aligns with patterns observed in other cities such as Beijing (11.5%) (Dong et al., 2023) and Athens (13.1%) (Verde et al., 2022), reflecting a broader global trend where many urban areas fall below international benchmarks (UN-HABITAT, 2013; Xin and Realities, 2024). Rather than indicating planning failure, these low ratios likely stem from historical development patterns and informal settlement growth (UN-Habitat GLOBAL PUBLIC SPACE PROGRAMME Annual Report, 2022, 2022). Nevertheless, limited street coverage can constrain mobility and opportunities for social interaction, especially in rapidly urbanizing cities with infrastructural deficits (López-Lambas et al., 2021). These findings stress the need not only to expand street infrastructure where feasible but also to enhance the quality, accessibility, and functionality of existing street networks.
In the context of the Global South, these findings take on added significance. Cities like Polokwane and Mekelle face structural and institutional challenges that constrain formal street development, including colonial spatial legacies, widespread informal growth, and limited planning capacity (Angel, 2023). Much of their urban expansion occurs without coordination, resulting in fragmented or undersized street networks. At the same time, municipal governments often operate under resource and governance constraints that hinder efforts to improve street quality and function (Adelina et al., 2020; Jones et al., 2014). While UN benchmarks can be useful targets, planning in these contexts must be adaptive, focusing on incremental improvements, community participation, and multifunctional space use.
5.4 OSM data limitations
Due to the absence of official datasets, this study relied on OpenStreetMap (OSM) to identify streets and infer the extent of public open space. While OSM provides a valuable resource in data-scarce environments like Sub-Saharan Africa, it is known to have limitations related to completeness, positional accuracy, and contributor bias, especially in cities with limited mapping activity (Nemec and Raudsepp-Hearne, 2013; Troy and Wilson, 2006; Lotfata, 2021). As a result, street networks may be underrepresented, due to the exclusion of informal or unmapped streets. Additionally, this study focused on the inverse of non-public spaces, rather than an inventory of formal public open spaces, due to the lack of comprehensive municipal data and mapped public spaces in OSM. Although previous research has found OSM to be generally reliable for urban analysis (Forghani and Delavar, 2014; Törnros et al., 2015; Demetriou et al., 2016), its gaps may affect the accuracy of street coverage and public space assessments, potentially over or under-estimating the SDG Indicator 11.7.1 metrics. Where feasible, future efforts should incorporate locally validated datasets, very high-resolution maps, or field-based assessments to better capture the diversity of street, and public and informal open spaces common in rapidly urbanizing African cities.
5.5 Limitations and potential of Sentinel-2 for UGOS mapping
This study highlights the trade-offs involved in selecting satellite imagery for UGOS assessments, particularly when comparing high-resolution data like Sentinel-2 to VHR imagery. Although Sentinel-2 has spatial limitations that affect its ability to capture fine-scale heterogeneity, its global coverage, open access, and high temporal frequency make it a valuable resource for urban land cover monitoring.
Numerous studies have successfully applied Sentinel-2 to track land cover change and urban green space dynamics (Sharma et al., 2024; Nuthammachot and Ali, 2025; Fayaz et al., 2025), including for indicators such as SDG 11.7.1 (Verde et al., 2022). In this study, Sentinel-2 imagery was particularly useful for identifying broad patterns of developed versus undeveloped land and metrics supporting SDG 11.7, which showed relatively minor differences across imagery sources in Mekelle (Table 17). However, metrics did differ up to 20% in Polokwane, and its 10 m spatial resolution restricts its ability to accurately delineate small or fragmented UGOS features.
It is important to note that the Sentinel-2 maps used in this study were produced using a country-level classification model. As such, we did not include their accuracy statistics alongside those of the VHR classifications, which were generated using classifiers trained on scene-specific data for each urban area. Tailoring these models to individual cities could potentially yield higher accuracy, particularly for distinguishing between developed and undeveloped land. However, even with locally trained models, the reliable identification of small, vegetated features, such as individual trees, would likely still require VHR data (≤3 m).
While VHR imagery offers improved spatial detail, it is often less accessible and more costly, which can limit its utility for long-term monitoring. As such, Sentinel-2 remains a practical and scalable option for broader scale analyses, though its limitations should be carefully considered when interpreting fine UGOS patterns and informing local planning decisions.
5.6 Additional considerations
Understanding the broader context of urbanization and the external factors influencing the management of urban open spaces is critical for strengthening UGOS assessment frameworks and guiding future planning and policy. In Mekelle, for instance, the Tigray War has significantly impacted the urban environment and is likely to accelerate changes in urban green and open spaces in the years ahead (Hadush and Gebrekiros, 2024; Global Conflict Tracker Conflict in). While geospatial assessments are effective for capturing the spatial and physical dimensions of landscape change, they are limited in their ability to reflect the underlying social dynamics that shape urban management and public space vitality (Laituri et al., 2025). Many dimensions of UGOS assessment warrant deeper investigation. Future research should prioritize evaluating the accuracy and reliability of open-source spatial datasets, exploring novel data fusion and modeling techniques, and integrating local knowledge or community-based data to enrich spatial analyses.
6 Conclusion
Urban land cover mapping and UGOS assessments offer valuable insights for local planning and monitoring progress toward global development goals. Hence, understanding the methodological and data-driven limitations of these assessments is essential. The presented work compared land cover classification and UGOS analyses across high-resolution (Sentinel-2) and very high-resolution (SuperDove and WorldView-3) satellite imagery in two rapidly urbanizing cities: Mekelle, Ethiopia, and Polokwane, South Africa. Our findings show that spatial resolution, classification strategy, and landscape complexity all significantly influence UGOS representation and associated metrics, including those relevant to SDG Indicator 11.7.1.
Sentinel-2 proved valuable for broad-scale UGOS evaluations bearing in mind its accessibility and coverage. Yet, it tended to underestimate fragmented or fine-scale features like tree cover, capturing less than 10% of the area captured by VHR imagery in Mekelle and ∼50% of the area captured in Polokwane. Additionally, open space estimates from Sentinel-2 were up to 20% lower than those derived from VHR imagery. These discrepancies suggest that the choice of imagery can substantially affect conclusions about urban green and open space status and progress toward sustainability benchmarks. Lastly, data quality issues, such as limited resolution, seasonal variation, and gaps in reference datasets like OpenStreetMap, can further influence results.
For urban planners and policymakers, this highlights the importance of using the highest feasible resolution, while also considering spectral detail, when developing local land use strategies, particularly in heterogeneous areas. Trade-offs between image quality, accessibility, and cost must be carefully considered when selecting EO data for UGOS assessment, especially in data-scarce regions.
While the methods applied here are replicable, applying them in other rapidly urbanizing cities will require local tuning and validation. Future assessments should explore approaches such as data fusion, context-specific classifiers, and the integration of community-based or field validation data to enhance accuracy. Ultimately, scalable, transparent, and context-aware UGOS assessments are essential for supporting equitable, resilient, and sustainable urban development.
Data availability statement
The datasets presented in this study can be found in online repositories. The names of the repository/repositories and accession number(s) can be found below: https://doi.org/10.3334/ORNLDAAC/2413.
Author contributions
OC-R: Conceptualization, Data curation, Formal Analysis, Investigation, Methodology, Software, Validation, Visualization, Writing – original draft, Writing – review and editing. SS: Conceptualization, Data curation, Methodology, Software, Validation, Writing – review and editing. DR: Methodology, Software, Validation, Writing – review and editing. SF: Conceptualization, Writing – review and editing. ML: Conceptualization, Writing – review and editing. MM: Conceptualization, Writing – review and editing. JV: Conceptualization, Funding acquisition, Project administration, Resources, Supervision, Writing – review and editing.
Funding
The author(s) declare that financial support was received for the research and/or publication of this article. This research was funded by the NASA Land Cover and Land Use Change Program, grant number 80NSSC21K0313.
Acknowledgments
We would like to acknowledge Patrick Fekety and other members of the Vogeler Research Lab at Colorado State University for supporting this work.
Conflict of interest
The authors declare that the research was conducted in the absence of any commercial or financial relationships that could be construed as a potential conflict of interest.
Generative AI statement
The author(s) declare that no Generative AI was used in the creation of this manuscript.
Any alternative text (alt text) provided alongside figures in this article has been generated by Frontiers with the support of artificial intelligence and reasonable efforts have been made to ensure accuracy, including review by the authors wherever possible. If you identify any issues, please contact us.
Publisher’s note
All claims expressed in this article are solely those of the authors and do not necessarily represent those of their affiliated organizations, or those of the publisher, the editors and the reviewers. Any product that may be evaluated in this article, or claim that may be made by its manufacturer, is not guaranteed or endorsed by the publisher.
References
Aberra, Y. (2004). Problems of the solution: intervention into small-scale irrigation for drought proofing in the mekele Plateau of northern Ethiopia. Geogr. J. 170, 226–237. doi:10.1111/j.0016-7398.2004.00122.x
Adelina, C., Archer, D., Johnson, O., and Opiyo, R. O. (2020). Governing sustainability in secondary cities of the global south. SEI report. Stockholm: Stockholm Environment Institute.
Amani, M., Ghorbanian, A., Ahmadi, S. A., Kakooei, M., Moghimi, A., Mirmazloumi, S. M., et al. (2020). Google Earth engine cloud computing platform for remote sensing big data applications: a comprehensive review. IEEE J. Sel. Top. Appl. Earth Obs. Remote Sens. 13, 5326–5350. doi:10.1109/JSTARS.2020.3021052
Angel, S. (2023). Urban expansion: theory, evidence and practice. Build. Cities 4, 124–138. doi:10.5334/bc.348
Araya, A., and Stroosnijder, L. (2011). Assessing drought risk and irrigation need in Northern Ethiopia. Agric For Meteorol 151, 425–436. doi:10.1016/j.agrformet.2010.11.014
Asgedom, D. B. (2014). Assessing causes and challenges of urban water supply: the case of Mekelle City. Int. J. Sci. Res. 3, 2319–7064.
Author Anonymous (2025a). Available online at: https://Www.Macrotrends.Net/Global-Metrics/Cities/20929/Mekele/Population.
Author Anonymous (2025b). Available online at: https://Worldpopulationreview.Com/Cities/Ethiopia/Mekele.
Bai, Z., Wang, J., Wang, M., Gao, M., and Sun, J. (2018). Accuracy assessment of multi-source gridded population distribution datasets in China. Sustainability 10, 1363. doi:10.3390/su10051363
Belgiu, M., and Drăguţ, L. (2016). Random Forest in remote sensing: a review of applications and future directions. ISPRS J. Photogrammetry Remote Sens. 114, 24–31. doi:10.1016/j.isprsjprs.2016.01.011
Blaschke, T. (2010). Object based image analysis for remote sensing. ISPRS J. Photogrammetry Remote Sens. 65, 2–16. doi:10.1016/j.isprsjprs.2009.06.004
Cardenas-ritzert, O. S. E., Shah Heydari, S., Rode, D. T., and Vogeler, J. (2020). Urban land cover maps for mekelle, Ethiopia, and polokwane, South Africa.
Cardenas-Ritzert, O. S. E., Vogeler, J. C., Shah Heydari, S., Fekety, P. A., Laituri, M., and McHale, M. (2024). Automated geospatial approach for assessing SDG indicator 11.3.1: a multi-level evaluation of urban land use expansion across Africa. ISPRS Int. J. Geoinf 13, 226. doi:10.3390/ijgi13070226
Chamanara, S., and Kazemeini, A. (2016). Efficient multiscale approach for the integration of continuous multi-functional green infrastructure in Tehran City, Iran. Int. J. Urban Sustain. Dev. 8, 174–190. doi:10.1080/19463138.2016.1171773
Cilliers, E. (2015). The importance of planning for green spaces. Agric. For. Fish. 4, 1. doi:10.11648/j.aff.s.2015040401.11
City of Polokwane (2025). Integrated development plan. Available online at: https://www.polokwane.gov.za/wp-content/uploads/2023/07/2021-2026-Final-IDP.pdf.
Climate Data (2025). Available online at: https://En.Climate-Data.Org/Africa/Ethiopia/Tigray/Mek-Ele-3652/.
Demetriou, D. (2016). “Uncertainty of OpenStreetMap data for the road network in Cyprus,”. Proceedings of the Fourth international conference on remote sensing and geoinformation of the environment (RSCy2016). Editors K. Themistocleous, D. G. Hadjimitsis, S. Michaelides, and G. Papadavid (SPIE), 9688. doi:10.1117/12.2239612968806
Deur, M., Gašparović, M., and Balenović, I. (2021). An evaluation of Pixel- and object-based tree species classification in mixed deciduous forests using pansharpened very high spatial resolution satellite imagery. Remote Sens. (Basel) 13, 1868. doi:10.3390/rs13101868
Dong, J., Wang, Y., Yang, Y., Luo, X., and Wang, L. (2023). A multi-level framework for assessing the spatial equity of urban public space towards SDG 11.7.1 - a case Study in Beijing. Appl. Geogr. 161, 103142. doi:10.1016/j.apgeog.2023.103142
Drusch, M., Del Bello, U., Carlier, S., Colin, O., Fernandez, V., Gascon, F., et al. (2012). Sentinel-2: esa’s optical high-resolution Mission for GMES operational services. Remote Sens. Environ. 120, 25–36. doi:10.1016/j.rse.2011.11.026
Egerer, M., Annighöfer, P., Arzberger, S., Burger, S., Hecher, Y., Knill, V., et al. (2024). Urban oases: the social-ecological importance of small urban green spaces. Ecosyst. People 20, 2315991. doi:10.1080/26395916.2024.2315991
Endreny, T., Sica, F., and Nowak, D. (2020). Tree cover is unevenly distributed across cities globally, with lowest levels near highway pollution sources. Front. Sustain. Cities 2, 16. doi:10.3389/frsc.2020.00016
Fan, P., Xu, L., Yue, W., and Chen, J. (2017). Accessibility of public urban green space in an urban periphery: the case of Shanghai. Landsc. Urban Plan. 165, 177–192. doi:10.1016/j.landurbplan.2016.11.007
Fayaz, S., Wani, A. A., Gatoo, A. A., Islam, M. A., Murtaza, S., Sofi, K. A., et al. (2025). Forecasting land use in urban himalayas: a remote sensing-guided machine learning approach. Environ. Earth Sci. 84, 47. doi:10.1007/s12665-024-12060-9
Fenta, A. A., Yasuda, H., Haregeweyn, N., Belay, A. S., Hadush, Z., Gebremedhin, M. A., et al. (2017). The dynamics of urban expansion and land Use/Land cover changes using remote sensing and spatial metrics: the case of Mekelle City of Northern Ethiopia. Int. J. Remote Sens. 38, 4107–4129. doi:10.1080/01431161.2017.1317936
Forghani, M., and Delavar, M. R. (2014). A quality Study of the OpenStreetMap dataset for Tehran. ISPRS Int. J. Geoinf 3, 750–763. doi:10.3390/ijgi3020750
Georganos, S., Abascal, A., Kuffer, M., Wang, J., Owusu, M., Wolff, E., et al. (2021). Is it all the same? Mapping and characterizing deprived urban areas using WorldView-3 superspectral imagery. A case Study in Nairobi, Kenya. Remote Sens. (Basel) 13, 4986. doi:10.3390/rs13244986
Gilbert, K. M., and Shi, Y. (2023). Land Use/Land cover changes detection in Lagos city of Nigeria using remote sensing and GIS. Adv. Remote Sens. 12, 145–165. doi:10.4236/ars.2023.124008
Grizonnet, M., Michel, J., Poughon, V., Inglada, J., Savinaud, M., and Cresson, R. (2017). Orfeo ToolBox: open source processing of remote sensing images. Open Geospatial Data, Softw. Stand. 2, 15. doi:10.1186/s40965-017-0031-6
Haaland, C., and van den Bosch, C. K. (2015). Challenges and strategies for urban green-space planning in cities undergoing densification: a review. Urban For Urban Green 14, 760–771. doi:10.1016/j.ufug.2015.07.009
Hadush, T., and Gebrekiros, T. (2024). The contribution of open spaces in mekelle City on crop production during absolute siege in Tigray Region, Northern Ethiopia. Urban Agric. Regional Food Syst. 9, e20072. doi:10.1002/uar2.20072
Heinrigs, P. A. (2020). Understanding the dynamics of urbanization in Africa. Field Actions Sci. Rep., 22. Available Online at: http://journals.openedition.org/factsreports/6233 (December 9, 2021).
Hu, Z., Chu, Y., Zhang, Y., Zheng, X., Wang, J., Xu, W., et al. (2024). Scale matters: how spatial resolution impacts remote sensing based urban green space mapping? Int. J. Appl. Earth Observation Geoinformation 134, 104178. doi:10.1016/j.jag.2024.104178
Ismayilova, I., and Timpf, S. (2022). Classifying urban green spaces using a combined Sentinel-2 and random Forest approach. AGILE GIScience Ser. 3, 1–6. doi:10.5194/agile-giss-3-38-2022
Jim, C. Y. (2013). Sustainable urban greening strategies for compact cities in developing and developed economies. Urban Ecosyst. 16, 741–761. doi:10.1007/s11252-012-0268-x
Jones, H., Clench, B., and Harris, D. (2014). The governance of urban service delivery in developing countries. Literature review report. London, United Kingdom: Overseas Development Institute. Available Online at: https://cdn.odi.org/media/documents/8893.pdf.
Ju, Y., Dronova, I., and Delclòs-Alió, X. (2022). A 10 m resolution urban green space map for major Latin American cities from Sentinel-2 remote sensing images and OpenStreetMap. Sci. Data 9, 586. doi:10.1038/s41597-022-01701-y
Kiros, W. Ecosystem services demand and supply in a City Region: implications for regional spatial planning in Mekelle City.
Laituri, M., Cardenas-Ritzert, O. S. E., Vogeler, J. C., Shah Heydari, S., and McHale, M. R. (2025). The last urban Frontier—Assessing hotspots of urban change associated with LCLUC in Africa. Front. Sustain. Cities 7, 1529440. doi:10.3389/frsc.2025.1529440
Láng-Ritter, J., Keskinen, M., and Tenkanen, H. (2025). Global gridded population datasets systematically underrepresent rural population. Nat. Commun. 16, 2170. doi:10.1038/s41467-025-56906-7
Le Saint, T., Nabucet, J., Lefebvre, S., Gastellu-Etchegorry, J.-P., Hubert-Moy, L., and Adeline, K. (2024). Sensitivity analysis of Sentinel-2 imagery to assess urban tree functional traits: a physical approach based on local climate zones. Remote Sens. (Basel) 16, 4402. doi:10.3390/rs16234402
Lee, A. C. K., and Maheswaran, R. (2011). The health benefits of urban green spaces: a review of the evidence. J. Public Health (Bangkok) 33, 212–222. doi:10.1093/pubmed/fdq068
Liu, D., and Xia, F. (2010). Assessing object-based classification: advantages and limitations. Remote Sens. Lett. 1, 187–194. doi:10.1080/01431161003743173
López-Lambas, M. E., Sánchez, J. M., and Alonso, A. (2021). The walking health: a route choice model to analyze the street factors enhancing active mobility. J. Transp. Health 22, 101133. doi:10.1016/j.jth.2021.101133
Lotfata, A. (2021). Using remote sensing in monitoring the urban green spaces: a case Study in Qorveh, Iran. Eur. J. Environ. Earth Sci. 2, 11–15. doi:10.24018/ejgeo.2021.2.1.102
Ludwig, C., Hecht, R., Lautenbach, S., Schorcht, M., and Zipf, A. (2021). Mapping public urban green spaces based on OpenStreetMap and Sentinel-2 imagery using belief functions. ISPRS Int. J. Geoinf 10, 251. doi:10.3390/ijgi10040251
Lv, Z., Li, G., Jin, Z., Benediktsson, J., and Foody, G. (2020). Iterative training sample expansion to increase and balance the accuracy of land classification from VHR imagery.
Ma, J., Sun, Y., Meng, D., Huang, S., Li, N., and Zhu, H. (2021). “Accuracy assessment of two global gridded population dataset: a case Study in China,” in Proceedings of the proceedings of the 4th international conference on information science and systems (New York, NY, USA: Association for Computing Machinery), 120–125.
Maseko, M. S. T., Zungu, M. M., Ehlers Smith, D. A., Ehlers Smith, Y. C., and Downs, C. T. (2019). High microhabitat heterogeneity drives high functional traits in Forest birds in five protected Forest areas in the urban Mosaic of Durban, South Africa. Glob. Ecol. Conserv. 18, e00645. doi:10.1016/j.gecco.2019.e00645
Maurer, T. (2013). How to pan-sharpen images using the gram-schmidt pan-sharpen Method–A recipe. Int. Archives Photogrammetry, Remote Sens. Spatial Inf. Sci. 40, 239–244. doi:10.5194/isprsarchives-xl-1-w1-239-2013
Mokoele, N. (2023). Complexities of contemporary urban planning in local government in the City of polokwane, Limpopo Province. Jàmbá J. Disaster Risk Stud. 15, 1326. doi:10.4102/jamba.v15i1.1326
Momeni, R., Aplin, P., and Boyd, D. S. (2016). Mapping complex urban land cover from spaceborne imagery: the influence of spatial resolution, spectral band set and classification approach. Remote Sens. (Basel) 8, 88. doi:10.3390/rs8020088
Morabito, M., Crisci, A., Guerri, G., Messeri, A., Congedo, L., and Munafò, M. (2021). Surface urban heat Islands in Italian metropolitan cities: tree cover and impervious surface influences. Sci. Total Environ. 751, 142334. doi:10.1016/j.scitotenv.2020.142334
Moskal, L. M., Styers, D. M., and Halabisky, M. (2011). Monitoring urban tree cover using object-based image analysis and public domain remotely sensed data. Remote Sens. (Basel) 3, 2243–2262. doi:10.3390/rs3102243
Mudau, N., and Mhangara, P. (2023). Mapping and assessment of housing informality using object-based image analysis: a review. Urban Sci. 7, 98. doi:10.3390/urbansci7030098
Mugiraneza, T., Nascetti, A., and Ban, Y. (2020). Continuous monitoring of urban land cover change trajectories with landsat time series and LandTrendr-Google Earth engine cloud computing. Remote Sens. (Basel) 12, 2883. doi:10.3390/rs12182883
Myint, S. W., Mesev, V., Quattrochi, D., and Wentz, E. A. (2024). “Urban image classification: per-pixel classifiers, sub-pixel analysis, object-based image analysis, geospatial methods, and machine learning approach,” in Remote Sensing Handbook, Volume II (Six Volume Set): Image Processing, Change Detection, GIS, and Spatial Data Analysis, 2nd Edn CRC Press, 2, 50–65. doi:10.1201/9781003541158-4
Nemec, K. T., and Raudsepp-Hearne, C. (2013). The use of geographic information systems to map and assess ecosystem services. Biodivers. Conserv. 22, 1–15. doi:10.1007/s10531-012-0406-z
Nethery, R. C., Rushovich, T., Peterson, E., Chen, J. T., Waterman, P. D., Krieger, N., et al. (2021). Comparing denominator sources for real-time disease Incidence Modeling: American Community Survey and WorldPop. SSM Popul. Health 14, 100786. doi:10.1016/j.ssmph.2021.100786
Njoh, A. J., Fisseha, S. H., Goa, A., and Gebremichael, D. (2020). Street and property identification and the challenge of urban management in mekelle city, Ethiopia. J. Asian Afr. Stud. 56, 455–479. doi:10.1177/0021909620926536
Noelke, N. (2021). Continuous urban tree cover mapping from landsat imagery in Bengaluru, India. Forests 12, 220. doi:10.3390/f12020220
Nshimiyimana, A., Niyigena, E., Nyandwi, E., Ngwijabagabo, H., and Rugengamanzi, G. (2023). Spatial assessment of urban growth on green spaces in Rwanda: an Insight from rebero Mountain landscape in Kicukiro District, City of Kigali. Rwanda J. Eng. Sci. Technol. Environ. 5, 1–24. doi:10.4314/rjeste.v5i1.5
Nuthammachot, N., and Ali, M. Z. (2025). Comparative Study of multiple algorithms classification for land use and land cover change detection and its impact on local climate of Mardan District, Pakistan. Environ. Challenges 18. doi:10.1016/j.envc.2024.101069
Olofsson, P., Foody, G. M., Herold, M., Stehman, S. V., Woodcock, C. E., and Wulder, M. A. (2014). Good practices for estimating area and assessing accuracy of land change. Remote Sens. Environ. 148, 42–57. doi:10.1016/j.rse.2014.02.015
Oyedotun, T. D. T. (2017). Ensuring water availability in Mekelle City, Northern Ethiopia: evaluation of the water supply sub-project. Appl. Water Sci. 7, 4165–4168. doi:10.1007/s13201-017-0568-7
Palanisamy, P. A., Jain, K., Tiwari, A., Zawadzka, J., and Bonafoni, S. (2024). “Evaluating the persistence urban heat Island and its impact on vulnerable populations,” in Proceedings of the IGARSS 2024 - 2024 IEEE international geoscience and remote sensing symposium, 4032–4035.
Panaglobo Consulting on behalf of Digital Earth Africa (2022). Analysis read data. a smart way to use Earth observation for Africa’s rising nations. Insight Report. Available online at: https://digitalearthafrica.org/wp-content/uploads/Master-Report-ARD-for-Africa-May-2022.pdf (Accessed May 2022).
Panđa, L., Radocaj, D., and Milošević, R. (2024). Methods of land cover classification using Worldview-3 satellite images in land management. Teh. Glas. 18, 142–147. doi:10.31803/tg-20221006135311
Puplampu, D., and Boafo, Y. (2021). Exploring the impacts of urban expansion on green spaces availability and delivery of ecosystem services in the Accra Metropolis. Environ. Challenges 5, 100283. doi:10.1016/j.envc.2021.100283
Rakhshandehroo, M., Yusof, M. J. M., Arabi, R., Parva, M., and Nochian, A. (2017). The environmental benefits of urban open green spaces. Alam Cipta 10, 10–16.
Rakuasa, H., and Lasaiba, M. A. (2024). Future population prediction 2050 of banten province, jakarta, jawa barat, jawa tengah, daerah istimewa yogjakarta, jawa timur, using worldpop data with google earth engine. J. Data Anal. Inf. Comput. Sci. 1, 79–86. doi:10.59407/jdaics.v1i2.712
Recanatesi, F., De Santis, A., Gatti, L., Patriarca, A., Caputi, E., Mancini, G., et al. (2025). A comparative analysis of spatial resolution Sentinel-2 and pleiades imagery for mapping urban tree species. Land (Basel) 14, 106. doi:10.3390/land14010106
Rigolon, A., Browning, M. H. E. M., Lee, K., and Shin, S. (2018). Access to urban green space in cities of the global south: a systematic literature review. Urban Sci. 2, 67. doi:10.3390/urbansci2030067
Rotich, R., and Opiyo, R. (2022). Application of GIS and remote sensing in monitoring effects of urban sprawl in urban Kenya: a case Study of eldoret municipality, 17, 2447–2460.
SDG Indicators Metadata repository (2020). UN-Habitat metadata on SDGs indicator 11.7.1 indicator category: tier II.
Shah Heydari, S., and Vogeler, J. (2024). Annual land use and urban land cover maps: ethiopia, Nigeria, and South Africa 2016-2020. doi:10.3334/ORNLDAAC/2367
Shah Heydari, S., Vogeler, J. C., Cardenas-Ritzert, O. S. E., Filippelli, S. K., McHale, M., and Laituri, M. (2024). Multi-Tier land use and land cover mapping framework and its application in urbanization analysis in three African countries. Remote Sens. (Basel) 16, 2677. doi:10.3390/rs16142677
Sharma, K., Tiwari, R., Wadhwani, A. K., and Chaturvedi, S. (2024). Evaluating the impact of land use land cover changes on urban ecosystem services in nashik, India: a RS-GIS based approach. Environ. Earth Sci. 83, 683. doi:10.1007/s12665-024-11965-9
Thomson, D. R., Leasure, D. R. A. N. D. B. T. A. N. D. T. N. A. N. D. T. A. J., Bird, T., Tzavidis, N., and Tatem, A. J. (2022). How accurate are worldpop-global-unconstrained gridded population data at the Cell-Level? a simulation analysis in urban Namibia. PLoS One 17, e0271504–e0271523. doi:10.1371/journal.pone.0271504
Törnros, T., Dorn, H., Hahmann, S., and Zipf, A. (2015). Uncertainties of completeness measures in openstreetmap – a case study for buildings in a medium-sized german city. isprs annals of the photogrammetry, remote sensing and spatial information sciences, 353–357. doi:10.5194/isprsannals-II-3-W5-353-2015
Troy, A., and Wilson, M. A. (2006). Mapping ecosystem services: practical challenges and opportunities in linking GIS and value transfer. Ecol. Econ. 60, 435–449. doi:10.1016/j.ecolecon.2006.04.007
Turner-Skoff, J. B., and Cavender, N. (2019). The benefits of trees for livable and sustainable communities. PLANTS, PEOPLE, PLANET 1, 323–335. doi:10.1002/ppp3.39
Twumasi, Y., Merem, E., Namwamba, J. B., Mwakimi, O., Ayala Silva, T., Abdollahi, K., et al. (2020). Degradation of urban green spaces in Lagos, Nigeria: evidence from satellite and demographic data. Adv. Remote Sens. 09, 33–52. doi:10.4236/ars.2020.91003
UN-HABITAT (2013). Streets as public spaces and drivers of urban prosperity. Nairobi. 978 (92), 132590–132594. Available online at: https://unhabitat.org/sites/default/files/2020/08/streets_as_public_spaces_and_drivers_of_urban_prosperity.pdf.
UN-Habitat GLOBAL PUBLIC SPACE PROGRAMME Annual Report 2022 (2022). Reflections on a decade of public space.
UN-Habitat (2018). SDG Indicator 11.7.1 Training Module: Public Space. United Nations Human Settlement Programme (UN-Habitat), Nairobi. https://unhabitat.org/sites/default/files/2020/07/indicator_11.7.1_training_module_public_space.pdf.
United Nations Transforming Our World (2015). The 2030 agenda for sustainable development transforming our world: the 2030 agenda for sustainable development preamble.
Varin, M., Chalghaf, B., and Joanisse, G. (2020). Object-Based approach using very high spatial resolution 16-Band WorldView-3 and LiDAR data for tree species classification in a broadleaf Forest in Quebec, Canada. Remote Sens. (Basel) 12, 3092. doi:10.3390/rs12183092
Verde, N., Patias, P., and Mallinis, G. (2022). A cloud-based mapping approach using deep learning and very-high spatial resolution Earth observation data to facilitate the SDG 11.7.1 indicator computation. Remote Sens. (Basel) 14, 1011. doi:10.3390/rs14041011
Weldegebriel, S., and Yeshitela, K. (2021). The dynamics of land use land cover and its driving forces in Mekelle City Region, Ethiopia. Asian Rev. Environ. Earth Sci. 8, 18–29. doi:10.20448/journal.506.2021.81.18.29
Weng, Q. (2012). Remote sensing of impervious surfaces in the urban areas: requirements, methods, and trends. Remote Sens. Environ. 117, 34–49. doi:10.1016/j.rse.2011.02.030
Wiki, O. S. M. (2025). About OpenStreetMap — OpenStreetMap wiki. Available online at: https://wiki.openstreetmap.org/w/index.php?title=About_OpenStreetMap&oldid=2310396.
Wilson, R. T. (2020). The greening of mekelle, Capital City of Tigray in Northern Ethiopia. Int. J. Res. Environ. Sci. 6, 1–9. doi:10.20431/2454-9444.0601001
Wood, E. M., and Esaian, S. (2020). The importance of street trees to urban Avifauna. Ecol. Appl. 30, e02149. doi:10.1002/eap.2149
WorldPop Gridded population estimate datasets and tools. Available online at: https://www.worldpop.org/methods/populations/.
Xiao, J., Chen, L., Zhang, T., Li, L., Yu, Z., Wu, R., et al. (2022). Identification of urban green space types and estimation of above-ground biomass using Sentinel-1 and Sentinel-2 data. Forests 13, 1077. doi:10.3390/f13071077
Xin, Y. (2024). Symbolic illusions, unlivable realities: a comparative urban history of twentieth-century athens and beijing. doi:10.31124/advance.171535249.94881832/v1
Xu, F., Heremans, S., and Somers, B. (2022). Urban land cover mapping with Sentinel-2: a spectro-spatio-temporal analysis. Urban Inf. 1, 8. doi:10.1007/s44212-022-00008-y
Keywords: SDGs, urban Africa, Sentinel-2, PlanetScope SuperDove, Maxar WorldView-3
Citation: Cardenas-Ritzert OSE, Shah Heydari S, Rode DT, Filippelli SK, Laituri M, McHale MR and Vogeler JC (2025) The role of data selection in mapping urban green and open spaces: a comparison across high and very-high resolution satellite imagery sources in two African cities. Front. Remote Sens. 6:1625373. doi: 10.3389/frsen.2025.1625373
Received: 08 May 2025; Accepted: 15 August 2025;
Published: 15 September 2025.
Edited by:
Ahmet Cilek, Çukurova University, TürkiyeReviewed by:
Aysun Aygün Oğur, Pamukkale University, TürkiyeMoh. Dede, Indonesia University of Education, Indonesia
Zhongwen Hu, Shenzhen University, China
Copyright © 2025 Cardenas-Ritzert, Shah Heydari, Rode, Filippelli, Laituri, McHale and Vogeler. This is an open-access article distributed under the terms of the Creative Commons Attribution License (CC BY). The use, distribution or reproduction in other forums is permitted, provided the original author(s) and the copyright owner(s) are credited and that the original publication in this journal is cited, in accordance with accepted academic practice. No use, distribution or reproduction is permitted which does not comply with these terms.
*Correspondence: Jody C. Vogeler, Sm9keS5Wb2dlbGVyQGNvbG9zdGF0ZS5lZHU=