 Yuekui Yang
 Surendra Bhatta
 Alfonso Delgado-Bonal
- 1Climate and Radiation Laboratory, NASA Goddard Space Flight Center, Greenbelt, MD, United States
- 2Morgan State University, Baltimore, MD, United States
- 3University of Maryland Baltimore County, Baltimore, MD, United States
This study presents a decadal analysis of global daytime cloud properties using observations from the Earth Polychromatic Imaging Camera (EPIC) aboard the Deep Space Climate Observatory (DSCOVR) satellite from July 2015 to December 2024. We focus on cloud fraction and cloud effective height (CEH) from the EPIC standard Level-2 (L2) cloud products. Consistent with other satellite observations, the EPIC-derived decadal global cloud fraction shows high cloudiness over tropical convergence zones and midlatitude storm tracks and reduced cloud cover over subtropical regions associated with the descending branches of the Hadley circulation. Seasonal analysis shows greater variability over land, while cloud fraction remains consistently higher over oceans. Trend analysis using the Mann–Kendall and Theil–Sen methods identifies a statistically significant decreasing trend in the cloud fraction over land (−0.0329 per decade, p = 0.014), primarily confined to the Northern Hemisphere. No significant trend is found over ocean or in the CEH. Spatial trend maps highlight that the regional cloud fraction decreases over the western tropical Pacific and central Africa and increases over parts of the midlatitude oceans. These results demonstrate EPIC’s capability in tracking global and regional cloud variability and contribute to our understanding of cloud–climate interactions.
1 Introduction
Clouds play a critical role in Earth’s climate system by regulating the planet’s energy budget (Boucher et al., 2013; Loeb et al., 2024; Voigt et al., 2021). Significant progress has been made in the past decade in characterizing cloud properties at both the regional and global scales through space-based observations (Stephens et al., 2018; Shang et al., 2018; Yang et al., 2020). Recent advances in cloud climatology increasingly highlight that changes in cloud properties are contributing to Earth’s energy imbalance and climate variability (Tselioudis et al., 2024). Using measurements from NASA’s Clouds and the Earth’s Radiant Energy System (CERES), Loeb et al. (2024) showed that Earth’s energy imbalance has nearly doubled since 2000, driven primarily by increased absorption of solar radiation due to decreasing low- and mid-level clouds. Goessling et al. (2024) identified a record-low planetary albedo in 2023 that can also be linked to a sharp decrease in low- and mid-level cloud cover, particularly over tropical and northern midlatitude regions, which helped explain the unprecedented surge in global surface temperatures that year.
Sustained observations on a global scale are essential for detecting trends in cloud properties. In that regard, the Earth Polychromatic Imaging Camera (EPIC) aboard the Deep Space Climate Observatory (DSCOVR) provides a unique dataset that complements observations from geostationary or polar-orbiting sensors. From the Earth’s L1 Lagrangian point approximately one million miles away, EPIC started to make observations in June 2015 (Marshak et al., 2018). Since then, except from July 2019 to January 2020 when DSCOVR was in the safehold mode due to degradation of the inertial navigation unit (gyros), EPIC has been providing continuous observations of the sunlit side of the Earth with 10 spectral channels ranging from the UV to the near-IR. These observations provided new opportunities in atmospheric research and applications. One important contribution of EPIC is the ability to observe and retrieve key radiative properties of clouds, which are of critical importance for understanding the current Earth system and for predicting future changes.
The EPIC Level-2 (L2) cloud products include cloud mask, cloud effective pressure (CEP), cloud effective height (CEH), cloud optical thickness (COT), most likely cloud thermodynamic phase, and cloud effective temperature (Yang et al., 2013; Yang et al., 2019; Meyer et al., 2016; Zhou et al., 2020; Zhou et al., 2021; Gao et al., 2019). These products are derived using multi-spectral information, particularly from oxygen A- and B-band absorption features, and have been evaluated against colocated measurements from other satellite sensors. Yang et al. (2019) demonstrated that the global cloud fraction retrieved from EPIC agrees closely with collocated observations from geostationary and low Earth orbit satellites, with an average difference of 1.1%. The retrieved CEH values show good consistency with results from radiative transfer simulations.
Since their public release, the EPIC L2 cloud products have been used in a range of scientific and operational applications. These include cloud diurnal cycle analysis (Delgado-Bonal et al., 2020; Delgado-Bonal et al., 2021; Delgado-Bonal et al., 2022; Delgado-Bonal et al., 2024), trace gas retrieval correction (Kramarova et al., 2021; Huang and Yang, 2022), surface solar radiation studies (Hao et al., 2019; Hao et al., 2020), and cloud complexity analysis (DeWitt et al., 2024; Rees et al., 2024).
This study focuses on the use of EPIC L2 cloud mask and cloud effective height products to examine global daytime cloud characteristics and potential trends over the period from July 2015 to December 2024, spanning nearly a decade of observations. The analysis provides new insights into global cloud coverage and height variability.
2 Data and Methodology
Data used in this study are the standard EPIC Level-2 cloud products, version 3 (available at https://doi.org/10.5067/EPIC/DSCOVR/L2_CLOUD_03), covering the period from December 2015 to December 2024. EPIC observes the entire sunlit side of the Earth and provides measurements with a native spatial resolution of approximately 10 km at nadir and a temporal sampling frequency of 60–110 min, depending on the season. All the L2 cloud products are provided at the EPIC original temporal and spatial resolutions.
To enable time-series analysis, the EPIC Level-2 cloud data were first re-gridded onto a 0.5° latitude × 0.625° longitude grid, consistent with the spatial resolution used by the Modern-Era Retrospective Analysis for Research and Applications, Version 2 (MERRA-2) products. The resulting gridded data were then aggregated to form monthly mean cloud fraction and cloud height fields for each grid point.
Following the gridding and monthly averaging, we performed trend analysis on the time series at each grid cell and for global/regional averages. The Mann–Kendall trend test was used to detect the presence of a statistically significant monotonic trend, with a null hypothesis of no trend and a significance threshold of p < 0.05 (Kendall, 1975). The Theil–Sen estimator (Sen, 1968) was applied to quantify the magnitude of the trend. This non-parametric method is robust to outliers and does not require data to follow a normal distribution, making it well-suited for satellite-derived time series.
Trend analyses were performed globally, separately for land and ocean, and by hemisphere to evaluate regional differences. We also generated spatially resolved maps of the Theil–Sen slope and corresponding p-values to assess the geographic distribution of statistically significant trends. To account for the known data gap from July 2019 to January 2020, we excluded these months from both the monthly mean time series and trend analysis. The Mann–Kendall and Theil–Sen methods were applied to the remaining non-missing monthly values. As both techniques are non-parametric and robust to uneven sampling, no interpolation was applied to fill the gap.
3 Results
3.1 Decadal global daytime cloud coverage and trend
Figure 1 presents the mean daytime cloud fraction over the globe derived from DSCOVR–EPIC observations between July 2015 and December 2024. As expected, high cloud fractions are observed over tropical convergence zones such as the Intertropical Convergence Zone (ITCZ), midlatitude storm tracks in both hemispheres, and the South Pacific Convergence Zone (SPCZ), which is a diagonally oriented band of deep convection and cloudiness that extends southeastward from the western Pacific warm pool into the central South Pacific. Lower cloud fractions are observed over subtropical regions dominated by air subsidence, such as the Sahara Desert and Arabian Peninsula. These cloud fraction zonal structures reflect the influence of global circulation patterns such as the Hadley cell. Overall, the figure captures fundamental features of global cloud climatology, consistent with other satellite observations (King et al., 2013; Rossow and Schiffer, 1999).
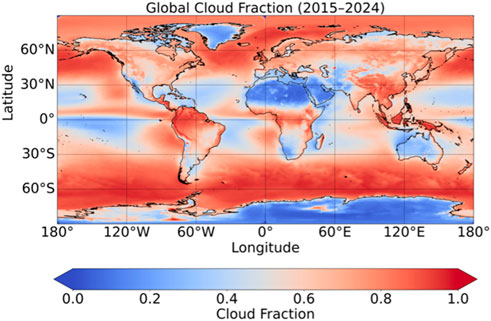
Figure 1. Global daytime mean cloud fraction map based on EPIC observations from July 2015 to December 2024.
The EPIC cloud mask algorithm is designed separately for each of the three surface types: land, ocean, and snow/ice (Yang et al., 2019). Among these, cloud detection over snow- and ice-covered regions carries larger uncertainty due to low surface–cloud contrast and limited spectral information. As a result, retrievals over snow- and ice-covered areas are excluded from analyses hereafter. Table 1 provides the values of seasonal and annual mean cloud fraction from EPIC observations during the period from July 2015 to December 2024. As shown, global daytime mean cloud fraction is consistently higher over oceans than over land across all seasons, with maximum cloudiness during the December–January–February (DJF) season in both regions. The seasonal cycle is stronger over land, reflecting continental convection patterns.
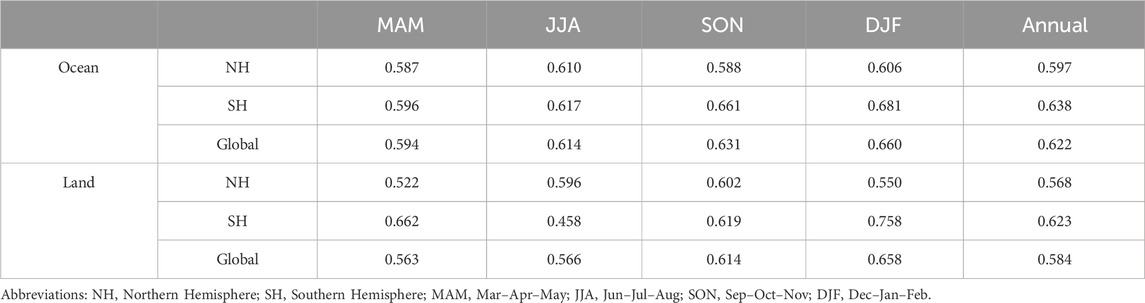
Table 1. Global seasonal and annual mean cloud fraction from EPIC observations during the period of July 2015 to December 2024.
Figure 2 provides the time series of monthly mean daytime cloud fraction over land, ocean, and the global average (land + ocean). These time series show a clear and consistent seasonal cycle in all three domains, with peaks in the cloud fraction generally occurring during boreal winter months. Ocean cloud fraction is consistently higher than that over land, likely due to persistent marine stratiform cloud decks and less seasonal variability. The global mean closely follows the ocean curve, reflecting the greater spatial extent of oceanic observations. The land cloud fraction shows a broader seasonal variation, with more pronounced peaks and troughs, reflecting stronger seasonal variability in continental convection.
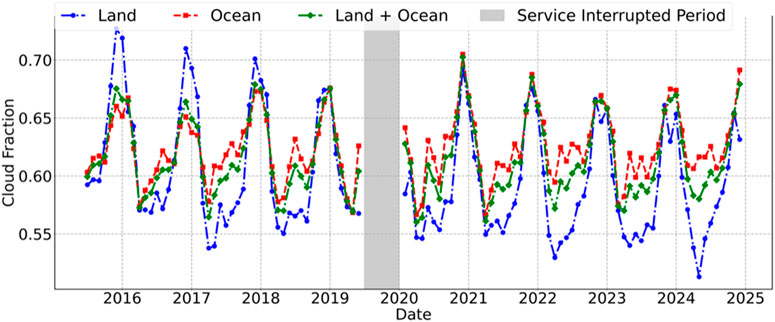
Figure 2. Global monthly mean cloud fraction time series over land (blue), ocean (red), and overall (green) based on EPIC observations from July 2015 to December 2024. Data gap (gray area) marks the period between July 2019 and January 2020 when DSCOVR was on the safehold mode.
To assess potential trends in the cloud fraction over time, we applied the Mann–Kendall test, a non-parametric method commonly used to detect the presence of monotonic trends in time-series data without assuming a specific distribution (Kendall, 1975). If a statistically significant trend is identified (p-value <0.05), the Theil–Sen estimator is then used to quantify the trend magnitude (Sen, 1968). The Theil–Sen method calculates the median of all pairwise slopes in the dataset, providing a robust estimate that is less sensitive to outliers than traditional linear regression.
These tests were applied to the cloud fraction time series over land, ocean, and the combined land–ocean regions. Although no trend was found over the ocean, a statistically significant trend was detected over land, with a p-value of 0.014 and a decreasing trend of −0.0329 per decade (Figure 3). This decreasing trend in cloud coverage over land is consistent with that reported by Liu et al. (2023), which is based on data from ERA5 reanalysis (1979–2020) (Hersbach et al., 2020). They attributed the reduction in land cloud cover primarily to declining near-surface relative humidity, a factor that limits cloud formation over land. Liu et al. (2023) also reported an increasing trend in cloud coverage over ocean, but the increase was observed mainly before 2001, which is before the EPIC era.
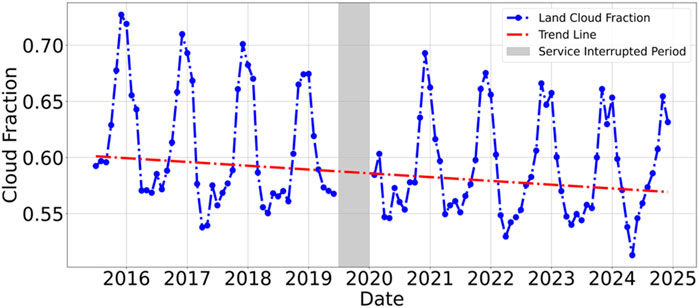
Figure 3. Same as Figure 2, but for the trend analysis of the global monthly mean cloud fraction over land.
To identify geographic regions with significant long-term changes in cloud coverage during the EPIC observational period, the spatial distribution of statistically significant trends is shown in Figure 4. As shown in the figure, although global means may show weak or non-significant trends, spatially resolved analysis reveals regional variability and areas undergoing statistically significant increases or decreases in cloudiness. Figure 4a shows the locations where trends are statistically significant (p < 0.05), and Figure 4b presents the corresponding trend values. Notable features include statistically significant decreasing trends (blue in panel b) over parts of the western tropical Pacific, East Asia, and Central Africa, indicating reduced convective cloudiness in these regions. Conversely, increasing trends (orange to red) are observed in parts of the midlatitude oceans, potentially linked to regional circulation shifts or moisture flux changes (Liu et al., 2023; Lu et al., 2007). The pattern reveals a mix of regional cloud changes, with ocean regions generally showing more significant increasing trends than land. These results highlight the importance of spatial analysis in understanding cloud variability and demonstrate EPIC’s ability to detect regional signals over a decadal timescale.
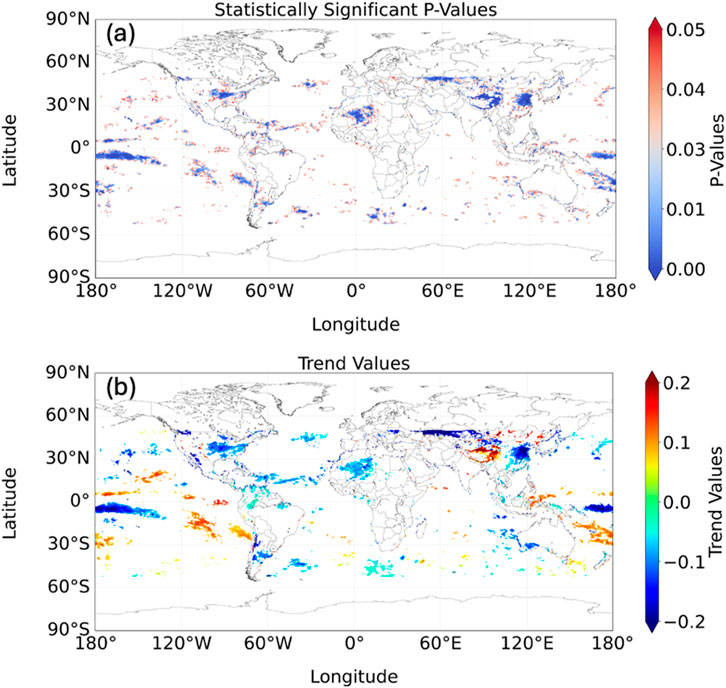
Figure 4. Global daytime mean cloud coverage trend analysis based on EPIC observations from July 2015 to December 2024. (a) p-value map for locations identified as having a statistically significant trend (p < 0.05) and (b) corresponding cloud fraction trend values (per decade).
Figure 4 demonstrates that most of the decreasing trend over land is in the Northern Hemisphere. Time-series analysis confirms this observation. As shown in Figure 5, a statistically significant trend was found over Northern Hemisphere land, with a p-value of 0.0041 and a decreasing trend of −0.056 per decade, while no trend was detected over the Southern Hemisphere.
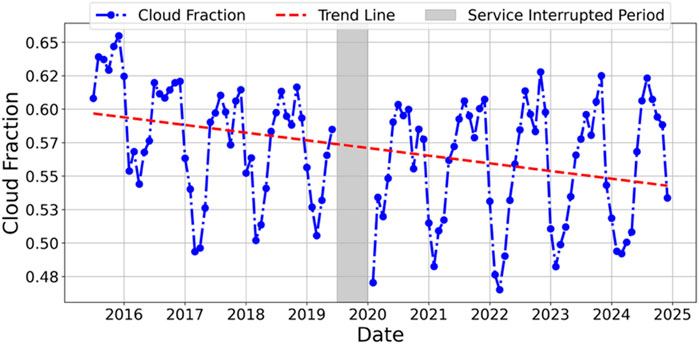
Figure 5. Same as Figure 2, but for the trend analysis of Northern Hemisphere monthly mean cloud fraction over land.
To investigate the spatiotemporal variability of the global daytime cloud fraction, we generated both longitudinal (longitude–time) (Figure 6) and zonal (latitude–time) (Figure 7) Hovmöller diagrams. These diagnostics provide a representation of how cloud fraction evolves seasonally and interannually across different geographic bands.
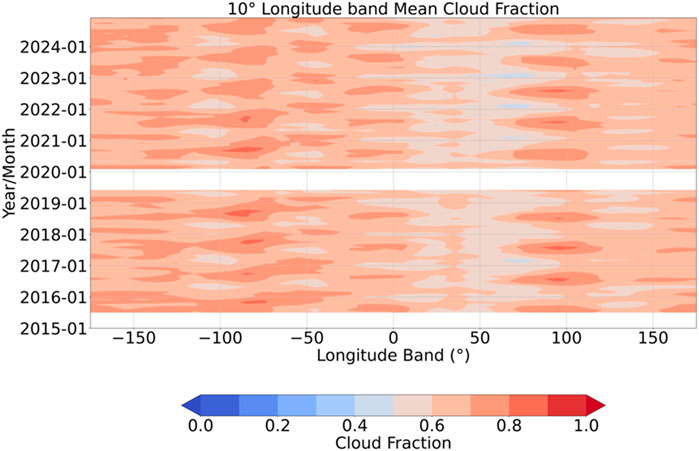
Figure 6. Longitudinal cloud fraction Hovmöller diagram showing the 10° longitude-band mean cloud fraction based on EPIC observations from July 2015 to December 2024.
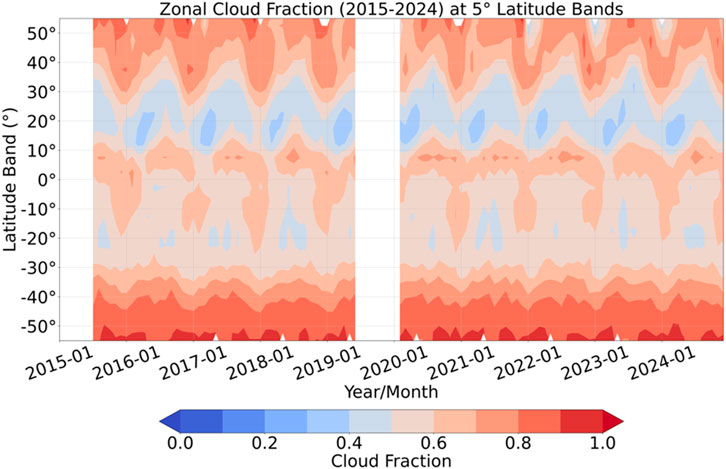
Figure 7. Zonal cloud fraction Hovmöller diagram showing the 5° zonal mean cloud fraction based on EPIC observations from July 2015 to December 2024.
The longitudinal Hovmöller diagram (Figure 6) illustrates stable, structured patterns in the global daytime cloud fraction across longitudes from 2015 to 2024. Persistently, cloudy regions are evident over the central Pacific and Indian Ocean, while lower cloud fractions occur over subtropical dry zones. The cloud fraction patterns are stable over time, suggesting limited interannual variability in zonal-mean cloudiness at this spatial scale. No obvious large-scale transitions or regime shifts are evident. Wave-like features at several longitudes (e.g., approximately 100°E) reflect the seasonal variability in cloud fraction.
The zonal Hovmöller diagram (Figure 7) reveals clear seasonal migration of cloud belts, particularly in the tropics and subtropics. The ITCZ, characterized by enhanced cloudiness near the equator, shifts northward during boreal summer (JJA) and southward during austral summer (DJF), reflecting the annual cycle of solar heating and monsoon activity. The pronounced high cloud fraction regions in midlatitudes reflect strong seasonal variability associated with storm tracks. In contrast, subtropical regions (e.g., 10°–30° latitude) exhibit more persistent low cloud fractions, consistent with the descending branches of the Hadley circulation.
3.2 Decadal global daytime cloud effective height
CEH is retrieved using the Mixed Lambertian-Equivalent Reflectivity (MLER) model (Koelemeijer et al., 2001; Yang et al., 2013). The MLER model assumes that a pixel contains two Lambertian reflectors: the surface and the cloud. The cloud is assumed opaque; hence, no photon transmission occurs. The retrieved CEH reflects the mean altitude from which light is scattered. The EPIC L2 cloud product system retrieves two CEH values with observations from the O2 A-band (779.5 nm and 764 nm) and B-band (680 nm and 688 nm) pairs. These two values are highly correlated (Yang et al., 2013). This study uses the A-band CEH. Due to photon penetration into the cloud, the retrieved CEH generally corresponds to the effective scattering height, which is typically lower than the physical cloud-top height. The difference between the actual cloud top and CEH is a function of the cloud extinction profile (Yang et al., 2019).
Figure 8 shows the global mean CEH retrieved by DSCOVR–EPIC for the period July 2015 to December 2024. Much of the oceanic regions (e.g., Eastern Pacific and South Atlantic) show low effective cloud heights (1–3 km), indicating marine stratocumulus and trade cumulus layers. The ITCZ is clearly observed as a band of elevated CEH (∼5–8 km) near the equator. The map shows distinct high-cloud regions over the Himalayas and the Tibetan Plateau, consistent with orographic uplift and elevated terrain influencing cloud height.
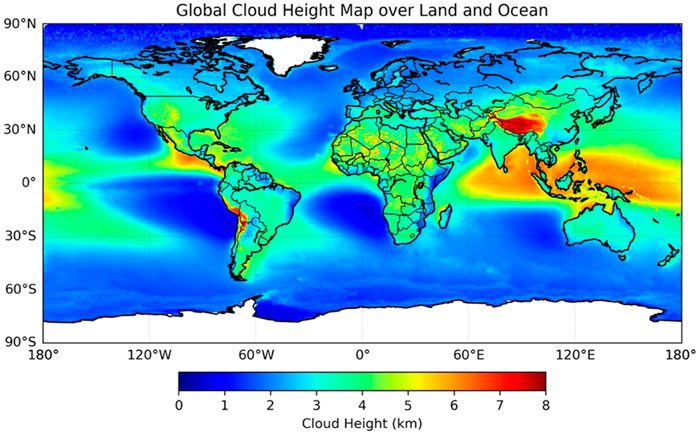
Figure 8. Global mean effective cloud height retrieved by DSCOVR-EPIC for the period July 2015 to December 2024, based on Oxygen A-band absorption measurements. Snow- and ice-covered regions have been excluded from the analysis.
Table 2 presents the seasonal and annual mean CEH. Across all seasons, CEH is consistently higher over land than over ocean, likely due to the deeper daytime convection over continental regions. CEH over land exhibits relatively little seasonal variability, ranging from 3.41 km to 3.55 km.
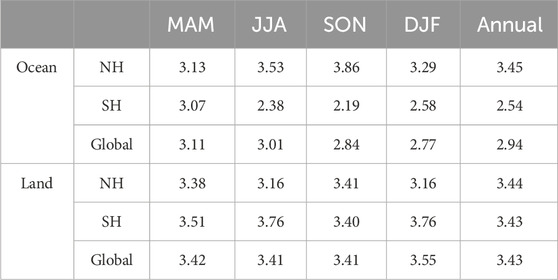
Table 2. Global seasonal and annual mean effective cloud height from EPIC observations during the period of July 2015 to December 2024.
Figure 9 presents the monthly mean effective cloud height over land, ocean, and the globe (land + ocean) from EPIC observations spanning July 2015 to December 2024. The figure reinforces the results presented in Table 2, illustrating that CEH is consistently higher over land than over ocean and that seasonal variability is more pronounced over the ocean. Additionally, the global mean CEH closely follows the oceanic signal, reflecting the greater data volume contributed by ocean observations relative to land. The Mann–Kendall trend test was applied to these time series, and no statistically significant trends were detected.
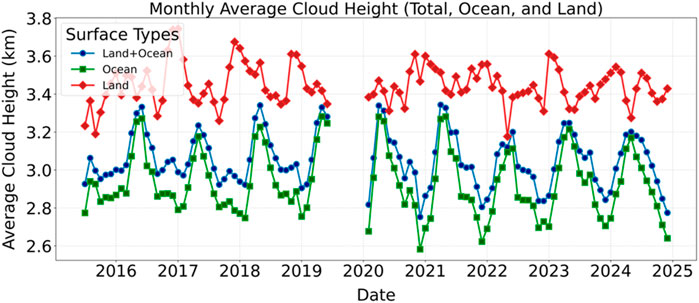
Figure 9. Monthly mean effective cloud height over land, ocean, and the global mean (land + ocean) from EPIC observations spanning July 2015 to December 2024.
4 Summary
This study presents a decadal analysis of global daytime cloud fraction and effective cloud height using observations from the EPIC aboard the DSCOVR satellite, from July 2015 to December 2024. The analysis is based on standard EPIC L2 cloud products, re-gridded to a 0.5° × 0.625° Modern-Era Retrospective Analysis for Research and Applications, Version 2 (MERRA-2) grid and aggregated into monthly means for trend assessment.
The global mean cloud fraction map reveals well-known climatological features, including high cloudiness over the ITCZ, midlatitude storm tracks, and the SPCZ and reduced cloud cover over subtropical regions associated with the descending branches of the Hadley cell. Seasonal and regional contrasts are evident, with consistently higher cloud fractions over ocean than land and greater seasonal variability over land, consistent with continental convection patterns.
Time-series analysis indicates a statistically significant decreasing trend in daytime cloud fraction over land, with a Theil–Sen slope of −0.0329 per decade (p = 0.014). This trend is confined to the Northern Hemisphere, where the decline is more pronounced (−0.056 per decade, p = 0.0041), while no significant trend is observed over ocean or the Southern Hemisphere. These findings are broadly consistent with previous results based on ERA5 reanalysis (Liu et al., 2023), which attributed the decline in land cloudiness to reductions in near-surface relative humidity. The lack of a trend over the ocean in the EPIC record may reflect both a shorter observational period and the fact that the increase in ocean cloud reported by Liu et al. (2023) largely occurred before 2001.
Spatially resolved trend maps reveal additional regional trends, including statistically significant decreases in cloud fraction over the western tropical Pacific, East Asia, and Central Africa, and localized increases in parts of the midlatitude oceans. These regional changes may be associated with shifts in large-scale circulation or moisture flux patterns.
Longitudinal and zonal Hovmöller diagrams highlight the spatiotemporal structure of cloud fraction variability. The ITCZ migration is clearly visible in the zonal diagram, while the longitudinal diagram reveals persistent cloud belts and wave-like seasonal variations. The absence of large-scale shifts in zonal cloudiness suggests that the underlying spatial structure of daytime cloud coverage remained stable during the study period.
CEH results show consistently higher values over land (annual mean ∼3.43 km) than over ocean (∼2.94 km), due to generally deeper convection over continental regions. CEH over land exhibits minimal seasonal variability, while oceanic CEH displays a more pronounced seasonal cycle. No statistically significant long-term trend in CEH was found globally.
In summary, this study demonstrates EPIC’s capability to monitor daytime cloud properties at a global scale. The results provide new insights into regional and hemispheric differences in cloud fraction trends. Although the EPIC record is still relatively short, its unique perspective from the L1 vantage point offers valuable continuity in global cloud monitoring and can complement other satellite datasets in studying climate variability and cloud feedback processes.
Data availability statement
The original contributions presented in the study are included in the article/supplementary material; further inquiries can be directed to the corresponding author.
Author contributions
YY: conceptualization, data curation, formal analysis, funding acquisition, investigation, methodology, supervision, writing – original draft, and writing – review and editing. SB: formal analysis, investigation, methodology, software, validation, visualization, and writing – review and editing. AD-B: formal analysis, investigation, methodology, and writing – review and editing.
Funding
The author(s) declare that financial support was received for the research and/or publication of this article. YY acknowledges funding support from the NASA DSCOVR Science Team Program. SB is supported by the NASA DSCOVR Science Team Program. AD-B is supported by the DSCOVR Science Management project and the DSCOVR Science Team Program.
Conflict of interest
The authors declare that the research was conducted in the absence of any commercial or financial relationships that could be construed as a potential conflict of interest.
Generative AI statement
The author(s) declare that no Generative AI was used in the creation of this manuscript.
Publisher’s note
All claims expressed in this article are solely those of the authors and do not necessarily represent those of their affiliated organizations, or those of the publisher, the editors and the reviewers. Any product that may be evaluated in this article, or claim that may be made by its manufacturer, is not guaranteed or endorsed by the publisher.
References
Boucher, O., Randall, D., Artaxo, P., Bretherton, C., Feingold, G., Forster, P., et al. (2013). Clouds and aerosols. In: T. F. Stocker, D. Qin, G.-K. Plattner, M. Tignor, S. K. Allen, J. Boschunget al. editors. Climate change 2013: the physical science basis. Contribution of working group I to the fifth assessment report of the intergovernmental panel on climate change. Cambridge, United Kingdom and New York, NY, USA: Cambridge University Press.
Delgado-Bonal, A., Marshak, A., Yang, Y., and Oreopoulos, L. (2020). Daytime variability of cloud fraction from DSCOVR/EPIC observations. J. Geophys. Res. 125 (10). doi:10.1029/2019JD031488
Delgado-Bonal, A., Marshak, A., Yang, Y., and Oreopoulos, L. (2021). Global daytime variability of clouds from DSCOVR/EPIC observations. Geophys. Res. Lett. 48, e2020GL091511. doi:10.1029/2020GL091511
Delgado-Bonal, A., Marshak, A., Yang, Y., and Oreopoulos, L. (2022). Cloud height daytime variability from DSCOVR/EPIC and GOES-R/ABI observations. Front. Remote Sens. 3, 780243. doi:10.3389/frsen.2022.780243
Delgado-Bonal, A., Marshak, A., Yang, Y., and Oreopoulos, L. (2024). Global cloud optical depth daily variability based on DSCOVR/EPIC observations. Front. Remote Sens. 5, 1390683. doi:10.3389/frsen.2024.1390683
DeWitt, T. D., Garrett, T. J., Rees, K. N., Bois, C., Krueger, S. K., and Ferlay, N. (2024). Climatologically invariant scale invariance seen in distributions of cloud horizontal sizes. Atmos. Chem. Phys. 24, 109–122. doi:10.5194/acp-24-109-2024
Gao, M., Zhai, P.-W., Yang, Y., and Hu, Y. (2019). Cloud remote sensing with EPIC/DSCOVR observations: a sensitivity study with radiative transfer simulations. J. Quant. Spectrosc. Radiat. Transf. 230, 56–60. doi:10.1016/j.jqsrt.2019.03.022
Goessling, H. F., Rackow, T., and Jung, T. (2024). Recent global temperature surge intensified by record-low planetary albedo. Science 387 (6729), 68–73. doi:10.1126/science.adq7280
Hao, D., Asrar, G. R., Zeng, Y., Zhu, Q., Wen, J., Xiao, Q., et al. (2019). Estimating hourly land surface downward shortwave and photosynthetically active radiation from DSCOVR/EPIC observations. Remote Sens. Environ. 232, 111320. doi:10.1016/j.rse.2019.111320
Hao, D., Asrar, G. R., Zeng, Y., Zhu, Q., Wen, J., Xiao, Q., et al. (2020). DSCOVR/EPIC-derived global hourly and daily downward shortwave and photosynthetically active radiation data at 0.1° × 0.1° resolution. Earth Syst. Sci. Data 12 (3), 2209–2221. doi:10.5194/essd-12-2209-2020
Hersbach, H., Bell, B., Berrisford, P., Hirahara, S., Horányi, A., Muñoz-Sabater, J., et al. (2020). The ERA5 global reanalysis. Quart. J. Royal. Meteorol. Soc. 146, 1999–2049. doi:10.1002/qj.3803
Huang, X., and Yang, K. (2022). Algorithm theoretical basis for ozone and sulfur dioxide retrievals from DSCOVR EPIC. Atmos. Meas. Tech. 15 (20), 5877–5915. doi:10.5194/amt-15-5877-2022
King, M. D., Platnick, S., Menzel, W. P., Ackerman, S. A., and Hubanks, P. A. (2013). Spatial and temporal distribution of clouds observed by MODIS onboard the terra and aqua satellites. IEEE Trans. Geosci. Remote Sens. 51 (7), 3826–3852. doi:10.1109/tgrs.2012.2227333
Koelemeijer, R. B. A., Stammes, P., Hovenier, J. W., and de Haan, J. F. (2001). A fast method for retrieval of cloud parameters using oxygen A band measurements from the global ozone monitoring experiment. J. Geophys. Res. 106, 3475–3490. doi:10.1029/2000JD900657
Kramarova, N. A., Ziemke, J. R., Huang, L. K., Herman, J. R., Wargan, K., Seftor, C. J., et al. (2021). Evaluation of version 3 total and tropospheric ozone columns from Earth polychromatic imaging camera on deep space climate observatory for studying regional scale ozone variations. Front. Remote Sens. 2, 734071. doi:10.3389/frsen.2021.734071
Liu, H., Koren, I., Altaratz, O., and Chekroun, M. D. (2023). Opposing trends of cloud coverage over land and ocean under global warming. Atmos. Chem. Phys. 23, 6559–6569. doi:10.5194/acp-23-6559-2023
Loeb, N. G., Ham, S. H., Allan, R. P., Thorsen, T. J., Meyssignac, B., Kato, S., et al. (2024). Observational assessment of changes in Earth’s energy imbalance since 2000. Surv. Geophys. 45, 1757–1783. doi:10.1007/s10712-024-09838-8
Lu, J., Vecchi, G. A., and Reichler, T. (2007). Expansion of the hadley cell under global warming. Geophys. Res. Lett. 34 (6). doi:10.1029/2006gl028443
Marshak, A., Herman, J., Szabo, A., Blank, K., Cede, A., Carn, S., et al. (2018). Earth observations from DSCOVR/EPIC instrument. Bull. Am. Meteorol. Soc. 99 (9), 1829–1850. doi:10.1175/BAMS-D-17-0223.1
Meyer, K., Yang, Y., and Platnick, S. (2016). Uncertainties in cloud phase and optical thickness retrievals from the earth polychromatic imaging camera (EPIC). Atmos. Meas. Tech. 9, 1785–1797. doi:10.5194/amt-9-1785-2016
Rees, K. N., Garrett, T. J., DeWitt, T. D., Bois, C., Krueger, S. K., and Riedi, J. C. (2024). A global analysis of the fractal properties of clouds revealing anisotropy of turbulence across scales. Nonlin. Process. Geophys. 31, 497–513. doi:10.5194/npg-31-497-2024
Rossow, W. B., and Schiffer, R. A. (1999). Advances in understanding clouds from ISCCP. Bull. Am. Meteorol. Soc. 80 (11), 2261–2287. doi:10.1175/1520-0477(1999)080<2261:aiucfi>2.0.co;2
Sen, P. K. (1968). Estimates of the regression coefficient based on Kendall's tau. J. Am. Stat. Assoc. 63 (324), 1379–1389. doi:10.2307/2285891
Shang, H., Letu, H., Nakajima, T. Y., Wang, Z., Ma, R., et al. (2018). Diurnal cycle and seasonal variation of cloud cover over the Tibetan Plateau as determined from Himawari-8 new-generation geostationary satellite data. Sci. Rep. 8, 1105. doi:10.1038/s41598-018-19431-w
Stephens, G., Winker, D., Pelon, J., Trepte, C., Vane, D., Yuhas, C., et al. (2018). CloudSat and CALIPSO within the A-Train: ten years of actively observing the Earth system. Bull. Am. Meteorol. Soc. 99, 569–581. doi:10.1175/BAMS-D-16-0324.1
Tselioudis, G., Rossow, W. B., Bender, F., and Remillard, J. (2024). Oceanic cloud trends during the satellite era and their radiative signatures. Clim. Dyn. 62, 9319–9332. doi:10.1007/s00382-024-07396-8
Voigt, A., Albern, N., Ceppi, P., Grise, K., Li, Y., and Medeiros, B. (2021). Clouds, radiation, and atmospheric circulation in the present-day climate and under climate change. WIREs Clim. Change 12, e694. doi:10.1002/wcc.694
Yang, Y., Marshak, A., Mao, J., Lyapustin, A., and Herman, J. (2013). A method of retrieving cloud top height and cloud geometrical thickness with oxygen A and B bands for the deep space climate observatory (DSCOVR) mission: radiative transfer simulations. J. Quant. Spectrosc. Radiat. Transf. 122, 141–149. doi:10.1016/j.jqsrt.2012.09.017
Yang, Y., Meyer, K., Wind, G., Zhou, Y., Marshak, A., Platnick, S., et al. (2019). Cloud products from the earth polychromatic imaging camera (EPIC): Algorithms and initial evaluation. Atmos. Meas. Tech. 12, 2019–2031. doi:10.5194/amt-12-2019-2019
Yang, Y., Zhao, C., and Fan, H. (2020). Spatiotemporal distributions of cloud properties over China based on Himawari-8 advanced himawari imager data. Atmos. Res. 240, 104927. doi:10.1016/j.atmosres.2020.104927
Zhou, Y., Yang, Y., Gao, M., and Zhai, P. (2020). Cloud detection over snow and ice with oxygen A- and B-band observations from the earth polychromatic imaging camera (EPIC). Atmos. Meas. Tech. 13, 1575–1591. doi:10.5194/amt-13-1575-2020
Keywords: global, cloud coverage, cloud height, daytime, EPIC, DSCOVR
Citation: Yang Y, Bhatta S and Delgado-Bonal A (2025) Decadal observations of global daytime cloud properties from DSCOVR–EPIC. Front. Remote Sens. 6:1632157. doi: 10.3389/frsen.2025.1632157
Received: 20 May 2025; Accepted: 14 July 2025;
Published: 31 July 2025.
Edited by:
Alexei Lyapustin, National Aeronautics and Space Administration, United StatesReviewed by:
Xiaoyong Zhuge, Chinese Academy of Meteorological Sciences, ChinaVíctor Molina García, German Aerospace Center (DLR), Germany
Pradeep Kumar, Banaras Hindu University, India
Copyright © 2025 Yang, Bhatta and Delgado-Bonal. This is an open-access article distributed under the terms of the Creative Commons Attribution License (CC BY). The use, distribution or reproduction in other forums is permitted, provided the original author(s) and the copyright owner(s) are credited and that the original publication in this journal is cited, in accordance with accepted academic practice. No use, distribution or reproduction is permitted which does not comply with these terms.
*Correspondence: Yuekui Yang, eXVla3VpLnlhbmdAbmFzYS5nb3Y=