 Catherine Evans1*
 Romina Gehrmann2
 Christopher Greene3
 Sarah Blenis4
 Roxanne MacKinnon5
 Jason Newport1
 Sarah Vela1
 Matthew Smith1
 Zahra Sadeghi1
 Stan Matwin1,6
 Chris Whidden1
- 1Marine Environmental Research Infrastructure for Data Integration and Application Network (MERIDIAN), Institute for Big Data Analytics, Department of Computer Science, Dalhousie University, Halifax, NS, Canada
- 2Defence Research and Development Canada, Dartmouth, NS, Canada
- 3Department of Earth and Environmental Sciences, Dalhousie University, Halifax, NS, Canada
- 4Hammond River Angling Association, Hampton, NB, Canada
- 5Atlantic Coastal Action Program (ACAP) Saint John, Saint John, NB, Canada
- 6Institute of Computer Science, Polish Academy of Sciences, Warsaw, Poland
Darlings Lake, located in the Saint John River watershed, Canada, experienced lake-wide cyanobacteria blooms in the summers of 2021 and 2022. This study uses high spatial and temporal resolution satellite imagery from Planet Labs (Planet Labs, Inc., San Francisco, CA, United States of America) to understand the extent and severity of the blooms with a time series analysis of the normalized difference vegetation index (NDVI) and the normalized difference chlorophyll index (NDCI) over the lake using k-means clustering. We distinguish algae blooms from preexisting aquatic vegetation by creating a baseline map of mean aquatic vegetation extent, and subtracting this from each image in the time series. Additionally, results from a principal component analysis conducted on each year’s imagery corroborate the k-means finding, and align with spatial trends of bloom events observed in the lake. In this study, normalized difference chlorophyll index values are observed to be more reliable for estimating the severity of algal blooms, while NDVI is more sensitive to glare, haze, thin clouds, and signal over-saturation caused by blooms, aligning with preexisting research findings. We successfully fit a linear regression between NDCI values and in situ measurements of phycocyanin concentrations surrounding AlgaeTracker™ buoys (R2:0.893). Furthermore we highlight bloom extent and severity for 2021 and 2022, revealing potential bloom hotspots in the lake. The methodology in this project can be extended to systematically analyze high-resolution satellite imagery in freshwater ecosystems to detect harmful algae blooms.
1 Introduction
Cyanobacteria, also known as blue-green algae, are a type of bacteria commonly found in aquatic environments. In recent years, there has been a growing concern about the increasing frequency and intensity of cyanobacteria growth in lakes threatening ecosystems worldwide (Huisman et al., 2018). Given the potential associated harms, there is a rapidly growing need to monitor the trends and variable dynamics of algal blooms to provide public health officials and aquatic managers with the information they need to mitigate these events (Anderson et al., 2012). Our pilot study developed a methodology for algae bloom detection and analysis from a constellation of smallsats (i.e., SuperDove satellite in the Planetscope Constellation operated by Planet Labs, Inc.) providing high spatial resolution, reasonable spectral resolution, and near daily temporal resolution. We present a novel calibrated k-means clustering approach for transitioning from quantifying the extent of known past blooms, to identifying the emergence of new blooms in near real time.
Cyanobacteria growth is linked to excessive nutrient inputs, particularly phosphorus in freshwater environments, and nitrogen in marine environments. Excess nutrients are attributed to human activities such as agriculture, urbanization, and wastewater treatment (Paerl and Otten, 2013). The overgrowth of cyanobacteria can lead to the formation of Harmful Algal Blooms (HABs) causing ecological and human health problems. Notably, HABs can deplete oxygen levels in the water, and produce toxins (e.g., cyaonotoxins) that can harm aquatic life, terrestrial animals (e.g., McCarron et al., 2023), and outcompete beneficial phytoplankton (Paerl and Huisman, 2008). The frequency and duration of cyanobacteria blooms in lakes have increased in recent decades due to the intensification of human activities and anthropogenic climate change (Huisman et al., 2018). These driving factors include eutrophication, rising CO2 concentrations, higher surface temperatures and extreme weather events due to climate change (Paerl and Huisman, 2009). While in situ monitoring of algae blooms in lakes give valuable insight to nutrient contents as well as toxins, they can be limited to specific locations and restricted by the time available by field personnel and volunteers. Satellite imagery on the other hand offers regular measurements of the whole lake, and remote sensing methods are increasingly being integrated into HAB monitoring regimes.
Cyanobacteria is a photosynthetic organism that exhibits a spectral signature along the spectrum of light similar to that of vegetation, phytoplankton and diatom blooms. The pigment responsible for photosynthesis, chlorophyll-a (chl-a), is widely used to estimate phytoplankton biomass in the ocean (Geider, 1987; IOCCG, 2008). Chl-a primarily absorbs electromagnetic radiation (EMR) at two distinct wavelengths: 372 nm (ultraviolet) and 642 nm (visible red) (Milne et al., 2015). As a result, fluorescent light during photosynthesis is especially pronounced in the red-edge (
Mishra and Mishra (2012) point out a threshold chlorophyll concentration of at least 8
Using satellite remote sensing to detect blooms has become relatively well established (e.g., Khan et al., 2021) given the rapid expansion of openly available data and commercial data. Of particular note is a study by Beaulne and Fotopoulos (2024) who developed a web application for openly available data. In this research the authors highlight the importance of increasing the temporal and spatial resolution, and spatial extent for HAB monitoring using remote sensing satellite data. For that purpose they integrate data from different missions such as from the Ocean and Land Colour Instrument (OLCI) carried on Sentinel-3, the MSI carried on Sentinel-2 (highest spatial resolution of 10–20 m and 5-day return time), the Operational Land Imager (OLI) and OLI-2 carried on Landsat 8 and 9 respectively (30 m spatial resolution and 16-day return time), MODIS (
Monitoring the occurrence and severity of algal blooms with frequent image capture rates can provide public health officials and aquatic managers with the information they need to mitigate potentially harmful events (Anderson et al., 2012). The environmental monitoring sector is increasingly applying machine learning (ML) approaches in satellite remote sensing for algal bloom detection given the increasing volume of available data. Wasehun et al. (2025), for example, compare 5 ML approaches, linear regression, least absolute shrinkage and selection operator (LASSO), extreme gradient boosting (XGBoost), random forest, and support vector regression, to analyse their prediction capacity for chl-a concentrations in inland waters and compare their advantages and disadvantages dependent on the training data available. Sagan et al. (2020) have demonstrated the advantages of using deep learning algorithms for phycocyanin, chl
This paper addresses a key issue in environmental monitoring and research: using machine learning approaches can efficiently summarize regional environmental health, but there is a limit to available data and time to develop and train models. Our approach of calibrating very-high-resolution satellite imagery during the processing stage streamlines the differentiation of HABs and aquatic vegetation and gives the ability to compare a time series of images to a mean baseline. A robust k-means clustering algorithm is used to classify imagery. Combining the two methodologies provides an innovative method to detect HAB activity through baseline-subtracted k-means clustering.
Furthermore, this project operates on the a priori hypothesis that a large cyanobacteria bloom can be classified within a similar magnitude as other existing egetation within a lake. If true, the bloom signals could be detected using a time-series analysis of a spectral index derived from multispectral satellite imagery. The time-series of spectral index values is classified using the k-means algorithm. Each k-means class represents signal strength of chlorophyll based on the pixel’s proximity to the nearest of a predetermined number of centroids (MacQueen, 1967). The advantage of the method is that it does not require an annotated data set to learn from, compared to some of the methods introduced above. We validate our approach by comparing the classification results of selected bloom days to manually annotated values, as well as the annual bloom extend to results from a principal component analysis (PCA), an independent methodology that does not require annotated data beforehand.
PCA is a well established method for change detection in remote sensing data. It reduces the number of potentially correlated spectral components in fewer, independent principal components (PC). When used in multitemporal studies, where two or more images of the same area at different times are available, the PCs relate to the main differences between the images (e.g., Richards et al., 2022; SINGH, 1989). Applying PCA to multispectral data can reduce redundant information in the spectral bands and enable to focus on the independent characteristics in an image and reveal the bands’ relationships. Fung and LeDrew (1987) point out how standardized and non-standardized PCs can show different results, however, when comparing visual and infrared bands they often relate mainly to brightness (all bands are positively correlated) and greenness (where visual and infrared bands are negatively correlated). Similar to Lasaponara (2006) we apply PCA to a temporal series of vegetation index data instead of the spectral bands. We choose NDCI for the spring/summer season for its suitability to detect HAB and therefore comparability to the k-means classification approach.
This paper demonstrates a robust processing routine highlighting surface blooms in freshwater bodies. Many lakes that experience HAB events are not consistently being monitored and depend on resources of local environmental groups. Highlighting fluctuating chl-a concentrations through the use of high-temporal resolution satellite imagery will enable large scale monitoring of potential HAB events in freshwater bodies independent of their location and vicinity to human activities. We test our methods at Darlings Lake located in southwestern New Brunswick, Canada (Figure 1).
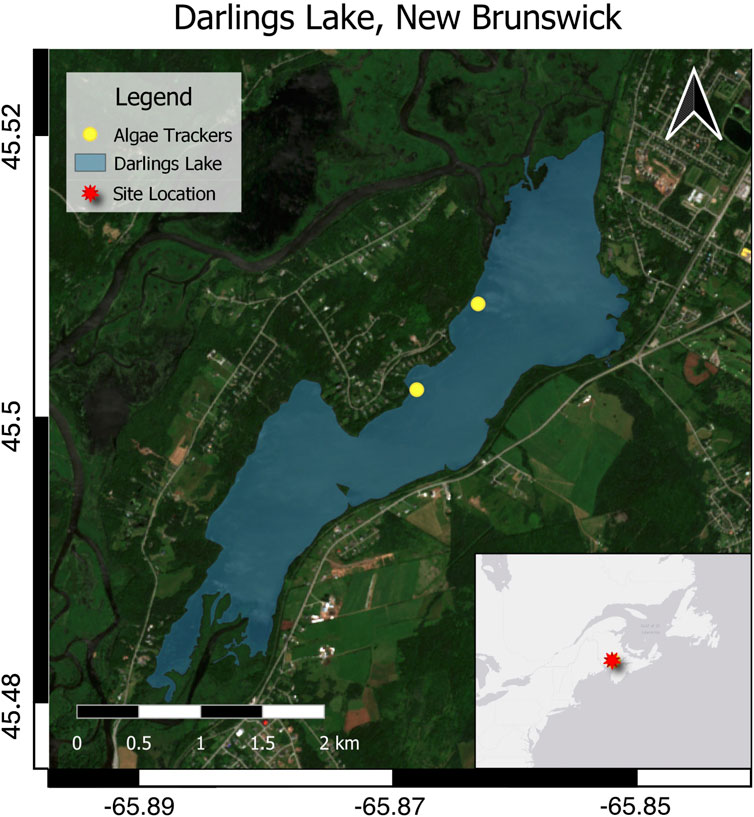
Figure 1. True color satellite image of Darlings Lake and surrounding region in New Brunswick. The inlay shows the location of the lake in Eastern Canada. Blue overlay separates the land from water. Yellow markers indicate locations of two monitoring devices for real-time water quality measurements in the summer of 2022. Sentinel 2 (SentinelHub) image courtesy of the ESA.
Darlings Lake is a small freshwater lake that provides excellent empirical context for our study because it is monitored in real time for chl-a and phycocyanin concentrations using in situ AlgaeTracker™ buoys. Satellite-derived spectral indices can therefore be compared directly compared to the in situ monitoring program at the lake. The real-time monitoring of the lake was initiated after the occurrence of extensive cyanobacteria blooms in the summer of 2021 (Sutherland, 2021).
Darlings Lake is approximately 2.5 km long and 1.5 km wide, with a maximum depth nearing 10 m. It is popular for recreational uses such as swimming, fishing, and boating, and surrounded by residential homes and cottages, agricultural land, and forested hills. The lake is part of the Kennebecasis River Watershed, a sub-watershed of the Wolastoq/Saint John River Watershed. The primary inlet to Darlings Lake is the Kennebecasis river, and it drains into the Hammond River from the south-west. The watershed area is regularly monitored due to concerns about water temperature, phosphorus, nitrogen, and E. coli. Land within the Kennebecasis River watershed contains about 15% agricultural land and about 78% forest (Whalen and Strang, 2017).
This paper is structured (following the workflow diagram in Figure 2) to first introduce our processing methodology (Section 2.3) preparing a time series of imagery to highlight changes in NDCI and the Normalized Difference Vegetation Index (NDVI) over time (Section 2.4), hence comparing the suitability of the two indices for HAB monitoring. Baseline imagery is created from an average of days without a reported algal bloom (Section 2.5) and is compared to days with a potential for algal blooms by subtracting the baseline image from the time series. The index rasters are classified using robust k-means clustering (Section 2.6). Calibrated rasters are used to interpret HAB occurrences, extent, and annual patterns. In parallel, annual trends of index rasters are compiled with PCA (Section 2.9) to validate. Additionally, we estimate a linear relationship between local index values against in situ measurements of phycocyanin to enable remote estimates of phycocyanin concentration. Our discussion reviews weather events and trends in HAB behaviour in Darlings Lake (Section 4.3), and compares satellite imagery to in situ data and field observations. We outline current understandings of HAB dynamics related to the blooms in Darlings Lake, and give an overview of current capabilities and limitations of high-resolution satellite imagery for future research considerations. This paper offers a series of methodologies using high spatial and temporal resolution satellite imagery that can be modified according to monitoring needs and replicated without the creation of large training datasets or computing power, reducing barriers for researchers and water monitoring groups.
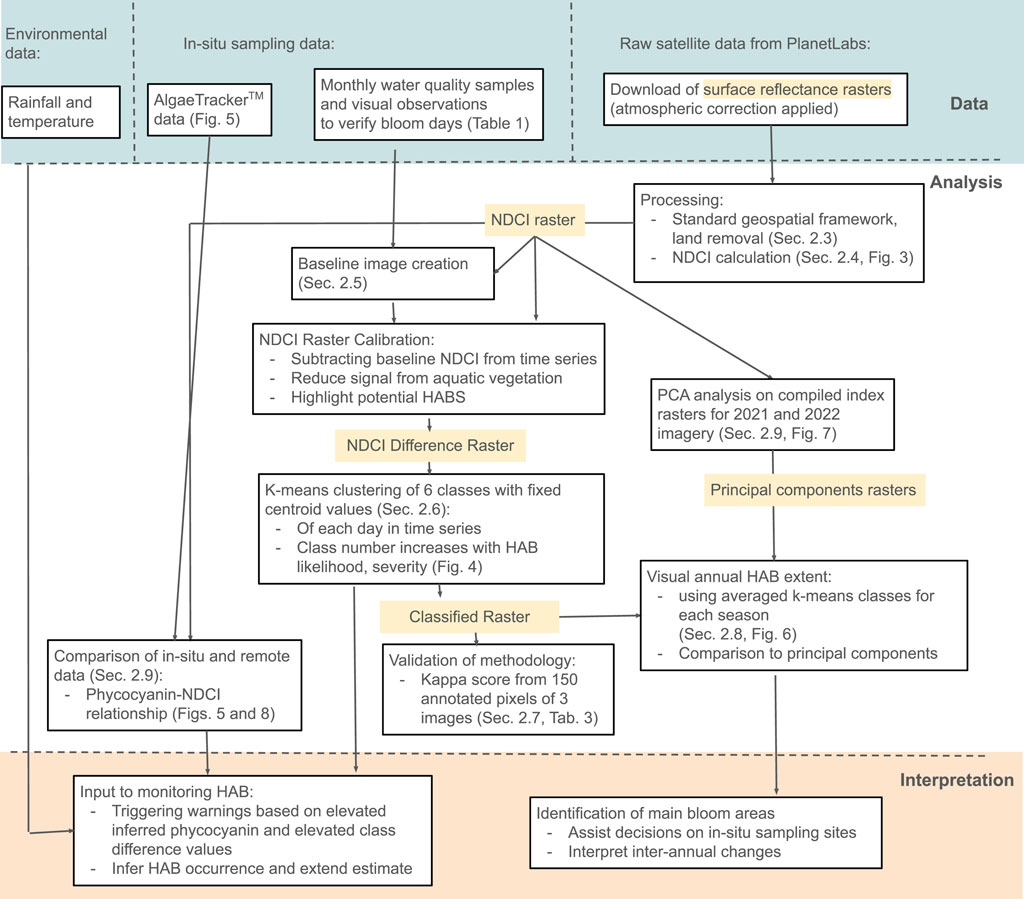
Figure 2. Workflow of the methodology divided in three sections: Input data (top, light cyan), analysis (centre), and interpretation (bottom, light orange). The derived remote sensing products are highlighted in yellow. The index raster is referred to as NDCI. However, we also run the workflow with NDVI rasters for comparison.
2 Methods
2.1 In situ data
Darlings Lake is actively monitored by the Hammond River Angling Association (HRAA) - a community-based non-profit organization that conducts water quality monitoring programs and habitat restoration products for local aquatic species, including Atlantic Salmon. The HRAA began monitoring Darlings Lake water quality upon the first large-scale HAB event in 2021. Each month the HRAA collects water quality samples to be analyzed for a suite of parameters including general chemistry, bacterial analysis, light and temperature data collection, cyanotoxin testing (microcystin and anatoxin-a), while also collecting in situ water chemistry readings with a multiprobe to determine dissolved oxygen, salinity, conductivity, total dissolved solids, turbidity, and pH.
Each season the HRAA secures a permit under the Canadian Navigable Waters Act for designated scientific equipment to launch two monitoring systems (AlgaeTracker™) into Darlings Lake. The AlgaeTracker™ monitor and broadcast live water quality measurements for local real-time monitoring. The buoys measure chl-a, water temperature, phycocyanin, and turbidity, among other parameters, every 30 min. AlgaeTrackers™ are placed into the lake with 20 lb anchors and 15-cm-wide and 30-cm-high buoys with reflective cautionary material and HRAA identification tags. Water quality samples are collected at each of the AlgaeTrackers™ once per month. Additional water quality samples are also collected monthly in four tributaries that feed into Darlings Lake, with additional samples collected after heavy rainfall events (>25 mm).
2.2 Satellite data overview
Planet Labs is a commercial satellite company managing several satellite constellations including a series of smallsats called SuperDove as a part of the PlanetScope Mission. While the earlier Dove satellites were restricted to four band VIS-NIR, Planet Labs improved the design and begin to expand the constellation with SuperDove smallsats in 2021. SuperDoves increased spectral resolution from four band to eight band VIS-NIR. Of note is the inclusion of a red-edge band, the narrow spectral range that captures the transition from absorption to reflection for chl-a and particularly useful for blooms of photosynthetic algae. The red-edge band provides radiometric corrections, top- and bottom-of-atmosphere corrections, and orthorectification to remove distortions (e.g., UK, 2024). Liu et al. (2022) studied the ability of different band ratios for Landsat 8, Sentinel 2, and 4-band PlanetScope data to predicted cell density of cyanobacteria in a water reservoir and concluded that the spectral resolution is more important than spatial resolution. Therefore, this study focuses on the 8-band PlanetScope data. Multispectral image data from Planet Labs’ PlanetScope SuperDove Earth-imaging constellations includes wavelengths 431–452 nm (coastal blue), 465–515 nm (blue), 513–549 nm (green I), 547–583 nm (green), 600–620 nm (yellow), 650–680 nm (red), 697–713 nm (red-edge), 845–885 nm (near-infrared). All but green I and yellow are comparable to Sentinel-2 bands (Kington and Collison, 2022). Given the relevant spectral bands, a spatial resolution of 3 m, and a close-to-daily temporal resolution, means the PlanetScope constellation meets most criteria for monitoring cyanobacteria intensity and extent in a small freshwater reservoir.
Optical multispectral satellite imagery is downloaded through a research license with Planet Labs (https://www.planet.com/). Planet Labs’ SuperDove satellites have been in orbit since 2018, with near-daily global coverage of 3-m resolution 8-band VIS-NIR imagery beginning in 2020 at 3-m spatial resolution (Kim et al., 2021). Given the small areal footprint of Darlings Lake, acquired images are required to be nearly entirely cloud free to exclude masking of potential bloom activity in the water. This selection criteria resulted in median intervals of 2 days and mean intervals of 4.5 days between images. In total, 60 images were downloaded between the months of May and October between 2020 and 2022 (Table 1).
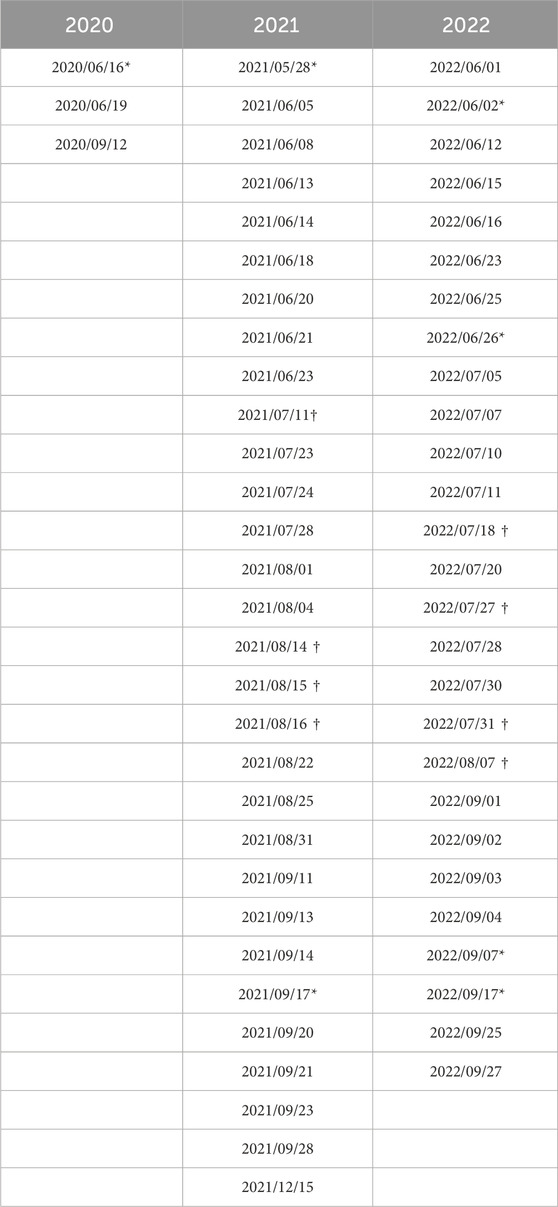
Table 1. Dates for 8-band satellite imagery downloaded from Planet Labs over Darlings Lake, NB, 2020-2022. Starred dates (*) were used in creating a mean vegetation distribution raster. Crossed dates (
A vector polygon (shapefile format) to outline Darlings Lake’s extent is obtained from Statistics Canada’s 2011 Lakes and Rivers Census (Statistics Canada, 2011). The Darlings Lake object is extracted from the census polygon as an independent vector. The 2011 shapefile was overlaid with a 2022 Superdove image to ensure that it still accurately outlined the shores of the lake. No differences could be observed using both true-color and the Normalized Difference Water Index to highlight the water-shoreline interface.
Surface reflectance was used for each image of the time series, mitigating seasonal and temporal atmospheric changes through Planet Labs’ pre-applied relative atmospheric correction coefficient and calculated through their use of the 6SV2.1 Radiative Transfer Model, accounting for effects from atmospheric scattering and solar zenith angles (Kington and Collison, 2022; Collison and Curdoglo, 2025). Surface reflectance is recommended for use during time series of the same region to improve estimates of on-the-ground reflectance of surface features without the aforementioned atmospheric effects (Xiao et al., 2015). Planet Labs imagery can be downloaded with surface reflectance corrections already applied as a Level 2 product. It is possible to download imagery through Planet’s graphical interface on their website, using either predefined shapefile coordinates or by manually outlining a defined study area. Users can also download imagery with predefined requirements via an API. Both methods were used throughout the project length.
2.3 Image preparation
Downloaded geospatial data from different sources can have differing spatial reference systems (SRS). To ensure spatial registration between the raster imagery and a vector polygon of Darlings Lake, both the raster and the polygon’s SRS were reprojected to UTM WGS84 Zone 19 N, the same system used in this paper’s graphs. This allows for a standard geospatial framework between both datasets and accurate alignment between the vector features and raster data. The uniform SRS system reduced errors through misalignment of data and mitigated distortion, allowing for reliable spatial analysis and interpretation.
Due to water’s low reflectance, the reflectance signal over the lake are much lower than the surrounding land. To emphasize variation within the lake, pixels overlying land are removed from the analysis. Satellite images are subset to the extent of Darlings Lake. Imagery was processed using python’s Rasterio, NumPy, and scikit-learn packages.
2.4 Detecting chlorophyll
Cyanobacteria are photosynthetic, and reflect EMR in a similar manner to vegetation. The presence of this pigment can be highlighted in water by using band indices that focus on the absorption and reflection ranges of chlorophyll. Two such indices are the normalized difference vegetation index (NDVI) and the normalized difference chlorophyll index (NDCI) (Mishra and Mishra, 2012; Weier and Herring, 2000). The former uses a combination of the corrected reflectance (
Both indices have a range of normalized values from −1 to 1, and while not a direct measure, provide a good proxy for photosynthetic activity. Chlorophyll absorbs red light and reflects red-edge and NIR wavelengths. A high positive value therefore relates to high biomass as reflected photosynthetic indicators are greater than red signal readings. (Mishra and Mishra, 2012; Weier and Herring, 2000). Water reflects visible red and absorbs NIR, creating a negative numerator in the index where NIR readings are less than red (Mishra and Mishra, 2012; Weier and Herring, 2000) and creating challenges for the detection of algal blooms.
Before performing unsupervised classifications, NDCI and NDVI values are scaled so that water pixel values fall between 0 and 10,000 (Equation 3). Pixels falling outside of the polygon representing water or through high normalized NDVI/NDCI values are separated from the water pixels by assigning them a value of −2 first. They are hence negative. The scaling is performed using:
in which
2.5 Creating a baseline raster for time-series calibration
While normalized indices can be used to highlight algae blooms due to their chlorophyll reflectance strength, other biotic factors in the lake will also exhibit a high spectral signal. Marshy areas exhibit higher positive NDCI and NDVI values than clear, deep water (Mishra and Mishra, 2012). In our case study, marshlands in the southwest corner of Darlings Lake return a high positive value whether there was an algae bloom occurring or not (see Figure 3), and not accounting for existing vegetation and other environmental factors could return a false positive signal. Aquatic vegetation would also grow in shallow water along the shoreline through warmer months, demonstrating similar spectral magnitude to a bloom. Therefore, the first step to monitor changes in spectral reflectance over Darlings Lake is to quantify and remove the average vegetation distribution.
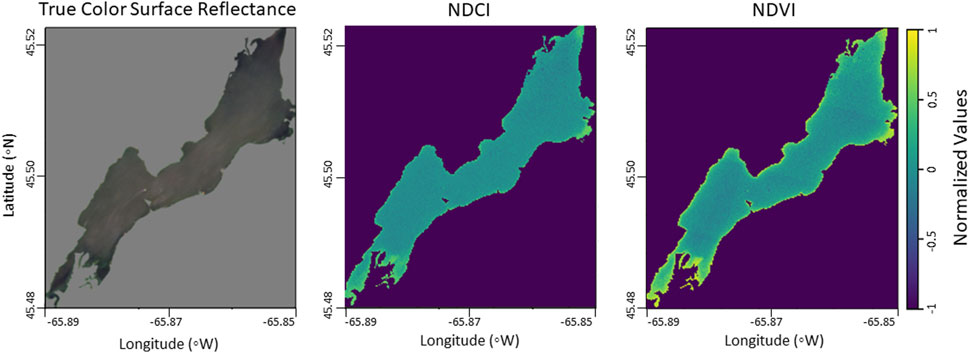
Figure 3. Series of images highlighting the distribution of aquatic vegetation across Darlings Lake on 18 June 2021, a day with no algae blooms. Left Image: True colour surface reflectance of Darlings Lake. Center: NDCI map of Darlings Lake. Right: NDVI map of the lake. Elevated NDCI and NDVI highlight marshlands along the shoreline, especially in the southwest and northeast portions of the lake. Image © 2021 Planet Labs PBC.
Background noise from variations in atmospheric conditions or minute differences in satellite specifics are addressed through calibrating the series of NDCI images. We create a baseline image as an average of 7 images when no bloom was reported in Darlings Lake (based on in situ sampling and visual observations; see dates marked with an asterisk in Table 1) to identify existing vegetation and avoid false positives of HAB activity in vegetated areas. Non-bloom days are selected through a combined approach of visually inspecting each image and verifying that there is no detectable algal bloom present through ground-truth from site inspections and field data collection surrounding the time of image capture.
The time series is calibrated by subtracting the baseline image from individual NDCI rasters, to remove the contribution from permanent aquatic vegetation (e.g., marshy areas). Calibrated NDCI values are also more effective at helping reduce coastline signal from changes in water height or coastal vegetation. The calibrated NDCI time series was then analysed with the k-means clustering approach described below.
2.6 Classifying blooms: k-means clustering
K-means clustering is an unsupervised shallow machine learning technique (MacQueen, 1967), that we apply twice to separate analyses classifying scaled NDVI and NDCI time-series values. Land mass and erroneous pixel values from the image beyond the outline of the lake are assigned a value of 0. The remaining five clusters classified NDVI and NDCI signal strength such that vegetation reflectance strength increases with class number. High positive class differences are interpreted as HAB occurrences in the lake (Figure 4). Six classes are chosen through an empirical comparison of k-means classifications of calibrated NDCI rasters. While the elbow method outputs only three classes (no data, clear water, general vegetation), imagery with medium and severe HABs as well as days with turbidity in the water, require additional classes to reliably differentiate between them. The use of six classes allows for aquatic vegetation and severe algal blooms to be differentiated, and a difference between clear and turbid water - a byproduct of either wind or potential HABs - to be made.
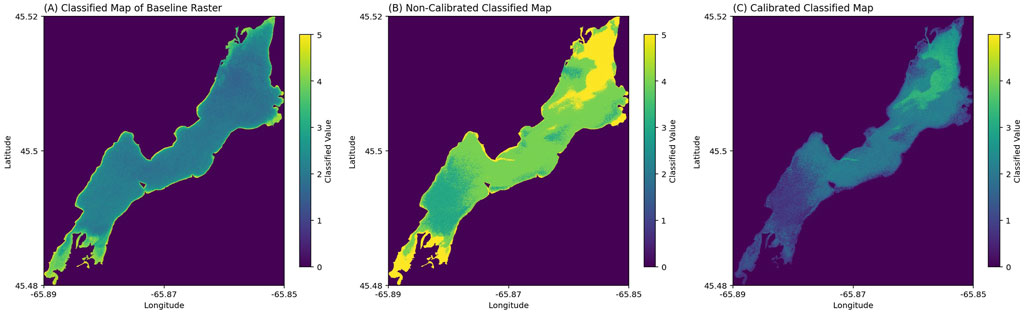
Figure 4. Comparison between the baseline image and a day with a HAB event classified by k-means. (A) Classified baseline map representing the mean distribution of vegetation across Darlings Lake. (B) Classified image that has not undergone calibration covering a severe bloom on 15 August 2021. Aquatic vegetation and HAB are highlighted across the lake. (C) Calibrated and classified image highlights HAB occurrence while aquatic vegetation signal in the south east and along the shoreline is muted. Image ©2021 Planet Labs PBC.
Imagery is separated manually into a training set, and a test set, in order to ensure that there is representation of an extensive bloom day while defining the k-means clusters. Pixels in the training set are clustered, with the cluster centroids saved. The test set acts as a time series, in which each cell’s value would be assigned to the most similar predefined cluster (see example in Table 2).
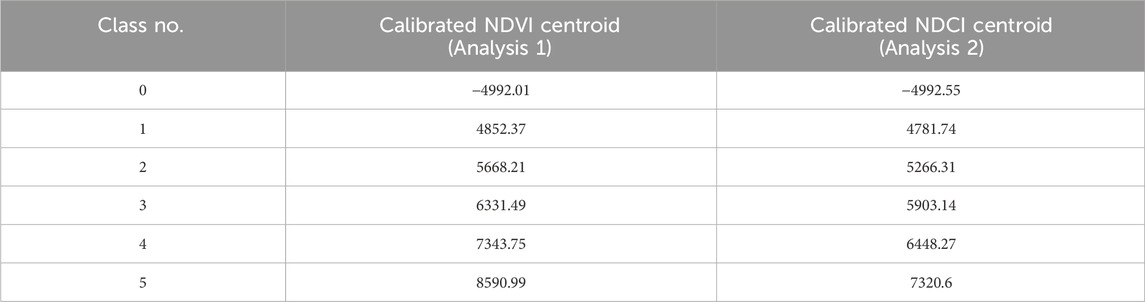
Table 2. Calibrated NDVI and NDCI cluster centroids over Darlings Lake in two separate k-means analyses. Higher classes indicate higher values of NDVI/NDCI within each normalized and scaled band compared to the baseline, and are more likely caused by dynamic HAB occurrences.
2.7 Accuracy assessment of methodology using kappa
To ensure that the above methodology of processing, classifying, and estimating HAB occurrences from calibrated rasters is statistically viable and can be applied as an automated time-series analysis of imagery, we evaluate the accuracy of the classification using ArcGIS Pro’s Accuracy assessment tool. The kappa score
Three days were selected for the analysis. All 3 days had blooms with varying levels of severity to test classification accuracy under different circumstances. As with highlighting chlorophyll, we took calibrated classified k-means clusters of three dates in our time series. Pixels were reclassified using ArcGIS Pro’s Reclassification tool with values ≤1 as water (reclassified to 1), 2-4 as bloom (reclassified as 2), and 4-5 as severe bloom or high dynamic aquatic vegetation (reclassified as 3). Two non-bloom pixel classifications are needed to ensure that open water with various levels of turbulence and large changes in seasonal vegetation signal are accounted for. From each image 150 stratified random points are selected across the lake and manually evaluated.
2.8 Visualizing annual HAB extent
To visualize HAB activity through Darlings Lake, we sum up all k-means calibrated rasters for days when a bloom occurred. We exclude areas for classes smaller than a threshold of 3 (out of 6 classes), thereby only summing pixels indicative of potential HAB activity, making the results more sensitive to even rare bloom occurrences. The result is an image illustrating the intensity over area normalised by the number of bloom days included (presented in Section 3.1).
2.9 Alternative analysis of HAB extent: PCA
Principal component analysis (PCA) has been used to understand land cover change in remote sensing imagery for decades (e.g., Byrne et al., 1980). The PCA method allows for complex image series over time to be reduced dimensionally, demonstrating each pixel’s relative variance to the rest of the image over a study area (Fung and LeDrew, 1987). This study applies PCA to compiled NDCI rasters for 2021 and 2022, compressing each season’s spectral data into an RGB image, enabling to qualitatively compare PCA results of field observations to the annual HAB extend from the k-means analysis. Additionally, due to complimentary features of the two independent techniques we aim to expand our understanding of Darlings Lake’s annual HAB dynamics. For example, stacking k-means rasters over each other highlights in which areas blooms were most severe or occurred most, while PCA highlights areas of no change and high intensity vs. areas with change in general. PCA is used to validate that our k-means classification methodology is reliably estimating HAB activity and water body parameters. Stacked single-band NDCI rasters for each cloud-free day in the 2021 and 2022 seasons were compiled. A PCA was applied to them using the Principle Components Algorithm in ArcGIS Pro’s Spatial Analyst toolbox. We evaluate the individual rasters of the first three principal components and the RGB image of the combination.
2.10 Comparing in situ and satellite data
The HRAA placed two AlgaeTracker™ instruments into Darlings Lake during the summer of 2022 for real-time monitoring of the water quality. The AlgaeTracker™ record measurements of phycocyanin and chl-a concentrations, as well as water temperature, sun light, wind, rain, and turbidity. Phycocyanin concentrations are assessed using in vivo fluorescence with an excitation wavelength of 575 nm and a peak emission wavelength of 642 nm. Phycocyanin concentrations are measured in 0–1,500
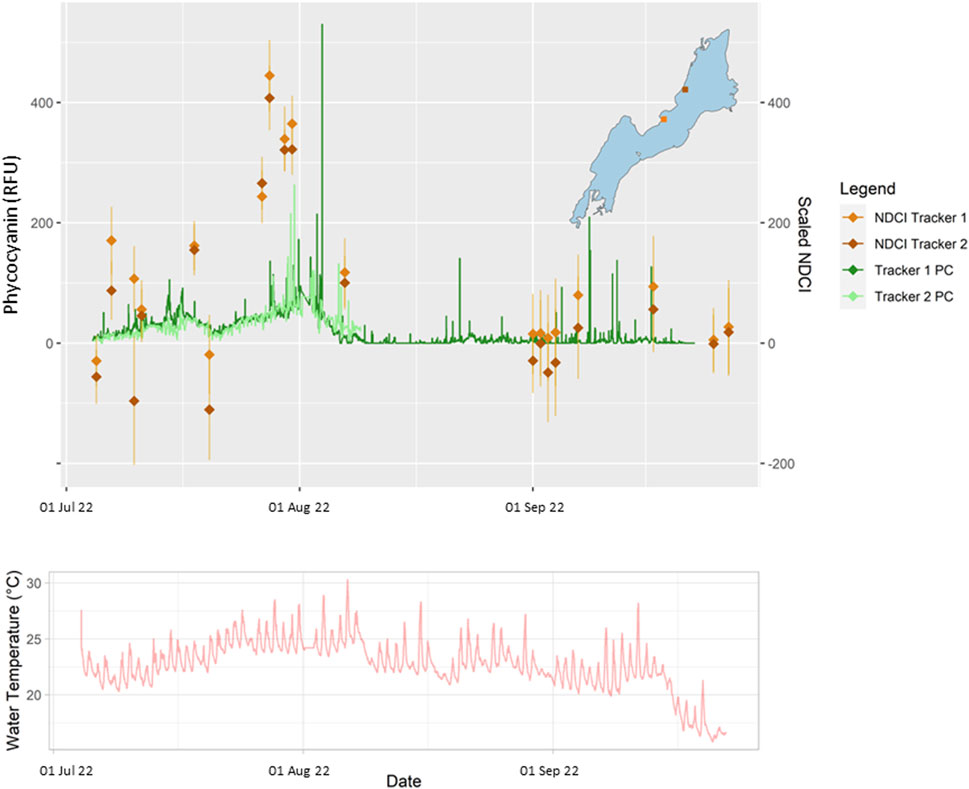
Figure 5. Graph comparing 2022 phycocyanin values measured in RFU by in-water AlgaeTracker™ to scaled, remote-sensed NDCI values. Water temperatures throughout the summer remained high, only lowering below a HAB-friendly threshold in mid September.
Beyond visualizing HAB extents, we also aim to estimate a relationship between in situ measurements and satellite data. For that purpose, satellite imagery rasters are subset to a 50-m radius around each AlgaeTracker™ and the mean NDVI and NDCI values are compared to mean daily (between 9:00 and 16:00 local time) phycocyanin readings
3 Results
We systematically analysed 54 days of multispectral imagery at Darlings Lake in summers 2020, 2021 and 2022 with the above described processing routine. The resulting time series of baseline-subtracted NDCI class maps are then analysed using the above methodology to estimate the presence and intensity of potential blooms.
All dates classified as having a potential bloom were in 2021 and 2022. Marshy regions generally have higher NDCI values. However, subtracting the baseline NDCI raster before the classification step reduced the signature of permanent aquatic vegetation in the resulting classes. Bloom signals range from classes 1–5 depending on algae concentration. By subtracting baseline rasters we effectively mask vegetation signals and/or highlight bloom changes over time, creating a distribution of HAB severity across the lake (Figure 4).
The accuracy of the methodology is assessed by calculating the kappa score between field observations and NDCI measurements against final classified values (Table 3). For each test day the kappa score is greater than 0.7, indicating substantial strength of agreement (Landis and Koch, 1977).

Table 3. Kappa score
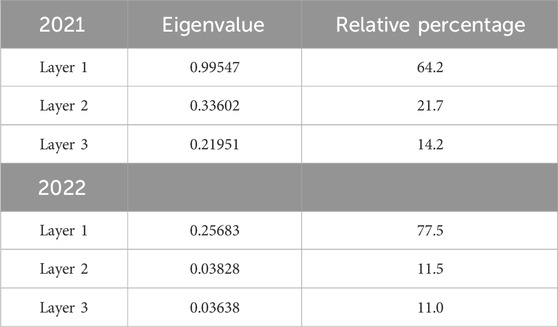
Table 4. Eigenvalues and their relative percentage for the 2021 and 2022 seasons.
Therefore, the extent and severity of large-scale blooms can be successfully identified and quantified, allowing for future monitoring efforts to help guide public access point closures, water quality alerts, and allow for prioritization of highly affected areas of the HAB to be monitored.
3.1 Spatial bloom frequency
For the 2021 and 2022 bloom seasons, we added the calibrated rasters and divided them by the number of images to visualize the bloom extent in the lake and highlight areas frequently affected by blooms (Figure 6). In 2021, blooms are distributed across the northern section down to 2/3rd of the lake towards the south. In 2022, visible blooms appeared along the western shore into the middle of the lake. The highest intensity and frequency is associated with the southern section of Darlings Lake in the marshy area, and also at the northern tip of the lake. The blooms were generally larger and more frequent in 2021 compared to 2022.
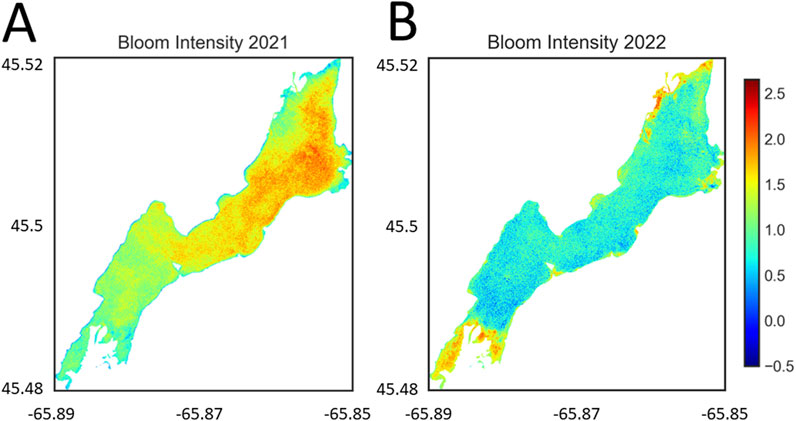
Figure 6. Composite map of all calibrated rasters for days with detected HABs divided by the number of days over Darlings Lake in (A) 2021, (B) 2022. Image © 2021, 2022 Planet Labs PBC.
3.2 PCA results
The use of PCA on a time series of satellite imagery allows for regional behaviour analysis, highlighting the strongest trends in a region of interest. In this case, using PCA as a method to understand Darlings Lake’s annual trends reduced the factor of time - dimensions dictated by the number of images per season -into the three most significant spatial patterns. The first principal component accounting for the most co-variation, the second shows the next strongest, and so forth. Each of these components can be unique from each other, giving the potential for additional insight outside of what can normally be achieved through change detection alone. The PCA results from the 2021 and 2022 seasons of Darlings Lake demonstrate different spatial trends. In 2021, the variance in reflective NDCI strength of pixels overlying deep water were assigned to the first principle component (Figures 7A,C). The result can be interpreted to correlate well with both analysis of imagery over the year that highlighted strong blooms repeatedly spreading and dying across the lake, affecting the NDCI signal significantly from image to image. Repeated HAB activity in the northern section of Darlings Lake demonstrated in Figure 6 were highlighted in component two (Figure 7D). Many of the blooms were first observed and strongest in the northeast section of the lake, with an example in Figure 4 (Blenis, 2024). Finally, turbulent water is less likely to experience algal blooms at the same severity as still water. Component three shows how the region surrounding the river input at the north-west section of the lake had much lower levels of variability in reflected chlorophyll levels in comparison to the rest of the study area (Figure 7E).
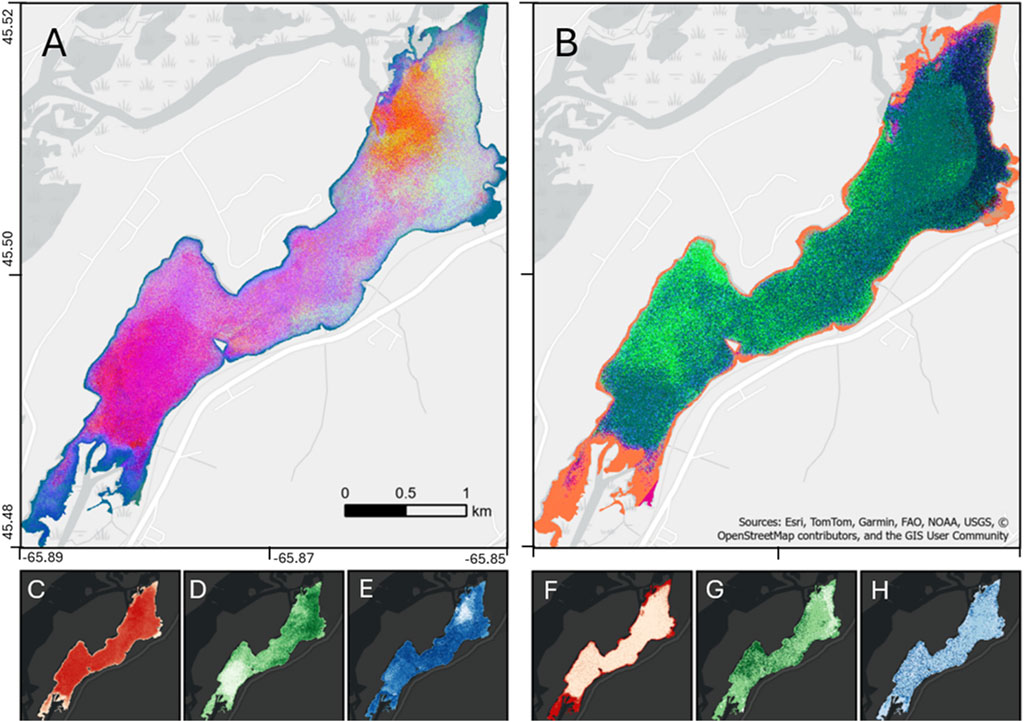
Figure 7. Visualization of the first three PCA components for 2021 (left) and 2022 (right) respectively. Components are visualised as layers (Red, Green, Blue colour schemes). Panels (A,B) show the superposition of the three layers for 2021 and 2022 respectively. Panels (C–H) show the individual layers for 2021 and 2022 respectively. The eigenvalues and relative percentages of these layers are listed in Table 4.
Strong alignment of PCA results with field observations shows its relevance in understanding annual HAB behaviour in regions with limited historic environmental data. This could also help give insight into HAB behaviour under different conditions when compared to environmental data, though verification through field site visits and regional expertise are obviously recommended to ground truth satellite observations.
Different spatial trends were observed in 2022 (Figures 7B,F–H). The first PCA component (Figure 7F) highlights the coastline, opposite to the first component for 2021, which highlights the deep-water section of the lake. Field visits and imagery analysis from the bloom season noted that many of the blooms were close to the shore, with the HRAA noting that increased winds and rain in 2022 could explain their observations that blooms were more likely to be “pushed” against the shoreline (Blenis, 2024). The second and third components were not as defined as the previous year. A more generalized view of bloom activity seems to be highlighted in the second component for 2022 (Figure 7G, demonstrating agreement with field notes of higher bloom severity along the shoreline and within coves through the lake in 2022 (Blenis, 2024). The third component in 2022 showed no strong spatial trend and exhibited more noise (Figure 7H).
3.3 Comparison of k-means and PCA results
K-means clustering of NDCI values, alongside removing regular aquatic vegetation signals, allowed analysis of both daily and annual HAB behaviour (Figures 4, 6). In 2021 blooms extended across Darlings Lake, with reduced intensity close to the primary inlet and outlet of the lake. In 2022 blooms were closer to the shore, especially on the western side of the lake.
PCA results from NDCI signal allowed for a high level analysis of annual HAB behaviour that included aquatic vegetation signal (Figure 7). These results corroborate the k-means findings. In 2021, pixels overlying the middle of the lake - the vast majority of which would be too deep for satellites to capture subsurface aquatic vegetation - were most influential in all three components. This indicates that not only was bloom signal strong, but the change in signal between clear and HAB-filled waters was much more dramatic than shoreline vegetation, which would typically dominate signal strength in aquatic environments (Xie et al., 2008). Shoreline vegetation and smaller blooms dominate 2022 behaviour, leading to an inverse pattern in the 2022 PCA.
3.4 Comparing in situ and satellite data
Real-time in situ water quality monitoring in the summer of 2022 identified high phycocyanin and chl-a values related to algae blooms in late July and early August (Figure 5). Values then only spiked occasionally in September and October. Temperatures were above 20
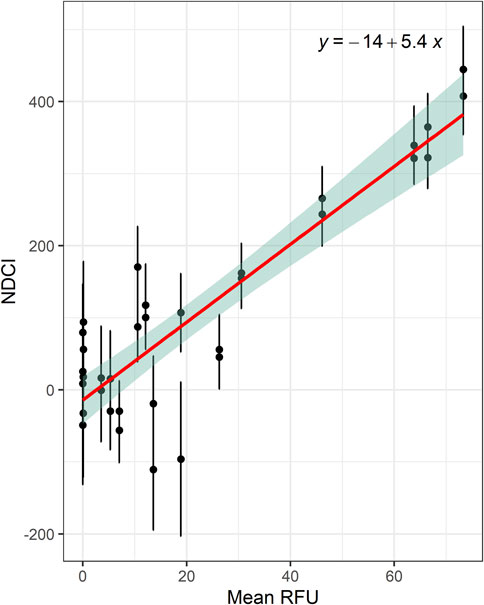
Figure 8. Visualization of the linear relationship between mean calculated NDCI surrounding each tracker and the corresponding day’s mean phycocyanin concentration measured in RFU (
4 Discussion
This paper offers a strong addition to monitoring practices for small water bodies that have been difficult to capture given the coarser spatial resolution of traditional multispectral satellites like the Landsat series. Municipal water management and stewardship groups with limited funds can adapt our methodology to other sites, expanding monitoring efficiency and range to be alerted to potential HABs, and analyse their spatial-temporal trends over single seasons.
Applying machine learning processes to high-resolution satellite imagery successfully estimated HAB activity. Classified imagery compared against an estimated baseline highlighted anomalous activity related to cyanobacteria blooms (Figure 4). Annual trends of HAB dynamics were visualized between the 2021 and 2022 bloom seasons (Figure 6). Results of the annual bloom dynamics are corroborated by HRAA field staff drone surveys in 2021 and combine nearshore and vessel observations in 2022. Scaled and calibrated NDCI values showed high levels of correlation with in situ phycocyanin measurements (Figure 8), indicating that imagery can be used to estimate phycocyanin concentrations from remote NDCI values. Our approach uses high-resolution satellite imagery, with pixels covering only 0.2 ha, to monitor small water bodies while reducing or eliminating signal noise from shorelines. In the following sections we discuss the individual methods and their strengths and weaknesses.
4.1 Classifying HAB activity
Darlings Lake has been affected by large-scale HABs since the 1990s, and was added to New Brunswick’s Public Health Advisory List on 9 July 2021 (Blenis, 2024). While in situ field testing is limited to scheduled revisit dates and specific locations, satellite image analysis as presented in this paper offers a promising low-cost approach to observe and identify HABs. Both methods complement each other. The in situ monitoring are valuable ground-truths, and satellite imagery evaluate the spatio-temporal extent of potentially harmful HABs. The high spatial and temporal resolution of the satellite imagery presented here enabled detecting HAB signals successfully, especially when the HAB extends across a large fraction of the lake as was observed in 2021 (Figure 4). Using a baseline image we are able to account for and suppress the aquatic vegetation signal from the HAB signal, highlighting the HAB in each image. These methods have been verified through analysis of PCA results to extract spatial trends and the results from Cohen’s Kappa accuracy estimate applied to sample dates (Table 3).
While deep learning (DL) models have shown to be outperforming other classification methods, they also require for a large training data set, which are dependant on hours of manual expert annotations. For remote sensing questions DL models need to extract joint features from spectral, spatial and temporal data and need to be transferable to other data sets in all three domains (Sagan et al., 2020). Our method on the other hand does not require a large training data set, nor is it prone to the risk of over-fitting or being biased to a particular feature.
Our technique is promising for detecting large scale blooms, analysing the affected areas in the lake to assist decision making for future monitoring and HAB mitigation sites. Detecting HAB along the shoreline within the resolution of the satellite imagery (here, 3 m) is more challenging. Short wavelengths scatter easily in the atmosphere, and peripheral objects can complicate signal readings. Coastlines are additionally affected by reflection from trees and brush, which can deteriorate the analysis result. The bloom intensity for the 2022 data is stronger in coastal areas and bays compared to the extent in the lake observed in 2021 (Figure 6), which possibly requires additional in situ testing, especially in marshy area in the south of the lake. Vegetation and water level changes along the shore are predominant signals in 2022 (associated with the first principal component in Figure 7).
In this study, we aim to reduce uncertainty in differentiating HAB activity from shoreline signals by calibrating the NDCI rasters, rather than the common approach of removing pixels bordering the shore. The calibration involves subtraction of a baseline raster (mean of seven rasters without bloom). For water bodies like Darlings Lake that experience shoreline-adjacent algal blooms, the removal of pixels would reduce the analytical area and severely reduce or remove HAB detection and estimated severity. The calibration approach is a compromise between reading imagery directly into an unsupervised learning model, which could falsely indicate HAB activity from changes in aquatic vegetation health or water levels, and the complete removal of shallow-water pixels, which could miss the warmer shoreline waters where blooms are most often observed. Through consultations with field partners at the HRAA and verification through manual investigation of imagery and accuracy assessments, we are confident that in this pilot study this methodology allowed us to produce the best results.
4.2 Comparing measurements between in situ and remote sensors
In situ monitoring of HAB events in Darlings Lake has evolved over several years. In 2021 the HRAA conducted dockside water samples and water quality testing, alongside using a drone during an August bloom to observe its lake-wide extent. While both methods allowed for an estimate of the bloom’s severity, these methods were not able to consistently project the HAB dynamics long-term.
In 2022 two AlgaeTracker™ water sensors were placed along the center left shoreline of Darlings Lake (Figure 1). These in situ measurements allow for real-time monitoring. The monitors also provide ground-truth confirmation of bloom activity in the area around the devices beyond image analysis.
Mean NDCI measurements are positively correlated with phycocyanin values measured in RFU (Figure 8). However, the linear relationship found in this experiment (Equation 4) might not be directly transferable to other satellite types or phycocyanin readings. Phycocyanin readings depend on the methodology of how they were measured in water and the lack of control over the environment-based measurement. Fluorescence can be affected by light, nutrient conditions, cell age, and other factors (e.g., Gregor et al., 2007). Measurements in the laboratory when phycocyanin are dissolved in water vary compared to when they are in association with other pigments, proteins, and membranes. Temperature and turbidity also affect the readings. Correction factors might be necessary to improve the accuracy of any absolute values such as cyanobacteria cell concentration derived from phycocyanin readings, which are environment-dependent (Rowan, 1989).
4.3 Understanding annual HAB dynamics through climate data, satellite imagery, and field observations
The summer of 2021 exhibited drought-like conditions through May and June, alleviated by large rainfall events in July; Saint John, New Brunswick received 233.8 mm of rain, almost three times the monthly average of 88.3 mm (Lewis, 2021). Sudden influxes of accumulated organic compounds (both pollutants and nutrients alike) from rainfall under these conditions can raise the likelihood and severity of cyanobacteria blooms considerably (Lürling et al., 2018; Paerl and Huisman, 2009). HAB events through the summer were extensive, and tended to accumulate in the northeastern section of the lake and along the shoreline (Figure 6 left). The regions with highest bloom severity are also closest to the mouths of the Kennebecasis River and four smaller estuaries, all of which flow through agricultural regions into the lake. The high bloom sum in the northeastern region was only lower around the river input, which would be more turbulent and therefore less habitable for cyanobacteria to grow in.
Both lower temperatures and a wetter season were observed in 2022. May and June 2022 were cooler than average and exhibited regular rainfall. July and August experienced eight large rainfall events at regular intervals, and a maximum rainfall of 33 mm (Canadian Centre for Climate Services, 2024). Field staff noted that regular blooms in late July and early August (Figure 5) remained close to shore, and did not extend across the lake like in 2021 (Blenis, 2024).
While AlgaeTracker™ buoys were not used in 2021, results from both composite k-means and PCA maps demonstrate similar spatial trends to field observations and drone imagery. The combined three methods, as well as external climate data, suggest that the combination of abnormally high rainfall events interspersed with long periods of warm temperatures between allowed for favourable conditions for lake-wide bloom events. In 2022 total seasonal precipitation was high, but maximum rainfall events were less than half of July 2021s largest rainfall event. Regular rainfall throughout 2022, alongside lower input excess nutrient from a single event could allow for favourable conditions, while reducing the likelihood of widespread blooms like the previous year.
4.4 HAB frequency
Blooms in Darlings Lake appear to follow a seasonal trend. In both 2021 and 2022, HABs initially began to occur in mid-July, reoccurring a few times until September. While satellite imagery was not available to capture images on the same frequency of the in situ sampling (Figure 5), the imagery was able to capture most of the large-scale blooms in 2022.
High temperatures, sporadic rainfall, and input of excess nutrients contribute to the likelihood of algal blooms developing (Paerl and Otten, 2013). Precipitation events were often followed by dry conditions, especially in 2021, leading for Darlings Lake to experience some of the most favourable conditions for HABs in recent history (Canadian Centre for Climate Services, 2024; Blenis, 2024; Paerl and Huisman, 2008). Since 2022, the watershed has not experienced the same behaviour in rainfall, and the HRAA has noted that while there have been occasional small blooms along the shoreline, they have been less than 3 m in area, smaller than a SuperDove satellite pixel (Blenis, 2024; Kington and Collison, 2022).
4.5 Addressing limits and uncertainties in HAB detection with satellite imagery
There were some limits when it came to HAB detection over Darlings Lake. The most prominent limitation was that while the classification could easily identify changes in open water, differences in reflectance along the shoreline led to slight changes in classification numbers between images regardless of bloom presence. In the future, bloom identification without accounting for shoreline signal variability could lead to misinterpretation when identifying small blooms.
Temporal variability in classification could be caused by a host of different circumstances. The first is differing magnitudes of reflectance throughout the year, or time of day between satellite fly-overs, leading to differing solar zenith angles (Ma et al., 2020). PlanetScope instruments each have harmonized calibrations to account for each sensors’ calculated sensitivity, but this is naturally less consistent than using a single sensor’s repeated observation instead (Ma et al., 2020). Other factors depend on the local environment. Water level changing through the summer from either droughts or flood events can change reflectance levels at or near the water’s surface and shoreline (Kislik et al., 2022). These changes in water level could change the relative NDCI value. Future research will consider measuring changes in water level while conducting in situ field surveys to see how seasonal differences in the shoreline could be affecting these results.
Haze and seasonal atmospheric effects - such as increased levels of smoke due to extended and widespread fire seasons, or fog, which is common around the Bay of Fundy, where Darlings Lake is located - are another challenge for time series analyses of multi-spectral imagery. It is difficult to correct with generic atmospheric corrections (Ahmad et al., 2019). Haze is a common artifact in multi-spectral data caused by fractions of water vapor, ice, fog, sand, dust, smoke, or other small particles in the atmosphere (Ahmad et al., 2019). Images are therefore not automatically flagged for pixel error as would be implemented for a day with extended cloud cover. Fog or smoke from wildfires is a likely factor affecting a satellite image on July
Surface roughness via turbulence can also lead to confusion identifying a bloom. Windy days can change the water’s surface from a spectral reflector to a diffuse reflector, leading to a difference in signal strength (McClain and Strong, 1969). At the moment an experienced observer is needed to manually remove days with turbulence. In the future, we plan to add information from rainfall and wind anomalies that may cause surface roughness or for the algorithm to automatically remove such images from the analysis or classify it as a non-bloom day.
NDCI is more effective than NDVI in highlighting bloom extent and severity in the water overall. The NDCI values are less affected on hazy days, and aquatic vegetation and algae signals have a higher relative contrast against water signals. We find that while the above conditions affected NDVI values, the NDCI values are less affected by atmospheric effects and glare (Figure 3), similar to studies by Kislik et al. (2022); Zhang et al. (2018).
Future work to improve HAB detection could include fusing time series of index rasters from different satellite constellations and thereby increasing the number of images. For example, Sadeh et al. (2021) integrated PlanetScope and Sentinel-2 images to identify crop types and their phenology. Their suggested approach improves the spectral quality to Sentinel 2 standards and the temporal and spatial resolution to PlanetScope standards. Additional corrections are required to match the imagery to in situ measurements. Challenging, however, is that different sensors often provide imagery at slightly different bandwidth and spectral responses. Sentinel imagery uses a push-broom optical sensor, while Planet uses filtered imagers (UK, 2024; Kington and Collison, 2022; Onačillová et al., 2022). Recent studies have shown these methods, while comparable, can result in different reflectance readings if their differences are not accounted for (Onačillová et al., 2022; Razzak et al., 2023). Additionally, SmallSats can suffer from cross-sensor inconsistencies, which may decrease the radiometric quality and accuracy of atmospheric correction (e.g., Niroumand-Jadidi and Bovolo, 2021; Liu et al., 2022; Houborg and McCabe, 2018).
Beaulne and Fotopoulos (2024) point out that integrating data from multiple sensors, optical and synthetic aperture radar (which provides insights on cloudy days) requires development of data management and analysis techniques on a large scale to provide general insights into long-term trends in the distribution and frequency of blooms in the environmental and climate change context.
While this study exhibited promising results, our methodology does not currently address a general qualitative question for all satellite imagery, or all bodies of water. The specific focus of this project relates to the Planet SuperDove constellation’s spatial frequency and band width, and is a promising one-satellite-type quantitative assessment of a ML-based classification and analysis tool over one lake. While our pilot study successfully outlined both daily and annual interpretations of HAB behaviour, we expect to significantly adapt our methodology as we expand to new environments, taking into consideration issues like increased turbulence, seabed reflectance, and large changes in shoreline positioning based on flood/drought conditions or tidal signatures. Large bodies of water and shallow ponds would bring unique behaviour and considerations, and will require alterations to the above, more generalized methodology.
We believe that with further testing, this has the opportunity for real applications as an addition to current monitoring practices, expanding monitoring range and frequency. We plan to continue testing this in a range of environments and with different types of algae, including different lakes and expanding to rivers and shallow marine waters. The use of NDCI as a band combination for the analysis means that the scale of monitoring can also be expanded to open-source satellite imagery such as the Sentinel 2 program. Finally, this method could help provide remote sensing insight in future studies, giving researchers the opportunity to conduct a historical analysis of HAB severity and activity with the series of methods we outlined in this paper.
5 Concluding remarks
We demonstrate that multi-spectral satellite surface reflectance rasters at 3 m-resolution can be utilized to monitor harmful algal blooms (HAB) in lakes via time-series analysis of NDCI values. Comparing unsupervised classification with the k-means algorithm of any days compared to a non-bloom baseline raster highlight HAB events in Darlings Lake, New Brunswick, at a similar or higher magnitude than existing aquatic vegetation. The classified k-means maps of mean bloom days effectively visualize the distribution and relative concentration of biotic activity across Darlings Lake (Figure 4).
Mean calculated NDCI values in the area surrounding in situ water monitoring devices showed a positive correlation against measured phycocyanin values (Figure 8; Equation 4). HAB events of various severity were classified successfully, with lake-wide, severe events being classified higher than smaller, localized blooms. Plots demonstrating annual bloom activity via compiling bloom extent estimates can exhibit where HABs appear most frequently (Figure 6).
The above methodology provides a guide for image processing and analysis to monitor HAB activity in near real time, and estimate severity via a NDCI-phycocyanin proxy. Our processing and analysis methodology agree with in situ data and fieldwork conducted by the HRAA, indicating the use of machine-learning techniques on high-resolution satellite imagery can give users near-real-time and historical insight of HAB dynamics in their water bodies. In the future this routine can be further developed to reliably estimate cyanobacteria blooms in a variety of freshwater environments, increasing the scope of modern HAB analysis and mitigation efforts.
Data availability statement
The data analyzed in this study are subject to the following licenses/restrictions: Planet Labs datasets can be purchased or obtained through research licenses. Requests to access these datasets should be directed to Planet Sales, c2FsZXNAcGxhbmV0LmNvbQ==. The HRAA AlgaeTrackerTM data are available online via Atlantic DataStream.
Author contributions
CE: Conceptualization, Data curation, Formal Analysis, Funding acquisition, Investigation, Methodology, Project administration, Resources, Software, Supervision, Validation, Visualization, Writing – original draft, Writing – review and editing. RG: Conceptualization, Data curation, Funding acquisition, Investigation, Methodology, Project administration, Supervision, Writing – original draft, Writing – review and editing, Formal Analysis. CG: Formal Analysis, Funding acquisition, Investigation, Methodology, Software, Writing – review and editing. SB: Conceptualization, Data curation, Resources, Supervision, Validation, Writing – review and editing. RM: Conceptualization, Data curation, Writing – review and editing. JN: Data curation, Formal Analysis, Investigation, Software, Writing – review and editing. SV: Conceptualization, Funding acquisition, Investigation, Project administration, Writing – review and editing. MS: Writing – review and editing. ZS: Formal Analysis, Methodology, Writing – review and editing. SM: Conceptualization, Funding acquisition, Writing – review and editing. CW: Funding acquisition, Investigation, Project administration, Writing – review and editing.
Funding
The author(s) declare that financial support was received for the research and/or publication of this article. This work has been funded by a CFI Innovation Fund award, the Nova Scotia Research fund, and Dalhousie University as part of the Marine Environmental Research Infrastructure for Data Integration and Application Network. The work has been partly funded under the OFI SEED grant SF062023-44. Catherine Evans has been partly funded as Science Horizon intern in 2022 with the Clean Foundation. Clean Foundation is the delivery agent of the Science Horizons Internship Program, funded by Environment and Climate Change Canada. The Digital Research Alliance of Canada provided computational resources. Field work and two AlgaeTracker™ were funded by New Brunswick’s Environmental Trust Fund as part of the HRAA’s Darlings Lake Monitoring and Cyanobacteria Mitigation Research Initiative (project no. 220274). This project was undertaken with the financial support of the Government of Canada through the federal Department of Environment and Climate Change. Ce projet a été réalisé avec l’appui financier du gouvernement du Canada agissant par l’entremise du ministère fédéral de l’Environnement et du Changement climatique.
Acknowledgments
The authors would like to acknowledge Planet Labs Inc. for their ongoing contribution to this project’s research, by providing satellite imagery through a research license agreement, and the Copernicus mission for their open access to Sentinel data. The MERIDIAN team would also like to recognize our research partners at ACAP St John and the Hammond River Angling Association for their help in providing ground-truth referencing for our satellite data, and providing local expertise about Darlings Lake and its surrounding region.
Conflict of interest
The authors declare that the research was conducted in the absence of any commercial or financial relationships that could be construed as a potential conflict of interest.
Generative AI statement
The author(s) declare that no Generative AI was used in the creation of this manuscript.
Publisher’s note
All claims expressed in this article are solely those of the authors and do not necessarily represent those of their affiliated organizations, or those of the publisher, the editors and the reviewers. Any product that may be evaluated in this article, or claim that may be made by its manufacturer, is not guaranteed or endorsed by the publisher.
References
Ahmad, A., Quegan, S., Sufahani, S. F., Sakidin, H., and Abdullah, M. M. (2019). Haze effects on satellite remote sensing imagery and their corrections. Int. J. Adv. Comput. Sci. Appl. 10. doi:10.14569/IJACSA.2019.0101011
Anderson, D. M., Cembella, A. D., and Hallegraeff, G. M. (2012). Progress in understanding harmful algal blooms: paradigm shifts and new technologies for research, monitoring, and management. Annu. Rev. Mar. Sci. 4, 143–176. doi:10.1146/annurev-marine-120308-081121
Beaulne, D., and Fotopoulos, G. (2024). Development of an algal bloom satellite and in situ metadata hub with case studies in Canada. Ecol. Inf. 79, 102447. doi:10.1016/j.ecoinf.2023.102447
Bramich, J., Bolch, C. J., and Fischer, A. (2021). Improved red-edge chlorophyll-a detection for sentinel 2. Ecol. Indic. 120, 106876. doi:10.1016/j.ecolind.2020.106876
Byrne, G., Crapper, P., and Mayo, K. (1980). Monitoring land-cover change by principal component analysis of multitemporal landsat data. Remote Sens. Environ. 10, 175–184. doi:10.1016/0034-4257(80)90021-8
Canadian Centre for Climate Services. (2024). Station results - historical data. Government of Canada. Available online at: https://climate.weather.gc.ca/historical_data/search_historic_data_e.html (Accessed October 2024) [Dataset].
Colkesen, I., Ozturk, M. Y., and Altuntas, O. Y. (2024). Comparative evaluation of performances of algae indices, pixel-and object-based machine learning algorithms in mapping floating algal blooms using Sentinel-2 imagery. Stoch. Environ. Res. Risk Assess. 38, 1613–1634. doi:10.1007/s00477-023-02648-1
Collison, A., and Curdoglo, M. (2025). Planet Surface Reflectance [White Paper]. Planet Labs PBC. Available online at: https://assets.planet.com/marketing/PDF/Planet_Surface_Reflectance_Technical_White_Paper.pdf.
Fung, T., and LeDrew, E. (1987). Application of principal components analysis to change detection. Photogrammetric Eng. remote Sens. 53, 1649–1658.
Geider, R. J. (1987). Light and temperature dependence of the carbon to chlorophyll a ratio in microalgae and cyanobacteria: implications for physiology and growth of phytoplankton. New Phytol. 106, 1–34. doi:10.1111/j.1469-8137.1987.tb04788.x
Gregor, J., Maršálek, B., and Šípková, H. (2007). Detection and estimation of potentially toxic Cyanobacteria in raw water at the drinking water treatment plant by in vivo fluorescence method. Water Res. 41, 228–234. doi:10.1016/j.watres.2006.08.011
Houborg, R., and McCabe, M. F. (2018). A cubesat enabled spatio-temporal enhancement method (cestem) utilizing planet, landsat and modis data. Remote Sens. Environ. 209, 211–226. doi:10.1016/j.rse.2018.02.067
Hu, A., Xie, Z., Xu, Y., Xie, M., Wu, L., and Qiu, Q. (2020). Unsupervised haze removal for high-resolution optical remote-sensing images based on improved generative adversarial networks. Remote Sens. 12, 4162. doi:10.3390/rs12244162
Hu, C. (2009). A novel ocean color index to detect floating algae in the global oceans. Remote Sens. Environ. 113, 2118–2129. doi:10.1016/j.rse.2009.05.012
Huisman, J., Codd, G. A., Paerl, H. W., Ibelings, B. W., Verspagen, J. M., and Visser, P. M. (2018). Cyanobacterial blooms. Nat. Rev. Microbiol. 16, 471–483. doi:10.1038/s41579-018-0040-1
IOCCG (2008). “Why Ocean colour? The societal benefits of Ocean-colour technology,” Reports of the International Ocean-Colour Coordinating Group. Editors T. Platt, N. Hoepffner, V. Stuart, and C. Brown Dartmouth, Canada: IOCCG.
Khan, R. M., Salehi, B., Mahdianpari, M., Mohammadimanesh, F., Mountrakis, G., and Quackenbush, L. J. (2021). A meta-analysis on harmful algal bloom (Hab) detection and monitoring: a remote sensing perspective. Remote Sens. 13, 4347. doi:10.3390/rs13214347
Kim, M., Park, S., Anderson, C., and Stensaas, G. L. (2021). “System characterization report on planet’s superdove,” in System characterization of Earth observation sensors. Editor C. SNR.
Kington, J., and Collison, A. (2022). Scene level normalization and harmonization of planet dove imagery.
Kislik, C., Dronova, I., Grantham, T. E., and Kelly, M. (2022). Mapping algal bloom dynamics in small reservoirs using Sentinel-2 imagery in google Earth engine. Ecol. Indic. 140, 109041. doi:10.1016/j.ecolind.2022.109041
Kutser, T. (2009). Passive optical remote sensing of Cyanobacteria and other intense phytoplankton blooms in coastal and inland waters. Int. J. Remote Sens. 30, 4401–4425. doi:10.1080/01431160802562305
Landis, J. R., and Koch, G. G. (1977). The measurement of observer agreement for categorical data. Biometrics 33, 159–174. doi:10.2307/2529310
Lasaponara, R. (2006). On the use of principal component analysis (PCA) for evaluating interannual vegetation anomalies from SPOT/VEGETATION NDVI temporal series. Ecol. Model. 194, 429–434. doi:10.1016/j.ecolmodel.2005.10.035
Liu, S., Glamore, W., Tamburic, B., Morrow, A., and Johnson, F. (2022). Remote sensing to detect harmful algal blooms in inland waterbodies. Sci. Total Environ. 851, 158096. doi:10.1016/j.scitotenv.2022.158096
Lürling, M., Mello, M. Me, van Oosterhout, F., de Senerpont Domis, L., and Marinho, M. M. (2018). Response of natural Cyanobacteria and algae assemblages to a nutrient pulse and elevated temperature. Front. Microbiol. 9, 1851. doi:10.3389/fmicb.2018.01851
Ma, X., Huete, A., Tran, N. N., Bi, J., Gao, S., and Zeng, Y. (2020). Sun-angle effects on remote-sensing phenology observed and modelled using Himawari-8. Remote Sens. 12, 1339. doi:10.3390/rs12081339
MacQueen, J. (1967). “Classification and analysis of multivariate observations,” in 5th Berkeley symp. Math. Statist. Probability. LA USA: University of California Los Angeles, 281–297.
Makarau, A., Richter, R., Müller, R., and Reinartz, P. (2014). Haze detection and removal in remotely sensed multispectral imagery. IEEE Trans. Geoscience Remote Sens. 52, 5895–5905. doi:10.1109/tgrs.2013.2293662
McCarron, P., Rafuse, C., Scott, S., Lawrence, J., Bruce, M. R., Douthwright, E., et al. (2023). Anatoxins from benthic Cyanobacteria responsible for dog mortalities in New Brunswick, Canada. Toxicon 227, 107086. doi:10.1016/j.toxicon.2023.107086
McClain, E. P., and Strong, A. E. (1969). “On anomalous dark patches in satellite-viewed sunglint areas,”Mon. Weather Rev., 97. CO, 875–884. doi:10.1175/1520-0493(1969)097
Metsamaa, L., Kutser, T., and Strömbeck, N. (2006). Recognising cyanobacterial blooms based on their optical signature: a modelling study. Boreal Environ. Res. 11, 493. Available online at: http://hdl.handle.net/10138/578347.
Milne, B. F., Toker, Y., Rubio, A., and Nielsen, S. B. (2015). Unraveling the intrinsic color of chlorophyll. Angew. Chem. Int. Ed. 54, 2170–2173. doi:10.1002/anie.201410899
Mishra, S., and Mishra, D. R. (2012). Normalized difference chlorophyll index: a novel model for remote estimation of chlorophyll-a concentration in turbid productive waters. Remote Sens. Environ. 117, 394–406. doi:10.1016/j.rse.2011.10.016
Niroumand-Jadidi, M., and Bovolo, F. (2021). Water quality retrieval and algal bloom detection using high-resolution cubesat imagery. ISPRS Ann. Photogrammetry, Remote Sens. Spatial Inf. Sci. 3, 191–195. doi:10.5194/isprs-annals-v-3-2021-191-2021
Onačillová, K., Gallay, M., Paluba, D., Péliová, A., Tokarčík, O., and Laubertová, D. (2022). Combining landsat 8 and sentinel-2 data in google Earth engine to derive higher resolution land surface temperature maps in urban environment. Remote Sens. 14, 4076. doi:10.3390/rs14164076
Paerl, H. W., and Huisman, J. (2008). Blooms like it hot. Science 320, 57–58. doi:10.1126/science.1155398
Paerl, H. W., and Huisman, J. (2009). Climate change: a catalyst for global expansion of harmful cyanobacterial blooms. Environ. Microbiol. Rep. 1, 27–37. doi:10.1111/j.1758-2229.2008.00004.x
Paerl, H. W., and Otten, T. G. (2013). Harmful cyanobacterial blooms: causes, consequences, and controls. Microb. Ecol. 65, 995–1010. doi:10.1007/s00248-012-0159-y
Rasti, B., Scheunders, P., Ghamisi, P., Licciardi, G., and Chanussot, J. (2018). Noise reduction in hyperspectral imagery: overview and application. Remote Sens. 10, 482. doi:10.3390/rs10030482
Razzak, M. T., Mateo-García, G., Lecuyer, G., Gómez-Chova, L., Gal, Y., and Kalaitzis, F. (2023). Multi-spectral multi-image super-resolution of sentinel-2 with radiometric consistency losses and its effect on building delineation. ISPRS J. Photogrammetry Remote Sens. 195, 1–13. doi:10.1016/j.isprsjprs.2022.10.019
Rowan, K. S. (1989). Photosynthetic pigments of algae. Melbourne, Australian: Cambridge University Press.
Sadeh, Y., Zhu, X., Dunkerley, D., Walker, J. P., Zhang, Y., Rozenstein, O., et al. (2021). Fusion of Sentinel-2 and PlanetScope time-series data into daily 3 m surface reflectance and wheat LAI monitoring. Int. J. Appl. Earth Observation Geoinformation 96, 102260. doi:10.1016/j.jag.2020.102260
Sagan, V., Peterson, K. T., Maimaitijiang, M., Sidike, P., Sloan, J., Greeling, B. A., et al. (2020). Monitoring inland water quality using remote sensing: potential and limitations of spectral indices, bio-optical simulations, machine learning, and cloud computing. Earth-Science Rev. 205, 103187. doi:10.1016/j.earscirev.2020.103187
Shen, L., Xu, H., and Guo, X. (2012). Satellite remote sensing of harmful algal blooms (HABs) and a potential synthesized framework. Sensors 12, 7778–7803. doi:10.3390/s120607778
Singh, A. (1989). Review article digital change detection techniques using remotely-sensed data. Int. J. Remote Sens. 10, 989–1003. doi:10.1080/01431168908903939
Song, T., Zhang, H., Xu, Y., Dai, X., Fan, F., Wang, Y., et al. (2024). Cyanobacterial blooms in Lake taihu: temporal trends and potential drivers. Sci. Total Environ. 942, 173684. doi:10.1016/j.scitotenv.2024.173684
Sutherland, M. (2021). Unbelievably visible’ blue-green algae cropping up in more N.B. waterways. New Brunswick: CBC.
Uhl, F., Graesdal Rasmussen, T., and Oppelt, N. (2022). Classification ensembles for beach cast and drifting vegetation mapping with sentinel-2 and planetscope. Geosciences 12. doi:10.3390/geosciences12010015
Uk, S. S. (2024). “ESA’S Earth observation third party missions data access guide,” Tech. Rep. Frascati, IT: European Space Agency. Available online at: https://earth.esa.int/eogateway/documents/d/earth-online/third-party-mission-data-access-guide.
Wasehun, E. T., Beni, L. H., Di Vittorio, C. A., Zarzar, C. M., and Young, K. R. (2025). Comparative analysis of sentinel-2 and planetscope imagery for chlorophyll-a prediction using machine learning models. Ecol. Inf. 85, 102988. doi:10.1016/j.ecoinf.2024.102988
Whalen, B., and Strang, J. (2017). “Water quality monitoring report,”Tech. Rep. New Brunswick, CA: Kennebecasis Watershed Restoration Committee. Available online at: https://www.kennebecasisriver.org/reports.
Xiao, Z., Liang, S., Wang, T., and Liu, Q. (2015). Reconstruction of satellite-retrieved land-surface reflectance based on temporally-continuous vegetation indices. Remote Sens. 7, 9844–9864. doi:10.3390/rs70809844
Xie, Y., Sha, Z., and Yu, M. (2008). Remote sensing imagery in vegetation mapping: a review. J. Plant Ecol. 1, 9–23. doi:10.1093/jpe/rtm005
Yao, Y., Hu, C., Cannizzaro, J. P., Zhang, S., Barnes, B. B., Xie, Y., et al. (2024). Detecting cyanobacterial blooms in the caloosahatchee river and Estuary using PlanetScope imagery and deep learning. IEEE Trans. Geoscience Remote Sens. 62, 1–13. doi:10.1109/tgrs.2024.3354211
Keywords: cyanobacteria, SuperDove, k-means, PCA, land classification, algal blooms, freshwater, NDCI
Citation: Evans C, Gehrmann R, Greene C, Blenis S, MacKinnon R, Newport J, Vela S, Smith M, Sadeghi Z, Matwin S and Whidden C (2025) Monitoring harmful algae blooms in Darlings Lake, New Brunswick, using K-means clustering of multi-spectral imagery. Front. Remote Sens. 6:1633491. doi: 10.3389/frsen.2025.1633491
Received: 22 May 2025; Accepted: 17 July 2025;
Published: 18 August 2025.
Edited by:
Saeid Janizadeh, University of Hawaii, United StatesReviewed by:
Ismail Colkesen, Gebze Technical University, TürkiyeTing Song, Jiangsu Wuxi Environmental Monitoring Center, China
Copyright © 2025 His Majesty the King in Right of Canada. This is an open-access article distributed under the terms of the Creative Commons Attribution License (CC BY). The use, distribution or reproduction in other forums is permitted, provided the original author(s) and the copyright owner(s) are credited and that the original publication in this journal is cited, in accordance with accepted academic practice. No use, distribution or reproduction is permitted which does not comply with these terms.
*Correspondence: Catherine Evans, Y2F0aGVyaW5lZXZhbnNAZGFsLmNh