 Jan Pisek
 Catherine Akinyi Odera
 Angela Erb3
 Alexander Marshak
 Yuri Knyazikhin
- 1Tartu Observatory, University of Tartu, Tartu, Estonia
- 2KappaZeta, Tartu, Estonia
- 3School for the Environment, University of Massachusetts Boston, Boston, MA, United States
- 4NASA Goddard Space Flight Center, Greenbelt, MD, United States
- 5Earth and Environment Department, Boston University, Boston, MA, United States
The Directional Area Scattering Factor (DASF) quantifies the fraction of visible canopy leaf area in a given direction and has demonstrated utility in characterizing vegetation structure. While traditionally applied to dense canopies under the assumption of a non-reflective background, its broader applicability remains under investigation. This brief research report presents the first, direct empirical assessment of the relationship between DASF and the clumping index (CI), which describes the non-random grouping of foliage within canopy structures. Using data from the Earth Polychromatic Imaging Camera (EPIC) onboard the DSCOVR satellite, we evaluate DASF and CI across a variety of Australian Terrestrial Ecosystem Research Network (TERN) sites representing diverse vegetation densities and structures. Complementary in situ digital hemispherical photography (DHP) and CI estimates are used to validate satellite observations. Our findings provide empirical support for previously modeled relationships between DASF and CI. The retrieval accuracy in sparse canopies is challenged by increased background influence, requiring either refined observation conditions or advanced correction techniques. Our results confirm the potential of DASF as a scalable structural vegetation metric, aiding the development and interpretation of remote sensing vegetation indices and supporting improvements in canopy structural parameter retrieval from spaceborne platforms.
1 Introduction
The Directional Area Scattering Factor (DASF) is defined as the bidirectional reflectance factor (BRF) of vegetation with a non-reflective background and non-absorbing leaves (Knyazikhin et al., 2012). Directional DASF is related to the fraction of leaf area in a canopy that is visible from outside the canopy in a given direction (Sternberg et al., 2016). The concept of DASF has proven to be useful in mapping vegetation structure in both forest and agricultural vegetation (Schull et al., 2007; Latorre-Carmona et al., 2014; Ni et al., 2021; Sun et al., 2022; Vanhatalo et al., 2014). DASF provides information critical to accounting for structural contributions to measurements of leaf biochemistry from remote sensing (Knyazikhin et al., 2012). The utility of the DASF concept in mapping vegetation structure validity has been speculated to be confined to dense canopies due to the underlying assumption of vegetation bounded underneath by a non-reflecting black surface (Adams et al., 2018).
Clumping index (CI) is another parameter that has been used to describe vegetation structure (Nilson, 1971; Chen and Black, 1992). CI quantifies the level of foliage grouping within distinct canopy structures such as tree crowns, shrubs, and row crops relative to a random distribution (Chen et al., 2005). Modeled simulations indicated an expected strong dependency between the DASF and the canopy clumping index (Stenberg and Manninen, 2015).
Here, for the first time, we seek to provide the empirical, direct evidence of the relationship between DASF and CI, using observations and products from the Earth Polychromatic Imaging Camera (EPIC), a 10-channel spectroradiometer (317–780 nm) onboard DSCOVR (Deep Space Climate Observatory) spacecraft (Marshak et al., 2018). All EPIC observations are around the back-scattering direction: from 2 to 12° from backscattering. DASF parameter is one of the unique satellite-derived products included in the suite of DSCOVR EPIC Level 2 Vegetation Earth System Data Record (VESDR) (Knyazikhin and Myneni, 2021). The parameters included in the DSCOVR EPIC Level 2 Vegetation Earth System Data Record (VESDR) have also shown promise in retrieving the clumping index (Pisek et al., 2021). The DASF-CI comparison is carried over and is complemented with available in situ DHP measurements and corresponding CI estimates over select Australian Terrestrial Ecosystem Research Network (TERN; Lowe et al., 2016) sites which provide a wide range of vegetation structures growing under environmental conditions that may differ from the common assumptions behind the concept of spectral invariants.
An indirect link between DASF and clumping index (approximated by a broadleaf fraction of leaf area) using high-resolution airborne hyperspectral imagery was previously shown in Knyazikhin et al. (2012). In this brief research report, we seek to explore if the DASF can be accurately derived even from satellite observations at coarse resolution, with the DASF-CI relationship being valid across scales. Our results contribute towards the interpretation of vegetation indices as well as developing new indices along with an explanation of their sensitivity to various vegetation parameters.
2 Methods
2.1 Study sites and data for validation
Terrestrial Ecosystem Research Network (TERN) is a site-based research infrastructure, which provides continuous tracking of the key terrestrial ecosystem attributes in Australia (Karan et al., 2016). The TERN EcoImages provide access to all images collected at TERN survey sites across Australia (https://ecoimages.tern.org.au/; last accessed 04/Apr/2025). We used a subset of sites with available digital hemispherical photography (DHP), taken inside the Core 1 ha plot at each of these TERN SuperSites (Table 1), following the SuperSites vegetation monitoring protocols (Australian SuperSites Network, 2022). The approach we have applied to obtain in situ clumping index (CI) values from DHP is described in detail in Pisek et al. (2013), Pisek et al. (2021).
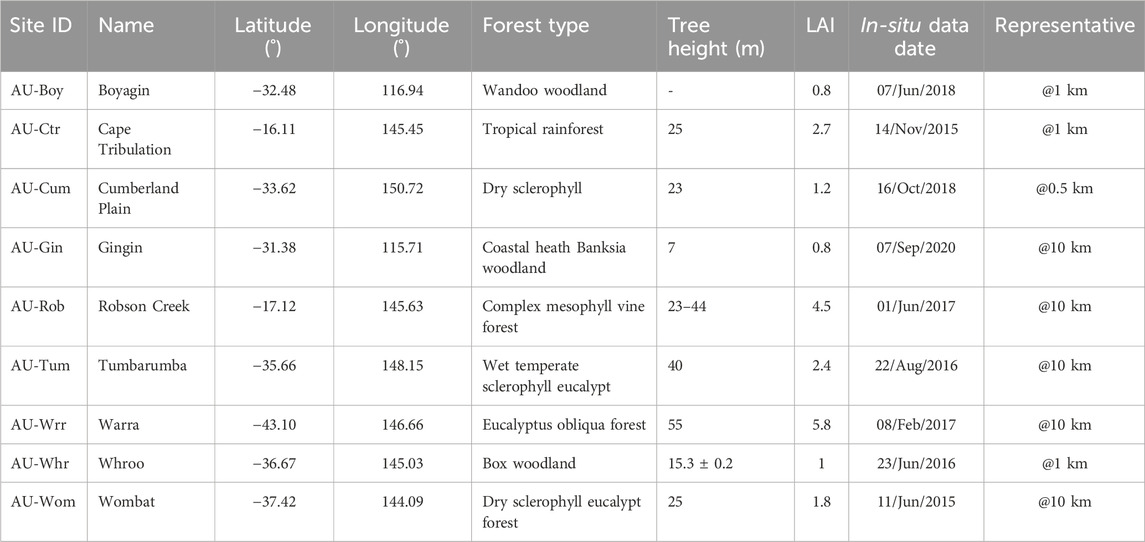
Table 1. Overview of the included TERN SuperSites. Site information collected from the OzFlux network (http://www.ozflux.org.au, also see Beringer et al., 2016).
The spatial representativeness of included TERN sites in this study, as reported in Table 1, was previously evaluated in Pisek et al. (2013) using an approach originally proposed by Román et al. (2009). This method employs variograms to analyze broadband albedo in the shortwave range (0.25–5.0 μm) using data from the Landsat/Operational Land Imager (OLI). A site is considered spatially representative if the overall variability within its inner components (OLI pixel albedo values over a 1 km area) is comparable in magnitude to the surrounding region within the footprint of the given sensor. For example, Wombat (Figure 1A) can be considered a border-line spatially representative site since the sill value (i.e., the variogram range where the function flattens) for the corresponding area is close to the critical value of 0.0005 suggested by Wang et al. (2017). The Whroo site (Figure 1C) is spatially representative at a 1 km resolution but does not meet representativeness criteria at a nominal spatial resolution of 10 km of the EPIC data (Figure 1D). Further details on the methodology of spatial representativeness assessment using variograms can be found in Román et al. (2009).
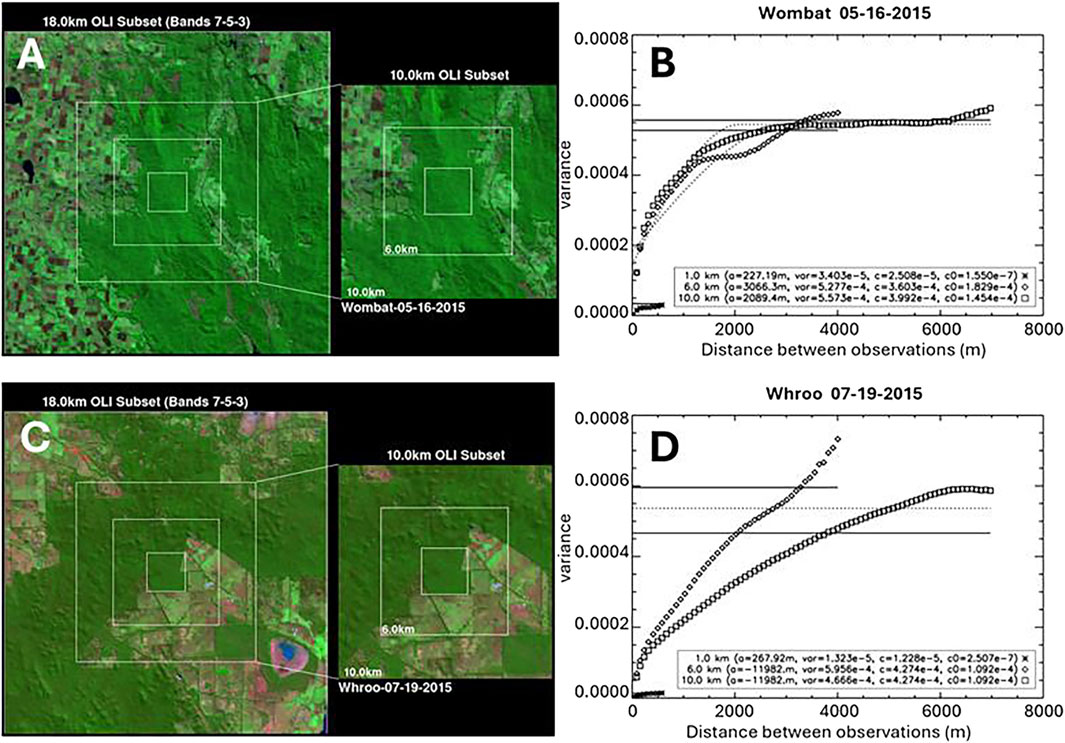
Figure 1. Shortwave BRF composites centered at (A) Wombat and (C) Whroo TERN study sites. (B,D) Variogram estimators (ӿ, ◊,□ symbols), fitted spherical model (····) and sample variances (−) acquired with Operational Land Imager subsets and areas of interest 1, 6, and 10 km as a function of the space between observations. Explanations for the legend in (B,D): (a) range; var - sample variance; (c) sill; c0 - nugget.
2.2 DSCOVR EPIC Vegetation Earth System Data Record (VESDR) product
We retrieved DASF and CI using EPIC data from the DSCOVR EPIC Version 2 Level 2 VESDR product. This dataset provides DASF values at the surface level, representing the Canopy Bidirectional Reflectance Factor assuming no radiation absorption by the foliage (Knyazikhin and Myneni, 2021). To ensure high data quality, we only used VESDR records where both the input data and output met the highest quality standards (QA_VESDR = 0).
In addition to DASF, we also used several other variables from the EPIC VESDR product, including Leaf Area Index (LAI), Sunlit Leaf Area Index (SLAI), Solar and View Zenith Angles (SZA, VZA). The CI estimates were derived following the method described by Pisek et al. (2021), which uses SLAI and LAI values from observations close to SZA, VZA = 57° included in the DSCOVR EPIC VESDR product. Using the observations under oblique angles also means less interference from the soil background (Yang, 2022).
To support this study, we obtained EPIC observations for pixels containing TERN SuperSites (Table 1) during the first three full years of the mission (2016-2018). This time frame was chosen because it overlaps with the availability of high-quality in situ measurements (Table 1) while avoiding the 2019–2020 Australian drought and bushfires, which altered site characteristics (see Woodgate et al., 2025). Additionally, this period excludes the time when DSCOVR was placed in extended safe mode due to inertial navigation unit degradation in 2019 (Marshak et al., 2021). The mission resumed full operations on 2 March 2020.
It is important to note that the DSCOVR EPIC VESDR product is currently released with a provisional quality status. The Version 2 VESDR data are provided on a 10 km sinusoidal grid, with a 65–110-min temporal resolution. These data are derived from the upstream DSCOVR EPIC L2 MAIAC (Multi-Angle Implementation of Atmospheric Correction Version 2) surface reflectance product (Lyapustin et al., 2018). All VESDR data were downloaded via NASA’s Open-source Project for a Network Data Access Protocol (OPeNDAP) [https://opendap.larc.nasa.gov/opendap/] (last accessed 3 April 2025).
3 Results and discussion
First, we looked at the intercomparison of clumping index (CI) values obtained from in situ data and EPIC retrievals. Figure 2 shows there is a very good agreement between EPIC and in situ values of clumping index over three out of the four spatially representative sites with available digital hemispherical photography (DHP) data. Pisek et al. (2021) tracked the discrepancy in case of the fourth spatially representative site, Tumbarumba, to the presence of understory layer, which adds to the overall randomness of foliage clumping for in situ measurements, while satellite measurements respond primarily to the structural effects in upper levels of canopies (Pisek et al., 2015). The disagreement between clumping estimates from in situ and satellite measurements in the case of Wombat site can be explained by the EPIC observation being taken at VZA = 61°. DSCOVR EPIC observations with viewing zenith angles (VZA) greater than 60° are generally not recommended for quantitative analyses (Lyapustin et al., 2021). At such high VZA values, the spatial resolution of EPIC decreases significantly, leading to increased pixel distortion and potential inaccuracies in data interpretation, as could be demonstrated in our study in the case of the Wombat site.

Figure 2. Comparison of clumping index values retrieved from EPIC data and available field measurements with DHP over representative (blue full circles) and non-representative (red crosses) TERN sites at the EPIC’s nominal spatial resolution. 1:1 line is shown in black.
There is a poor agreement between the spatially limited in situ CI measurements and EPIC CI retrievals over non-representative sites (Figure 2). The CI retrievals from EPIC data may still be correct–it is only that the spatial extent of in situ measurements (1 ha) is not deemed representative of the greater area covered by the EPIC signal. The agreement between in situ and EPIC CI retrievals over spatially representative sites is encouraging for proceeding with the examination of the actual CI-DASF relationship.
There is only a rather weak relationship (R2 = 0.15) between DASF and CI values from EPIC data calculated across good quality observations with a wider range of SZA angles (Figure 3A). The relationship improves if only the observations taken with the SZA range of 53°–58° are considered, where the G-function can be considered as almost independent of leaf inclination (G≅ 0.5) (Weiss et al., 2004) – the original assumption behind simulating the DASF-CI relationship by Stenberg and Manninen (2015) and plotted as red full circles in Figure 3.
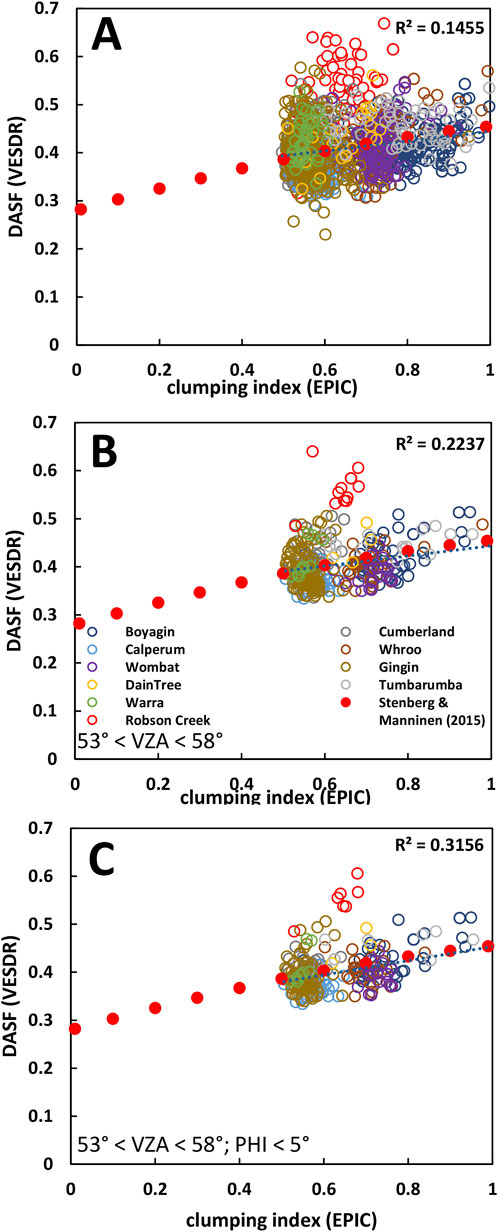
Figure 3. (A) Relationship between DASF and clumping index (CI) with EPIC observations with SZA >50° over TERN sites; (B) the same but restricted to VZA 53°–57° over TERN sites.; (C) the same as (B) but further restricted to observations with phase angle <5°. The proposed hyperbolic relationship by Stenberg and Manninen (2015) (DASF = 0.28 + 0.23tanh (CI)) is shown in red full circles in all sub-figures.
Figures 3B,C illustrate the effect of the phase angle on the DASF retrieval uncertainty. The hot spot, backscattering region has been shown to be very rich in information (Gerstl, 1999; Goel et al., 1997; Qin et al., 2002; Ross and Marshak, 1989). DASF variability decreases if only the observations with smaller phase angle (PHI <5°) are considered; subsequently, the DASF-CI relationship from EPIC data also improves (R2 = 0.32) and aligns accordingly with the predicted, simulated relationship by Stenberg and Manninen (2015) (Figure 3C).
All theoretical results regarding spectral invariants theory are derived for sufficiently dense (LAI ≳ 3) vegetation bounded from below by a non-reflecting plane (Sternberg et al., 2016). The horizontal plane assumption can be considered as not met in the case of the Robson Creek site, which is located in a rather mountainous terrain with varying topography (Woodgate et al., 2012) across the footprint of the EPIC sensor. As the Robson Creek site has quite a dense vegetation (LAI = 4.5), the varying topography may explain the deviation of the results over this site from the predicted DASF-CI relationship by Stenberg and Manninen (2015) in all individual plots included in Figure 3. Results for the Robson Creek were included in Figure 3 only for illustrative purposes and were not included in the reported relationships.
4 Summary
Our results can serve as a first, direct verification of modelling work by Stenberg and Manninen (2015) with empirical data and confirmation of the suggested link between DASF and foliage clumping. This also suggests that DASF can be accurately derived even from satellite observations at coarse resolution, with the DASF-CI relationship being valid across scales. Our results also indicate that truly successful, reliable retrieval may still be possible only while meeting the assumptions of dark, non-reflecting plane background and/or sufficiently dense vegetation. Many of the included, available TERN sites are rather sparse in vegetation with low LAI (Table 1). This translates into the relatively wide spread of values even in Figure 3C along the course of function originally modelled by Stenberg and Manninen (2015) for optimal conditions, which may be quite different from the conditions of actual TERN sites. We try to limit the effect of background and unknown, actual G-function by considering only the EPIC retrievals with SZA values in the range of 53°–57°. At the same time this brought us to the brink of the already mentioned recommended SZA limit of suitable EPIC observations (Lyapustin et al., 2021; Knyazihkin and Myneni, 2021). Alternatively, methods for removing the impact of background on total forest (or other vegetation canopy) reflectance need to be applied in sparse canopies. Removing the ground contribution to the bidirectional reflectance factor before retrieving spectral invariant parameters was also recommended by Yang et al. (2017). Radiative-transfer-based techniques for removing ground influences are well advanced in remote sensing (Knyazikhin et al., 2005; Ganguly et al., 2008).
Data availability statement
Publicly available datasets were analyzed in this study. This data can be found here: https://opendap.larc.nasa.gov/opendap/; https://ecoimages.tern.org.au/.
Author contributions
JP: Conceptualization, Investigation, Methodology, Visualization, Formal analysis, Funding acquisition, Writing – original draft. CAO: Investigation, Writing – review and editing. AE: Investigation, Visualization, Writing – review and editing. AM: Writing – review and editing. YK: Writing – review and editing.
Funding
The author(s) declare that financial support was received for the research and/or publication of this article. This study was funded by the Estonian Research Council grant PRG1405 and by Estonian Ministry of Education and Research, Centre of Excellence for Sustainable Land Use (TK232).
Acknowledgments
The OzFlux and SuperSite network is supported by the National Collaborative Infrastructure Strategy (NCRIS) through the Terrestrial Ecosystem Research Network (TERN). YK is supported by the NASA DSCOVR project under grant 80NSSC19K0762. We thank the handling editor and two reviewers for constructive comments.
Conflict of interest
Author CAO was employed by company KappaZeta.
The remaining authors declare that the research was conducted in the absence of any commercial or financial relationships that could be construed as a potential conflict of interest.
The author(s) declared that they were an editorial board member of Frontiers, at the time of submission. This had no impact on the peer review process and the final decision.
Generative AI statement
The author(s) declare that no Generative AI was used in the creation of this manuscript.
Any alternative text (alt text) provided alongside figures in this article has been generated by Frontiers with the support of artificial intelligence and reasonable efforts have been made to ensure accuracy, including review by the authors wherever possible. If you identify any issues, please contact us.
Publisher’s note
All claims expressed in this article are solely those of the authors and do not necessarily represent those of their affiliated organizations, or those of the publisher, the editors and the reviewers. Any product that may be evaluated in this article, or claim that may be made by its manufacturer, is not guaranteed or endorsed by the publisher.
References
Adams, J., Lewis, P., and Disney, M. (2018). Decoupling canopy structure and leaf biochemistry: testing the utility of directional area Scattering Factor (DASF). Remote Sens. 10, 1911. doi:10.3390/rs10121911
Australian SuperSites Network (2022). Field Survey Apps and protocols website. Available online at: https://www.tern.org.au/field-survey-apps-and-protocols/(Accessed April 05, 2025).
Beringer, J., Hutley, L. B., McHugh, I., Arndt, S. K., Campbell, D., Cleugh, H. A., et al. (2016). An introduction to the Australian and New Zealand flux tower network–OzFlux. Biogeosciences 13, 5895–5916. doi:10.5194/bg-13-5895-2016
Chen, J. M., and Black, T. A. (1992). Defining leaf area index for non-flat leaves. Plant Cell and Environ. 15, 421–429. doi:10.1111/j.1365-3040.1992.tb00992.x
Chen, J., Menges, C., and Leblanc, S. (2005). Global mapping of foliage clumping index using multi-angular satellite data. Remote Sens. Environ. 97, 447–457. doi:10.1016/j.rse.2005.05.003
Ganguly, S., Samanta, A., Schull, M. A., Shabanov, N. V., Milesi, C., Nemani, R. R., et al. (2008). Generating vegetation leaf area index Earth system data record from multiple sensors. Part 2: implementation, analysis and validation. Remote Sens. Environ. 112, 4318–4332. doi:10.1016/j.rse.2008.07.013
Gerstl, S. A. W. (1999). Building a global hotspot ecology with triana data. Remote Sens. Earth Sci. Ocean. Sea Ice Applic. 3868, 184–194. doi:10.1117/12.373094
Goel, N. S., Qin, W. H., and Wang, B. Q. (1997). On the estimation of leaf size and crown geometry for tree canopies from hotspot observations. J. Geophys. Res.-Atmos. 102, 29543–29554. doi:10.1029/97JD01110
Karan, M., Liddell, M., Prober, S. M., Arndt, S., Beringer, J., Boer, M., et al. (2016). The Australian supersite network: a Continental, long-term terrestrial ecosystem observatory. Sci. Total Environ. 568, 1263–1274. doi:10.1016/j.scitotenv.2016.05.170
Knyazikhin, Y., and Myneni, R. B. (2021). DSCOVR EPIC vegetation Earth system data record, science data product guide (Version 2). NASA Langley Atmos. Sci. Data Cent. DAAC. Available online at: https://asdc.larc.nasa.gov/documents/dscovr/DSCOVR_VESDR_SDRG_02.pdf.
Knyazikhin, Y., Marshak, A., and Myneni, R. B. (2005). “Three-dimensional radiative transfer in vegetation canopies and cloud-vegetation interaction,” in Three dimensional radiative transfer in the cloudy atmosphere. Editors A. Marshak, and A. B. Davis (Berlin: Springer), 617–652.
Knyazikhin, Y., Schull, M. A., Stenberg, P., Mõttus, M., Rautiainen, M., Yang, Y., et al. (2012). Hyperspectral remote sensing of foliar nitrogen content. PNAS 110, E185–E192. doi:10.1073/pnas.1210196109
Latorre-Carmona, P., Knyazikhin, Y., Alonso, L., Moreno, J. F., Pla, F., and Yan, Y. (2014). On hyperspectral remote sensing of leaf biophysical constituents: decoupling vegetation structure and leaf optics using Chris–Proba data over crops in Barrax. IEEE Geoscience remote Sens. Lett. 11, 1579–1583. doi:10.1109/LGRS.2014.2305168
Lowe, A. J., Phinn, S., Thurgate, N., Liddell, M., Lindenmayer, D., Byrne, M., et al. (2016). “Building a new continental, hierarchically-scaled ecosystem monitoring network in Australia,” in Terrestrial ecosystem research infrastructures: challenges, new developments and perspectives. Boca Raton: CRC Press | Taylor and Francis Group.
Lyapustin, A., Wang, Y., Korkin, S., and Huang, D. (2018). MODIS Collection 6 MAIAC algorithm. Atmos. Meas. Tech. 11, 5741–5765. doi:10.5194/amt-11-5741-2018
Lyapustin, A., Wang, Y., Go, S., Choi, M., Korkin, S., Huang, D., et al. (2021). Atmospheric Correction of DSCOVR EPIC: version 2 MAIAC Algorithm. Front. Remote Sens. 2, 748362–10. doi:10.3389/frsen.2021.748362
Marshak, A., Herman, J., Adam, S., Karin, B., Carn, S., Cede, A., et al. (2018). Earth observations from DSCOVR EPIC instrument. Bull. Am. Meteorol. Soc. 99, 1829–1850. doi:10.1175/BAMS-D-17-0223.1
Marshak, A., Delgado-Bonal, A., and Knyazikhin, Y. (2021). Effect of scattering angle on earth reflectance. Front. Remote Sens. 2, 719610. doi:10.3389/frsen.2021.719610
Ni, X., Knyazikhin, Y., Sun, Y., She, X., Guo, W., Panferov, O., et al. (2021). Vegetation angular signatures of equatorial forests from DSCOVR EPIC and Terra MISR observations. Front. Remote Sens. 2, 766805. doi:10.3389/frsen.2021.766805
Nilson, T. (1971). A theoretical analysis of the frequency of gaps in plant stands. Agric. Meteorol. 8, 25–38. doi:10.1016/0002-1571(71)90092-6
Pisek, J., Ryu, Y., Sprintsin, M., He, L., Oliphant, A. J., Korhonen, L., et al. (2013). Retrieving vegetation clumping index from Multiangle Imaging SpectroRadiometer (MISR) data at 275m resolution. Remote Sens. Environ. 138, 126–133. doi:10.1016/j.rse.2013.07.014
Pisek, J., Govind, A., Arndt, S. K., Hocking, D., Wardlaw, T. J., Fang, H., et al. (2015). Intercomparison of clumping index estimates from POLDER, MODIS, and MISR satellite data over reference sites. ISPRS J. Photogrammetry Remote Sens. 101, 47–56. doi:10.1016/j.isprsjprs.2014.11.004
Pisek, J., Arndt, S. K., Erb, A., Pendall, E., Schaaf, C., Wardlaw, T. J., et al. (2021). Exploring the potential of DSCOVR EPIC data to retrieve clumping index in Australian terrestrial ecosystem research network observing sites. Front. Remote Sens. 2, 652436. doi:10.3389/frsen.2021.652436
Qin, W. H., Gerstl, S. A. W., Deering, D. W., and Goel, N. S. (2002). Characterizing leaf geometry for grass and crop canopies from hotspot observations: a simulation study. Remote Sens. Environ. 80, 100–113. doi:10.1016/S0034-4257(01)00291-7
Román, M. O., Schaaf, C. B., Woodcock, C. E., Strahler, A. H., Yang, X., Braswell, R. H., et al. (2009). The MODIS (CollectionV005) BRDF/Albedo product: assessment of spatial representativeness overforested landscapes. Remote Sens. Environ. 113, 2476–2498. doi:10.1016/j.rse.2009.07.009
Ross, J., and Marshak, A. L. (1989). The influence of leaf orientation and the specular component of leaf reflectance on the canopy bidirectional reflectance. Remote Sens. Environ. 27, 251–260. doi:10.1016/0034-4257(89)90086-2
Schull, M. A., Ganguly, S., Samanta, A., Huang, D., Shabanov, N. V., Jenkins, J. P., et al. (2007). Physical interpretation of the correlation between multi-angle spectral data and canopy height. Geophys. Res. Lett. 34 (18). doi:10.1029/2007GL031143
Stenberg, P., and Manninen, T. (2015). The effect of clumping on canopy scattering and its directional properties: a model simulation using spectral invariants. Int. J. Remote Sens. 36, 5178–5191. doi:10.1080/01431161.2015.1049383
Sternberg, P., Mõttus, M., and Rautiainen, M. (2016). Photon recollision probability in modelling the radiation regime of canopies – a review. Remote Sens. Environ. 183, 98–108. doi:10.1016/j.rse.2016.05.013
Sun, Y., Knyazikhin, Y., She, X., Ni, X., Chen, C., Ren, H., et al. (2022). Seasonal and long-term variations in leaf area of Congolese rainforest. Remote Sens. Environ. 268, 112762. doi:10.1016/j.rse.2021.112762
Vanhatalo, K. M., Rautiainen, M., and Stenberg, P. (2014). Monitoring the broadleaf fraction and canopy cover of boreal forests using spectral invariants. J. Quant. Spectrosc. Radiat. Transf. 133, 482–488. doi:10.1016/j.jqsrt.2013.09.011
Wang, Z., Schaaf, C. B., Sun, Q., Kim, J., Erb, A. M., Gao, F., et al. (2017). Monitoring land surface albedo and vegetation dynamics using high spatial and temporal resolution synthetic time series from Landsat and the MODIS BRDF/NBAR/albedo product. Int. J. Appl. Earth Obs. Geoinf. 59, 104–117. doi:10.1016/j.jag.2017.03.008
Weiss, M., Baret, F., Smith, G. J., Jonckheere, I., and Coppin, P. (2004). Review of methods for in situ leaf area index (LAI) determination: part II. Estimation of LAI, errors and sampling. Agric. For. meteorology 121, 37–53. doi:10.1016/j.agrformet.2003.08.001
Woodgate, W., Soto-Berelov, M., Suarez, L., Jones, S., Hill, M., Wilkes, P., et al. (2012). “Searching for the optimal sampling design for measuring LAI in an upland rainforest,” in Proceedings of the geospatial science research symposium GSR2.
Woodgate, W., Phinn, S., Devereux, T., and Aryal, R. R. (2025). Bushfire recovery at a long-term tall eucalypt flux site through the lens of a satellite: combining multi-scale data for structural-functional insight. Remote Sens. Environ. 317, 114530. doi:10.1016/j.rse.2024.114530
Yang, P. (2022). Exploring the interrelated effects of soil background, canopy structure and sun-observer geometry on canopy photochemical reflectance index. Remote Sens. Environ. 279, 113133. doi:10.1016/j.rse.2022.113133
Keywords: clumping index, DSCOVR EPIC, TERN, validation, directional area scattering factor
Citation: Pisek J, Odera CA, Erb A, Marshak A and Knyazikhin Y (2025) The relationship between directional area scattering factor and foliage clumping based on DSCOVR EPIC data over Australian TERN sites . Front. Remote Sens. 6:1638095. doi: 10.3389/frsen.2025.1638095
Received: 30 May 2025; Accepted: 18 August 2025;
Published: 01 September 2025.
Edited by:
Xiaoguang Xu, University of Maryland, Baltimore County, United StatesReviewed by:
Alexander Wait, Missouri State University, United StatesMatti Mõttus, VTT Technical Research Centre of Finland Ltd, Finland
Copyright © 2025 Pisek, Odera, Erb, Marshak and Knyazikhin. This is an open-access article distributed under the terms of the Creative Commons Attribution License (CC BY). The use, distribution or reproduction in other forums is permitted, provided the original author(s) and the copyright owner(s) are credited and that the original publication in this journal is cited, in accordance with accepted academic practice. No use, distribution or reproduction is permitted which does not comply with these terms.
*Correspondence: Jan Pisek, amFucGlzZWtAZ21haWwuY29t