 Marshall Sutton
- Integrated Data Systems, Marshall Sutton NASA Goddard Spaceflight Center, Greenbelt, United States
The EPIC (Earth Polychromatic Imaging Camera) onboard the DSCOVR mission takes full disc illuminated pictures of the earth in 10 spectral bands, ranging from infrared to ultraviolet. Scientists use the data from EPIC to study the surface and atmosphere of the earth, including aerosols, ozone, volcanic plumes, vegetation, and the ocean. This paper describes how raw data from the EPIC instrument is turned into level-2 science products. It describes the hardware and processes that go in to creating a data pipeline for disseminating these science products to the wider community.
1 Summary of DSCOVR and EPIC mission
The DSCOVR mission was launched in 2015 into an orbit around the Earth-Sun L1 Lagrange point. The satellite is always near the line between the Sun and the Earth. It carries a suite of instruments used to monitor space weather. It also carries two Earth-facing instruments. The National Institute for Standards and Technology advanced Radiometer NISTAR measures radiation from the Earth to detect changes in the Earth radiation budget. The Earth Polychromatic Imaging Camera captures full disc images of the Earth in ten spectral bands, including the ultraviolet, visible, and infrared ranges. The EPIC camera sends 23 pictures per day in the summer to ground stations in Alaska and Virginia. EPIC sends 13 images per day in the winter to the ground station on Wallops Island, Virginia. The images can be seen on the DSCOVR Website, http://epic.gsfc.nasa.gov. Science teams use this data to study the atmosphere, the land, and the ocean.
2 Level-2 products
EPIC Level-2 science products cover a wide range of applications for studies of the atmosphere, land, and ocean systems. Data derived from EPIC observations are called EPIC level 2 products. An example is the EPICAERUV Level 2 product that derives an Aerosol UV index, the Aerosol Optical Depth, and Aerosol Single Scattering Albedo (Anh et al., 2021). These measurements are useful in studying smoke from wildfires and dust plumes from the Sahara Desert. The Total Ozone product produces total column ozone needed to estimate the amount of UV radiation that reaches the surface when combined with the Lambertian Equivalent Reflectivity that provides a measure of cloud reflection and transmission of radiation (Huang and Yang, 2022). The SO2 product is used track volcanic plumes. The Cloud product tracks various cloud types, altitude, and geographic coverage. An interesting side product from EPIC is the detection of glints from horizontally oriented ice crystals in high clouds (Marshak et al., 2017). Other Level 2 products are described in Table 1.
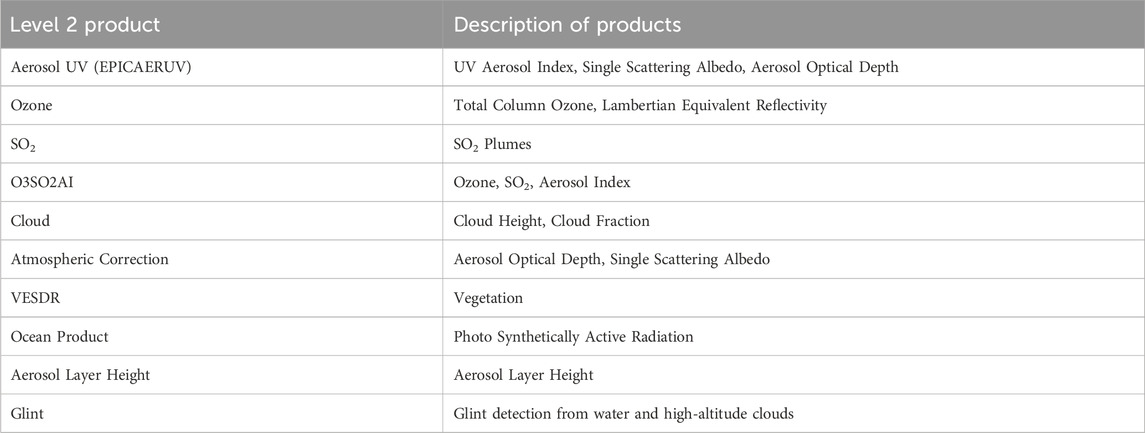
Table 1. Level-2 products.
3 EPIC and NISTAR ground system
The DSCOVR Satellite sends data from the EPIC and NISTAR instruments via S-band to ground stations in Fairbanks Alaska and Wallops Island Virginia. The level 0 data is transmitted using a secure connection from the ground stations to the SPOCC (Science and Planetary Operations and Control Center) at Goddard Space Flight Center, where it is archived. From there, the data is moved to the NCCS (National Center for Climate Simulation), a high-performance computing center at Goddard. The data is processed on the NCCS into Level-a, -1b and Level-2 data products. Finally, the data is moved for archiving to the ASDC (Atmospheric Sciences Data Center) where it is ingested and made available to the public in a user-friendly HDF 5 file (see Figure 1).
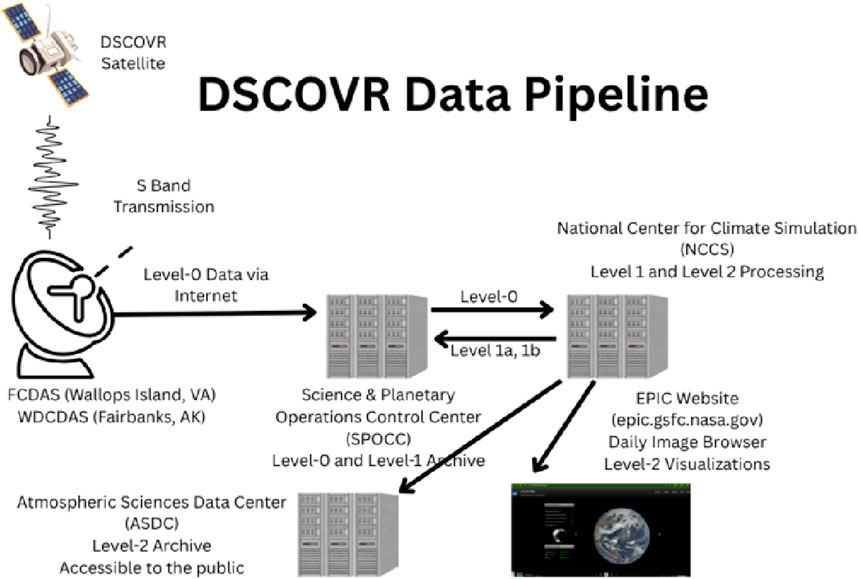
Figure 1. Data production.
Processing the level 0 data into level 1 data has several steps. Geolocation data is determined for each pixel, including latitude, longitude, solar-zenith, and view-zenith angles. The processing accounts for errors in the detector array sensitivity (flat-field correction), etaloning, and makes corrections due to stray light.
Each EPIC level 1 file contains images of the Earth in each of EPIC’s 10 wavelengths. For EPIC 1b files the data is overlayed so that each image of the different wavelengths lines up (Geolocation). The image orientation is selected so that the North Pole appears at the top of each image.
4 Description of NCCS, ASDC
EPIC data products and science products are stored on the Atmospheric Sciences Data Center (ASDC) located at the NASA Langley Research Center in Hampton, VA. The public can download EPIC Level-1 and Level-2 data from the ASDC.
The National Center for Climate Simulation is a high-performance computing center located at NASA’s Goddard Space Flight Center in Greenbelt Maryland. EPIC processing is done on the NCCS’s Discover supercomputing cluster. Discover contains 213,288 compute cores and is capable of computing 8.28 petaflops (Floating operations per second).
5 Creating level 2 science products
Level 2 processing pipelines consist of Python scripts stored on the NCCS. A daily script pulls EPIC 1b files from the SPOCC to the NCCS. The pipeline processing script detects new EPIC 1b files and starts processing those files. The script determines if any ancillary data sets are needed and downloads those files. Next, the processing script kicks off a SLURM job that completes the processing for each file under the scheduling protocol SLURM for the NCCS.
When the SLURM job is finished, a cleanup script is launched to check if the output files have been created and that they are of the correct size. It also writes the metadata files, which are used by the ASDC when ingesting new data granules. The cleanup script also determines if each file has been successfully processed and records the result in a database. The script checks that the output files are the appropriate size. It also checks logs files to determine if a granule has completed processing.
After the cleanup script finishes, the finished Level 2 science products are uploaded to the ASDC along with their metadata files.
The new science products become available a few hours after they are uploaded. Scientists and other users can download those files using an internet connection. The best way to search for EPIC level 2 products is to use the Earthdata Search website. Users can search for products using a time range, geographic area or subject matter. The website is https://search.earthdata.nasa.gov/search.
6 Pipeline challenges
Level 2 granules are processed and sent to the ASDC via SFTP protocol over the internet in batches of 100 granules. Sometime a batch of granules will not reach the ASDC, or the files will not be ingested. The ASDC does not send notifications if files are not ingested or lost in transmission.
To determine if granules are missing, lists of available files are produced from the ASDC Earthdata Search Website (https://search.earthdata.nasa.gov/search). That list is compared to a list of processed data stored on the NCCS. Files that were successfully processed on the NCCS, but do not appear on the ASDC are processed again. Future work will involve automating the process of looking for missing files.
7 Requesting resources
To efficiently use NCCS resources, a Slurm script is used to request compute nodes and wall time. The most common type of node is the AMD Milan EPYC processor core, which contains 2 64-core processors per node and has 512 GB of memory per node. Each node can run up to 100 tasks simultaneously, provided the 512 GB memory limit is not exceeded.
We determine the maximum number of tasks by slowly increasing the tasks per node until the memory limit is exceeded. Several tests are run with different epic inputs. Once a limit is determined, we reduce that number by 10% to ensure a safe margin. Memory used in a single Slurm session can be found in the output file produced for each session.
For the EPICAERUV product, running more than 12 tasks at a time will cause the memory limit to be exceeded, and the entire job will stop. For daily processing we run 10 tasks at a time to ensure there are no unexpected stoppages.
The pipeline must request a precise wall clock time. If too much time is requested, the wait time, or time between when the Slurm job is submitted and when it starts to execute, will increase. If too little time is requested, the job will time out and quit before processing is finished. To calculate the time needed we use this formula:
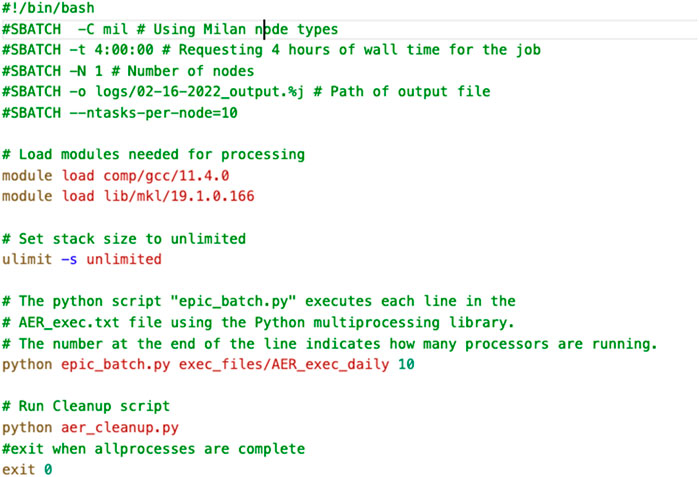
Figure 2. Sample Slurm script 1.
8 Ancillary data
Many level 2 products use ancillary data sets. For example, the Aerosol UV product uses the Aqua/AIRS L3 Daily Standard Physical Retrieval data set available on GESDISC, a NASA data repository. Before it can be processed, the data must be downloaded and available on the NCCS.
Ancillary files are downloaded to the NCCS daily using curl or wget. A python script determines the correct date range and then adjusts the curl commands that download the latest files.
If the ancillary files are not available for a certain date range, we must prevent the corresponding epic files from entering processing, since we know they will fail. The processing script will process those files the next day.
Recent improvements to some pipelines involve using Earthaccess to download ancillary files. Earthaccess is a Python library for searching, downloading, and streaming NASA Earth science data. Earthaccess allows downloading by date range, and will return the names of all available files, making it easier to determine if processing can go forward. Earthaccess will be integrated into all EPIC pipelines in the future.
Ancillary data must be downloaded outside of a batch computing environment. Scripts that download data must be done as a cron job and not part of a slurm script. This can cause issues as we do not have precise control over when a slurm script where the main data processing happens, is executed. To prevent conflicts, download scripts are scheduled several hours before the main processing scripts.
9 Daily images
Daily images are produced using Level 2 datasets to help users visualize the data. Some products can be found on the website, including a cloud-cleared Enhanced EPIC image, UVAI, and cloud maps. We also produce Cloud Height, Ocean Surface, and MAIAC (Multi-Angle Implementation of Atmospheric Correction) daily images. Images are produced using Python or IDL code on the NCCS and then sent to the EPIC website and the ASDC. Users can view images by date on the EPIC website, http://epic.gsfc.nasa.gov. Figure 3 shows examples of daily images.
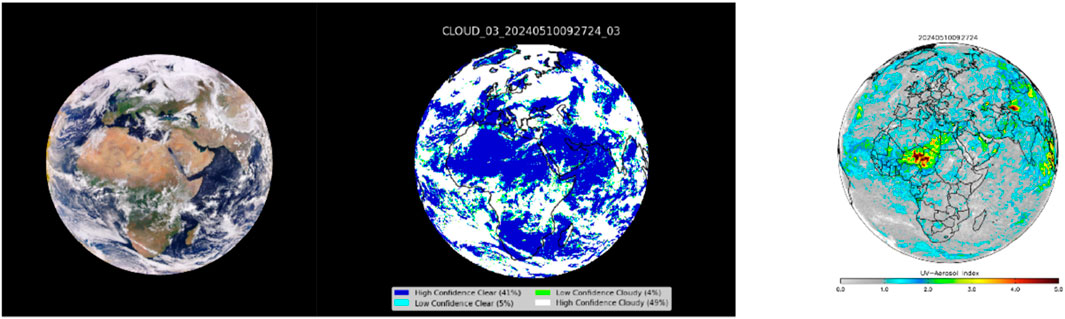
Figure 3. Daily images produced from EPIC Level 2 data from left to right: EPIC Enhanced Image, EPIC Cloud Fraction, EPIC UVAI.
10 Conclusion
Combining data processing for various products builds on several efficiencies that are important to the user, namely that the EPIC level-1 dataset can be stored in one place, the NCCS. The size of the dataset is approximately 16 TB. The single pipeline avoids transfers of the data, which can take a long time and use compute resources. Several Level 2 products share components such as lookup tables and make files used to build Fortran executables. The biggest advantage to having a single processing center is that it allows the science teams to focus on product and algorithm development, and not on data processing.
Data availability statement
The datasets presented in this study can be found in online repositories. The names of the repository/repositories and accession number(s) can be found below: Atmoshperic Sciences Data Center, https://search.earthdata.nasa.gov/search.
Author contributions
MS: Writing – review & editing, Writing – original draft.
Funding
The author(s) declare that financial support was received for the research and/or publication of this article. The author gratefully acknowledge funding from NASA’s Earth Science Division DSCOVR Project.
Conflict of interest
The author declares that the research was conducted in the absence of any commercial or financial relationships that could be construed as a potential conflict of interest.
Generative AI statement
The author(s) declare that no Generative AI was used in the creation of this manuscript.
Any alternative text (alt text) provided alongside figures in this article has been generated by Frontiers with the support of artificial intelligence and reasonable efforts have been made to ensure accuracy, including review by the authors wherever possible. If you identify any issues, please contact us.
Publisher’s note
All claims expressed in this article are solely those of the authors and do not necessarily represent those of their affiliated organizations, or those of the publisher, the editors and the reviewers. Any product that may be evaluated in this article, or claim that may be made by its manufacturer, is not guaranteed or endorsed by the publisher.
References
Ahn, C., Torres, O., Jethva, H., Tiruchirapalli, R., and Huang, L.-K. (2021). Evaluation of aerosol properties observed by DSCOVR/EPIC instrument from the Earth-Sun Lagrange 1 Orbit. J. Geophys. Res. Atmos. 126, e2020JD033651. doi:10.1029/2020JD033651
Carn, S. A., Krotkov, N. A., Fisher, B. L., and Li, C. (2022). Out of the blue: volcanic SO2 emissions during the 2021–2022 eruptions of Hunga Tonga—Hunga Ha’apai (Tonga). Front. Earth Sci. 10, 976962. doi:10.3389/feart.2022.976962
Frouin, R., Tan, J., Compiegne, M., Ramon, D., Sutton, M., Murakami, H., et al. (2022). The NASA EPIC/DSCOVR ocean PAR product. Front. Remote Sens 3, 833340. doi:10.3389/frsen.2022.833340
Herman, J. R., Huang, L., McPeters, R. D., Ziemke, J., Cede, A., and Blank, K. (2018). Synoptic ozone, cloud reflectivity, and erythemal irradiance from sunrise to sunset for the whole earth as viewed by the DSCOVR spacecraft from the earth–sun Lagrange 1 orbit. Atmos. Meas. Tech. 11, 177–194. doi:10.5194/amt-11-177-2018
Huang, X., and Yang, K. (2022). Algorithm theoretical basis for ozone and sulfur dioxide retrievals from DSCOVR EPIC. Atmos. Meas. Tech. 15, 5877–5915. doi:10.5194/amt-15-5877-2022
Lyapustin, A., Wang, Y., Go, S., Choi, M., Korkin, S., Huang, D., et al. (2021). Atmospheric correction of DSCOVR EPIC: version 2 MAIAC algorithm. Front. Remote Sens 2, 748362. doi:10.3389/frsen.2021.748362
Marshak, A., Varnai, T., and Kostinski, A. (2017). Terrestrial glint seen from deep space: oriented ice crystals detected from the Lagrangian point. Geoph. Res. Lett. 44, 5197–5202. doi:10.1002/2017GL073248
Xu, X., Wang, J., Wang, Y., Zeng, J., Torres, O., Reid, J., et al. (2019). Detecting layer height of smoke aerosols over vegetated land and water surfaces via oxygen absorption bands: hourly results from EPIC/DSCOVR in deep space. Atmos. Meas. Tech. 12, 3269–3288. doi:10.5194/amt-12-3269-2019
Yang, Y., Marshak, A., Mao, J., Lyapustin, A., and Herman, J. (2013). A method of retrieving cloud top height and cloud geometrical thickness with oxygen A and B bands for the deep space climate observatory (DSCOVR) mission: radiative transfer simulations. J. Quant. Spectrosc. Radiat. Trans. 122, 141–149. doi:10.1016/j.jqsrt.2012.09.017
Keywords: UV aerosol index, aerosol optical depth, total column ozone, SO2 plumes, ozone, processing pipeline, high-performance computing
Citation: Sutton M (2025) Turning EPIC data into science products. Front. Remote Sens. 6:1638530. doi: 10.3389/frsen.2025.1638530
Received: 30 May 2025; Accepted: 10 September 2025;
Published: 23 September 2025.
Edited by:
Lynn Donelson Wright, College of William & Mary, United StatesReviewed by:
Kai Yang, University of Maryland, College Park, United StatesNick Gorkavyi, Science Systems and Applications, Inc., United States
Copyright © 2025 Sutton. This is an open-access article distributed under the terms of the Creative Commons Attribution License (CC BY). The use, distribution or reproduction in other forums is permitted, provided the original author(s) and the copyright owner(s) are credited and that the original publication in this journal is cited, in accordance with accepted academic practice. No use, distribution or reproduction is permitted which does not comply with these terms.
*Correspondence: Marshall Sutton, bWFyc2hhbGwuaC5zdXR0b25AbmFzYS5nb3Y=