 Aashutosh Aryal
 Venkataraman Lakshmi
- Department of Civil and Environmental Engineering, University of Virginia, Charlottesville, VA, United States
The northeastern US has been experiencing catastrophic flooding in recent years. Flooding in the region is occurring more frequently and with higher intensity, causing substantial economic losses. The flooding may be caused by changes in climatic and hydrological drivers such as extreme precipitation, rapid snowmelt, and saturated soil moisture conditions, along with impacts from human-driven interventions like changes in land cover and urban imperviousness. This study analyzes the abovementioned variables to indicate flood risk and understand whether they contribute to flooding in the Northeastern US region. This study utilized various remote sensing satellite products for analyzing variables to fulfil the study’s objectives, wherever possible, such as Terra Moderate Resolution Imaging Spectroradiometer (MODIS) maximum snow cover extent, Soil Moisture Active Passive (SMAP) soil moisture, Integrated Multi-satellitE Retrievals for the Global Precipitation Measurement (GPM) mission (IMERG) precipitation, North American Land Change Monitoring System (NALCMS) land cover, and National Land Cover Database (NLCD) urban imperviousness. The region experienced wetter antecedent soil moisture conditions (>0.5 m3/m3) during spring due to rapid snowmelt (seasonal decline of ∼97%) in all the periods considered in the study. Moreover, the summer precipitation fed excess water (∼50–60 mm more rainfall than the decadal average) into wetter ground conditions, overwhelming the region’s overall hydrology and water balance and causing significant flooding. In addition, ∼1,838 sq. km. of croplands and ∼1,363 sq. km. of forests transitioned into built-up areas in a decade, increasing impervious surface and further exacerbating flooding risk in the region.
1 Introduction
Floods, considered one of the hydroclimatic extremes, have been causing unprecedented damage to the Earth in recent decades (Hirabayashi et al., 2013; Trigg et al., 2016; Aryal et al., 2023a; 2025). As the climate has warmed, these occurrences have become more frequent and intense, causing severe socio-economic damage on a global scale (Hirabayashi et al., 2013; Lehmann et al., 2015; Trigg et al., 2016; Alfieri et al., 2017; Papalexiou and Montanari, 2019; Clarke et al., 2022; Calvin et al., 2023; Do et al., 2024; Goffin et al., 2024). The Northeastern United States (US) has been experiencing catastrophic flooding in recent years (Hodgkins et al., 2003; Hayhoe et al., 2008; Villarini et al., 2009; Vogel et al., 2011; Hirsch and Ryberg, 2012; Armstrong et al., 2014; Mallakpour and Villarini, 2015; Suro et al., 2015; Villarini and Slater, 2017; Mayo and Lin, 2022; Pal et al., 2023). Flash flooding in the region occurs more frequently and with higher intensity, causing substantial economic losses. The flooding has impacted various communities and critical infrastructures in the region (Hirsch and Ryberg, 2012; Armstrong et al., 2014; Suro et al., 2015; Mayo and Lin, 2022). The flooding may be due to changes in dominant climatic and hydrological drivers such as intense precipitation, higher temperature, rapid snowmelt, saturated soil moisture conditions, and increased surface runoff (DeWalle et al., 2000; Kirshen et al., 2008; Hirsch and Ryberg, 2012; Armstrong et al., 2014; Mallakpour and Villarini, 2015; Villarini, 2016; Villarini and Slater, 2017; Mayo and Lin, 2022; Pal et al., 2023). Because of its proximity to the ocean, the region and its coastal cities are susceptible to coastal and river flooding (Kirshen et al., 2008; Mayo and Lin, 2022). The major cities with millions of people residing in them greatly suffer from the impacts of intense flooding. The damage caused by the frequent flooding is unprecedented, with significant socio-economic implications for the US economy (Hayhoe et al., 2008; Kirshen et al., 2008; Huntington et al., 2009; Armstrong et al., 2014; Suro et al., 2015; Agel et al., 2017; Mayo and Lin, 2022). Melillo et al. (2014), Demaria et al. (2016), Siddique and Palmer (2021), and Pal et al. (2023) have highlighted that the Northeast US region is projected to experience increased temperatures, heavy and extreme precipitation, droughts, floods, and rising sea levels during the 21st Century due to climate change and global warming impacts. Moreover, the region is continuously seeing a rise in population growth and urbanization, with many critical infrastructures built on river floodplains of some of the large rivers of the region, causing further challenges in combating future flood risks (Parr et al., 2015; Siddique and Palmer, 2021).
In recent years, the northeastern US region has experienced flooding, causing billions of US dollars in damage. For instance, in September 2021, the Northeastern US received extreme precipitation or tropical cyclones from Hurricane Ida, causing devastating river and flash flooding (Beven et al., 2022). The widespread flooding impacted roads, bridges, and public transportation and inundated several urban areas. Moreover, many rivers in the region overtopped riverbanks, inundating agricultural lands and damaging crops. At least 55 people lost their lives in the states of Connecticut, Maryland, New Jersey, New York, and Pennsylvania (Beven et al., 2022). The flooding from Hurricane Ida caused about $23 billion in economic losses and damages in the Northeastern US (Beven et al., 2022). Ida was the third storm that hit the region within several weeks of being impacted by extreme precipitation from tropical cyclones such as Tropical Storm Fred and Hurricane Henri in August (Ida’s flooding rains shift to Pennsylvania, New England as tornadoes threaten mid-Atlantic » Yale Climate Connections, n.d.). These extreme systems caused heavy rainfall in the region, leading to highly saturated soil conditions and ultimately causing catastrophic flooding. According to Yale Climate Connections (2021), New York City received about 230 mm of record rainfall in the second half of August, considered the city’s second-largest rainfall on record.
Similarly, in the middle of July 2023, heavy rainfall occurred in the Northeastern region, causing significant flooding in several states, including Connecticut, Massachusetts, New York, and Vermont (2023 Northeast US Floods - Center for Disaster Philanthropy, 2024; Intense Storms in the Northeast Cause Catastrophic Flooding|NESDIS, 2024). For instance, Vermont State received about nine inches of rainfall within a few days in mid-July, about 2 months’ worth of total rainfall the state receives in normal conditions (2023 Northeast US Floods - Center for Disaster Philanthropy, 2024; Intense Storms in the Northeast Cause Catastrophic Flooding|NESDIS, 2024). The flooding caused significant damage to critical infrastructures such as roads, bridges, dams, and buildings in Vermont (2023 Northeast US Floods - Center for Disaster Philanthropy, 2024; Intense Storms in the Northeast Cause Catastrophic Flooding|NESDIS, 2024). The downtown area of the capital city of Vermont, Montpelier, was inundated by the river flooding (2023 Northeast US Floods - Center for Disaster Philanthropy, 2024). Similarly, Hudson Valley received about eight inches of rain in 1 day, causing significant disruptions in the transportation sector. The flooding caused by this highly intense rainfall event was considered a “1,000-year return period event” (2023 Northeast US Floods - Center for Disaster Philanthropy, 2024). Furthermore, Bucks County in Pennsylvania state received about seven inches of rain in 1 hour, causing flash flooding that took the lives of seven people, including children (2023 Northeast US Floods - Center for Disaster Philanthropy, 2024; Intense Storms in the Northeast Cause Catastrophic Flooding|NESDIS, 2024). Therefore, most areas or states in the Northeastern US region are more susceptible to river and flash flooding and are more prone to damage from flooding that occurs frequently and in higher magnitudes.
Very few studies have investigated climate and hydrological changes in the Northeastern US region, and even fewer researchers have looked at the various hydrological variables and anthropogenic agents that cause or drive flooding. Pal et al. (2023) applied a hydrological modeling approach to assess projected changes in precipitation, streamflow, and inland flooding in the mid-21st century over the Northeastern US due to climate change impacts. Pal et al. (2023) projected that the region will experience extreme flow conditions and higher water depth during future flooding by 5%–20% and >100%, respectively, with the extent of flooding projected to increase by about 20%. Similarly, Huntington et al. (2009) also looked at the future climate and hydrological changes and possible trends in precipitation, temperature, evapotranspiration, streamflow, productivity, and their implications for forest and aquatic ecosystems. (Anderson et al., 2010). focused on investigating the summer hydroclimatic conditions of the Northeastern US in the twenty-first Century due to the influence of anthropogenic changes. They also examined precipitation, soil moisture, evaporation, and specific and relative humidity projection trends over the summer using regional climate models (RCMs) by forcing various greenhouse gas emissions scenarios. Furthermore, Hayhoe et al. (2007), (2008) also delved into assessing the regional climate change projections and investigating past and future changes in climate and hydrological indicators in the Northeastern US, having similar conclusions as (Huntington et al., 2009; Anderson et al., 2010; Pal et al., 2023). Moreover, Jessup and Colucci (2012) organized flash-flood-producing precipitation events in the Northeastern US. They examined about 187 warm-season flash flooding events to understand better the various precipitation systems that caused flooding.
Few studies focused on analyzing trends and assessing flood impacts on small areas or watersheds within the Northeastern US region. Burns et al. (2007) studied climate trends and how these trends affect water resource availability in the Catskill Mountain range in New York. Similarly, Hodgkins et al. (2003) studied the changes in the annual timing of river flows in New England, US, over the 20th Century. They assessed the changes in peak timing for high river flow conditions in the New England region using long-term data to determine whether climate-related changes impact the region. Moreover, Eisenbies et al. (2007) investigated the effects on peak discharges and flood yields from various forest operations in the Appalachian region using a modeling approach. They also simulated peak discharge using different scenarios analysis by considering changes in land use in the Appalachian region. (Jessup and DeGaetano, 2008). compared the properties of flash flooding and non-flooding events driven by precipitation using statistical approaches in some New York and Pennsylvania areas. They found that antecedent soil moisture and wind direction significantly differ when comparing flash-flooded and non-flooded areas.
Most studies or research papers have investigated future climate trends and hydrological changes primarily due to climate change impacts using different modeling approaches. However, these studies often focus on smaller watersheds or localized areas within the region, while very few have examined region-wide antecedent climatic and hydrological conditions preceding flood events. Moreover, not enough studies have looked at the influence of anthropogenic activities, such as land cover changes and the increase in urban imperviousness, to drive flooding in the region, parallel to climatic and hydrological variables. Furthermore, very few studies have utilized remote sensing datasets for the abovementioned variables to determine whether they potentially drive significant flooding in the Northeastern US region. It was realized from the literature review on the given research topic that this study will help shed light on how remotely sensed satellite data can be used and applied in the region to study flooding and how they can assist in determining the leading causes behind the flooding that has been occurring in the Northeastern region frequently in recent years. Thorough knowledge of these underlying mechanisms is crucial for effective risk management and adaptation.
Therefore, this study analyzed dominant climatic and hydrological variables, such as maximum snow extent, surface soil moisture, and precipitation, and changes in anthropogenic activities, such as changes in land cover and changes in urban imperviousness, to indicate whether they could be potential indicators for possible flood risk and whether they contribute to flooding in the Northeastern US region. This study utilized various remote sensing satellite products for analyzing variables to fulfil the study’s objectives, wherever possible, such as Integrated Multi-satellitE Retrievals for the Global Precipitation Measurement (GPM) mission (IMERG), Soil Moisture Active Passive (SMAP), Moderate Resolution Imaging Spectroradiometer (MODIS), North American Land Change Monitoring System (NALCMS), and National Land Cover Database (NLCD). This study will mainly focus its analysis and deductions on the summer flooding in 2021 and 2023. As mentioned earlier, utilizing and analyzing different satellite datasets to gain insight into potential drivers for frequent and intense flood occurrences in the region will be a novel undertaking of this research study. This study focuses on the spatial and temporal variability of potential climatic, hydrological, and anthropogenic drivers that could indicate flood risk. This study will highlight dominant drivers that could cause flash floods in the northeastern region and help make better-informed decisions for flood risk management by concerned stakeholders.
In summary, the novelty of this study lies in leveraging publicly available Earth observation satellite datasets to assess past and present climatic and hydrological conditions, while also examining anthropogenic impacts through a comprehensive change detection analysis of land cover classes and degrees of urban imperviousness that contribute to catastrophic flooding in the Northeastern United States. Notably, there is a distinct lack of studies, as highlighted previously, employing finer resolution remotely sensed products at the regional scale to investigate flooding dynamics within the region. As previously stated, most of the researchers are focused on conducting research on a small scale, often overlooking how variability in these different variables impacts the regional hydrology and their subsequent effects on increased exposure to flood hazards in the region.
The following were the research questions considered for this study:
a. How do climatic and hydrological drivers, combined with anthropogenic changes, observed through satellite Earth observation datasets, influence the occurrence and severity of catastrophic flooding in the Northeastern United States?
b. What are the spatial and temporal variability in precipitation, soil moisture, and snow cover extent that precede major flooding events in the Northeastern United States?
c. How do changes in land cover and urban imperviousness contribute to the magnitude and spatial distribution of flooding in the Northeastern United States?
2 Methods
2.1 Study area
Northeastern US is one of the most developed and populated areas in the world, located on the Atlantic coast of North America. Canada surrounds it in the north, the Southern US in the south, the Midwestern US in the west, and the Atlantic Ocean in the east. The region considered in this study includes eleven states, namely, Connecticut, Maine, Massachusetts, New Hampshire, Rhode Island, Vermont, New Jersey, New York, Pennsylvania, Delaware, and Maryland. Washington, D.C., is also included in the study area, as shown in Figure 1. Some of the largest metropolitan cities of the USA are located in this region, such as Boston, New York City, Philadelphia, and Washington, D.C. About two-thirds of the region’s population resides in these big metropolitan cities alone, making this region a central economic hub. This region is one of the most developed areas in the USA, with a higher Human Development Index (HDI) and Gross Domestic Product (GDP). This region also has a high population density, thus making it equally vulnerable and prone to major natural disasters such as flooding.
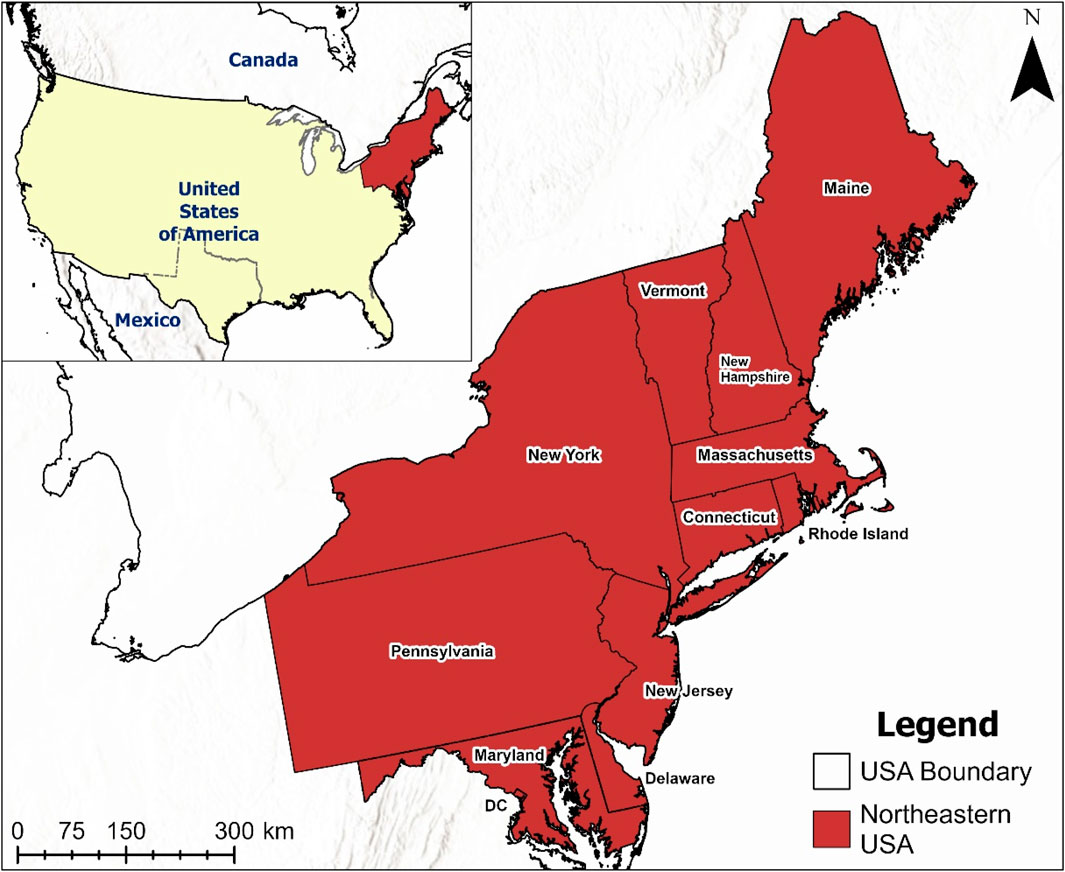
Figure 1. Study Area showing the Northeastern US region comprising eleven states and Washington, D.C., as highlighted in red. The figure also shows the location of the study area in North America.
The Northeastern US region has a varied elevation that ranges from 0 m above mean sea level in the coastal area to about 1914 m above mean sea level in the Appalachian Mountain region that extends from north to south, as observed in Figure 2a. Due to the elevation differences, the region experiences colder temperatures towards the north and when going inland in the west from the coastal areas (Horton et al., 2012; Pal et al., 2023). Similarly, the precipitation pattern follows the temperature trend, decreasing trends towards northern and inland areas away from the coast (Horton et al., 2012). Coastal areas primarily receive higher annual mean precipitation ranging from 115 to 130 cm; however, there are some inland areas where more than 150 cm of rainfall can occur due to the local orographic climate system (Horton et al., 2012; Pal et al., 2023). Generally, the Northeastern US region experiences warmer and wetter summers with humidity present, and it gets cold and snowy during winter. The Northeastern US region is mainly covered with forests, croplands, and urban built-up areas, as depicted in Figure 2b. Urbanized areas and croplands mainly cover the coastal areas and river valleys, whereas the Appalachian Mountain areas are predominantly covered by forests and shrublands, as observed in Figure 2b.
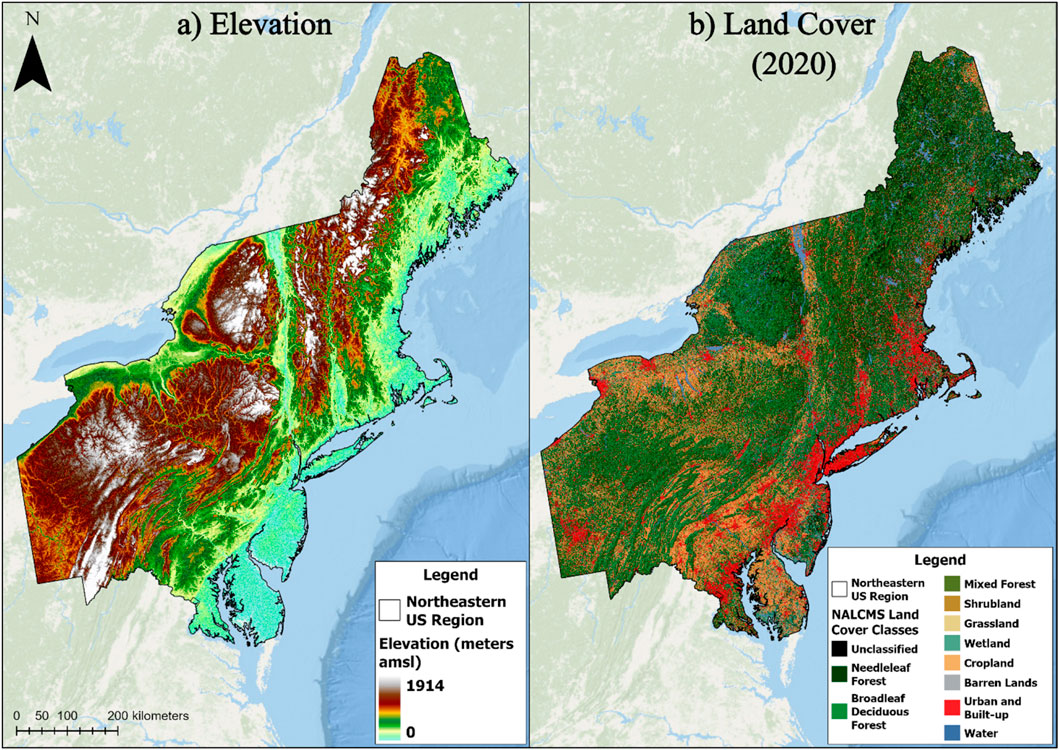
Figure 2. (a) Digital Elevation map (DEM) showcasing elevation ranging from mean sea level (0 m) to 1,914 m, and (b) 2020 Land cover map of the Northeastern US region clearly highlighting that different types of forests, croplands, and urban and built-up areas predominantly cover the study area.
2.2 Data
Five different remote sensing products and their related datasets were used to assess the potential drivers of flooding in the Northeastern US, such as Terra MODIS Maximum Snow Cover Extent, SMAP Surface Soil Moisture, GPM IMERG Final Run Precipitation, NALCMS Land Cover, and NLCD Imperviousness (see Table 1). Different time frames were considered to analyze different variables, as listed in Table 1; however, the focus of this study was to generate results from 2020 to 2023, as this period encapsulates some of the recent flooding events that have occurred in the study area.
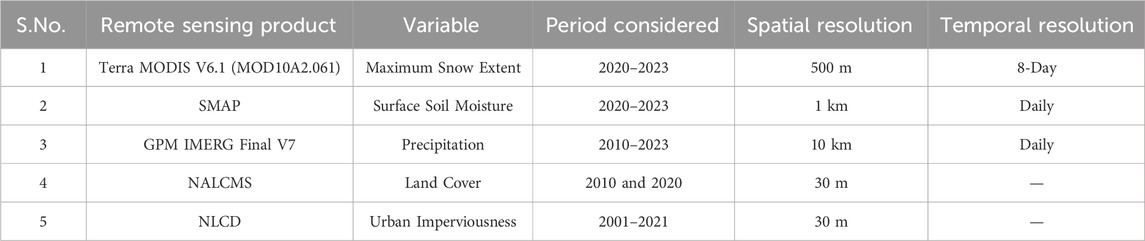
Table 1. Description of various remote sensing products and datasets used in this study.
The remote sensing products and relevant datasets used in this study have been validated against in situ measurements to ensure their accuracy and reliability. GPM IMERG precipitation data were cross-calibrated and validated with local rain gauge records and other satellite products to ensure maximum temporal and spatial accuracy (Huffman et al., 2015; Aryal et al., 2023b; Tran et al., 2023). The IMERG data showed strong correlation coefficients ranging from 0.85 to 0.95 when compared against in-situ measurements, highlighting confidence in the satellite dataset (Huffman et al., 2015). SMAP surface soil moisture data were validated using in-situ measurements from the International Soil Moisture Network (ISMN) (Fang et al., 2022). Furthermore, MODIS snow cover data were validated against ground truth measurements and historical satellite imagery using Landsat (Hall et al., 2019). Land cover and urban imperviousness data were also validated using high-resolution satellite imagery, achieving an overall classification accuracy above 90% (National Land Cover Database NLCD, 2019).
2.3 Terra MODIS maximum snow extent
Terra MODIS satellite product estimates the maximum extent of snow cover in 8-day intervals (Hall and Riggs, 2021). The maximum snow cover extent data is generated based on the cloud-free days over the 8 days, where snow cover in any given location is observed (Hall et al., 2019; Riggs et al., 2019). If the snow is detected in any particular pixel during those 8 days, that cell will be detected as a snow-covered pixel (Hall et al., 2019; Riggs et al., 2019). The cloud cover flag will be reported if any pixel has consistent obstruction from the clouds for all 8 days (Riggs et al., 2019). Usually, the snow cover is detected using the Normalized Difference Snow Index (NDSI). NDSI is determined using different spectral reflectance bands from the Terra MODIS satellite. Snow-covered areas typically have higher reflectance in visible bands and lower reflectance in the shortwave infrared bands; this property and the difference in the values from these two bands are used to calculate NDSI (Hall et al., 2019; Riggs et al., 2019) In this study, 8-day maximum snow extent data was aggregated into monthly mean to analyze monthly snow cover extent over the study area. This dataset was analyzed for the period from January 2020 to November 2023.
2.4 SMAP surface soil moisture
The SMAP surface soil moisture product is a 1-km downscaled product derived from the coarser 9-km resolution soil moisture estimates (Lakshmi and Fang, 2023). It provides daily surface soil moisture estimates on a global scale, sensed using the SMAP L-band radiometer (Lakshmi and Fang, 2023). MODIS Land Surface Temperature (LST) and the coarser 9-km product in the downscaling algorithm are considered to obtain daily finer-resolution soil moisture estimates. (Fang et al., 2022). The algorithm uses thermal inertia theory to create an inverse relationship between the difference in LST estimates from morning and afternoon overpasses and the corresponding SMAP soil moisture estimates sensed at similar periods (Fang et al., 2022). These downscaled data are validated against a denser network of in-situ soil moisture measurements (Fang et al., 2022). The daily soil moisture estimates are determined for the morning (6 a.m.) and evening (6 p.m.) periods as the SMAP L-band radiometer ascends and descends along the orbit of the planet, hence having two bands of soil moisture estimates each day (Fang et al., 2022). An average between these two bands (morning and evening estimates) is performed to get daily average soil moisture estimates. Then, this study aggregated daily soil moisture estimates from January 2020 to September 2023 into a monthly means for further analysis.
2.5 GPM IMERG final precipitation
GPM IMERG Final Run version 7 is the latest upgraded satellite-derived gridded product that globally provides half-hourly, daily, and monthly precipitation data (Huffman et al., 2023b). The gridded precipitation data is generated at 10-km spatial resolution. GPM IMERG precipitation data is compiled and processed from the constellation of satellite products such as Tropical Rainfall Measuring Mission (TRMM) and GPM records, and TRMM-based Multi-satellite Precipitation Analysis (TMPA) (Huffman et al., 2020; 2023a). Few changes were made to the algorithm that generates the latest version of precipitation data (Huffman et al., 2020). The final run version of precipitation estimates uses various inter-calibration and interpolation methods in their algorithm from satellite microwave precipitation estimates, microwave-calibrated infrared (IR) satellites, and precipitation gauge measurements to improve the accuracy of the estimates (Hou et al., 2014; Huffman et al., 2020; 2023a; Aryal et al., 2023b; Tran et al., 2023). This study aggregated daily precipitation data from June 2000 to November 2023 into monthly data for further analysis.
2.6 NALCMS land cover
NALCMS land cover product is generated by the Commission for Environmental Cooperation (CEC) using satellite imageries from Landsat 7 to 8 satellites (Land Cover, 2010 (Landsat, 30m), n.d.; North American Land Cover, 2020 (Landsat, 30m), n.d.). This product was launched in collaboration with multiple agencies from Canada, the USA, and Mexico. The land cover products are thus of 30-m spatial resolution, the same as the resolution of Landsat satellites. This study used land cover data from 2010 to 2020 for the change detection analysis. The NALCMS land cover data contains nineteen classes based on the standard Land Cover Classification System (LCCS) developed by the United Nations Food and Agriculture Organization (FAO). However, for this study, some of the nineteen classes were merged to get the final eleven land cover classes for further analysis, as depicted in Figure 2b. The land cover classes include natural and artificial features such as forests, shrublands, grasslands, wetlands, water bodies, barren lands, croplands, and urban/built-up areas.
2.7 NLCD imperviousness
NLCD products are developed by the US Geological Survey (USGS) in partnership with various other federal agencies of the USA, and they have been releasing the products for over the past two decades (National Land Cover Database NLCD, 2019; Yang et al., 2018; Dewitz, 2021). They use Landsat imagery and other ancillary datasets to produce these products. Urban Imperviousness is one such NLCD product that the USGS produced at 30-m spatial resolution from 2001 to 2021. The data estimates the percentage of urban impervious surfaces in the US in a particular year. This study used urban imperviousness data from each decade since 2000, such as 2001, 2011, and 2021, to conduct change detection analysis. The imperviousness data covers most infrastructures like roads, wind towers, building locations, and energy-producing sites that would have a significant presence of impervious surfaces.
2.8 Methodology
A conceptual framework diagram provided in Figure 3 highlights different Earth observation data inputs along with their source of satellite products, and processing data using different analytical methods such as anomalies based on decadal average, spatial and temporal (time series) variability analysis, and change detection analysis to obtain desired outcome indicators to investigate the possible drivers causing flooding in the study area. The primary purpose of this study was to examine climatic and hydrological variables and variables associated with anthropogenic activities to analyze antecedent conditions, temporal and spatial variability, and changes that could help indicate flood risk in the Northeastern US region. This study mostly used data from January 2020 to November 2023 to analyze the summer floods of 2021 and 2023 as case studies. The monthly and seasonal changes were examined for snow cover extent, soil moisture, and precipitation data. The method applied to produce monthly spatial plots was by taking a monthly mean average from either 8-day or daily data for each pixel covering the entire study area over the period considered for this study. Similarly, as precipitation significantly drives floods in the region, this study also calculated the monthly precipitation anomalies to investigate heavy and extreme precipitation that could cause significant flooding. At first, the decadal average precipitation values were calculated using the monthly aggregated precipitation data from January 2010 to November 2023, and then the decadal average values were subtracted from the monthly data for 2020–2023 to determine the monthly precipitation anomaly values.
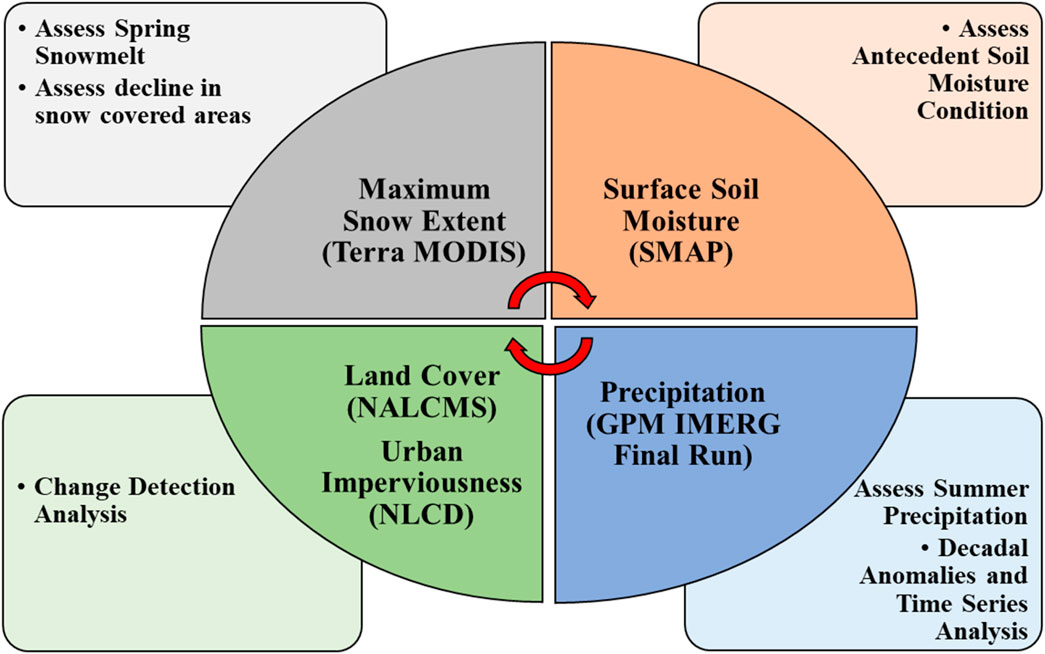
Figure 3. Conceptual framework diagram highlighting different Earth observation data inputs along with their source of satellite products, and processing data using different analytical methods such as anomalies based on decadal average, spatial and temporal (time series) variability analysis, and change detection analysis to obtain desired outcome indicators to investigate the possible drivers causing flooding in the study area.
Further, to analyze the changes caused by anthropogenic activities, a change detection analysis was carried out in the Geographic Information System (ArcGIS) Pro. A change detection analysis is a method that is used to compare multiple rasters from different periods, especially for the same region of interest, to determine the type, magnitude, and trend of change for a given variable of interest. In this study, change detection analysis was done for the land cover using 2010 and 2020 raster data and for urban imperviousness using 2001, 2011, and 2021 raster data. This study calculated the change in area for different classes using the same data from different periods. This analysis helped us understand the magnitude and types of changes observed in the region due to land cover changes mainly due to human-induced activities.
Additionally, all analytical procedures, including anomaly detection, trend analysis, and change detection algorithms, were benchmarked against established methodologies in the literature to ensure robustness and reproducibility.
3 Results
3.1 Changes in maximum snow cover extent
The northeastern US region experiences a rapid decline in maximum snow cover extent during the starting months of the spring season. Figure 4 shows the rapid change in the region’s snow cover extent when temperatures rise, and the climate becomes warmer during spring. It is also evident from Figure 4 that within 1 month (from March to April), there is a sharp and noticeable decline in the extent of snow cover in the region. This declining trend is observed in all the years considered in this study, which provides an overview of the snowmelt process in the region. During the summer months, starting from May until September, almost all the snowpack that was accumulated in the region disappears (see Figure 4). It can be deduced from the spatial plots (Figure 4) that there is an increase in spring snowmelt and the region’s rivers would see the rise in the streamflow and some areas peak flow in the rivers would be observed in the region. The amount of water that snowmelt processes contribute to the overall regional water balance is significant and based on the declining trend of snow cover observed in the region, it indeed plays an essential factor in the antecedent conditions to drive major flooding during summer months in the region.
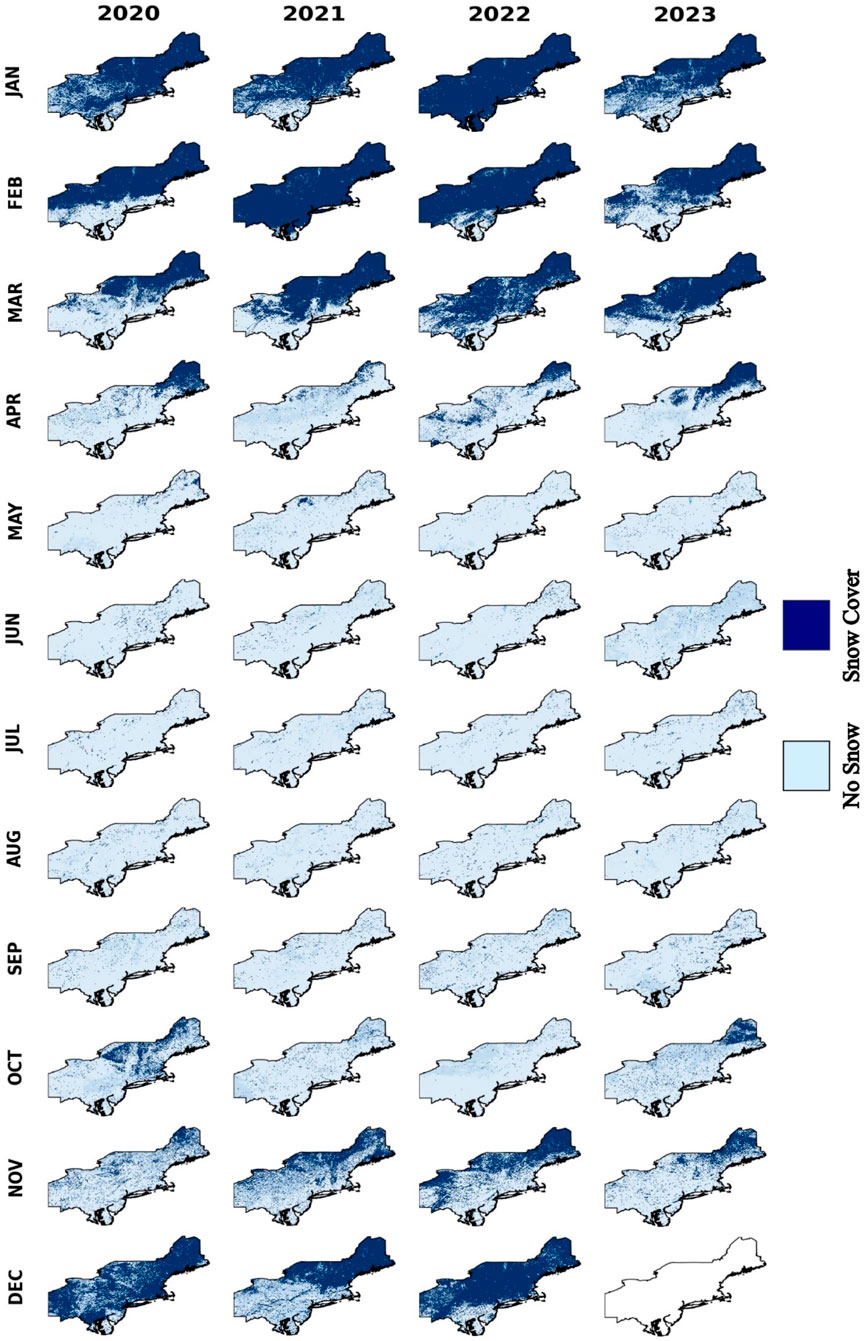
Figure 4. Spatial plots showing the maximum snow cover extent for each month from January 2020 to November 2023. The darker blue represents snow cover, and the lighter blue represents no snow. The Northeastern US receives much snow during winter, especially from December to March, as indicated in the figure, and then in April, most of the snowpack accumulated melts or thaws due to warmer climate as the spring season approaches, causing a rapid decrease in snow cover extent. The rapid decline of snow cover in April 2021 is more prominently observed in the figure.
Table 2 shows the rapid decline in the snow cover area during the spring season. The total snow cover area decreased from around 713,283 square kilometers (sq. km.) in February 2021 to 24,162 sq. km. in May 2021. The snow cover declined by almost 39% in March 2021, 90% in April, and 46% in May 2021. The most significant monthly decline in snow cover was observed in April 2021. Thus, in 3 months during the spring of 2021, the extent of snow cover declined by almost 97%. The total snow cover area decreased from around 447,988 sq. km. in February 2023 to 15,868 sq. km. in May 2023. The snow cover declined by almost 71% in April and 89% in May 2023. The most significant monthly decline in snow cover was observed in May 2023. Thus, in 3 months during the spring of 2023, the extent of snow cover declined by almost 97%, similar to what was observed in 2021. The total snow cover area also varies every year in the region. The snow cover declined noticeably in February 2023 (447,988 sq. km.) compared to February 2021 (713,283 sq. km.).
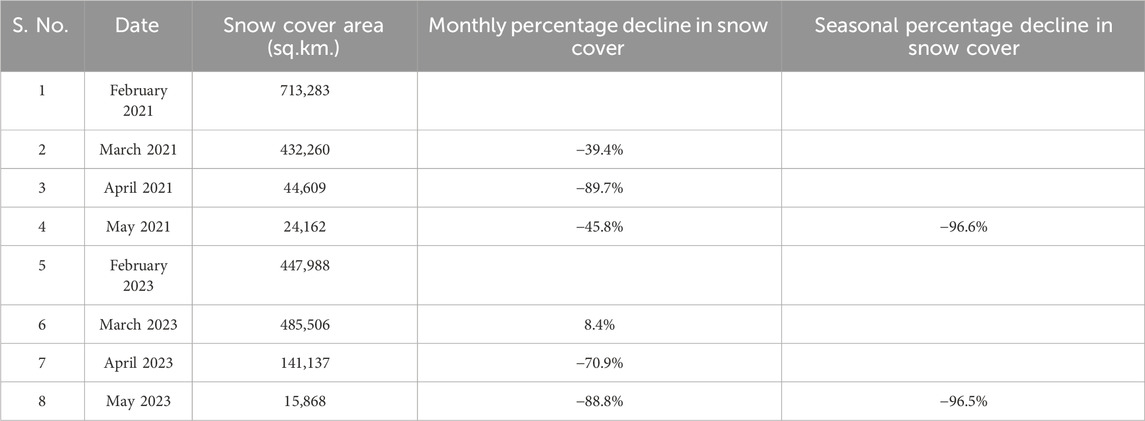
Table 2. Total snow cover area, monthly and seasonal percentage decline in snow cover.
3.2 Changes in soil moisture condition
Due to the rapid decline of snow cover observed during the spring season (refer to Figure 4) and the snowpack melting in large quantity, the soil moisture values in the region seem to be at a higher level, as seen in Figure 5. The snowmelt during initial spring months has contributed to an ample amount of water and moisture in the soil, which ultimately leads to higher-than-normal soil moisture conditions in the region. Most northern areas, comprising New England states, have higher soil moisture values during spring ranging above 0.5 m3/m3, as observed in Figure 5, compared to the southern region, as most of the snow falls in the northern areas, so when the snow is rapidly melting, the snow water is making the soil in those areas to be saturated, and therefore, higher soil moisture values are observed. Soil moisture values increase rapidly from April to May for the entire period in the region, as seen in Figure 5, further explaining the saturated soil conditions. The soil moisture values in the spring months (March-May) usually remain higher than in the summer months (June-September), especially in New England areas in the north. Coincidentally, the northern areas of the study area are where the flooding occurs more frequently and in larger magnitudes with severe conditions. So, the higher soil moisture values observed in these areas will play a role in the flood dynamics and drive the severity and magnitude of flooding.
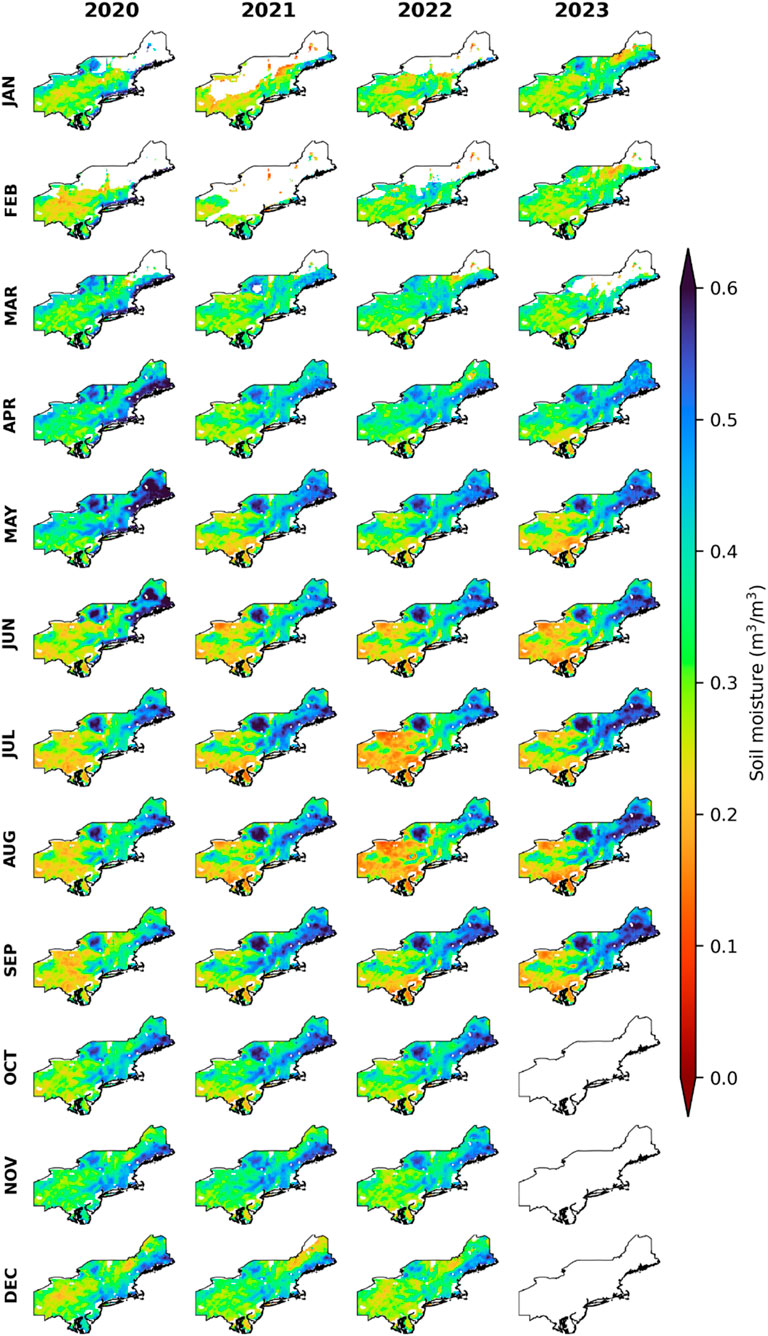
Figure 5. Spatial plots showing the surface soil moisture values for each month from January 2020 to September 2023. The blue color shows higher soil moisture, and the red color shows lower soil moisture. Most northern areas, comprising New England states, have higher soil moisture values during spring, above 0.5 m3/m3, compared to the southern region. As most of the snow falls in the northern areas, when the snow is rapidly melting, the snow water makes the soil in those areas saturated, and therefore, higher soil moisture values are observed.
In the summer, the soil moisture values increased in the northern areas, where most rainfall occurred, leading to further soil saturation. It can be observed from Figure 5 that the soil moisture is generally higher in the range of 0.6 m3/m3 and above in most of the northern areas in the region. It can also be observed from Figure 5 that the soil moisture was generally higher in 2021 and 2023 than in 2020 and 2022 during the summer period. One crucial deduction from the analysis is that the ground in the region was already saturated with the snowmelt processes even before the region received summer precipitation. The antecedent conditions of the region prior to the flooding season are further supported by the soil moisture observations and trends, as seen in Figure 5. Similarly, Figure 6 shows spatially averaged monthly soil moisture time series over the Northeastern US region, where the sharp rise in the soil moisture values during the spring season is clearly observed. It can be deduced that soil moisture drives the region’s flooding.
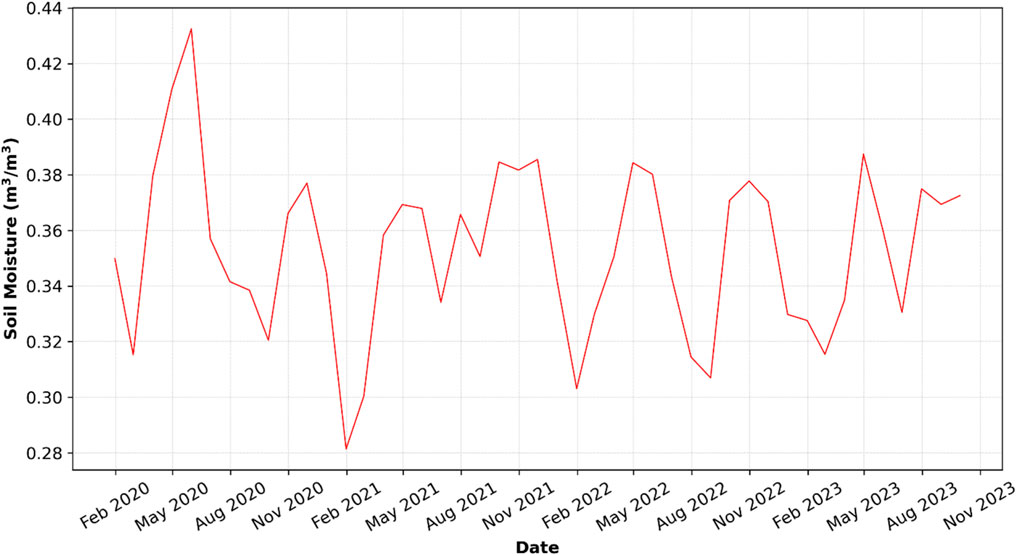
Figure 6. Time series plot showing the spatially averaged monthly surface soil moisture values from January 2020 to September 2023 for the Northeastern US region. The average surface soil moisture value usually rises during spring months (March-May) from the lowest values observed during winter months (January-February) in the region.
3.3 Changes in precipitation
The northeastern US receives most of the yearly precipitation during the summer due to tropical cyclones and the formation of low-pressure frontal and/or convective systems (Marquardt Collow et al., 2016). The time series plot in Figure 7 shows the spatially averaged monthly total precipitation and precipitation anomalies from January 2020 to November 2023 for the study region, where some notable total precipitation peaks are observed during December 2020 (∼200 mm), July 2021 (∼175 mm), and July 2023 (∼170 mm). Precipitation anomalies during intense precipitation events also have higher positive values (∼50–60 mm). So, the region received about 50–60 mm more rainfall than the decadal average precipitation during December 2020 July 2021, and July 2023, as seen in Figure 7. Figure 8 also depicts similar observations; during the summer period, typically from June to September, the region receives much more rainfall than in other seasons or months. July and August are the months that receive the most monsoon precipitation in the region. Most areas in the Northeastern US received rainfall between 150 and more than 300 mm in 2021 and 2023 from July to September, as seen in Figure 8. The rainfall distribution and magnitude are spatially varied across the region; however, the coastal areas and the northern areas around New England states generally received more rainfall. The accumulated rainfall in July 2021 and 2023 showed more than 300 mm each month across the abovementioned areas, which is an excessive amount of water (see Figure 8). New York, Connecticut, and New Jersey also received a higher amount of rainfall (more than 300 mm) during September of 2023, leading to significant flooding in these regions during that period. According to Figure 8, compared to the summer periods of 2020 and 2022, the monsoon was more active and severe during the 2021 and 2023 seasons, causing more damage from the flooding.
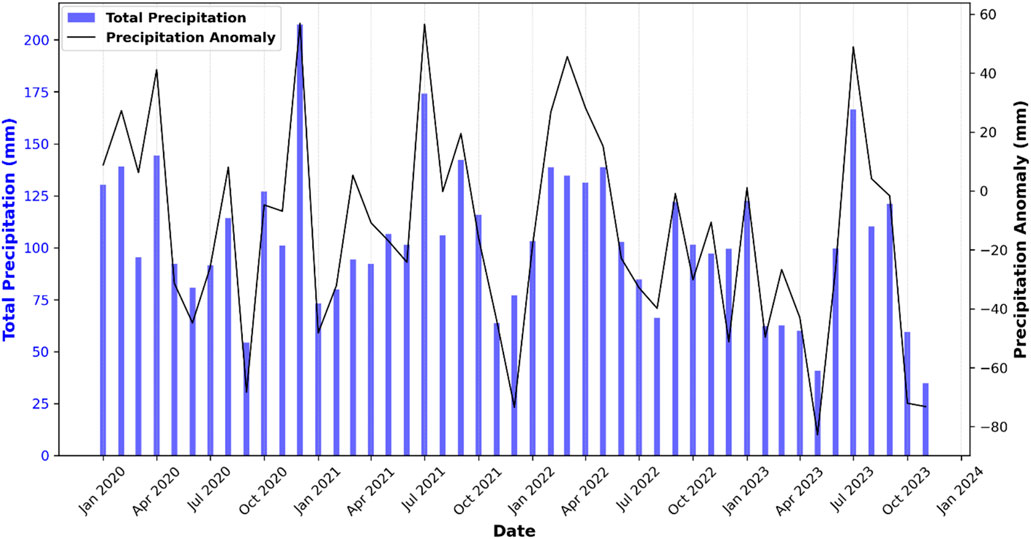
Figure 7. Time series plot showing the spatially averaged monthly total precipitation and precipitation anomaly values from January 2020 to November 2023 for the Northeastern US region. Some notable total precipitation peaks are observed during December 2020 (∼200 mm), July 2021 (∼175 mm), and July 2023 (∼170 mm). Precipitation anomalies during intense precipitation events also have higher positive values (∼50–60 mm). So, the region received about 50–60 mm more rainfall than the decadal average precipitation during December 2020 July 2021, and July 2023.
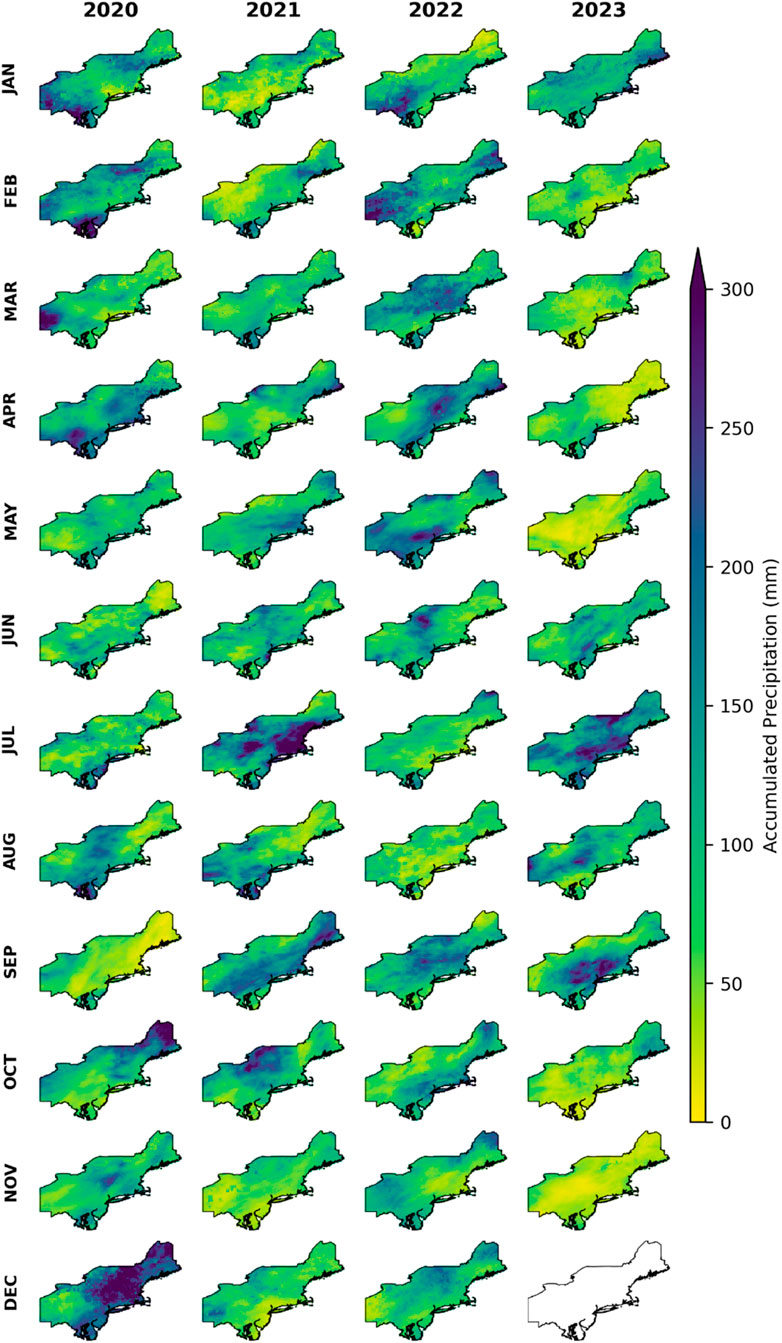
Figure 8. Spatial plots show the total accumulated precipitation for each month from January 2020 to November 2023. The darker blue color indicates a higher precipitation amount. During the summer period, typically from June to September, the region receives much more rainfall than in other seasons or months. July and August are the months that receive the most monsoon precipitation in the region. Most areas in the Northeastern US received rainfall between 150 and more than 300 mm in 2021 and 2023 from July to September.
Figure 9 shows the precipitation anomaly plots from 2020 to 2023. It clearly depicts that July and September of 2021 and 2023 received more than 100 mm above the decadal average precipitation in the region. The decadal average precipitation for July and September was 118 mm and 123 mm, respectively, showing the region received more than 40 mm of additional rainfall during July and September of 2021 and 2023 than the decadal average for these months alone. The blue color observed across the region, especially in coastal and northern areas, depicts positive anomalies in precipitation. This indicates that the rainfall that occurred in the region during 2021 and 2023 was abnormal because it received more rainfall than anticipated. It can also be deduced that during the spring months of 2021 and 2023, the region mostly received less rainfall than the average (negative precipitation anomalies), as indicated by the red colors in the maps as shown in Figure 9. Moreover, the region during the spring months in 2022 received more than average rainfall as shown by positive anomalies values of precipitation (Figure 9). However, during summer months, when it was supposed to receive more rainfall, the region received lower than average rainfall, which prevented the region from flooding severely in 2022. The observations and deductions obtained while comparing the precipitation anomalies of 2021 and 2023 with 2022 during the spring and summer months help draw a meaningful conclusion that precipitation is a vital factor driving the major flooding in the Northeastern US region. Another interesting observation was the anomalous event in the winter period, especially in December 2020, where the monthly total precipitation was around 200 mm, which was almost 60 mm more rainfall than the decadal average for the region. It can be deduced that such high winter precipitation in 2020 caused elevated soil moisture levels in the region and might have further exacerbated the flooding event in summer 2021. The frequency and severity of such extreme precipitation are increasing in the region, further exacerbating flood risk.
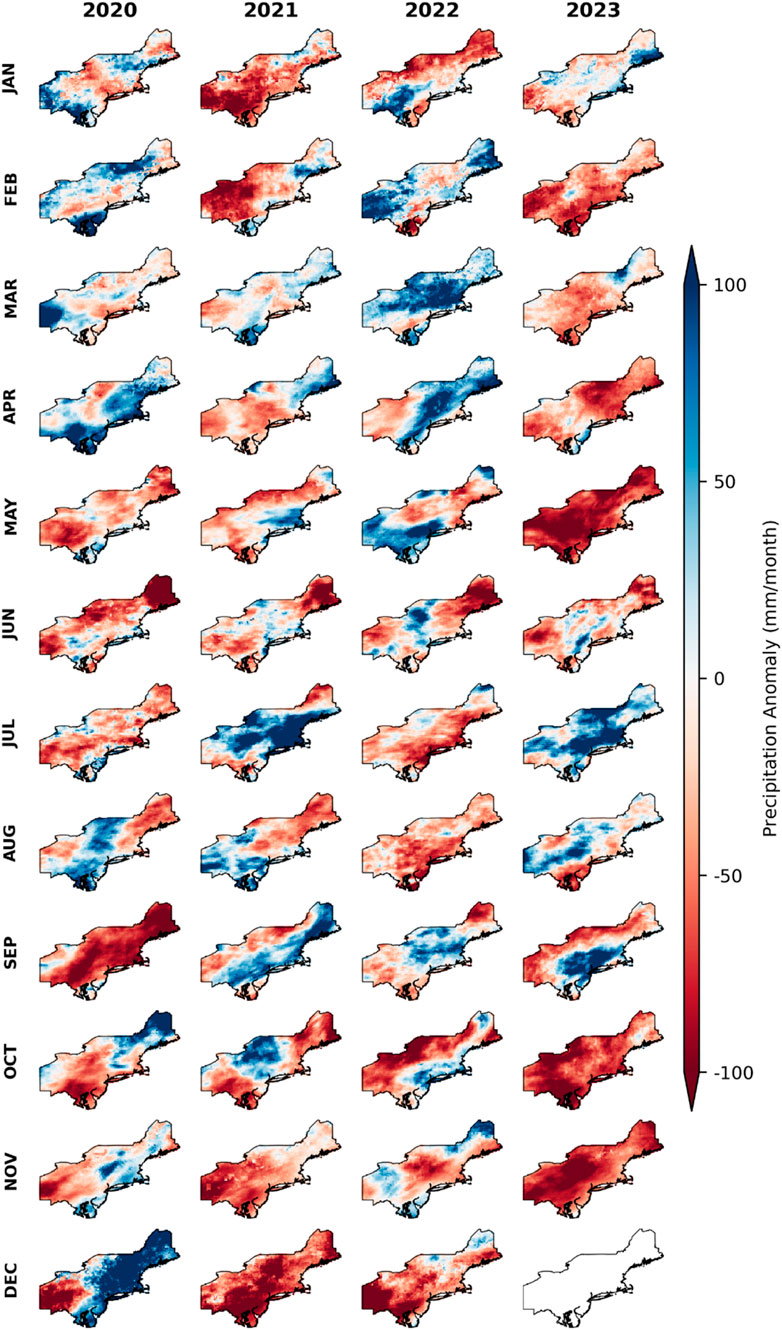
Figure 9. Spatial plots show the precipitation anomaly for each month from January 2020 to November 2023. The blue color indicates positive anomalies, whereas the red color indicates negative anomalies. It clearly depicts that July and September of 2021 and 2023 received more than 100 mm above the decadal average precipitation in the region. The blue color observed across the region, especially in coastal and northern areas, depicts positive anomalies in precipitation. This indicates that the rainfall that occurred in the region during 2021 and 2023 was abnormal because it received more rainfall than anticipated.
3.4 Changes in land cover
Figure 10 shows the total change in area for different land cover classes in the Northeastern US from 2010 to 2020. Examining the change in land cover in the region is imperative to build a connection with rising flooding. The change in land cover significantly affects the hydrological processes of a given watershed or region. In the case of the Northeastern USA region, between 2010 and 2020, a total of 1838 sq. km. area of croplands was changed into built-up areas, closely followed by 1,742 sq. km. area of broadleaf forests was converted into croplands, and about 1,363 sq. km. of these forests into urban and built-up areas (see Figure 10). Further, about 1,061 sq. km. area of mixed forests also were cut down for setting up urban areas, as shown in Figure 10. The forest resources seem to be affected mainly by the human-induced activities as evident from the area of deforestation done in the region, which is also clearly depicted in Figure 10. The trends observed over the last decade (2010–2020) alone (Figure 10) suggest that the region is moving towards urbanization and rapid expansion as more natural resources are being destroyed to build more urban settlements and infrastructures in the last decade alone.
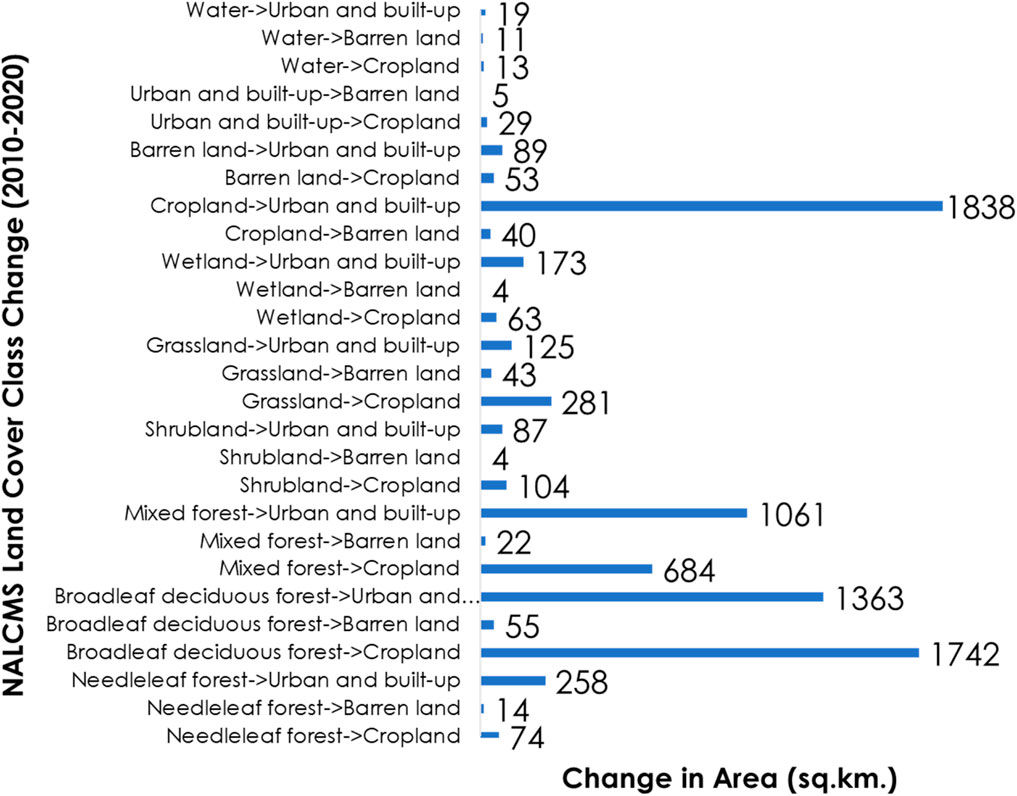
Figure 10. Change in total area of land cover classes from 2010 to 2020 in the Northeastern USA. Between 2010 and 2020, a total of 1838 sq. km. of croplands were changed into built-up areas, closely followed by 1742 sq. km. of broadleaf forests being converted into croplands, and about 1,363 sq. km. of these forests into urban and built-up areas.
3.5 Changes in urban imperviousness
Figure 11 also shows how the region’s urban impervious areas have changed over the last two decades. The analysis investigated changes and trends in open space and low, medium, and high-density developed areas. As per Figure 11, the maximum change in the area occurred when about 1700 sq. km. of open spaces were converted into medium intensity developed areas from 2001 to 2021, accounting for about 50%–79% of the total land surface area being impervious. The total change in open space converted into medium intensity developed areas was about 950 sq. km. from 2001 to 2011, and around 750 sq. km. from 2011 to 2021.

Figure 11. Change in total area of urban imperviousness between 2001 and 2021 (decadal change) in the Northeastern USA. The maximum change in the area occurred when about 1700 sq. km. of open spaces were converted into medium intensity developed areas from 2001 to 2021, accounting for about 50%–79% of the total land surface area being impervious. The total change in open space converted into medium intensity developed areas was about 950 sq. km. from 2001 to 2011, and around 750 sq. km. from 2011 to 2021.
Similarly, another notable change in the area occurred when about 1,450 sq. km. of open spaces, which accounts for less than 20% of impervious surface, also got converted into low-density developed areas, which accounts for about 50%–79% of the total land surface area being impervious, as depicted in Figure 11. The total change in open space converted into low intensity developed areas was about 1,000 sq. km. in the period from 2001 to 2011, and around 500 sq. km. in the period from 2011 to 2021. Further, about 500 sq. km. of land got converted from open spaces to high-density developed areas, which accounts for about 80%–100% of the total land surface area being impervious, as observed in Figure 11. These trends also support the rapid urbanization and expansion that the region has experienced in the last two decades. The changes from such human-induced activities bolster the evidence that they can potentially drive flooding.
4 Discussion
Based on the analysis and deductions from the study’s results, the climatic and hydrological variables investigated are essential in driving major floodings in the Northeastern US region. Moreover, the changes occurring due to human-induced (anthropogenic) activities, such as changes in land cover types and urban imperviousness, drive flooding in addition to the climate and hydrological variables. The results above indicate anomalies in each variable relative to the short-term baseline before the main flooding period. These anomalies, particularly those associated with rapid spring snowmelt (see Figure 4) and wetter soil moisture conditions due to higher soil moisture values (see Figure 5), may serve as important antecedent signals that can influence flash flooding in the region. Further, the changes and trends observed in the summer precipitation (see Figure 8) and anomalies (see Figure 9) values, where the region received higher than average precipitation, could add to the prior antecedent conditions due to snow and soil moisture data, providing further evidence that the extreme summer precipitation is causing frequent and more severe flooding in the Northeastern US region. The noticeable changes in human-induced land cover types such as urban/built-up and croplands, from natural forest resources (see Figure 10) and the rise in the impervious surfaces (see Figure 11) in the region due to the rapid urbanization and population growth over the last two decades also played an essential role in causing flooding and help indicate flood risk in the region. Therefore, the remotely sensed datasets analyzed in this study have been very useful in studying major driving factors that have the potential to cause major flooding in the Northeastern USA.
The USA, like any other country on Earth, is reeling under heatwaves and extreme temperatures due to the effects of climate change in recent years (Siddique and Palmer, 2021; Mayo and Lin, 2022; Torre Zaffaroni et al., 2023). The climate in the region is getting warmer due to the consistent rise in air and land surface temperatures, especially during spring and summer, which ultimately leads to the rapid decline in snowpack accumulated over the winter months (Thiebault and Young, 2020; Burakowski et al., 2022). This rapid decline in snow cover extent and increased snowmelt runoff causes spring floods where the rivers in the region experience peak runoff from the snowmelt runoff (Armstrong et al., 2012; Melillo et al., 2014; Thiebault and Young, 2020; Burakowski et al., 2022). In addition, when the snow starts to thaw due to rising temperatures, it covers the soil with water. Since the soil acts as a sponge to hold excess water, which is essential during flooding, if the soil is already saturated with snowmelt water from spring, it does not hold the extra capacity to hold more water that will be received during the summer monsoon period, that ultimately leads to major flooding events (Jessup and DeGaetano, 2008; Berghuijs et al., 2016; Thiebault and Young, 2020). Few studies have indicated that once the soil saturation exceeds 70%–80% of its capacity, the infiltration rate drops sharply, so the excess rainfall directly becomes surface runoff (Brocca et al., 2013). Therefore, in temperate humid regions such as the Northeastern US, the antecedent surface soil moisture value above 0.3–0.35 m3/m3 is the threshold estimate beyond which storm runoff coefficients increase significantly due to enough soil saturation conditions on the ground to cause rapid runoff generation (Crow et al., 2017; Case et al., 2021). Moreover, the surface soil moisture values exceeding 0.5 m3/m3 (Figure 5) in many areas, as per the analysis carried out in this study, which is more than the soil moisture threshold estimates found in the literature review. These findings prove that the higher soil moisture observed in months preceding the flood events in our study area likely generated excess runoff, amplifying flood severity. These similar trends and characteristics have been captured from this study, which leads to the deduction that if such antecedent conditions are observed in the Northeastern region in the future, prior to the primary flooding season, then the Northeastern US region can expect to have a higher magnitude and severe flooding conditions during summer.
In the Northeastern US, severe thunderstorms occur during the summer, which feed extreme precipitation in the land (Armstrong et al., 2014; Suro et al., 2015). During these extreme events, the rainfall is higher, causing excess runoff to feed into the nearby streams and rivers, increasing river discharge and water level that ultimately causes flash flooding (Lins and Slack, 1999; Burns et al., 2007; Suro et al., 2015). Another essential point to note from the analysis of the results from this study is to determine and assess the ground’s antecedent conditions before these extreme rainfall events start. It is essential to know how wet or saturated the soil was before the start of the summer precipitation to make predictions and deductions about the nature of flooding that can be expected in the region. Knowing and understanding the ground conditions because of different climatic and hydrological variables during the spring season helps to make accurate and correct predictions of the flood dynamics in the summer period. This can be applied to the Northeastern US region based on the deductions made by examining the analysis results.
Land cover changes, notably deforestation, rapid urban expansion, and industrialization, which focus on increasing agricultural productivity to support growing populations, have profound consequences that can significantly intensify the flood risk (Aslam et al., 2023; Aslam et al., 2024). The extent of impervious surface in a region directly impacts the hydrology of a region under consideration (Li et al., 2020; Woltemade et al., 2020). Smooth, impervious surfaces reduce the roughness of the land surface thereby limiting infiltration and increasing surface runoff (Anderson et al., 2010; Li et al., 2020; Woltemade et al., 2020). Changing the land cover types from forests to agriculture or urban areas substantially increases impervious surfaces, increasing the runoff coefficient and decreasing infiltration rate. As a result, excess rainfall/water cannot percolate into the soil, leading to greater surface runoff, flash flooding, and inundation. Runoff coefficients typically increase from 0.10 to 0.25 in forested areas to 0.70–0.95 in highly urbanized areas (Chow, 1959). Similarly, infiltration rates can decline from 50 to 75 mm/h in forested areas to less than 10 mm/h on impervious surfaces (Chow, 1959), reducing groundwater recharge. This rise in runoff coefficient and decline in groundwater recharge led to increased peak discharges and shortened lag times during storm events, exacerbating flash flooding in urban areas undergoing rapid land cover change over several decades. The cities and suburban areas in the Northeastern US also face similar challenges (Hayhoe et al., 2007; Anderson et al., 2010; Berghuijs et al., 2016; Li et al., 2020; Woltemade et al., 2020). If more houses and roads are being built instead of having more natural areas to retain the excess water during heavy storms, then this ultimately increases the chance of the area’s flash flooding as the land surface loses its infiltration capacity to percolate excess water on the ground (Woltemade et al., 2020). Therefore, it is safe to assume that land cover changes and increased urban imperviousness play a crucial role in causing flooding and contributing to potential flood risk for any region where rapid urbanization and expansion are occurring due to human-induced interventions, as seen in the Northeastern US region over the last two to 3 decades.
Furthermore, numerous studies that used IPCC AR6 projections in their analysis have concluded that there will be an increase in both mean and extreme precipitation in Northeastern USA in the future with higher chances of intense weather events occurrences and closely followed by an increase in the magnitude and severity of river and pluvial flooding (Agel and Barlow, 2020; Akinsanola et al., 2020; Martel et al., 2022; Sengupta et al., 2022; Calvin et al., 2023). Sengupta et al. (2022) concluded that precipitation is projected to increase over the northeastern United States by 0.8–1.0 mm/day against the historical mean of 3.0–3.3 mm/day. They also deduced that the projected increase in precipitation is consistent with the projected rise in cyclonic circulation systems with amplified moisture coming into the East Coast from the Atlantic. They also predicted a rise in spring precipitation trend with an increase of 0.6–0.8 mm/day relative to a historical average of 3.3–3.6 mm/day. (Akinsanola et al., 2020). also made similar deductions about the projected changes in seasonal precipitation extremes in the Northeastern region. These deductions by the climate scientists are alarming and further solidify the findings of this study.
One of the major limitations of this study lies in the inherent uncertainties associated with remotely sensed datasets. Satellite observations are subject to inaccuracies mainly due to retrieval algorithms that process raw data, the relatively coarser spatial and temporal resolutions, and sensor-related uncertainties. In addition, atmospheric disturbances such as cloud cover, haze, and dust can further affect the quality of the datasets. Although complex calibration and validation procedures are applied before these remotely sensed datasets are released to the public for various applications, such limitations remain relevant when interpreting the findings. Nevertheless, the datasets employed in this study have undergone some methodological validation in reducing their uncertainties and have been widely used in prior research, which supports their suitability for hydrological and climatic analyses in the Northeastern United States.
Regarding the research questions highlighted at the beginning, the key findings of this study are as follows:
• Climatic and hydrological drivers: The analysis demonstrates that extreme precipitation events, combined with higher antecedent soil moisture resulting from rapid snow cover decline (rapid snowmelt), strongly influenced catastrophic flooding in the Northeastern United States. Major summer flooding events were typically preceded by rapid spring snowmelt and rising soil moisture conditions, which were compounded by extreme summer precipitation. In addition, land cover changes and increasing urban imperviousness amplified localized flooding severity, underscoring the role of anthropogenic changes in exacerbating flood impacts. This study used decadal anomaly analysis, spatial and temporal variability assessment, and change detection techniques applied to satellite Earth observation datasets to obtain desired outcome indicators and investigate the possible drivers causing flooding in the study area.
• Pre-flood variability: Spatial and temporal variability in snow cover extent, surface soil moisture, and precipitation preceding major floods highlight the crucial role of antecedent conditions in setting the stage for flood extremes. For instance, the region experienced wetter antecedent soil moisture conditions (>0.5 m3/m3) during spring due to rapid snowmelt (seasonal decline of ∼97%) in all the periods considered in the study. Moreover, the summer precipitation fed excess water (∼50–60 mm more rainfall than the decadal average) into wetter ground conditions, overwhelming the region’s overall hydrology and water balance and causing significant flooding.
• Land cover and urbanization: Changes in land cover and an increase in urban impervious surfaces substantially contributed to increased flood risk in the Northeastern United States. Between 2010 and 2020, approximately 1,838 km2 of croplands and 1,363 km2 of forests transitioned into built-up areas, reducing natural infiltration capacity and amplifying surface runoff during extreme weather events. Similarly, from 2001 to 2021, nearly 1,700 km2 of open spaces were converted into medium-intensity developed areas and 1,450 km2 into low-intensity developed areas, expanding impervious surfaces across the region. These land use transitions and increased urban imperviousness have altered the region’s hydrologic cycle and heightened the magnitude and severity of flooding, underscoring the significant contribution of anthropogenic changes to regional flood vulnerability.
5 Future work
While this study was designed to assess the broader spatial and temporal dynamics of climatic and hydrological variables along with anthropogenic impacts from land cover and urban imperviousness, a detailed typological analysis of flooding events at localized scales falls beyond the scope of this study. Nonetheless, such an approach would undoubtedly enhance the depth of understanding of flood risks in the region. Therefore, this study’s findings can serve as a guiding framework for future analyses, in which specific flood events that occur over small, highly urbanized areas may be investigated in greater detail. Building on the present study’s findings, the future work will integrate typological frameworks that explicitly link antecedent hydrological conditions (e.g., snowmelt, soil moisture) and climatic drivers to distinct flood types and their associated impacts at local scales. In addition, correlation analyses of different climatic variables investigated here could provide future insight into their spatial and temporal interrelationships and collective influence on flooding in the region.
6 Conclusion
This study analyzed dominant climatic and hydrological variables, such as maximum snow extent, surface soil moisture, and precipitation, and changes in anthropogenic activities, such as changes in land cover and change in urban imperviousness, to indicate whether they could be potential indicators for possible flood risk and whether they contribute to flooding in the Northeastern US region. This study utilized various remote sensing satellite products to analyze variables and fulfil the study’s objectives. This study mainly focused its analysis and deductions on the flooding events of 2021 and 2023 that occurred over the summer. The Northeastern US region experienced wetter antecedent soil moisture conditions during spring due to rapid snowmelt in all the periods considered in the study. Moreover, the summer precipitation fed excess water into already wetter ground conditions, overwhelming the region’s overall hydrology and water balance and ultimately causing significant flooding. During the summer months of 2021 and 2023, the region received higher-than-average precipitation that mainly caused flooding. Furthermore, the noticeable changes in human-induced land cover types such as urban/built-up and croplands from natural forest resources and the rise in the impervious surfaces in the region due to the rapid urbanization and population growth over the last two decades also played an essential role in causing flooding and help indicate flood risk in the region.
In addition to providing deeper scientific insights, key findings of this study carry important implications and lessons learned for flood risk management and regional planning in the Northeastern United States. The established notion of how antecedent soil moisture, snow cover, and precipitation anomalies, combined with the impacts of land cover change and urban imperviousness, drive flooding could open many research avenues for integrated monitoring systems that couple satellite-based Earth observations with ground truth hydrological estimates. Such integrated monitoring systems could enhance early warning systems, devise robust flood preparedness strategies, and improve climate-resilient infrastructures in flood-prone areas. Furthermore, the outcomes of this study could help policymakers and municipal authorities prioritize resources in the region’s most vulnerable flood-prone areas and allocate resources to design robust nature-based solutions to mitigate flood impacts.
Data availability statement
The original contributions presented in the study are included in the article/supplementary material, further inquiries can be directed to the corresponding author.
Author contributions
AA: Conceptualization, Data curation, Formal Analysis, Investigation, Methodology, Resources, Software, Validation, Visualization, Writing – original draft, Writing – review and editing. VL: Funding acquisition, Project administration, Supervision, Writing – review and editing.
Funding
The author(s) declare that no financial support was received for the research and/or publication of this article.
Conflict of interest
The authors declare that the research was conducted in the absence of any commercial or financial relationships that could be construed as a potential conflict of interest.
Generative AI statement
The author(s) declare that no Generative AI was used in the creation of this manuscript.
Any alternative text (alt text) provided alongside figures in this article has been generated by Frontiers with the support of artificial intelligence and reasonable efforts have been made to ensure accuracy, including review by the authors wherever possible. If you identify any issues, please contact us.
Publisher’s note
All claims expressed in this article are solely those of the authors and do not necessarily represent those of their affiliated organizations, or those of the publisher, the editors and the reviewers. Any product that may be evaluated in this article, or claim that may be made by its manufacturer, is not guaranteed or endorsed by the publisher.
References
2023 Northeast US Floods - Center for Disaster Philanthropy (2024). Available online at: https://disasterphilanthropy.org/disasters/2023-northeast-us-floods/ (Accessed May 20, 2024).
Agel, L., and Barlow, M. (2020). How well do CMIP6 historical runs match observed northeast U.S. precipitation and extreme precipitation–related circulation? J. Clim. 33, 9835–9848. doi:10.1175/JCLI-D-19-1025.1
Agel, L., Barlow, M., Feldstein, S. B., and Gutowski, W. J. (2017). Identification of large-scale meteorological patterns associated with extreme precipitation in the US Northeast. Clim. Dyn. 50, 1819–1839. doi:10.1007/s00382-017-3724-8
Akinsanola, A. A., Kooperman, G. J., Reed, K. A., Pendergrass, A. G., and Hannah, W. M. (2020). Projected changes in seasonal precipitation extremes over the United States in CMIP6 simulations. Environ. Res. Lett. 15, 104078. doi:10.1088/1748-9326/abb397
Alfieri, L., Bisselink, B., Dottori, F., Naumann, G., de Roo, A., Salamon, P., et al. (2017). Global projections of river flood risk in a warmer world. Earths Future 5, 171–182. doi:10.1002/2016EF000485
Anderson, B. T., Hayhoe, K., and Liang, X. Z. (2010). Anthropogenic-induced changes in twenty-first century summertime hydroclimatology of the Northeastern US. Clim. Change 99, 403–423. doi:10.1007/S10584-009-9674-3
Armstrong, W. H., Collins, M. J., and Snyder, N. P. (2012). Increased frequency of low-magnitude floods in New England. J. Am. Water Resour. Assoc. 48, 306–320. doi:10.1111/J.1752-1688.2011.00613.X
Armstrong, W. H., Collins, M. J., Snyder, N. P., Kundzewicz, E. Z. W., and Lins, H. (2014). Hydroclimatic flood trends in the northeastern United States and linkages with large-scale atmospheric circulation patterns. Hydrol. Sci. J. 59, 1636–1655. doi:10.1080/02626667.2013.862339
Aryal, A., Bosch, R., and Lakshmi, V. (2023a). Climate risk and vulnerability assessment of georgian hydrology under future climate change scenarios. Climate 211, 222–11. doi:10.3390/CLI11110222
Aryal, A., Tran, T. N. D., Kumar, B., and Lakshmi, V. (2023b). Evaluation of satellite-derived precipitation products for streamflow simulation of a Mountainous Himalayan watershed: a study of Myagdi Khola in Kali Gandaki Basin, Nepal. Remote Sens. (Basel) 15, 4762. doi:10.3390/rs15194762
Aryal, A., Kim, K. Y., and Lakshmi, V. (2025). Understanding flood dynamics in the Indus river basin: lessons from the 2022 Pakistan deluge. J. Hydrol. Reg. Stud. 59, 102362. doi:10.1016/j.ejrh.2025.102362
Aslam, R. W., Shu, H., and Yaseen, A. (2023). Monitoring the population change and urban growth of four major Pakistan cities through spatial analysis of open source data. Ann. GIS 29, 355–367. doi:10.1080/19475683.2023.2166989
Aslam, R. W., Naz, I., Quddoos, A., and Quddusi, M. R. (2024). Assessing climatic impacts on land use and land cover dynamics in Peshawar, Khyber Pakhtunkhwa, Pakistan: a remote sensing and GIS approach. GeoJournal 89, 202. doi:10.1007/s10708-024-11203-6
Berghuijs, W. R., Woods, R. A., Hutton, C. J., and Sivapalan, M. (2016). Dominant flood generating mechanisms across the United States. Geophys Res. Lett. 43, 4382–4390. doi:10.1002/2016GL068070
Beven, J. L., Hagen, A., and Berg, R. (2022). Tropical cyclone report: Hurricane Ida. Miami, Florida: National Weather Service, National Oceanic and Atmospheric Administration (NOAA).
Brocca, L., Moramarco, T., Melone, F., and Wagner, W. (2013). A new method for rainfall estimation through soil moisture observations. Geophys Res. Lett. 40, 853–858. doi:10.1002/grl.50173
Burakowski, E. A., Contosta, A. R., Grogan, D., Nelson, S. J., Garlick, S., and Casson, N. (2022). Future of winter in northeastern North America: climate indicators portray warming and snow loss that will impact ecosystems and communities. Northeast. Nat. (Steuben). 28, 180–207. doi:10.1656/045.028.S1112
Burns, D. A., Klaus, J., and McHale, M. R. (2007). Recent climate trends and implications for water resources in the Catskill Mountain region, New York, USA. J. Hydrol. (Amst) 336, 155–170. doi:10.1016/J.JHYDROL.2006.12.019
Calvin, K., Dasgupta, D., Krinner, G., Mukherji, A., Thorne, P. W., Trisos, C., et al. (2023). IPCC, 2023: climate change 2023: synthesis report. Contribution of working groups I, II and III to the sixth assessment report of the intergovernmental panel on climate change, Core Writing Team, H. Lee,, and J. Romero editors IPCC, Geneva, Switzerland. doi:10.59327/IPCC/AR6-9789291691647
Case, J. L., Wood, L. T., Blaes, J. L., White, K. D., Hain, C. R., and Schultz, C. J. (2021). Soil moisture responses associated with significant tropical cyclone rainfall events. J. Oper. Meteorol. 9 (1), 1–17. doi:10.15191/nwajom.2020.0901
Clarke, B., Otto, F., Stuart-Smith, R., and Harrington, L. (2022). Extreme weather impacts of climate change: an attribution perspective. Environ. Res. Clim. 1, 012001. doi:10.1088/2752-5295/AC6E7D
Crow, W. T., Han, E., Ryu, D., Hain, C. R., and Anderson, M. C. (2017). Estimating annual water storage variations in medium-scale (2000–10 000 km2) basins using microwave-based soil moisture retrievals. Hydrol. Earth Syst. Sci. 21, 1849–1862. doi:10.5194/hess-21-1849-2017
Demaria, E. M. C., Palmer, R. N., and Roundy, J. K. (2016). Regional climate change projections of streamflow characteristics in the Northeast and Midwest U.S. J. Hydrol. Reg. Stud. 5, 309–323. doi:10.1016/J.EJRH.2015.11.007
DeWalle, D. R., Swistock, B. R., Johnson, T. E., and McGuire, K. J. (2000). Potential effects of climate change and urbanization on mean annual streamflow in the United States. Water Resour. Res. 36, 2655–2664. doi:10.1029/2000WR900134
Dewitz, J. (2021). National land cover database (NLCD) 2019 products (ver. 3.0, February 2024) [Data set]. U.S. Geological Survey USGS. Available online at: https://doi.org/10.5066/P9KZCM54 (Accessed March 25, 2024).
Do, S. K., Akhtar, F., Goffin, B., Aryal, A., Tran, T.-N.-D., Lipscomb, M., et al. (2024). Assessing terrestrial water storage variations in Afghanistan using GRACE and FLDAS-Central Asia data. J. Hydrol. Reg. Stud. 55, 101906. doi:10.1016/j.ejrh.2024.101906
Eisenbies, M. H., Aust, W. M., Burger, J. A., and Adams, M. B. (2007). Forest operations, extreme flooding events, and considerations for hydrologic modeling in the appalachians—a review. Ecol Manage 242, 77–98. doi:10.1016/J.FORECO.2007.01.051
Fang, B., Lakshmi, V., Cosh, M., Liu, P. W., Bindlish, R., and Jackson, T. J. (2022). A global 1-km downscaled SMAP soil moisture product based on thermal inertia theory. Vadose Zone J. 21, e20182. doi:10.1002/VZJ2.20182
Goffin, B. D., Aryal, A., Deppert, Q., Ross, K. W., and Lakshmi, V. (2024). Mapping extreme Wildfires using a critical threshold in SMAP soil moisture. Remote Sens. (Basel) 16, 2457. doi:10.3390/rs16132457
Hall, D. K., and Riggs, G. A. (2021). “MODIS/Terra snow cover 8-day L3 global 500m SIN Grid, version 61 [data set],” in NASA National Snow and Ice Data Center Distributed Active Archive Center. Boulder, Colorado. Available online at: https://doi.org/10.5067/MODIS/MOD10A2.061 (Accessed February 22, 2024).
Hall, D. K., Hall, D. K., Riggs, G. A., Digirolamo, N. E., and Román, M. O. (2019). Evaluation of MODIS and VIIRS cloud-gap-filled snow-cover products for production of an Earth science data record. Hydrol. Earth Syst. Sci. 23, 5227–5241. doi:10.5194/HESS-23-5227-2019
Hayhoe, K., Wake, C. P., Huntington, T. G., Luo, L., Schwartz, M. D., Sheffield, J., et al. (2007). Past and future changes in climate and hydrological indicators in the US Northeast. Clim. Dyn. 28, 381–407. doi:10.1007/S00382-006-0187-8
Hayhoe, K., Wake, C., Anderson, B., Liang, X. Z., Maurer, E., Zhu, J., et al. (2008). Regional climate change projections for the Northeast USA. Mitig. Adapt Strateg. Glob. Chang. 13, 425–436. doi:10.1007/S11027-007-9133-2
Hirabayashi, Y., Mahendran, R., Koirala, S., Konoshima, L., Yamazaki, D., Watanabe, S., et al. (2013). Global flood risk under climate change. Nat. Clim. Chang. 3, 816–821. doi:10.1038/nclimate1911
Hirsch, R. M., and Ryberg, K. R. (2012). Has the magnitude of floods across the USA changed with global CO 2 levels? Hydrological Sci. J. 57, 1–9. doi:10.1080/02626667.2011.621895
Hodgkins, G. A., Dudley, R. W., and Huntington, T. G. (2003). Changes in the timing of high river flows in New England over the 20th Century. J. Hydrol. (Amst) 278, 244–252. doi:10.1016/S0022-1694(03)00155-0
Horton, R., Solecki, W., and Rosenzweig, C. (2012). Climate change in the Northeast: a Sourcebook. Draft technical input report prepared for the U.S. National climate assessment. Available online at: https://data.globalchange.gov/report/nca-climchne-2012 (Accessed May 23, 2024).
Hou, A. Y., Kakar, R. K., Neeck, S., Azarbarzin, A. A., Kummerow, C. D., Kojima, M., et al. (2014). The global precipitation measurement mission. Bull. Am. Meteorol. Soc. 95, 701–722. doi:10.1175/BAMS-D-13-00164.1
Huffman, G. J., Bolvin, D. T., Braithwaite, D., Hsu, K., Joyce, R., Kidd, C., et al. (2015). NASA global precipitation measurement (GPM) integrated multi-satellitE retrievals for GPM (IMERG). Algorithm Theoretical Basis Document (ATBD) Version 4.5, 26. Available online at: https://pmm.nasa.gov/sites/default/files/imce/times_allsat.jpg%0Ahttps://pmm.nasa.gov/sites/default/files/document_files/IMERG_ATBD_V4.5.pdf%0Ahttps://pmm.nasa.gov/sites/default/files/document_files/IMERG_ATBD_V4.5.pdf.
Huffman, G. J., Bolvin, D. T., Braithwaite, D., Hsu, K. L., Joyce, R. J., Kidd, C., et al. (2020). Integrated multi-satellite retrievals for the global precipitation measurement (GPM) mission (IMERG). Adv. Glob. Change Res. 67, 343–353. doi:10.1007/978-3-030-24568-9_19
Huffman, G. J., Bolvin, D. T., Joyce, R., Nelkin, E. J., Tan, J., Braithwaite, D., et al. (2023a). NASA global precipitation measurement (GPM) multi-satellitE retrievals for GPM (IMERG). Algorithm Theoretical Basis Document Version 07. Available online at: https://gpm.nasa.gov/media/489 (Accessed June 3, 2024).
Huffman, G. J., Stocker, E. F., Bolvin, D. T., Nelkin, E. J., and Tan, J. (2023b). GPM IMERG final precipitation L3 1 day 0.1 degree x 0.1 degree V07 [Dataset]. Goddard Earth Sciences Data and Information Services Center GES DISC. Available online at: https://10.5067/GPM/IMERGDF/DAY/07 (Accessed January 2, 2024).
Huntington, T. G., Richardson, A. D., McGuire, K. J., and Hayhoe, K. (2009). Climate and hydrological changes in the northeastern United States: recent trends and implications for forested and aquatic ecosystems. Can. J. For. Res. 39, 199–212. doi:10.1139/x08-116
Ida’s flooding rains shift to Pennsylvania, New England as tornadoes threaten mid-Atlantic Yale Climate Connections (2024). Available online at: https://yaleclimateconnections.org/2021/09/idas-flooding-rains-shift-to-pennsylvania-new-england-as-tornadoes-threaten-mid-atlantic/ (Accessed May 20, 2024).
Intense Storms in the Northeast Cause Catastrophic Flooding|NESDIS (2024). Available online at: https://www.nesdis.noaa.gov/news/intense-storms-the-northeast-cause-catastrophic-flooding (Accessed May 20, 2024).
Jessup, S. M., and Colucci, S. J. (2012). Organization of flash-flood-producing precipitation in the Northeast United States. Weather Forecast 27, 345–361. doi:10.1175/WAF-D-11-00026.1
Jessup, S. M., and DeGaetano, A. T. (2008). A statistical comparison of the properties of flash flooding and nonflooding precipitation events in portions of New York and Pennsylvania. Weather Forecast 23, 114–130. doi:10.1175/2007WAF2006066.1
Kirshen, P., Watson, C., Douglas, E., Gontz, A., Lee, J., and Tian, Y. (2008). Coastal flooding in the Northeastern United States due to climate change. Mitig. Adapt Strateg. Glob. Chang. 13, 437–451. doi:10.1007/S11027-007-9130-5
Lakshmi, V., and Fang, B. (2023). SMAP-derived 1-km downscaled surface soil moisture product, version 1 [data set]. Boulder, Colorado: NASA National Snow and Ice Data Center Distributed Active Archive Center.
Land Cover, (2010). Landsat, 30m. Available online at: http://www.cec.org/north-american-environmental-atlas/land-cover-2010-landsat-30m/ (Accessed May 22, 2024).
Lehmann, J., Coumou, D., and Frieler, K. (2015). Increased record-breaking precipitation events under global warming. Clim. Change 132, 501–515. doi:10.1007/s10584-015-1434-y
Li, C., Sun, G., Caldwell, P. V., Cohen, E., Fang, Y., Zhang, Y., et al. (2020). Impacts of urbanization on watershed water balances across the conterminous United States. Water Resour. Res. 56, e2019WR026574. doi:10.1029/2019WR026574
Lins, H. F., and Slack, J. R. (1999). Streamflow trends in the United States. Geophys Res. Lett. 26, 227–230. doi:10.1029/1998GL900291
Mallakpour, I., and Villarini, G. (2015). The changing nature of flooding across the central United States. Nat. Clim. Chang. 5, 250–254. doi:10.1038/NCLIMATE2516
Marquardt Collow, A. B., Bosilovich, M. G., and Koster, R. D. (2016). Large-scale influences on summertime extreme precipitation in the northeastern United States. J. Hydrometeorol. 17, 3045–3061. doi:10.1175/JHM-D-16-0091.1
Martel, J.-L., Brissette, F., Troin, M., Arsenault, R., Chen, J., Su, T., et al. (2022). CMIP5 and CMIP6 model projection comparison for hydrological impacts over North America. Geophys Res. Lett. 49, e2022GL098364. doi:10.1029/2022GL098364
Mayo, T. L., and Lin, N. (2022). Climate change impacts to the coastal flood hazard in the northeastern United States. Weather Clim. Extrem 36, 100453. doi:10.1016/J.WACE.2022.100453
Melillo, J. M., Richmond, T. T., and Yohe, G. (2014). Climate change impacts in the United States: the third national climate assessment.
National Land Cover Database (NLCD) 2019 (2024). Land cover science product (ver. 2.0, June 2021)|USGS science data catalog. Available online at: https://data.usgs.gov/datacatalog/data/USGS:60cb3da7d34e86b938a30cb9 (Accessed May 25, 2024).
North American Land Cover, 2020 (Landsat, 30m) (2024). Available online at: http://www.cec.org/north-american-environmental-atlas/land-cover-30m-2020/ (Accessed May 22, 2024).
Pal, S., Wang, J., Feinstein, J., Yan, E., and Kotamarthi, V. R. (2023). Projected changes in extreme streamflow and inland flooding in the mid-21st Century over Northeastern United States using ensemble WRF-Hydro simulations. J. Hydrol. Reg. Stud. 47, 101371. doi:10.1016/j.ejrh.2023.101371
Papalexiou, S. M., and Montanari, A. (2019). Global and regional increase of precipitation extremes under global warming. Water Resour. Res. 55, 4901–4914. doi:10.1029/2018WR024067
Parr, D., Wang, G., and Ahmed, K. F. (2015). Hydrological changes in the U.S. Northeast using the Connecticut River Basin as a case study: Part 2. Projections of the future. Glob. Planet Change 133, 167–175. doi:10.1016/J.GLOPLACHA.2015.08.011
Sengupta, A., Waliser, D. E., Massoud, E. C., Guan, B., Raymond, C., and Lee, H. (2022). Representation of atmospheric water budget and uncertainty quantification of future changes in CMIP6 for the seven U.S. National climate assessment regions. J. Clim. 35, 7235–7258. doi:10.1175/JCLI-D-22-0114.1
Siddique, R., and Palmer, R. (2021). Climate change impacts on local flood risks in the U.S. Northeast: a case study on the Connecticut and Merrimack river basins. JAWRA J. Am. Water Resour. Assoc. 57, 75–95. doi:10.1111/1752-1688.12886
Suro, T. P., Roland, M. A., and Kiah, R. G. (2015). Flooding in the northeastern United States, 2011. Reston, VA: Professional Paper. doi:10.3133/PP1821
Thiebault, K., and Young, S. (2020). Snow cover change and its relationship with land surface temperature and vegetation in northeastern North America from 2000 to 2017. Int. J. Remote Sens. 41, 8453–8474. doi:10.1080/01431161.2020.1779379
Torre Zaffaroni, P., Baldi, G., Texeira, M., Di Bella, C. M., and Jobbágy, E. G. (2023). The timing of global floods and its association with climate and topography. Water Resour. Res. 59, e2022WR032968. doi:10.1029/2022WR032968
Tran, T. N. D., Nguyen, B. Q., Zhang, R., Aryal, A., Grodzka-Łukaszewska, M., Sinicyn, G., et al. (2023). Quantification of gridded precipitation products for the streamflow simulation on the Mekong river basin using rainfall assessment framework: a case study for the Srepok river Subbasin, central Highland Vietnam. Remote Sens. 15, 1030–15. doi:10.3390/RS15041030
Trigg, M. A., Birch, C. E., Neal, J. C., Bates, P. D., Smith, A., Sampson, C. C., et al. (2016). The credibility challenge for global fluvial flood risk analysis. Environ. Res. Lett. 11, 094014. doi:10.1088/1748-9326/11/9/094014
Villarini, G. (2016). On the seasonality of flooding across the continental United States. Adv. Water Resour. 87, 80–91. doi:10.1016/J.ADVWATRES.2015.11.009
Villarini, G., and Slater, L. J. (2017). Climatology of flooding in the United States. Oxf. Res. Encycl. Nat. Hazard Sci. doi:10.1093/ACREFORE/9780199389407.013.123
Villarini, G., Serinaldi, F., Smith, J. A., and Krajewski, W. F. (2009). On the stationarity of annual flood peaks in the continental United States during the 20th Century. Water Resour. Res. 45. doi:10.1029/2008WR007645
Vogel, R. M., Yaindl, C., and Walter, M. (2011). Nonstationarity: flood magnification and recurrence reduction factors in the United States. J. Am. Water Resour. Assoc. 47, 464–474. doi:10.1111/J.1752-1688.2011.00541.X
Woltemade, C. J., Hawkins, T. W., Jantz, C., and Drzyzga, S. (2020). Impact of changing climate and land cover on flood magnitudes in the Delaware river basin, USA. JAWRA J. Am. Water Resour. Assoc. 56, 507–527. doi:10.1111/1752-1688.12835
Yang, L., Jin, S., Danielson, P., Homer, C., Gass, L., Bender, S. M., et al. (2018). A new generation of the United States National Land Cover Database: Requirements, research priorities, design, and implementation strategies. ISPRS J. Photogrammetry Remote Sens. 146, 108–123. doi:10.1016/J.ISPRSJPRS.2018.09.006
Keywords: flooding, northeastern US, remote sensing, hydrological drivers, anthropogenic impacts
Citation: Aryal A and Lakshmi V (2025) Assessing antecedent climatic and hydrological conditions and anthropogenic impacts to drive catastrophic flooding in the northeastern United States. Front. Remote Sens. 6:1639845. doi: 10.3389/frsen.2025.1639845
Received: 02 June 2025; Accepted: 17 September 2025;
Published: 30 September 2025.
Edited by:
Peter Potapov, World Resources Institute, United StatesReviewed by:
Rana Waqar Aslam, Wuhan University, ChinaIshrat Dollan, Stony Brook University, United States
Copyright © 2025 Aryal and Lakshmi. This is an open-access article distributed under the terms of the Creative Commons Attribution License (CC BY). The use, distribution or reproduction in other forums is permitted, provided the original author(s) and the copyright owner(s) are credited and that the original publication in this journal is cited, in accordance with accepted academic practice. No use, distribution or reproduction is permitted which does not comply with these terms.
*Correspondence: Aashutosh Aryal, cWVnNG5lQHZpcmdpbmlhLmVkdQ==