 Myungje Choi
 Alexei Lyapustin
 Yujie Wang
 Edward J. Hyer3
 Sergey Korkin
- 1Goddard Earth Sciences Technology and Research (GESTAR) II, University of Maryland Baltimore County, Baltimore, MD, United States
- 2Climate and Radiation Laboratory, NASA Goddard Space Flight Center, Greenbelt, MD, United States
- 3Marine Meteorology Division, US Naval Research Laboratory, Monterey, CA, United States
- 4Biospheric Sciences Laboratory, NASA Goddard Space Flight Center, Greenbelt, MD, United States
This study presents a comprehensive analysis of the monthly, seasonal, and interannual variability of smoke aerosol properties over North America from 2016 to 2024, using data retrieved from the MAIAC algorithm applied to NASA’s EPIC instrument aboard the DSCOVR spacecraft. The MAIAC EPIC data provide high-frequency, multi-year retrievals of key smoke properties, including aerosol optical depth (AOD), spectral absorption, aerosol layer height (ALH), and inferred black carbon (BC) and brown carbon (BrC) concentrations. The analysis reveals strong seasonal and regional variations, with peak smoke activity occurring in spring over Mexico and in summer over Canada and the western United States. Canadian and Alaskan smoke plumes frequently reach higher altitudes and exhibit elevated AOD, while smoke in Mexico tends to remain at lower altitudes with notably higher BC concentrations, likely influenced by smaller and lower-intensity fires and mixed biomass burning sources (agriculture and forest). The eastern United States, as a downwind region, shows increasing smoke influences, characterized by elevated ALH and rising levels of AOD and absorbing aerosols. Most study regions show a significant increase in smoke AOD (up to 5% per year in Canada), absorbing AOD, and BrC concentrations, highlighting the growing impact of wildfires on atmospheric composition and their potential implications for climate, air quality, and solar energy resources. These findings underscore the utility of MAIAC EPIC observations for monitoring multi-year smoke aerosol changes and for assessing their environmental consequences.
1 Introduction
Increasing frequency and intensity of wildfires, driven by accelerating climate change, have resulted in substantial emissions of smoke aerosols, significantly affecting atmospheric conditions worldwide, particularly over North America (Jones et al., 2024). Satellite measurements over recent decades have clearly indicated rising aerosol emissions from biomass burning and wildfires, as reflected in aerosol optical depth (AOD) records (e.g., Buchholz et al., 2022; Eck et al., 2023; Wang and Lyapustin, 2024). Surface PM2.5 concentrations declined between 2000 and 2016 due to reductions in anthropogenic aerosol emissions but increased again from 2016 to 2022 as wildfire activity intensified, especially in the western U.S. states (Wei et al., 2023; Burke et al., 2023). Burke et al. (2023) projected that this upward trend in PM2.5 levels will likely continue as rising temperatures and increasing aridity further impact forest ecosystems. Heavy smoke also contributes to reduced surface irradiance, thereby affecting the availability of solar energy resources (Corwin et al., 2025). These findings underscore the importance of establishing a long-term climatology of smoke properties, including their temporal variability, based on reliable measurements to more accurately assess the impacts of climate change.
While smoke aerosols exhibit complex and highly variable chemical composition, microphysical characteristics, and optical properties depending on the ecosystem type and ambient environmental conditions (Junghenn Noyes et al., 2022), analyses of changes in smoke aerosols and their impacts across various disciplines have largely relied on total aerosol loading (e.g., total AOD), without incorporating detailed information on the microphysical and optical properties of smoke particles.
Understanding the effects of smoke aerosols on the atmospheric radiative balance, air quality, and public health requires long-term, reliable satellite observations. Accurately inferring particle size, absorption, and composition demands advanced satellite measurement techniques and specialized retrieval algorithms. A few studies have utilized such advanced observations to derive detailed aerosol optical and microphysical properties for characterizing smoke. For example, Junghenn Noyes et al. (2022) analyzed smoke aerosol properties retrieved from the Multi-angle Imaging SpectroRadiometer (MISR), including particle size, absorption, and plume height, and reported statistically significant differences in smoke characteristics between fires in forests and those in savannas and grasslands. Li et al. (2022) provided a global climatology (2005–2013) of inferred aerosol composition, including black carbon and brown carbon, from the POLarization and Directionality of the Earth’s Reflectances (POLDER) measurements processed with the Generalized Retrieval of Aerosol and Surface Properties (GRASP)-component algorithm (Dubovik et al., 2014; Li et al., 2019). Long-term trends in aerosol absorption properties derived from ultraviolet (UV) satellite measurements, such as the UV aerosol index or single scattering albedo, reflect shifts in aerosol composition. For example, Hammer et al. (2018) identified positive trends in the UV aerosol index over boreal forests in North America, which they attributed to increasing total organic aerosol and brown carbon.
The Multi-Angle Implementation of Atmospheric Correction (MAIAC) is an operational time series analysis approach designed to separate the relatively stable contributions of surface properties from the more rapidly varying atmospheric components, such as aerosols and clouds. The standard MAIAC products, originally developed for MODIS, include a detailed cloud mask, aerosol properties such as AOD over land and ocean, and fine-mode fraction over oceans, plume injection height, column water vapor, and surface characteristics such as bidirectional reflectance factor (BRF), scaled Ross-thick Li-sparse (Lyapustin et al., 2025) bidirectional reflectance distribution function (BRDF), snow fraction, and grain size (Lyapustin et al., 2011a; b, 2012; 2018). MAIAC has since been extended to support VIIRS data (Lyapustin et al., 2023).
NASA’s Earth Polychromatic Imaging Camera (EPIC), aboard NOAA’s Deep Space Climate Observatory (DSCOVR) spacecraft, has been operating since 2015, capturing the entire sunlit hemisphere of Earth using ten narrowband spectral channels ranging from UV to near-infrared, including oxygen absorption bands (Marshak et al., 2018). The MAIAC algorithm has been adapted for EPIC data to perform atmospheric correction (Lyapustin et al., 2021b) and includes newly added capabilities for retrieving aerosol properties from smoke and dust events (Lyapustin et al., 2021a). In addition, major light-absorbing components have been inferred: black and brown carbon for smoke (Choi et al., 2024), and hematite and goethite for dust (Go et al., 2022). For smoke aerosols, the retrieved optical properties and aerosol layer height have been evaluated against measurements from the Aerosol Robotic Network (AERONET) sun photometers and the Cloud-Aerosol Lidar with Orthogonal Polarization (CALIOP), respectively, showing good agreement with root mean square errors (RMSE) of 0.2 for AOD at 443 nm, 0.04 for single scattering albedo (SSA) at 443 nm, 0.02 for SSA at 680 nm, and 1.3 km for ALH over North America (Choi et al., 2024).
Nearly a decade of EPIC measurements, processed with the MAIAC algorithm, enables the characterization of global smoke properties across multiple time scales, with frequent temporal sampling (every 1–2 h during the daytime) comparable to that of geostationary satellites. This high-frequency sampling, provided by geostationary platforms or EPIC/DSCOVR, facilitates the detection of highly variable diurnal aerosol changes, resulting in improved daily representations with fewer spatiotemporal gaps (Choi et al., 2019; Torres and Ahn, 2024). In this study, we integrated MAIAC EPIC smoke properties, including AOD, spectral absorption, aerosol layer height, and estimated black and brown carbon, over North America for the period from 2016 to 2024. We then analyzed the geographical characteristics of smoke properties across seasons, as well as monthly and interannual variability, and statistically assessed temporal changes over the study period across several study regions.
The remainder of this paper is organized as follows. Section 2 outlines the MAIAC EPIC smoke property retrievals, the ancillary datasets used, and the defined study regions across North America. Section 3 presents the analysis of smoke properties across multiple time scales, including their spatial distribution and seasonal, monthly, and interannual variability, along with an assessment of their short-term changes. Section 4 examines the sampling characteristics of the MAIAC EPIC smoke retrievals. Section 5 concludes the paper with a summary of key findings and final remarks.
2 Data and methods
2.1 MAIAC EPIC smoke properties
NASA’s Earth Polychromatic Imaging Camera (EPIC), aboard NOAA’s Deep Space Climate Observatory (DSCOVR), has been providing unique observations since 2015 from its position at the first Lagrange Point (L1), approximately 1.5 million kilometers from Earth (Marshak et al., 2018). EPIC captures images of the entire sunlit hemisphere of Earth every 1–2 h, acquiring approximately 10–12 observations per day during the boreal summer and 6–7 observations in winter. It is equipped with ten narrowband spectral channels, with center wavelengths ranging from 317.5 to 779.5 nm, and provides a spatial resolution of approximately 8–16 km at nadir, which degrades toward the edges of the image.
MAIAC EPIC products are processed on a rotational sinusoidal grid at a 10 km spatial resolution, oversampling the original measured pixels (Lyapustin et al., 2021b). In addition to the standard atmospheric correction and AOD retrieval (Lyapustin et al., 2018; 2021b), a dedicated retrieval process for absorbing smoke or dust aerosols is applied to both land and ocean pixels (Lyapustin et al., 2021a). This process provides AOD at 443 nm, spectral absorption parameterized as the imaginary refractive index at 680 nm (k0) and the spectral absorption exponent (SAE), as well as aerosol layer height (ALH). The spectral imaginary refractive index (
Notably, absorbing aerosols are identified using two main criteria: (1) a UV Aerosol Index greater than 4.5–5.5, and (2) the spectral shape of AOD from UV to blue wavelengths. The EPIC MAIAC algorithm restricts dust retrievals to known dust source regions, as described in Lyapustin et al. (2018), while the smoke aerosol model is applied globally in all other areas. In regions near dust sources where both smoke and dust may coexist, the algorithm performs retrievals using both aerosol models and assigns the aerosol type associated with the lower cost function. A detailed description of this process is provided in Lyapustin et al. (2021a).
For the climatological analysis of the retrieved smoke properties, individual measurements were re-sampled onto 0.5° × 0.5° latitude–longitude grids using an equidistant cylindrical projection and aggregated using area-weighted averaging. Only grids meeting the following conditions were included: at least 20% EPIC smoke retrieval coverage, EPIC standard model AOD > 0.2, and solar or view zenith angles less than 60°. To generate daily averages, additional filtering was applied to exclude grids potentially affected by residual clouds or high-uncertainty retrievals, based on MAIAC MODIS cloud detection or MODIS AOD < 0.2. The MAIAC MODIS products used for this additional filtering have a higher spatial resolution (1 km) and utilize thermal infrared bands, enabling improved cloud screening and more accurate AOD estimates (Lyapustin et al., 2018). It should be noted that the standard model AOD is retrieved using a blue-band-only inversion, in contrast to the multi-channel inversion used for smoke retrievals. In the standard model AOD retrieval, a regionally fixed aerosol model is applied for both atmospheric correction and AOD estimation, which is the standard procedure in MAIAC processing (Lyapustin et al., 2018; Lyapustin et al., 2021b). Monthly and seasonal averages were calculated based on the daily mean data.
2.2 Other ancillary datasets
For a comprehensive interpretation of the study areas in terms of surface and fire conditions, MAIAC EPIC Normalized Difference Vegetation Index (NDVI), VIIRS/NPP fire detection, and maximum fire radiative power (MaxFRP) data were integrated for the period from 2015 to 2024, as shown in Figure 1. The MAIAC EPIC product suite provides various surface properties, including the bidirectional reflectance factor, Lambertian surface reflectance, bidirectional reflectance distribution function, and NDVI, as outputs of its atmospheric correction process (Lyapustin et al., 2021b). Fire detection and MaxFRP retrievals were specifically obtained from the VIIRS/NPP Thermal Anomalies and Fire Daily L3 Global 1 km SIN Grid V002 (VNP14A1.002) dataset (Giglio, 2003).
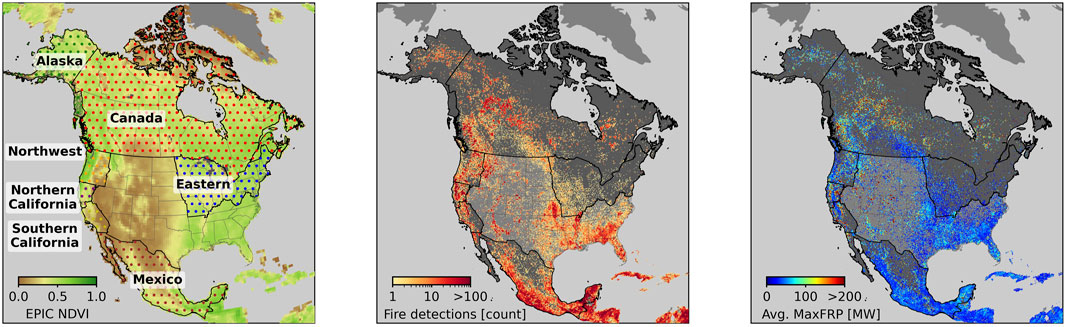
Figure 1. Geographical coverage of the study regions across North America, showing MAIAC EPIC Normalized Difference Vegetation Index (NDVI) (left panel), VIIRS/SNPP fire detection (center panel), and the average maximum fire radiative power (right panel) from 2015 to 2024.
2.3 Study regions and periods
North America, comprising the U.S., Canada, and Mexico, was selected as the study domain. To examine regional variations in smoke properties, Canada, Mexico, and five regions within the U.S. were defined for detailed analysis, as shown in Figure 1. The regions of Alaska, the Northwest, Northern California, Southern California, and the Eastern region were delineated based on the National Geographic Area Coordination Center framework, which is utilized by the Wildland Fire Data Management Program under the National Interagency Fire Center. The first four U.S. regions encompass major wildfire sources, while the Eastern subregion primarily represents a downwind area influenced by long-range smoke transport.
The mean NDVI for boreal forest regions (Canada, Alaska, the Northwest, and Northern California) ranges from 0.4 to 0.6, while Southern California (0.22) and Mexico (0.35) exhibit lower vegetation cover. The dominant land cover type in wildfire-prone areas of Alaska and Canada is boreal forest, which includes both deciduous and coniferous forests. Wildfires in these boreal forest regions typically show higher maximum fire radiative power (MaxFRP): for example, Canada (73 MW), Alaska (72 MW), and Northern California (72 MW), compared to lower values observed in Mexico (40 MW) and the Eastern U.S. region (42 MW).
We defined the major smoke months for analysis by considering both the known regional burning seasons and statistics from EPIC smoke retrievals, as follows: May–September for Alaska; January–August for Mexico; April–August for the Eastern region; and April–October for the other regions. The analysis period encompasses 8 years of continuous EPIC measurements from 2016 to 2024, excluding 2019, which is significantly incomplete due to an 8-month data outage from June 2019 to February 2020.
3 Results
3.1 Geographical distribution of smoke properties
Smoke aerosols over North America are most prevalent from boreal spring through fall (Figure 2). In particular, a high number of smoke retrievals, ranging from approximately 200 to over 300 days per season across the 8-year study period, were observed over Mexico during spring. This period coincides with the region’s hot and dry season, during which both natural wildfires and agricultural burning occur annually. The typical smoke characteristics in this region are moderate AOD (at 443 nm unless otherwise specified) around 0.5–0.6, weak spectral absorption, and low ALH near the surface. During summer, the overall smoke properties remained similar, although the number of smoke retrievals decreased.
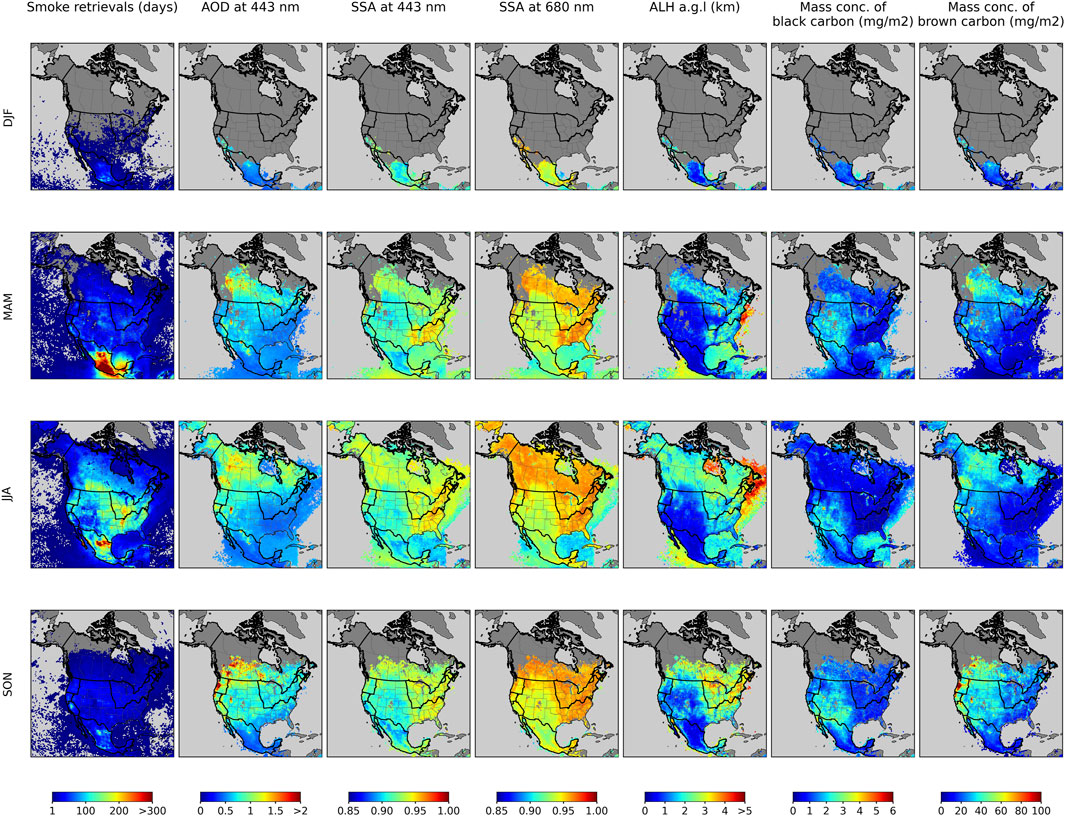
Figure 2. Geographical distribution of seasonal MAIAC EPIC smoke properties, including the number of smoke retrievals, aerosol optical depth at 443 nm (AOD443), single scattering albedo (SSA) at 443 nm and 680 nm, aerosol layer height above ground level (ALH a. g. l.), and mass concentration of black carbon and brown carbon.
Based on the number of detected wildfires and smoke retrievals, smoke events occurred less frequently in Canada, Northwest, and Northern California regions. However, these events exhibit broader spatial coverage. They are also associated with higher mean smoke AOD values exceeding 1 and elevated smoke plumes, with ALH greater than 3 km above ground level. Severe wildfires in these regions, including those in Alaska, often release sufficient thermal energy to inject smoke into the free troposphere. These high-altitude plumes are frequently transported eastward by the jet stream to downwind regions (e.g., Ceamanos et al., 2023). Peat burning, another significant source in Alaska and northern Canada, can result in low-altitude smoke containing very weakly absorbing aerosols (Turquety et al., 2007; Eck et al., 2009), but it was not prominent in the climatological ALH analysis. The number of smoke retrievals increased from spring to summer, the peak burning season, and decreased again in the fall, although AOD values remained high, consistently exceeding 1. In fall, less frequent but still highly intense wildfires and the associated transported smoke plumes contribute to these climatological characteristics.
The Eastern region, where wildfire sources are relatively scarce, is strongly affected by smoke transported from the western U.S. and Canada. This results in elevated ALH values, often exceeding 3 km, and relatively high smoke-related statistics in these downwind regions. As smoke plumes are transported over long distances, they tend to become more dispersed, leading to lower AOD values but impacting a wider spatial area. These multi-year regional smoke patterns are generally consistent with the analysis in Choi et al. (2024), which examined both individual smoke events and seasonally integrated properties during 2018.
Note that the observed discontinuity in retrieved properties between land and ocean can arise from both real and artificial factors. One contributing factor is the significantly lower number of retrievals over water, due to frequent cloud cover and generally low AOD conditions, which can lead to differences in monthly or seasonal averages. Additionally, differences in retrieval algorithms between land and ocean may introduce artificial discontinuities. For example, the ocean retrieval algorithm uses different spectral weights in the cost function compared to the land algorithm, which affects the outcome of the iterative multi-variable inversion. Furthermore, the typically low AOD over ocean grids may not provide sufficient information to accurately and simultaneously retrieve all variables. Addressing the land–ocean discontinuity in retrieval products remains a continuing challenge and focus of ongoing development.
3.2 Monthly variability
This section presents the monthly climatology of smoke properties over selected regions, as shown in Figure 3. We computed monthly means by averaging the multi-year data for each calendar month; the corresponding standard deviations are also presented. Over Canada, the sample size is relatively low during spring, which may limit the climatological representativeness for that season. As the number of observations increases, indicating more frequent wildfires and greater emissions of smoke aerosols, smoke AOD increases by approximately 0.1–0.2 from spring to summer and fall. SSA shows a slight increase from ∼0.92 to 0.93–0.94, while ALH rises substantially from about 1 km to 3 km. Inferred BC mass concentrations show a relative decrease, whereas BrC concentrations do not show a significant reduction. In Alaska, smoke properties are quite similar to those in Canada from March to August due to geographic proximity and similar fire regimes, although the AOD peaks in July.
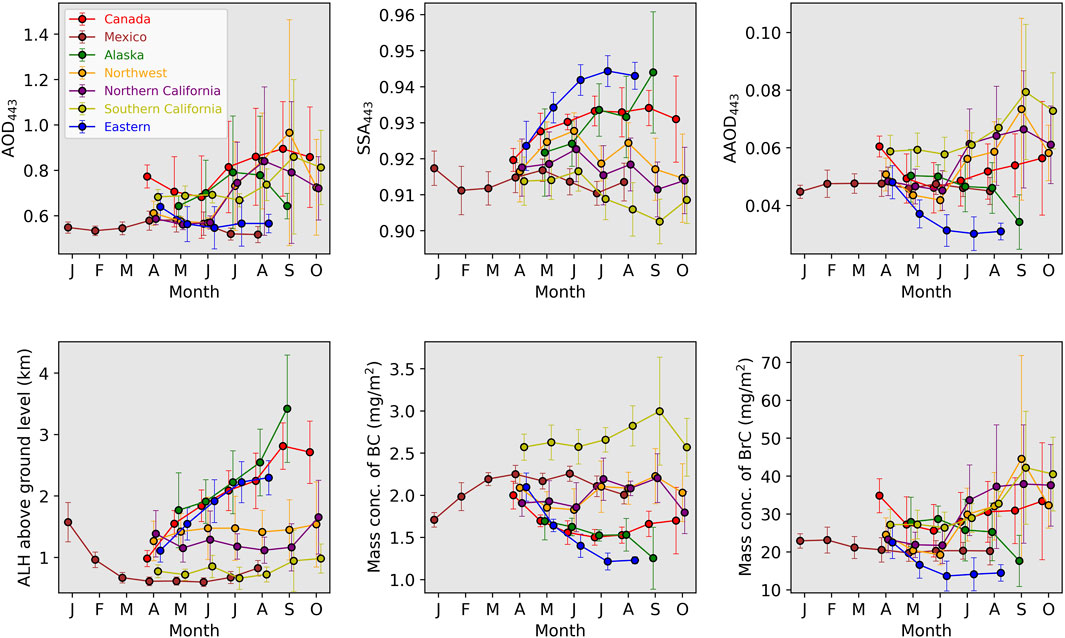
Figure 3. Multi-year averages of monthly variations in MAIAC EPIC smoke aerosol optical depth at 443 nm (AOD443), single scattering albedo at 443 nm (SSA443), absorbing AOD at 443 nm (AAOD443), aerosol layer height (ALH) above ground level, and black carbon (BC) and brown carbon (BrC) mass concentrations. Circles indicate the means of the multi-year monthly values, and whiskers represent the corresponding spatial standard deviations. Note that each region is slightly time-shifted to allow clearer visual discrimination.
The Northwest (including Oregon and Washington states) and Northern California regions that have experienced frequent and severe wildfires, exhibit monthly AOD variation similar to that in Canada, though with slightly lower overall values. SSA remains nearly constant at 0.91–0.92, resulting in higher and increasing absorbing AOD (AAOD; defined as AOD × (1−SSA)) from June to September. Although ALH increases from spring to summer and fall, its average remains relatively low (approximately 1.2 km). Several extremely elevated smoke plumes occurred (e.g., September 2020, as analyzed in Eck et al., 2023), which increased the variability in ALH and were also detected by EPIC (not shown). However, the generally low mean ALH suggests less frequent long-range transport or lower wildfire energy compared to Canada. BC concentrations stay around 2 mg/m2, while BrC concentration increases significantly, ranging from 20 to 40 mg/m2. During the major burning months, smoke aerosols in Southern California show more absorption (SSA∼0.91), resulting in the highest AAOD and BC concentration among the regions. BrC concentration is quite similar to that in the Northwest and Northern California, and ALH is quite low close to 1 km.
The Eastern region, which primarily represents downwind areas, also exhibits a similar increase in AOD from June to August. However, smoke AOD levels are consistently lower, and the aerosols are less absorbing (i.e., exhibit higher SSA) compared to those in Canada, Alaska, and Northwest and Northern California. ALH increases from approximately 1 km to ∼2.2 km from spring to summer. The combination of low AOD and high SSA in summer leads to very low BC and BrC concentrations.
For Mexico, smoke AOD slightly increases from February to April and then decreases through August. It remains relatively lower compared to other regions, which primarily experience smoke from forest wildfires. SSA closely follows the variations in AOD, leading to a relatively stable AAOD throughout the analysis period. ALH also stays consistently low, approximately at 0.5 km. Interestingly, despite the low AOD (less than 0.6), this region exhibits relatively high BC mass concentrations (∼2.3 mg/m2), potentially influenced by background urban pollution but more likely due to a greater proportion of flaming-phase combustion of agricultural fuels with less woody material. Conversely, BrC levels are consistently low, averaging around 20 mg/m2.
3.3 Interannual variability
This section examines the interannual variability of smoke properties across the selected regions (Figure 4) and provides a summary of the corresponding linear trends in Table 1. Consistent increases in smoke AOD are observed across all study regions. Notably, Canada exhibits the largest increase in smoke AOD in both absolute and relative terms, with the highest peak recorded in 2023 and the second highest in 2024. Since 2020, SSA has shown a slight decrease with increasing AOD, ranging from 0.935 to 0.925, although it does not show a clear systematic change over this period. This contributes to the highest increasing trends in AAOD (4% per year) and BrC mass concentration (6% per year). These severe wildfire events and the associated high AOD in recent years are corroborated by independent observations (Jain et al., 2024; Jones et al., 2024; Chen et al., 2025; Ehret et al., 2024).
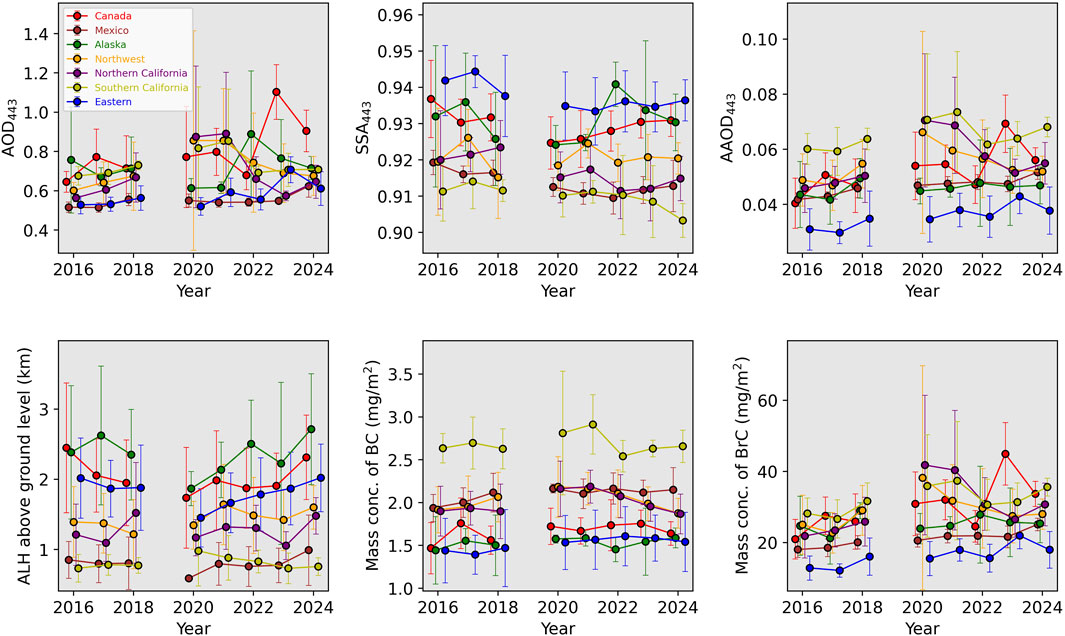
Figure 4. Interannual variations in MAIAC EPIC smoke aerosol optical depth at 443 nm (AOD443), single scattering albedo at 443 nm (SSA443), absorbing AOD at 443 nm (AAOD443), aerosol layer height (ALH) above ground level, and black carbon (BC) and brown carbon (BrC) mass concentrations. Each region is slightly time-shifted to allow for clearer visual discrimination.
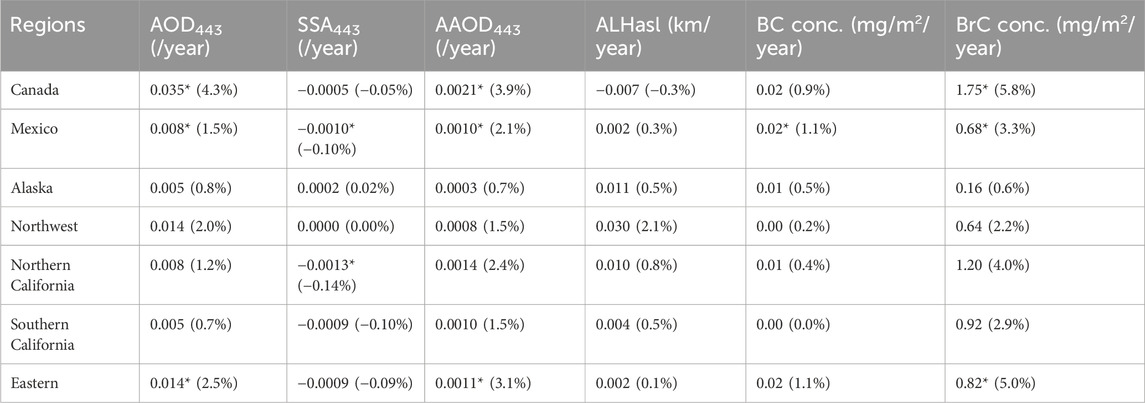
Table 1. Estimated linear changes in smoke properties from 2016 to 2024, calculated from monthly mean values. Statistically significant changes (p < 0.05) are marked with an asterisk (*), and percentage rates are given in parentheses.
Although overall AOD in the Eastern region is relatively low, changes in aerosol properties closely resemble those observed in Canada, with increasing AOD (3% per year), AAOD (3% per year), and BrC (5% per year). The peak year of AOD (2023) also coincides with that of Canada. These interannual variability suggest that smoke properties in the Eastern region are strongly influenced by long-range transport originating from Canada.
In Alaska, AOD peaked in 2022 alongside an increase in SSA (∼0.94); however, no clear systematic changes were found in any of the properties. Among the western U.S. regions, the Northwest exhibits the largest AOD increase (2% per year). BrC concentrations in these regions increase at rates of approximately 2%–4% per year, while BC concentrations remain nearly unchanged.
In Mexico, the interannual variability of smoke properties is relatively lower than in other regions, but there are consistent increases in AOD (2% per year), BC (1% per year), and BrC (3% per year). Although the observed changes in Mexico are smaller in magnitude, they are statistically significant due to the higher data volume and lower variability, whereas changes in certain regions are not statistically significant because of greater interannual fluctuations and fewer data points.
Across all regions, ALH shows some degree of interannual variability but does not exhibit any clear systematic change. Additionally, changes in BrC are more pronounced than those of BC, due to the higher relative abundance of BrC and its stronger association with AOD.
It should be noted that the current data record spans only 9 years, which is relatively short for estimating robust changes in variables that are strongly influenced by both meteorological variability and interannual fluctuations in fire frequency. Consequently, both the calculated rates of change and their statistical significance should be interpreted with caution, as they may change substantially when longer-term observations become available. Additionally, this smoke dataset contains missing values under low AOD conditions, which may affect the completeness and accuracy of the analysis.
Long-term changes or climatology of smoke optical and microphysical properties have been studied over specific regions using data from selected AERONET sites (e.g., Sayer et al., 2014; Eck et al., 2003; Eck et al., 2013; Eck et al., 2023). However, only a few satellite retrievals are suitable for analyzing long-term changes due to limitations in accuracy, coverage, or data availability. For example, the recent GRASP/POLDER processing has produced a global climatology of aerosol composition, including black carbon (BC) and brown carbon (BrC), but the available period is limited to 2005–2013 (Li et al., 2022). MISR-based smoke property retrievals, including composition-specific AOD (BC and BrC), particle size, and plume height, also offer valuable climatological insights by aggregating individual detected smoke plumes (Junghenn Noyes et al., 2022), though their spatiotemporal coverage is limited due to MISR’s narrow swath, as discussed in Choi et al. (2019). EPIC has its own limitations, including relatively coarse spatial resolution (10–20 km), lack of infrared bands, and a single viewing angle, which prevents retrieval of particle size information. Nevertheless, its unique global coverage and high temporal resolution make it possible to generate a climatology with relatively sufficient sampling, which is crucial for producing temporally integrated properties (e.g., daily, monthly, and annual averages) with reliable representativeness.
4 Discussions
Smoke retrieval in the MAIAC EPIC algorithm at the pixel level (10 × 10 km2) is performed when absorbing aerosols are detected and the standard model AOD at 443 nm exceeds 0.4. As mentioned in Section 2.1, the two processes, 1 standard model AOD retrieval and 2 smoke retrievals (AOD, spectral absorption, and layer height) differ in terms of inversion bands, assumed aerosol models, and retrieval conditions. This results in differences in the spatial and temporal coverage of smoke property retrievals compared to standard AOD retrievals. Since the sampling of smoke properties is biased toward moderate-to-high AOD conditions, statistical differences may arise when comparing or analyzing these datasets with other measurements or modeling results. Retrieving detailed smoke properties under low-AOD conditions is particularly challenging from intensity-only satellite remote sensing due to higher uncertainties in aerosol signals. While some retrieval approaches use a priori information when signal degrees of freedom are insufficient, the EPIC MAIAC smoke/dust retrieval processing explicitly excludes such conditions and performs no retrievals.
To indirectly quantify the impact of this skewed sampling, we quantified the sampling differences between smoke property retrievals and standard AOD retrievals over North America from 2016 to 2024 (Figure 5). It should be noted that this comparison does not include any additional filtering used to generate the daily regridded properties described in Section 2.1, but rather represents a direct comparison of the retrieved AOD values. And grids with EPIC standard or smoke model AOD ≥ 5.99, which are either near the maximum AOD (6) or beyond the range of the retrieval lookup table, are excluded to minimize potential contamination from residual clouds.
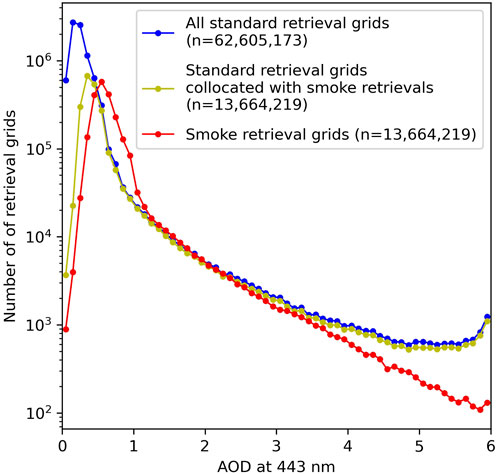
Figure 5. Frequency distribution of retrieval grids over North America (2016–2024), categorized into all standard aerosols (blue), standard aerosols collocated with smoke aerosols (yellow), and smoke aerosols (red), plotted as a function of aerosol optical depth (AOD) at 443 nm.
Overall, the number of smoke property retrieval grids (red line) corresponds to approximately 22% of all standard AOD retrievals (blue line), with most of the discrepancy originating from very low AOD conditions (e.g., AOD < 0.4). The mean value of standard AOD collocated with smoke property retrievals is 0.53 (yellow line), which is more than twice as high as the mean value of all standard AOD retrievals (0.29). For these same grids, the mean smoke AOD is 0.69. The difference between the smoke AOD (0.69) and the corresponding standard AOD (0.55) results from differences in the assumed aerosol microphysical properties and spectral inversion bands (blue band only for standard AOD versus multi-band, multi-parameter retrievals for smoke). These differences in the number of retrievals and AOD values are likely to vary by region and season. Therefore, this analysis provides important context for interpreting the climatology derived from the MAIAC EPIC smoke property datasets.
5 Summary and conclusion
This study examined the multi-year climatology of retrieved smoke properties over North America using EPIC measurements from 2016 to 2024. The retrievals were spatially aggregated into 0.5° × 0.5° cells on an equal-angle grid and temporally integrated, first into daily datasets and then further into monthly, seasonal, and annual averages. The subsequent analysis focused on the seasonal geophysical distribution, monthly and annual variability, and short-term changes over the study period.
Strong seasonal patterns in smoke AOD were observed, with peaks occurring from July to September in the forested regions of the western U.S. and Canada, in October in the Eastern region, and a more stable pattern with a peak in April in Mexico. Elevated SSA at 443 nm during peak smoke AOD seasons characterized Canada and Alaska, where intense forest fires produce dense smoke, as well as the Eastern region, which is located downwind of Canadian fires. In contrast, Mexico and Southern California exhibited relatively lower SSA values, around 0.91, with limited variability. Other regions showed only minor monthly variations in SSA. ALH generally increased from spring to summer and fall across most fire-prone and downwind regions, suggesting enhanced aerosol injection into the free troposphere during high-AOD periods. BC concentrations were generally inversely related to SSA, with persistently high levels in Southern California and Mexico. Monthly variations in BrC concentrations closely followed changes in total AOD across most regions.
All study regions exhibited positive changes in AOD, with recent peak years and some regional variability. Statistically significant increases were found in Canada, the Eastern U.S., and Mexico. In contrast, SSA remained largely stable or showed a slight decrease, up to −0.14% per year, indicating a shift toward more absorbing aerosols and contributing to an overall increase in AAOD. No significant changes were observed in ALH and BC concentrations. However, BrC concentrations showed statistically significant increases in Canada, Mexico, and the Eastern region, with rates reaching up to approximately 6% per year.
Analyzing changes in MAIAC EPIC smoke properties has been challenging due to the product’s sampling bias toward absorbing aerosols and moderate-to-high AOD conditions. This limitation, which is not unique to this product, is common among most satellite-based aerosol measurements, particularly when aerosol signals are too weak to be reliably detected. As a result, the estimated changes could differ if low-AOD conditions were included, which cannot be accurately measured by satellites. Therefore, spatiotemporal sampling characteristics must be carefully considered when comparing smoke property retrievals with outputs from global or regional aerosol models.
This study estimated only linear changes in smoke properties. However, more complex variability and potential relationships with climate phenomena, such as the El Niño–Southern Oscillation (ENSO), surface drought, or vegetation changes, remain topic for future research. As EPIC continues to operate under normal conditions without significant degradation, it should support ongoing monitoring of global smoke aerosols in the coming years. Future studies should also include intercomparisons of these estimated changes with results from other satellite retrievals to enhance understanding and validation.
Data availability statement
The MAIAC EPIC datasets are freely available from NASA Earth data Atmospheric Science Data Cener (https://asdc.larc.nasa.gov/project/DSCOVR/DSCOVR_EPIC_L2_MAIAC_02). The VIIRS fire detection datasets are freely available from NASA Earthdata (https://cmr.earthdata.nasa.gov/search/concepts/C2545314541-LPCLOUD.html). The gridded datasets can be requested directly from the corresponding author (myungje.choi@nasa.gov).
Author contributions
MC: Conceptualization, Data curation, Formal analysis, Investigation, Visualization, Writing – original draft, Writing – review and editing. AL: Funding acquisition, Resources, Software, Investigation, Writing – review and editing. YW: Resources, Software, Writing – review & editing. EH: Investigation, Writing – review and editing. TE: Investigation, Writing – review and editing. SK: Resources, Software, Writing – review and editing.
Funding
The author(s) declare that financial support was received for the research and/or publication of this article. The work of Myungje Choi, Alexei Lyapustin, Yujie Wang, and Sergey Korkin was funded by the NASA DSCOVR program (grant no. 21-DSCOVR-21-0004; manager Rechard Eckman and Emma Knowland) and in part by the NASA PACE program (grant no. 19-PACESAT19-0039). And the work of Myungje Choi and Yujie Wang was partially funded by the Office of Naval Research (grant no. N000142512302). Edward Hyer's participation was supported by the Office of Naval Research Code 32.
Acknowledgments
The authors are grateful to the NASA Center for Climate Simulations providing resources for the EPIC data processing.
Conflict of interest
The authors declare that the research was conducted in the absence of any commercial or financial relationships that could be construed as a potential conflict of interest.
The author(s) declared that they were an editorial board member of Frontiers, at the time of submission. This had no impact on the peer review process and the final decision.
Generative AI statement
The author(s) declare that no Generative AI was used in the creation of this manuscript.
Any alternative text (alt text) provided alongside figures in this article has been generated by Frontiers with the support of artificial intelligence and reasonable efforts have been made to ensure accuracy, including review by the authors wherever possible. If you identify any issues, please contact us.
Publisher’s note
All claims expressed in this article are solely those of the authors and do not necessarily represent those of their affiliated organizations, or those of the publisher, the editors and the reviewers. Any product that may be evaluated in this article, or claim that may be made by its manufacturer, is not guaranteed or endorsed by the publisher.
Supplementary material
The Supplementary Material for this article can be found online at: https://www.frontiersin.org/articles/10.3389/frsen.2025.1654779/full#supplementary-material
References
Buchholz, R. R., Park, M., Worden, H. M., Tang, W., Edwards, D. P., Gaubert, B., et al. (2022). New seasonal pattern of pollution emerges from changing North American wildfires. Nat. Commun. 13 (1), 2043. doi:10.1038/s41467-022-29623-8
Burke, M., Childs, M. L., de la Cuesta, B., Qiu, M., Li, J., Gould, C. F., et al. (2023). The contribution of wildfire to PM2.5 trends in the USA. Nature 622 (7984), 761–766. doi:10.1038/s41586-023-06522-6
Ceamanos, X., Coopman, Q., George, M., Riedi, J., Parrington, M., and Clerbaux, C. (2023). Remote sensing and model analysis of biomass burning smoke transported across the Atlantic during the 2020 Western US wildfire season. Sci. Rep. 13 (1), 16014. doi:10.1038/s41598-023-39312-1
Chen, H., Zhang, W., and Sheng, L. (2025). Canadian record-breaking wildfires in 2023 and their impact on US air quality. Atmos. Environ. 342, 120941. doi:10.1016/j.atmosenv.2024.120941
Choi, M., Lim, H., Kim, J., Lee, S., Eck, T. F., Holben, B. N., et al. (2019). Validation, comparison, and integration of GOCI, AHI, MODIS, MISR, and VIIRS aerosol optical depth over East Asia during the 2016 KORUS-AQ campaign. Atmos. Meas. Tech. 12 (8), 4619–4641. doi:10.5194/amt-12-4619-2019
Choi, M., Lyapustin, A., Schuster, G. L., Go, S., Wang, Y., Korkin, S., et al. (2024). Light-absorbing black carbon and brown carbon components of smoke aerosol from DSCOVR EPIC measurements over North America and central Africa. Atmos. Chem. Phys. 24 (18), 10543–10565. doi:10.5194/acp-24-10543-2024
Corwin, K. A., Burkhardt, J., Corr, C. A., Stackhouse, P. W., Munshi, A., and Fischer, E. V. (2025). Solar energy resource availability under extreme and historical wildfire smoke conditions. Nat. Commun. 16 (1), 245. doi:10.1038/s41467-024-54163-8
Dubovik, O., Lapyonok, T., Litvinov, P., Herman, M., Fuertes, D., Ducos, F., et al. (2014). GRASP: a versatile algorithm for characterizing the atmosphere. SPIE Newsroom. doi:10.1117/2.1201408.005558
Eck, T. F., Holben, B. N., Ward, D. E., Mukelabai, M. M., Dubovik, O., Smirnov, A., et al. (2003). Variability of biomass burning aerosol optical characteristics in southern Africa during the SAFARI 2000 dry season campaign and a comparison of single scattering albedo estimates from radiometric measurements. J. Geophys. Res. Atmos. 108 (13). doi:10.1029/2002jd002321
Eck, T. F., Holben, B. N., Reid, J. S., Sinyuk, A., Hyer, E. J., O’Neill, N. T., et al. (2009). Optical properties of boreal region biomass burning aerosols in central Alaska and seasonal variation of aerosol optical depth at an Arctic coastal site. J. Geophys. Res. Atmos. 114 (D11). doi:10.1029/2008JD010870
Eck, T. F., Holben, B. N., Reid, J. S., Mukelabai, M. M., Piketh, S. J., Torres, O., et al. (2013). A seasonal trend of single scattering albedo in southern African biomass-burning particles: implications for satellite products and estimates of emissions for the world’s largest biomass-burning source. J. Geophys. Res. Atmos. 118 (12), 6414–6432. doi:10.1002/jgrd.50500
Eck, T. F., Holben, B. N., Reid, J. S., Sinyuk, A., Giles, D. M., Arola, A., et al. (2023). The extreme forest fires in California/Oregon in 2020: aerosol optical and physical properties and comparisons of aged versus fresh smoke. Atmos. Environ. 305, 119798. doi:10.1016/j.atmosenv.2023.119798
Ehret, A., Turquety, S., George, M., Hadji-Lazaro, J., and Clerbaux, C. (2024). Increase in Carbon Monoxide (CO) and Aerosol Optical Depth (AOD) observed by satellite in the northern hemisphere over the summers of 2008–2023, linked to an increase in wildfires. doi:10.5194/egusphere-2024-3128
Giglio, L. (2023). VIIRS/NPP thermal Anomalies and fire daily L3 global 1km SIN grid V002. NASA EOSDIS Land Process. Distrib. Act. Arch. Cent. doi:10.5067/VIIRS/VNP14A1.002
Go, S., Lyapustin, A., Schuster, G. L., Choi, M., Ginoux, P., Chin, M., et al. (2022). Inferring iron-oxide species content in atmospheric mineral dust from DSCOVR EPIC observations. Atmos. Chem. Phys. 22 (2), 1395–1423. doi:10.5194/acp-22-1395-2022
Hammer, M. S., Martin, R. V., Li, C., Torres, O., Manning, M., and Boys, B. L. (2018). Insight into global trends in aerosol composition from 2005 to 2015 inferred from the OMI Ultraviolet Aerosol Index. Atmos. Chem. Phys. 18, 8097–8112. doi:10.5194/acp-18-8097-2018
Jain, P., Barber, Q. E., Taylor, S. W., Whitman, E., Castellanos Acuna, D., Boulanger, Y., et al. (2024). Drivers and impacts of the record-breaking 2023 wildfire season in Canada. Nat. Commun. 15 (1), 6764. doi:10.1038/s41467-024-51154-7
Jones, M. W., Kelley, D. I., Burton, C. A., di Giuseppe, F., Barbosa, M. L. F., Brambleby, E., et al. (2024). State of wildfires 2023–2024. Earth Syst. Sci. Data 16 (8), 3601–3685. doi:10.5194/essd-16-3601-2024
Junghenn Noyes, K. T., Kahn, R. A., Limbacher, J. A., and Li, Z. (2022). Canadian and Alaskan wildfire smoke particle properties, their evolution, and controlling factors, from satellite observations. Atmos. Chem. Phys. 22 (15), 10267–10290. doi:10.5194/acp-22-10267-2022
Li, L., Dubovik, O., Derimian, Y., Schuster, G. L., Lapyonok, T., Litvinov, P., et al. (2019). Retrieval of aerosol components directly from satellite and ground-based measurements. Atmos. Chem. Phys. 19 (21), 13409–13443. doi:10.5194/acp-19-13409-2019
Li, L., Derimian, Y., Chen, C., Zhang, X., Che, H., Schuster, G. L., et al. (2022). Climatology of aerosol component concentrations derived from multi-angular polarimetric POLDER-3 observations using GRASP algorithm. Earth Syst. Sci. Data 14 (7), 3439–3469. doi:10.5194/essd-14-3439-2022
Lyapustin, A., Martonchik, J., Wang, Y., Laszlo, I., and Korkin, S. (2011a). Multiangle implementation of atmospheric correction (MAIAC): 1. Radiative transfer basis and look-up tables. J. Geophys. Res. 116 (D3), D03210. doi:10.1029/2010JD014985
Lyapustin, A., Wang, Y., Laszlo, I., Kahn, R., Korkin, S., Remer, L., et al. (2011b). Multiangle implementation of atmospheric correction (MAIAC): 2. Aerosol algorithm. J. Geophys. Res. Atmos. 116 (3), D03211–D03215. doi:10.1029/2010JD014986
Lyapustin, A. I., Wang, Y., Laszlo, I., Hilker, T. G., Hall, F., Sellers, P. J., et al. (2012). Multi-angle implementation of atmospheric correction for MODIS (MAIAC): 3. Atmospheric correction. Remote Sens. Environ. 127, 385–393. doi:10.1016/j.rse.2012.09.002
Lyapustin, A., Wang, Y., Korkin, S., and Huang, D. (2018). MODIS Collection 6 MAIAC algorithm. Atmos. Meas. Tech. 11 (10), 5741–5765. doi:10.5194/amt-11-5741-2018
Lyapustin, A., Go, S., Korkin, S., Wang, Y., Torres, O., Jethva, H., et al. (2021a). Retrievals of aerosol optical depth and spectral absorption from DSCOVR EPIC. Front. Remote Sens. 2 (March), 645794–14. doi:10.3389/frsen.2021.645794
Lyapustin, A., Wang, Y., Go, S., Choi, M., Korkin, S., Huang, D., et al. (2021b). Atmospheric correction of DSCOVR EPIC: version 2 MAIAC algorithm. Front. Remote Sens. 2, 748362. doi:10.3389/frsen.2021.748362
Lyapustin, A., Wang, Y., Choi, M., Xiong, X., Angal, A., Wu, A., et al. (2023). Calibration of the SNPP and NOAA 20 VIIRS sensors for continuity of the MODIS climate data records. Remote Sens. Environ. 295, 113717. doi:10.1016/j.rse.2023.113717
Lyapustin, A., Wang, Y., Korkin, S., Schaaf, C., Wang, W., and Wang, Z. (2025). Scaled RTLS BRDF model extended to high zenith angles. Front. Remote Sens. 6, 1533803. doi:10.3389/frsen.2025.1533803
Marshak, A., Herman, J., Szabo, A., Blank, K., Carn, S., Cede, A., et al. (2018). Earth observations from DSCOVR epic instrument. Bull. Am. Meteorological Soc. 99 (9), 1829–1850. doi:10.1175/BAMS-D-17-0223.1
Sayer, A. M., Hsu, N. C., Eck, T. F., Smirnov, A., and Holben, B. N. (2014). AERONET-based models of smoke-dominated aerosol near source regions and transported over oceans, and implications for satellite retrievals of aerosol optical depth. Atmos. Chem. Phys. 14 (20), 11493–11523. doi:10.5194/acp-14-11493-2014
Torres, O., and Ahn, C. (2024). Local and regional diurnal variability of aerosol properties retrieved by DSCOVR/EPIC UV algorithm. J. Geophys. Res. Atmos. 129 (8), e2023JD039908. doi:10.1029/2023JD039908
Turquety, S., Logan, J. A., Jacob, D. J., Hudman, R. C., Leung, F. Y., Heald, C. L., et al. (2007). Inventory of boreal fire emissions for North America in 2004: importance of peat burning and pyroconvective injection. J. Geophys. Res. Atmos. 112 (D12). doi:10.1029/2006JD007281
Wang, A., and Lyapustin, A. (2024). Analysis of temporal and spatial pattern of North American wildfire events using MODIS MAIAC data records. IGARSS 2024 - 2024 IEEE Int. Geoscience Remote Sens. Symposium, 1887–1891. doi:10.1109/IGARSS53475.2024.10641367
Wei, J., Wang, J., Li, Z., Kondragunta, S., Anenberg, S., Wang, Y., et al. (2023). Long-term mortality burden trends attributed to black carbon and PM2·5 from wildfire emissions across the continental USA from 2000 to 2020: a deep learning modelling study. Lancet Planet. Health 7 (12), e963–e975. doi:10.1016/S2542-5196(23)00235-8
Keywords: MAIAC, DSCOVR EPIC, smoke aerosol, climatology, North America
Citation: Choi M, Lyapustin A, Wang Y, Hyer EJ, Eck TF and Korkin S (2025) Climatology and variability of smoke aerosols from MAIAC EPIC observations over North America (2016–2024). Front. Remote Sens. 6:1654779. doi: 10.3389/frsen.2025.1654779
Received: 26 June 2025; Accepted: 17 August 2025;
Published: 09 September 2025.
Edited by:
Sanjay Kumar Mehta, SRM Institute of Science and Technology, IndiaReviewed by:
Lucia Deaconu, Babeş-Bolyai University, RomaniaXi Chen, The University of Iowa, United States
Copyright © 2025 Choi, Lyapustin, Wang, Hyer, Eck and Korkin. This is an open-access article distributed under the terms of the Creative Commons Attribution License (CC BY). The use, distribution or reproduction in other forums is permitted, provided the original author(s) and the copyright owner(s) are credited and that the original publication in this journal is cited, in accordance with accepted academic practice. No use, distribution or reproduction is permitted which does not comply with these terms.
*Correspondence: Myungje Choi, bXl1bmdqZS5jaG9pQG5hc2EuZ292