 Bao Bui-Quoc
 Khang Nguyen-Vi
 Anh Vu-Duc
 Nidal Kamel
- 1Central for Environmental Intelligence, VinUniversity, Hanoi, Vietnam
- 2Faculty of Mathematics and Informatics, Hanoi University of Science and Technology, Hanoi, Vietnam
- 3College of Engineering and Computer Science, VinUniversity, Hanoi, Vietnam
Introduction: Accurate forest canopy height mapping is critical for understanding ecosystem structure, monitoring biodiversity, and supporting climate change mitigation strategies.
Methods: In this paper, we present SenFus-CHCNet, a novel deep learning architecture designed to produce high-resolution canopy height classification maps by fusing multispectral (Sentinel-2) and synthetic aperture radar (SAR) (Sentinel-1) imagery with GEDI LiDAR data. The proposed model comprises two main components: a Multi-source and Multi-band Fusion Module that effectively integrates data of varying spatial resolutions through resolution-aware embedding and aggregation, and a Pixel-wise Classification Module based on a customized U-Net architecture optimized for sparse supervision. To discretize continuous canopy height values, we evaluate three classification schemes—coarse, medium, and fine-grained—each balancing ecological interpretability with model learning efficiency.
Results: Extensive experiments conducted over complex forested landscapes in northern Vietnam demonstrate that SenFus-CHCNet outperforms state-of-the-art baselines, including both convolutional and transformer-based models, achieving up to 4.5% improvement in relaxed accuracy (RA±1) and 10% gain in F1-score. Qualitative evaluations confirm that the predicted maps preserve fine-scale structural detail and ecologically meaningful spatial patterns, even in regions with sparse GEDI coverage.
Discussion: Our findings highlight the effectiveness of deep fusion learning for canopy height estimation, particularly in resource-limited settings. SenFus-CHCNet provides a scalable and interpretable approach for forest monitoring at regional and national scales, with promising implications for biodiversity conservation, carbon accounting, and land-use planning.
1 Introduction
Forest canopy height is a vital parameter in understanding and managing ecosystems, as it is directly linked to biodiversity, carbon storage, and overall forest health (Sun et al., 2023; Vargas-Larreta et al., 2020; Lang et al., 2023). Precise canopy height estimation is essential for monitoring forest dynamics, evaluating habitat quality, and supporting conservation strategies. Taller canopies with complex vertical vegetation structures can create additional ecological niches, thereby fostering greater biodiversity (MacArthur and MacArthur, 1961; Roll et al., 2015; Zhang et al., 2013), and are generally associated with higher biomass and carbon stocks, contributing significantly to the global carbon cycle (Penne et al., 2010; Solomon et al., 2024). Variability in canopy height can also inform species distribution and ecosystem resilience (Feng et al., 2020), making it a key indicator for ecological research and climate change mitigation. Traditional methods for measuring canopy height, including field surveys (Garrido et al., 2020; Bont et al., 2020; Shang et al., 2020) and airborne LiDAR (Kovanič et al., 2023; Sier et al., 2023; Catalano et al., 2023), offer high accuracy but are often limited by high costs, labor requirements, and restricted spatial coverage. Satellite remote sensing has transformed large-scale forest monitoring by providing widespread and frequent data (Trier et al., 2018; Ghosh et al., 2020), yet fine-scale precision remains challenging (Gibbs et al., 2007; Popkin, 2015; Duncanson et al., 2020; Yanai et al., 2020). Physical and semi-empirical approaches, such as those utilizing TanDEM-X for interferometric SAR and LiDAR data integration, enable more direct modeling of forest structure but often demand extensive calibration and are sensitive to site-specific factors. In contrast, machine learning models, while data-intensive, can manage complex interactions among diverse datasets more effectively. Combined with super-resolution techniques, machine learning models can enhance spatial detail, offering a flexible alternative that can adapt to different ecological contexts and improve canopy height estimation.
Recent advances in remote sensing enable the integration of diverse data sources–including Synthetic Aperture Radar (SAR), multispectral imagery, and lidar–to improve measurement accuracy (Lang et al., 2023; Valbuena et al., 2020; Tolan et al., 2024). Sentinel-1 and Sentinel-2, from the Copernicus program, provide SAR and multispectral data, respectively, while NASA’s GEDI mission delivers detailed vertical structure via spaceborne lidar. Fusing these complementary datasets holds significant potential for improving canopy height estimation.
However, integrating multi-source data presents challenges. Differences in spatial resolution, temporal frequency, and data formats can introduce inconsistencies. For instance, Sentinel-2 includes bands at 10 m, 20 m, and 60 m resolution, whereas Sentinel-1 maintains a uniform 10 m resolution. Misalignment in spatial scale and acquisition time–for example, one satellite capturing data before a disturbance event and another afterward–can degrade model accuracy. Conventional interpolation-based upscaling often yields blurred results lacking the spatial detail needed for precise analysis (Lanaras et al., 2018; Kawulok et al., 2021). To address these issues, deep learning techniques–particularly convolutional neural networks (CNNs)–have emerged as powerful tools for processing and integrating multi-resolution data. These methods enable advanced image super-resolution and reduce information redundancy (Zhou et al., 2022), thereby enhancing the overall quality and usefulness of the combined datasets.
In this paper, we propose a deep learning framework that integrates SAR data from Sentinel-1, multispectral imagery from Sentinel-2, and GEDI lidar measurements to estimate forest canopy height with high accuracy. Our approach consists of three main phases: the Collection Phase, Preprocessing Phase, and Training/Inference Phase.
1. During the Collection Phase, Sentinel-1, Sentinel-2, and GEDI are first subjected to Data Quality Filtering to ensure that only high-quality data are used. The filtered data are then processed through a Registration and Alignment step to harmonize the spatial and temporal characteristics of the different data sources, enabling accurate integration.
2. In the Preprocessing Phase, the aligned data undergo a Super-Resolution Model process, where lower-resolution imagery (e.g., 20 m resolution) is upscaled to higher resolution (e.g., 10 m resolution) to enhance the details necessary for precise canopy height estimation.
3. Finally, in the Training/Inference Phase, the preprocessed data are used to Build a Dataset for Training the Model. The deep learning model extracts essential features through the Feature Extractor and applies Sparse Supervision to predict canopy height. The model outputs a Prediction Map that visually represents the estimated forest canopy height across the study area, providing valuable insights for forest management and conservation efforts.
Our contributions are four folds and are summarized as follows:
• We present an end-to-end framework covering data acquisition, preprocessing, and deep learning for consistent canopy height estimation.
• We incorporate super-resolution techniques to enhance the spatial quality of multispectral inputs.
• By fusing Sentinel-1 SAR, Sentinel-2 optical, and GEDI lidar data, our method captures complementary spatial and vertical information.
• We validate our framework in diverse Vietnamese forest regions, showing strong performance across ecosystems.
The remainder of this paper is organized as follows: Section 2 reviews related work on canopy height estimation using remote sensing and deep learning. Section 3 details the data collection and preprocessing steps. Sections 4, 5 describe our super-resolution strategy and deep learning model. Section 6 presents the experimental setup and results, followed by conclusions and future work in Section 7.
2 Related work
Estimating forest canopy height using remote sensing data has garnered significant attention in recent years due to its importance in ecological research, carbon cycle analysis, and forest management. Traditional approaches have relied on ground-based measurements and airborne LiDAR surveys, which, while accurate, are often constrained by limited spatial coverage and high operational costs. The advent of satellite remote sensing has opened new possibilities for large-scale, cost-effective canopy height estimation, leading to the development of various methodologies that integrate data from multiple sources.
2.1 Machine learning approaches
Traditional machine learning algorithms such as Random Forest (RF) and Symbolic Regression (SR) have shown promise in modeling forest structure metrics, including canopy height and cover. However, these methods are often sensitive to input data quality and may struggle with generalizability in regions with sparse or inconsistent data.
For instance, RF was applied in Nandy et al. (2021) to estimate canopy height in India’s Doon Valley using ICESat-2 and Sentinel imagery, achieving an
2.2 Deep learning techniques
2.2.1 Convolutional neural network
Unlike traditional machine learning approaches that depend on manually derived features, such as those obtained from LiDAR waveforms, deep learning (DL) techniques excel in directly processing raw signals, which simplifies the typically intricate preprocessing steps (Fayad et al., 2021).
Convolutional Neural Networks (CNNs) are powerful tools for processing different types of signals, such as one-dimensional time series and two-dimensional images (LeCun et al., 2015; Huang et al., 2017). Their convolutional layers are designed to capture the spatial and temporal patterns often present in these data. For instance, GEDI’s univariate waveform signals record the energy pulses traveling from the atmosphere to the Earth’s surface. One-dimensional CNNs (1D CNNs) are commonly used to model the sequential dependencies along these waveforms. Another approach is to reshape the waveform into a two-dimensional format, enabling the use of two-dimensional CNNs (2D CNNs). Although using 2D CNNs for waveform data is less common, it works particularly well for GEDI signals because of their high sparsity. The 2D representation helps highlight and preserve structural patterns in the signal, improving contrast and making feature extraction more effective (Zhu et al., 2017).
CNNs have also been successfully used for canopy height estimation by combining Sentinel-2 imagery with GEDI LiDAR data. In Lang et al. (2023), researchers trained an ensemble of five deep CNNs, each initialized with different random weights, to transform Sentinel-2 optical images into canopy height maps with a ground sampling distance (GSD) of 10 m. The networks were optimized by maximizing the Gaussian likelihood, allowing them to produce both point estimates and uncertainty measures. To further improve accuracy, geographic coordinates were added as extra input channels. This method achieved strong global performance, with an average root mean square error (aRMSE) of 7.3 m, and was fine-tuned to reduce underestimation of tall canopies (Lang et al., 2023).
The effectiveness of CNNs in capturing spatial and temporal dependencies has led to their widespread adoption in remote sensing, especially for environmental monitoring tasks. Across multiple datasets, CNNs have consistently improved the accuracy and efficiency of estimating forest biophysical parameters such as canopy height and biomass (Lang et al., 2023; Fayad et al., 2021; Mahesh and Hänsch, 2023; Oehmcke et al., 2021). These advances underscore CNNs’ ability to enhance signal contrast and extract meaningful patterns from complex and often sparse data, reinforcing their role as essential tools in geospatial analysis.
2.2.2 Vision transformer
Vision Transformers (ViTs) have shown strong performance in aerial imagery tasks, demonstrating their effectiveness across a range of applications (Xu et al., 2021; Wang et al., 2022; Gibril et al., 2023; Reed et al., 2022). However, applying ViTs to generate detailed canopy height maps from high-resolution airborne LiDAR data remains challenging, primarily due to the limited availability of such data. This scarcity hinders the model’s ability to generalize to new geographic regions, particularly those with little or no training data (Schacher et al., 2023).
To address these challenges, self-supervised learning (SSL) methods–such as the DINOv2 approach–have been instrumental in advancing vision tasks like image classification and segmentation (Oquab et al., 2023; Sirko et al., 2021). To further reduce reliance on SSL and limit potential biases caused by geographically constrained supervision, (Fayad et al., 2024), employed knowledge distillation from a U-Net CNN teacher model to build a 10-m canopy height model (CHM) for Ghana, using multispectral imagery from Sentinel-1, Sentinel-2, and GEDI data. Similarly, to mitigate biases from localized supervision, recent work (Tolan et al., 2024) improved canopy height maps by integrating CNNs trained on spaceborne LiDAR data, thereby enhancing both model accuracy and its ability to generalize across regions.
3 Data Collection Phase
3.1 Study area
The study area is situated in northern Vietnam, approximately 80 km south of the capital city Hanoi, encompassing portions of Ninh Binh, Hoa Binh, and Thanh Hoa provinces. Geographically, the region spans an area of roughly 110
At the heart of the study area lies Cuc Phuong National Park, Vietnam’s first and most ecologically significant national park, established in 19621. Covering an area of over 22,000 ha, the park is located at the convergence of three provinces and is well-known for its exceptional biodiversity, hosting over 2,200 species of vascular plants, 135 species of mammals, and over 300 species of birds2. The forest within the park is predominantly tropical evergreen broadleaf, with some areas containing primary forest that has remained largely undisturbed for centuries (Duwe et al., 2022). The canopy height within the park ranges significantly, from under 10 m in young regenerating forests to over 40 m in mature and undisturbed stands.
The region’s climatic conditions are influenced by the tropical monsoon system, with high annual precipitation ranging from 1,800 to 2,100 mm, and a distinct wet season from May to October. These environmental factors, combined with rich soil diversity and topographic complexity, contribute to the dynamic vertical and horizontal structure of forest canopies across the landscape.
Beyond its ecological importance, the area is also a site of conservation priority and ongoing forest restoration efforts. It includes buffer zones with agricultural encroachment and mixed land uses, creating a mosaic of land cover types that challenge traditional forest classification and canopy height estimation methods. This makes the area particularly suitable for testing the generalizability of machine learning models across varying vegetation conditions, land cover transitions, and forest disturbance gradients.
In summary, the selected study area offers a diverse and representative forested environment that reflects many of the ecological, topographic, and land-use characteristics found in tropical Southeast Asia. Its combination of primary forest, secondary growth, anthropogenic disturbance, and varied terrain makes it an ideal testbed for developing robust models for tree height classification using remote sensing and deep learning approaches.
3.2 Satellite data description
3.2.1 Model input data
In this study, we leverage multi-source satellite imagery from the Sentinel-1 and Sentinel-2 missions to construct a comprehensive feature representation for tree height classification. These satellites, part of the European Space Agency’s Copernicus program, provide complementary data modalities–radar and multispectral optical imagery–each contributing unique information to our hybrid deep learning model.
3.2.1.1 Sentinel-1 SAR imagery
Sentinel-1 provides Synthetic Aperture Radar (SAR) data, which captures the Earth’s surface backscatter intensity independently of illumination or atmospheric conditions. The mission comprises two satellites–Sentinel-1A and Sentinel-1B–operating in a sun-synchronous near-polar orbit with a 12-day repeat cycle, effectively reduced to 6 days when both satellites are active. The SAR data is highly valuable for its sensitivity to surface structure, texture, and dielectric properties, allowing robust observation of terrain features such as land cover type, moisture content, and vegetation density.
For forest applications, SAR is particularly advantageous in detecting canopy structural characteristics, especially in densely vegetated areas where optical data may be limited due to cloud cover. The backscatter response in the VV and VH polarizations serves as an indirect indicator of canopy complexity and biomass. In this work, Sentinel-1 data constitutes a critical input to the regression stage of our model, aiding in the quantification of vertical forest structure for tree height classification.
To ensure complete spatial coverage of the study area–including the region of interest–we selected two Sentinel-1 image tiles acquired over a 5-month period, from March 6 to 6 August 2024. Both tiles share identical orbital parameters, with Orbit Number: 53575 and Product ID: 068102. Specifically, the tile marked with the red bounding box in Figure 1 has a Checksum ID of 5C5B, while the tile delineated by the light blue bounding box is associated with Checksum ID A368.
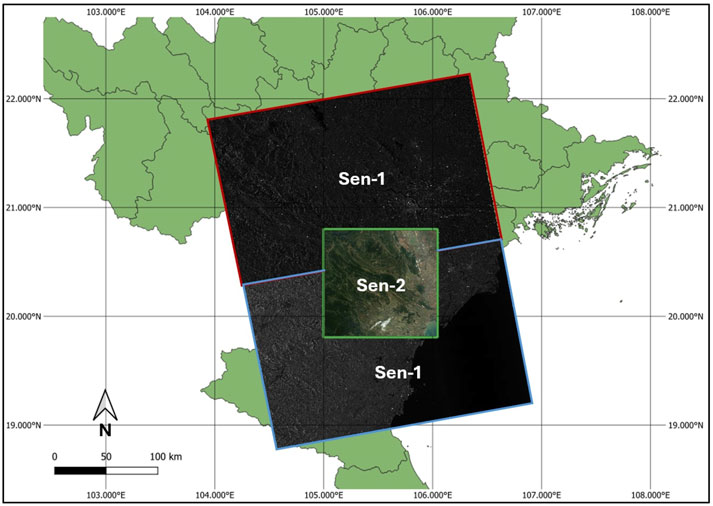
Figure 1. Initial Sentinel-1 and Sentinel-2 data overlaid on the map. The Sentinel-1 data consist of two images, each enclosed by red and light blue bounding boxes, respectively. The Sentinel-2 image is highlighted with a green bounding box.
For Sentinel-1 data processing, we performed spatial cropping and alignment with corresponding Sentinel-2 imagery. The procedure involves initially merging the two Sentinel-1 tiles into a unified mosaic. Subsequently, the geographic coordinates of each pixel in the mosaic are calculated, and coordinate system synchronization with the Sentinel-2 reference frame is verified. Finally, the overlapping region, where pixel coordinates are aligned with the Sentinel-2 dataset, is extracted and used as the input data for the model.
3.2.1.2 Sentinel-2 multispectral imagery
Complementing SAR data, Sentinel-2 imagery provides high-resolution multispectral information, which is essential for capturing biochemical and biophysical properties of vegetation. We employ Level-2A products, which offer atmospherically corrected surface reflectance, significantly enhancing the reliability of vegetation analysis. Sentinel-2 has a 5-day revisit frequency and provides imagery across 12 spectral bands with resolutions of 10, 20, and 60 m.
Our analysis emphasizes the 10-m bands (B2 - Blue, B3 - Green, B4 - Red, B8 - Near Infrared). Furthermore, the B9 band (Short Wave Infrared, SWIR) is offered at a coarser 60-m resolution, while the other bands, namely B1 (Ultra Blue), B5-B7 (Red Edge), B8A (Narrow NIR), and B11-B12 (SWIR), are offered at 20-m resolution.
The dataset used includes Sentinel-2B imagery (Tile ID: T48QWH) captured on 12 February 2024, at 03:28:49 UTC (as visualized in Figure 1). This acquisition features high image clarity and minimal atmospheric interference, with less than 3% cloud cover. The image dimensions are 10980
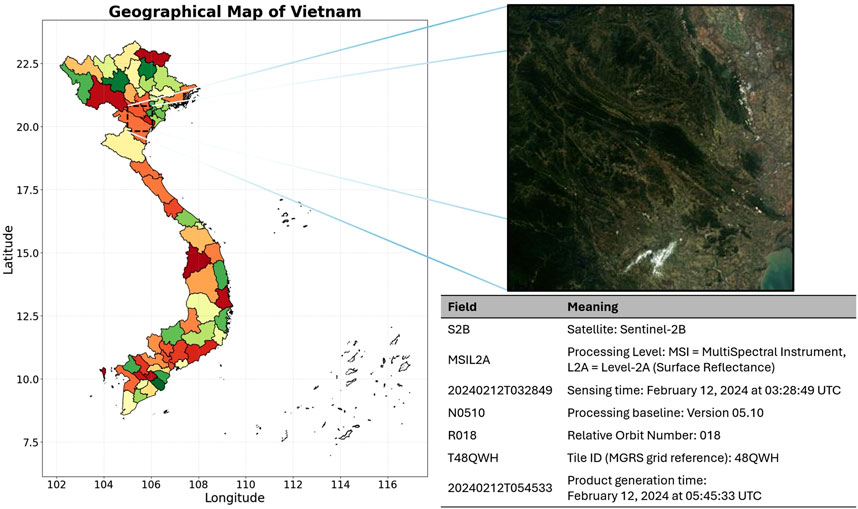
Figure 2. Region of interest (ROI) on the geographical map of Vietnam. The left panel shows the national map with provincial boundaries, where latitude (North-South axis) and longitude (East-West axis) are explicitly indicated, and the ROI is highlighted by a dashed bounding box. The right panel presents a Sentinel-2B Level-2A surface reflectance image of the ROI, together with a table summarizing the metadata of the acquisition.
Together, the integration of Sentinel-1 and Sentinel-2 data enables a robust and multi-perspective characterization of forest structure. Their synergistic potential–temporal continuity, structural sensitivity (SAR), and spectral richness (optical)–forms the foundation for accurate tree height classification when combined with GEDI-derived ground truth in our hybrid classification-regression model.
3.2.2 GEDI reference data
Launched on 5 December 2018, the Global Ecosystem Dynamics Investigation (GEDI) mission, onboard the International Space Station (ISS), employs advanced Light Detection and Ranging (LiDAR) technology to generate high-resolution 3D observations of forest vertical structure. By measuring the time delay of laser pulse returns, GEDI accurately characterizes forest canopy height, vertical layering, and foliage density, providing critical insights for assessing aboveground biomass, biodiversity, and ecosystem health.
GEDI operates between latitudes 51.6°N and 51.6°S, offering the highest spatial sampling density of any spaceborne LiDAR system to date. It is equipped with three lasers, each firing 242 times per second, generating measurements at footprints spaced approximately 60 m along-track with a swath width of about 4.2 km across-track.
GEDI data products are released in multiple levels:
• Level 1B: Geolocated waveform data.
• Level 2A/B: Canopy height, canopy profile metrics, and ground elevation.
• Level 3: Gridded canopy height and terrain elevation maps.
• Level 4: Aboveground biomass density and associated uncertainties.
In this study, we utilize the Level 2A product, which contains detailed canopy height and profile metrics. The dataset includes several critical fields used in our analysis:
• Shot Number (integer): Unique identifier assigned to each laser pulse emitted by GEDI.
• Beam (object): Specifies which laser beam was used for the measurement.
• Latitude/Longitude (float): Geographic coordinates of the footprint location on Earth’s surface.
• Canopy Height (rh98) (float): Height of the canopy, typically measured at the 98th percentile of waveform energy return.
• Quality Flag (float): Indicator of the measurement’s reliability.
• Plant Area Index (float): Ratio representing total leaf area per unit ground area.
• Degrade Flag (float): Flag indicating data degradation due to noise sources such as cloud or dust interference.
• Sensitivity (float): Degree to which the system can detect small or low-reflectance targets.
To ensure the reliability of the GEDI-derived canopy height measurements, a noise filtering step was applied prior to integration with the satellite data. First, only footprints with a quality flag equal to one were retained, indicating that the shot met specific requirements regarding energy, sensitivity, amplitude, and real-time surface tracking. Second, footprints with a degrade flag greater than zero were discarded, as these correspond to measurements collected during degraded instrument states. Finally, we applied a threshold on the Sensitivity field, retaining only records with values greater than 0.95 to ensure robust waveform detection. Although this filtering process is straightforward, it plays an essential role in eliminating invalid or degraded measurements and thereby improves the reliability of the training labels used in our study.
The dataset was obtained through NASA’s Earth Science Data Systems (ESDS) and spans from 1 January 2021 to 5 August 2024. It comprises a total of 97.5 GB distributed across 174 HDF5 files. Figure 3 provides a summary of the GEDI dataset characteristics used in this study.
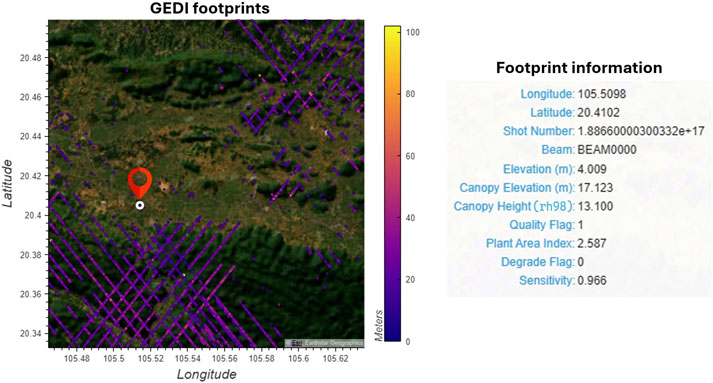
Figure 3. Footprints are distributed within a small subregion of the region of interest (ROI). Each footprint is represented as a circular point. The table on the right displays detailed metadata corresponding to the highlighted footprint on the map to the left.
4 Methodology
In this section, we introduce SenFus-CHCNet, a fully convolutional deep neural network designed for generating canopy height classification maps by leveraging multi-source and multi-band satellite data. Specifically, the model integrates 12 spectral bands from Sentinel-2 and 2 polarization bands (VV and VH) from Sentinel-1, spanning across three distinct spatial resolutions (10 m, 20 m, and 60 m GSD). The input data are first synchronized and fused using a dedicated band fusion module, which produces a unified feature tensor. This tensor is subsequently fed into a UNet-based architecture that performs sparse learning to generate the final pixel-wise canopy height classification map. This section is organized into two main components: the multi-source and multi-band fusion module (Section 0.6), the pixel-wise classification module (Section 0.7), and sparse learning (Section 0.8).
4.1 Model architecture overview
SenFus-CHCNet accepts input data that are heterogeneous in both data modality and spatial resolution. The input bands are grouped according to their spatial resolution, resulting in three mutually exclusive Sentinel-2 band subsets. In particular, the VV and VH polarizations from Sentinel-1, which have a spatial resolution of 10 m, are grouped together with the 10 m bands from Sentinel-2. Consequently, we define three input subsets as follows:
These correspond to the 10 m, 20 m, and 60 m spatial resolution groups, respectively. The three groups are illustrated in the input Sentinel-1,2 component as shown in Figure 4. For each group, the bands are combined to form unified input tensors:
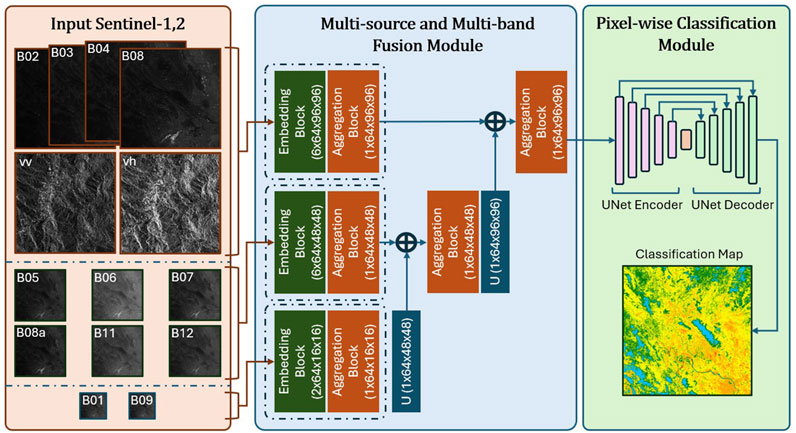
Figure 4. Overall architecture of the SenFus-CHCNet model. The model comprises three main components: the orange represents the input data, the blue denotes the Multi-source and Multi-band Fusion Module, and the green corresponds to the Pixel-wise Classification Module. Within the blue block, four types of blocks are incorporated: EB (Embedding Block), RF (Recursive Fusion), IN (Instance Normalization), and U (Upscaling Block).
To integrate multi-resolution data effectively, a hierarchical fusion strategy is used. First, features are extracted separately from each resolution-specific input tensor. The features from the 60 m input are then upsampled to match the 20 m resolution and fused with the corresponding 20 m features. This combined representation is transformed and upsampled again to match the 10 m resolution, where it is fused with the 10 m features to produce the final unified feature map. The output of this multi-stage fusion process is a high-resolution feature tensor:
where
The extracted feature tensor
where
Given the sparse nature of the labeled canopy height data, sparse supervision is applied during the training phase. This approach enables the model to learn effectively from partially annotated data without requiring dense labels. For clarity, we omit the batch dimension in all the equations presented in this section.
4.2 Multi-source and multi-band fusion module
The Multi-source and Multi-band Fusion Module is designed to effectively integrate heterogeneous spectral and radar inputs from Sentinel-1 and Sentinel-2 data. These inputs vary not only in modality (optical vs. SAR) but also in spatial resolution (10m, 20m, and 60 m), posing challenges for unified feature representation. To overcome this, the module incorporates resolution-specific embedding pathways, followed by dedicated aggregation blocks to harmonize and fuse the extracted features across modalities and scales.
4.2.1 Embedding blocks
The Embedding Block is the first stage in our fusion module and is designed to extract rich and resolution-aware feature representations from multi-band satellite inputs. Since Sentinel-1 and Sentinel-2 data contain bands of different spatial resolutions (10 m, 20 m, and 60 m) and varying channel numbers, each resolution group is processed independently by a dedicated embedding path. Specifically, each input group–corresponding to the 10 m, 20 m, and 60 m resolution bands–is passed through its respective embedding block, denoted as
Each block is tailored to its corresponding input resolution and band configuration, ensuring that spatial details and spectral semantics are preserved before fusion. To achieve this, the block employs a deep residual architecture composed of stacked 3
A key feature of the embedding block is its use of residual connections, which bridge early and deeper representations. These skip connections not only facilitate the flow of gradients during backpropagation but also preserve low-level spatial details (He et al., 2016; Mou and Zhu, 2018) that are critical for accurate pixel-level canopy height prediction. This residual mechanism is applied at two different stages in the block, reinforcing both intermediate and final feature maps.
After the final convolutional stage, the output tensor undergoes reshaping and instance normalization. The use of instance normalization serves two purposes: it stabilizes training by reducing internal covariate shift, and it ensures that the learned features are locally consistent and robust to illumination or backscatter variations–especially important when combining radar (Sentinel-1) and optical (Sentinel-2) modalities.
The final output of the embedding block is a five-dimensional tensor that retains the original spatial resolution, the input band grouping, and a newly added feature dimension of size 64. This multi-dimensional structure is critical for the next phase of the model, where embeddings from all resolutions will be spatially aligned and recursively fused to form a unified representation.
Overall, the Embedding Block acts as a resolution-preserving encoder, transforming raw multispectral and SAR inputs into structured high-dimensional features, while maintaining separability across spectral bands and enabling downstream fusion without early loss of information. The processing procedure within the embedding block is elaborated in Algorithm 1.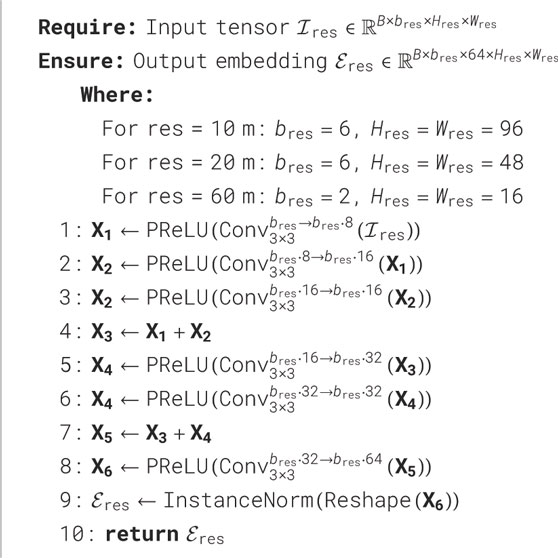
Algorithm 1. Embedding Block EBres for resolution-specific input.
4.2.2 Aggregation blocks
Following the resolution-specific embedding stage, the next objective in our fusion module is to integrate information across the multiple spectral bands of each resolution group. To this end, we introduce a specialized Aggregation Block, which performs intra-resolution fusion by compressing and refining band-wise embeddings into a unified feature representation. The detailed computational operators of this block are outlined in Algorithm 2.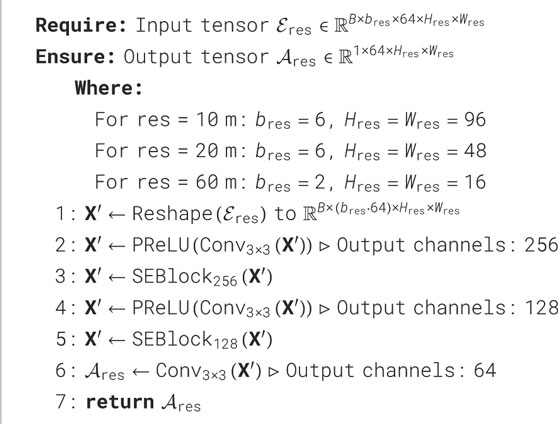
Algorithm 2. Aggregation Block (ABBlock).
Each input embedding tensor
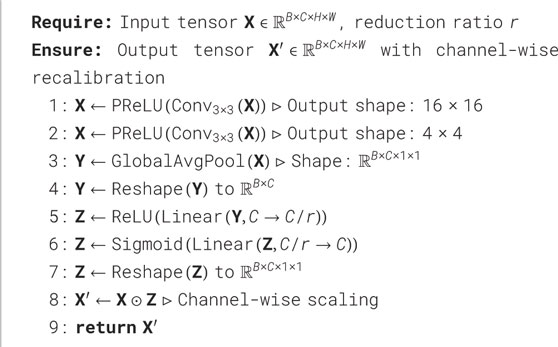
Algorithm 3. Squeeze-and-Excitation Block (SEBlock).
In our implementation, two SE blocks are applied in sequence, with convolutional layers in between to gradually reduce and refine the feature dimensionality. This design compresses the representation step by step, starting from an expanded feature space (e.g., 256 and 128 channels) and producing a final output of 64 channels. Throughout this process, the spatial structure is preserved, and information from all bands within the resolution group is fully integrated.
The output of this block,
By separating the embedding and aggregation steps, the model remains flexible in handling different numbers of bands and resolutions. This design ensures that the final fused representation preserves both local spatial detail and global semantic consistency. In addition, the modular structure improves generalizability, making it easy to adapt the model to other satellite configurations or geospatial domains.
4.2.3 Upscaling and fusion
After obtaining the aggregated feature representations from each resolution group via the Aggregation Blocks, the next step is to align these multi-resolution features into a common spatial scale for unified analysis. Since Sentinel-derived inputs come from three different spatial resolutions (10 m, 20 m, and 60 m), we adopt a progressive upscaling and fusion strategy that integrates coarse-resolution information step by step into finer-resolution representations.
The fusion process begins by aligning the 60 m and 20 m aggregated features. Specifically, the 60 m representation
Next, to unify all information at the highest resolution level (10 m), the fused 20 m feature map
In practice, both
Following the convolutional refinement, a non-linear activation function (ReLU) is applied to further enhance the discriminative capacity of the features by introducing non-linearity and improving representation expressiveness. The overall design of these upscaling modules can thus be summarized as a sequential operation: bilinear interpolation
This hierarchical upscaling mechanism ensures that spatial information from lower-resolution sources (e.g., Sentinel-2 B01, B09, or Sentinel-1 VH) is effectively incorporated into the final high-resolution feature space, while preserving contextual structure and minimizing interpolation artifacts. By fusing coarse-to-fine information in this manner, the model is able to exploit the full range of spectral and spatial cues available across the Sentinel dataset hierarchy, ultimately producing a dense, high-resolution feature representation that is well-suited for downstream pixel-wise canopy height classification.
4.3 Pixel-wise classification module
The final stage of the SenFus-CHCNet framework is the Pixel-wise Classification Module, which is responsible for producing a dense canopy height classification map from the fused multi-resolution features. At this point, the output tensor from the previous fusion stage–denoted as
To perform the pixel-wise classification, we adopt a U-Net-based architecture specifically tailored for this task. U-Net is widely recognized for its capability to preserve spatial detail through symmetric skip connections while enabling deep feature learning via hierarchical encoding and decoding. In this work, we adapt the original U-Net design to match the spatial and semantic requirements of the canopy height classification problem.
Our customized U-Net consists of four downsampling (encoder) blocks and four upsampling (decoder) blocks, symmetrically connected by skip connections that bridge corresponding levels. Each encoder block contains two convolutional layers with kernel size
At the bottleneck, a double convolutional block with 1024 channels is applied, serving as a semantic bridge between the encoder and decoder. The decoder then mirrors the encoder, using bilinear upsampling followed by convolution to gradually reconstruct the spatial resolution back to
Each decoder block applies the same double convolution pattern as the encoder. The final layer is a
Overall, this pixel-wise classification design enables the model to produce high-resolution, semantically rich canopy height maps that reflect the vertical structure of forests across diverse landscapes.
4.4 Sparse learning strategy
One of the primary challenges in training deep learning models for canopy height classification using satellite and GEDI data is the extreme sparsity of ground-truth labels. Although satellite inputs provide dense spatial coverage, the reference height labels derived from GEDI footprints cover only a small fraction, approximately 0. 1%, of the total area of the image. As a result, the training data consists mostly of unlabeled pixels, posing a risk of gradient dilution, biased learning, and poor convergence if standard dense loss functions are applied naively.
To address this issue, we adopt a sparse training strategy, in which the loss is computed and backpropagated only at pixel locations where ground-truth labels are available. This approach ensures that the model focuses its learning signal on valid supervisory information while ignoring undefined or irrelevant regions.
Let
The sparse categorical cross-entropy loss is then computed as:
Here,
This formulation is naturally supported by modern deep learning libraries, which offer built-in sparse loss implementations and masking capabilities. Furthermore, the sparse strategy integrates well with class balancing techniques, such as weighted cross-entropy or focal loss, to mitigate the effects of class imbalance, especially when rare height classes (e.g., tall emergent trees) are underrepresented in the data.
By leveraging this sparse training framework, our model remains scalable to large-scale satellite imagery while effectively learning from limited but high-quality GEDI supervision. This approach significantly improves training stability and allows for a meaningful generalization in forested landscapes with varying canopy structures and data densities.
5 Experiments
To thoroughly assess the effectiveness of the proposed SenFus-CHCNet architecture in the task of canopy height classification, we conducted a comprehensive series of experiments aligned with the core research questions presented in Section 0.10. These experiments investigate the performance of the model across different class discretization strategies and benchmark it against established baseline methods.
5.1 Experimental setups
5.1.1 Data preprocessing
The initial dataset comprises multi-band satellite imagery from both Sentinel-1 and Sentinel-2 missions, accompanied by canopy height ground-truth annotations derived from GEDI footprints. As a first step, we construct a label matrix matching the spatial extent and resolution of the 10-m Sentinel-2 bands (
5.1.1.1 Patch extraction and dataset composition
To construct the training dataset, we partition both the label matrix and satellite imagery into smaller patches. Specifically, patches of size
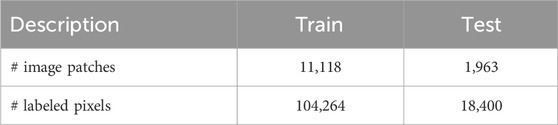
Table 1. Dataset statistics.
5.1.2 Training configuration
The proposed model is trained on a multi-GPU setup comprising six NVIDIA RTX A5000 GPUs, each equipped with 24 GB of VRAM. Training is conducted for 1000 epochs with a batch size of 128. The initial learning rate is set to
In addition, we empirically explored different regularization strategies and selected the configuration that yielded the most stable optimization and robust generalization. Specifically, dropout with a rate of
The proposed architecture is designed to achieve efficient inference on satellite imagery without incurring excessive computational cost. The total number of parameters amounts to 45.25 M with a computational complexity of 8.68 GFLOPs. Under the hardware configuration described above, the model requires on average 0.17 s to process a
5.1.3 Evaluation metrics
To rigorously evaluate the performance of the proposed SenFus-CHCNet, especially in the context of discretized ordinal canopy height classification, we adopt two complementary metrics: F1-score and Relaxed Accuracy.
F1-score is a standard classification metric that provides a harmonic mean of precision and recall, capturing the balance between false positives and false negatives. It is particularly informative in imbalanced class distributions, where overall accuracy may be misleading. For a given class
with:
•
•
Where
5.1.3.1 Relaxed accuracy (RA)
In classification tasks involving discretized continuous targets (e.g., canopy height ranges), strict accuracy can harshly penalize near-boundary misclassifications that are semantically insignificant. To address this, we use a relaxed evaluation metric that tolerates minor deviations from the true label.
Let the ground-truth and predicted class labels be denoted as in Equation 8 below:
where
The RA metric with a tolerance of
Here,
• Predictions that match the true class
• Predictions that deviate by only one class index (e.g., predicting class 3 when the ground truth is class 2 or 4) are also accepted.
• Only predictions that differ by more than one index are penalized.
This metric reflects the ordinal structure of the classification task and offers a more nuanced assessment of performance, especially when adjacent classes represent similar height ranges.
5.2 Experimental results
In this section, we address five key research questions through a series of carefully designed experiments aimed at providing comprehensive insights:
• RQ1: How can canopy height be discretized into classification levels that enhance model training efficiency while preserving ecological and practical relevance?
• RQ2: How does the proposed SenFus-CHCNet model perform in canopy height classification compared to existing methods across different class configurations
• RQ3: How does the proposed SenFus-CHCNet perform in comparison with established segmentation models across different levels of canopy height class discretization?
• RQ4: To what extent does the visual output of the predicted canopy height classification map reflect meaningful spatial patterns of forest structure within different regions of interest (ROIs)?
5.2.1 Ablation study
To further elucidate the contribution of each key component in the proposed SenFus-CHCNet, we performed ablation experiments by selectively disabling or simplifying major modules. In the first variant, the squeeze-and-excitation (SE) operation was removed from the Aggregation Block, thereby discarding the channel-wise recalibration mechanism. In the second variant, the hierarchical convolutional upscaling was substituted with simple bilinear interpolation without convolutional refinement, which reduced the model’s capacity to progressively fuse multi-resolution features. The full model retained both modules and served as the reference.
The results of these experiments are presented in Figure 5, which reports both F1-score and Accuracy across coarse-, medium-, and fine-grained canopy height classification settings. Compared with the full architecture, the removal of the SEBlock consistently led to a decline in performance, particularly under fine-grained classification where channel adaptivity plays a crucial role in distinguishing subtle canopy height variations. On the other hand, replacing hierarchical upscaling with bilinear interpolation yielded a more pronounced reduction in accuracy at the coarse- and medium-grained levels, indicating that progressive refinement is vital for effectively preserving spatial detail and contextual consistency.
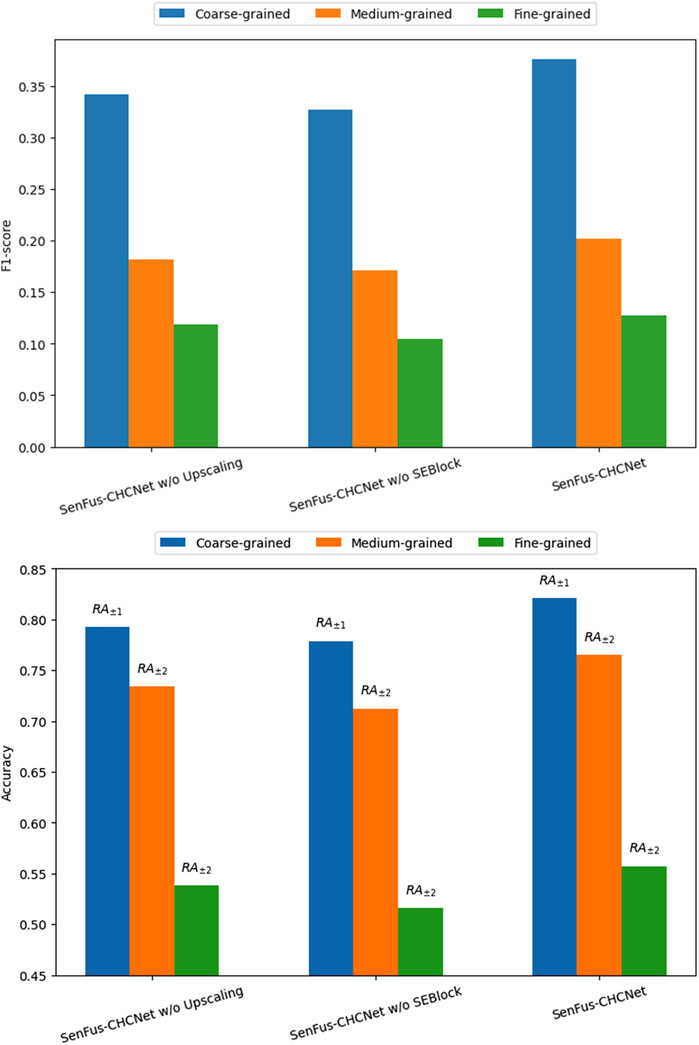
Figure 5. Ablation study of SenFus-CHCNet. F1-score (top) and Accuracy (bottom) across coarse-, medium-, and fine-grained canopy height classification. “w/o SEBlock” denotes removing SE from the Aggregation Block, while “w/o Upscaling” denotes replacing hierarchical convolutional upscaling with bilinear interpolation.
Overall, the complete SenFus-CHCNet outperformed both reduced variants by a clear margin in all scenarios, achieving the best balance between structural representation and spectral adaptivity. These findings confirm that the SEBlock and the hierarchical upscaling module provide complementary benefits: while SE enhances channel-level feature discrimination, hierarchical upscaling improves spatial integration across scales. Their joint integration is therefore indispensable for maximizing the model’s performance in canopy height estimation.
5.2.2 Discretization strategies for canopy height classification (RQ1)
The canopy height distribution Figure 6 for the ROI region reveals a pronounced right-skewed pattern, with the majority of samples concentrated within the 10–35 m range. The distribution peaks around 20–22 m, reaching over 5,000 data points per meter of height. This distribution reflects the typical stratification of evergreen tropical forests in Vietnam, where most trees fall within the mid to upper canopy layers, while trees exceeding 40 m in height are increasingly scarce. Beyond the 35-m threshold, the number of samples declines sharply, indicating that only a small fraction of GEDI-recorded points surpass this height, consistent with the ecological reality that old-growth or primary forests in the region contain relatively sparse occurrences of emergent trees. This distribution also underscores the imbalance in the training dataset, suggesting that height classification models should incorporate carefully designed class intervals to account for such asymmetry.
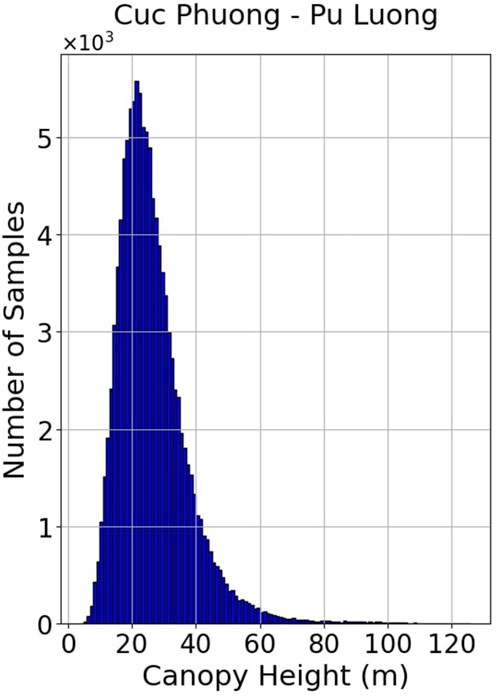
Figure 6. Height distribution over the ROI.
Transforming a continuous canopy height regression problem into a classification task requires the discretization of height values into meaningful intervals. The strategy used for binning directly affects not only model performance but also the ecological interpretability and applicability of the results. In this study, we evaluate three discretization schemes with different granularities (as shown in Figure 7), aiming to capture structural variation in forest canopies while addressing challenges such as class imbalance and model generalization. These strategies are inspired by both the statistical distribution of the data and the ecological thresholds observed in prior research.
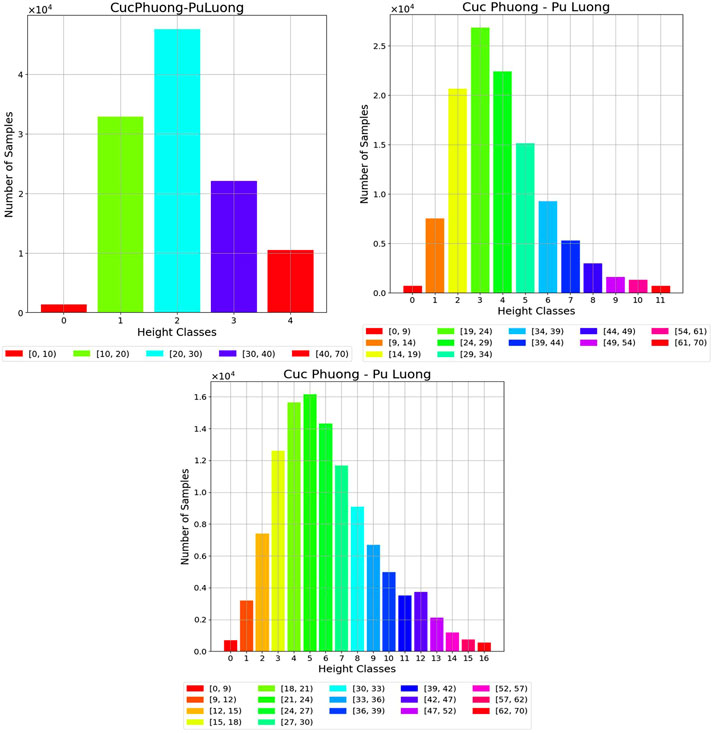
Figure 7. Histogram showing the distribution of pixel counts corresponding to each canopy height interval, under three different classification settings: 5 classes, 12 classes, and 17 classes.
5.2.2.1 Fine-grained discretization (17 classes)
This scheme emphasizes higher resolution in the lower and mid-canopy ranges (e.g., sub-30 m), which are typically the most ecologically diverse strata in tropical forests. Such granularity allows the model to capture subtle structural differences in young or secondary forests, plantation areas, and undergrowth layers. This is particularly useful in biodiversity-rich regions like Vietnam, where small differences in canopy height can correspond to different forest successional stages or species compositions (Asner et al., 2010; Clark and Clark, 1994).
5.2.2.2 Medium-grained discretization (12 classes)
This strategy represents a compromise between classification detail and model stability. It smooths the transitions between classes while still preserving interpretability across ecological zones. By adopting roughly uniform increments of 5 m in the 10–50 m range, where most forest canopies in tropical Southeast Asia are concentrated, it provides a stable yet sufficiently descriptive breakdown of forest structure. This approach is particularly useful for land management and REDD + applications (Gibbs et al., 2007), where moderate-resolution classifications are often sufficient for policy-level decision-making and reporting. Moreover, reducing the number of classes decreases the risk of overfitting and mitigates issues arising from noisy or sparse labels, especially at canopy extremes.
5.2.2.3 Coarse-grained discretization (5 classes)
This simple and uniform binning strategy is designed for scenarios that require efficient and robust model training, particularly when the available ground-truth labels are sparse, as is the case with GEDI footprints covering only 0.1% of the spatial extent. Each class spans a 10-m height interval, consistent with general forest classification standards that categorize vegetation into low (
These three discretization schemes, ranging from coarse to fine granularity, not only reflect different ecological interpretations of canopy structure but also offer varying levels of challenge in classification. In the subsequent experiments, we train and evaluate the proposed model under all three configurations to assess its adaptability and robustness across diverse class partitioning strategies.
5.2.3 Comparative performance of SenFus-CHCNet across class settings (RQ2)
In this section, we explore how different discretization schemes–namely, 5-class, 12-class, and 17-class configurations–impact the performance of the SenFus-CHCNet model. The comparison is visualized using both absolute count confusion matrices and their corresponding row-normalized versions, offering insights into both the frequency and relative accuracy of predicted class assignments.
5.2.3.1 Performance in the 5-class scenario
The model achieves its most robust performance under the coarsest (5-class) setting. As evident in the count-based confusion matrix (Figure 8a), a large portion of the predictions concentrate along the diagonal, particularly in the mid-range class (20–30 m), which corresponds to the dominant canopy height range in the dataset. The row-normalized matrix (Figure 8b) further supports this observation, with class-wise accuracy peaking at approximately 64%. In contrast, boundary classes such as 0–5 m and 40–70 m show slightly reduced precision, reflecting greater misclassification into adjacent classes–an effect likely driven by sample imbalance.
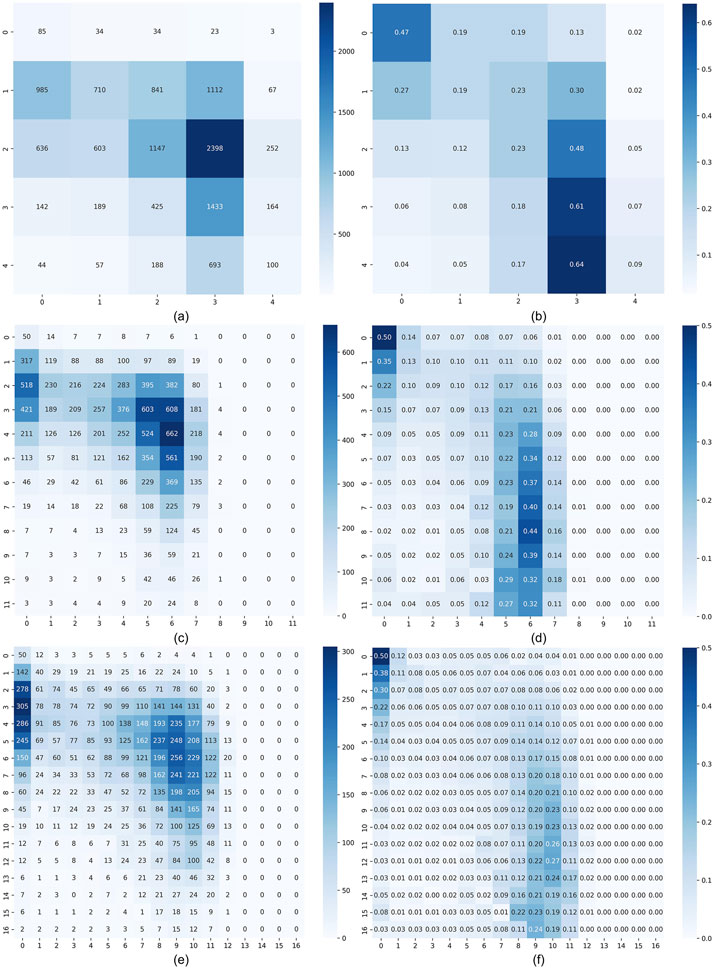
Figure 8. Predicted results of our proposed model are presented in the form of confusion matrices. The left column shows count-based matrices, while the right column shows row-normalized matrices. (a,b) Results for the 5-class configuration. (c,d) Results for the 12-class configuration. (e,f) Results for the 17-class configuration. In each matrix, the vertical axis represents ground-truth labels, and the horizontal axis represents predicted labels.
5.2.3.2 Performance in the 12-class scenario
Increasing the number of classes to 12 introduces more detailed canopy height intervals. This added granularity, while improving semantic representation, also raises the level of prediction difficulty. As shown in Figure 8c, the model still retains a strong diagonal pattern, particularly for mid-canopy classes (e.g., 30–42 m), where prediction counts remain concentrated. The row-normalized matrix (Figure 8d) shows that despite increased confusion, a substantial portion of correct predictions (up to 44%) remains in these mid-level bins. Nevertheless, the matrix also reveals more dispersed off-diagonal activity, signaling elevated inter-class confusion at both lower and higher height ranges.
5.2.3.3 Performance in the 17-class scenario
The 17-class configuration presents the most challenging setting due to its narrow height intervals and high class count. As shown in Figures 8E,F, while the model still captures the general canopy height structure, the distribution of predictions becomes significantly more diffuse. Correct classification rates drop markedly, and the presence of many classes with low support leads to overfitting on dominant classes (e.g., 34–42 m) and underperformance on sparse categories. The row-normalized matrix, in particular, shows how prediction confidence is diluted across multiple neighboring bins.
Overall, the model performs best when class granularity is moderate or coarse, with the 5-class setting yielding the most consistent predictions. As the number of classes increases, prediction uncertainty also rises, particularly in underrepresented classes. This analysis underscores the trade-off between semantic resolution and predictive reliability, which should be considered when designing classification schemes for canopy height mapping. These observations will serve as a foundation for further region-specific evaluations in subsequent sections.
5.2.4 Comparison of classification performance against baseline models (RQ3)
This section presents a comprehensive comparative evaluation of SenFus-CHCNet against several state-of-the-art semantic segmentation models, including convolutional networks (U-Net, ResUNet) and transformer-based architectures (SegFormer, DeepLabv3+, SERNet-Former), with the summarized results as shown in Table 2. The models were tested under three different canopy height discretization schemes–coarse (5 classes), medium (12 classes), and fine (17 classes). Across all settings, SenFus-CHCNet consistently outperformed the baselines. Under the 5-class configuration, it achieved the highest relaxed accuracy (RA
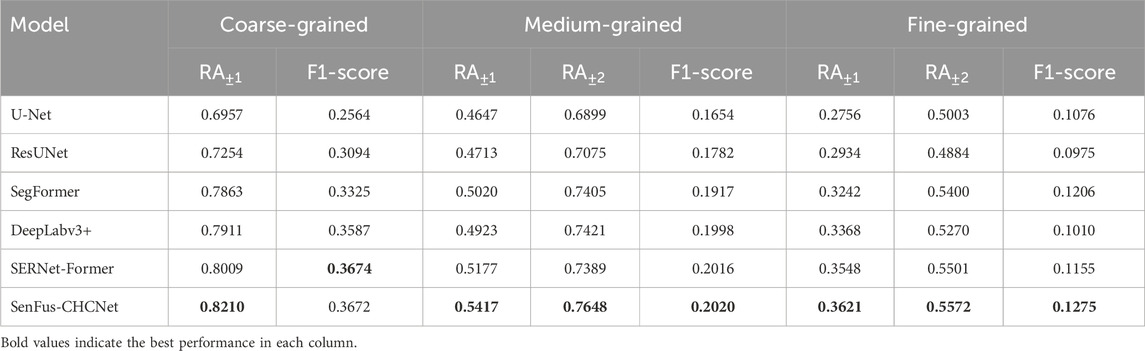
Table 2. Evaluation results across three levels of classification granularity (Coarse, Medium, Fine).
As expected, all models experienced declining performance as class granularity increased. However, SenFus-CHCNet retained the highest absolute performance at every level, suggesting that its fusion pipeline and sparse learning strategy make it more robust to the loss of statistical power associated with finer discretization. Transformer-based models generally outperformed traditional CNNs in medium and fine settings, thanks to their capacity for capturing long-range dependencies. Yet, SenFus-CHCNet still outperformed them, highlighting the effectiveness of its hierarchical, resolution-aware fusion design. This structure allows for the progressive integration of coarse-resolution features (e.g., 60 m and 20 m Sentinel bands) into high-resolution (10 m) outputs while preserving local spatial detail–something standard self-attention mechanisms achieve only with significantly higher computational cost.
Another important strength of SenFus-CHCNet lies in its robustness to near-miss classification errors. The relatively small gap between RA
In practical terms, even modest improvements in relaxed accuracy–2 to 4 percentage points–translate into substantial benefits when scaled to large geographic areas, such as provincial or national forest maps. Such improvements improve the reliability of biomass estimates and can directly influence REDD + reporting and policy planning. Overall, the experimental results in this section validate that SenFus-CHCNet not only achieves superior numerical performance but also offers stronger generalization, better semantic consistency, and improved ecological realism in canopy height classification tasks.
5.2.5 Qualitative evaluation of predicted forest height structure (RQ4)
This section provides a qualitative assessment of the spatial realism and ecological plausibility of the canopy height maps predicted by SenFus-CHCNet under different discretization strategies. This analysis is crucial for evaluating the model’s utility beyond raw accuracy metrics, particularly in real-world forest monitoring applications where spatial coherence and ecological interpretability are essential.
The results, visualized in Figure 9a, demonstrate that SenFus-CHCNet effectively captures the spatial heterogeneity of forest structure across the Cuc Phuong-Pu Luong region, a highly diverse and topographically complex landscape in northern Vietnam. Under the coarse-grained (5-class) configuration, the model produces clear and coherent spatial patterns that align well with major ecological and topographic features. For instance, taller canopy classes (30–40 m and 40–70 m) are prominently localized along ridgelines and mountainous zones, while shorter canopy classes (0–10 m, 10–20 m) dominate the valley floors, disturbed areas, and lowland agricultural interfaces. These results demonstrate the model’s ability to distinguish macro-scale forest structure and reflect general ecosystem stratification. However, the spatial transitions between classes appear blocky, with abrupt boundaries that may oversimplify the complex gradients of natural forest canopies. While useful for large-scale assessment and REDD + applications, the 5-class maps risk overlooking subtle structural changes important for conservation or biodiversity modeling.
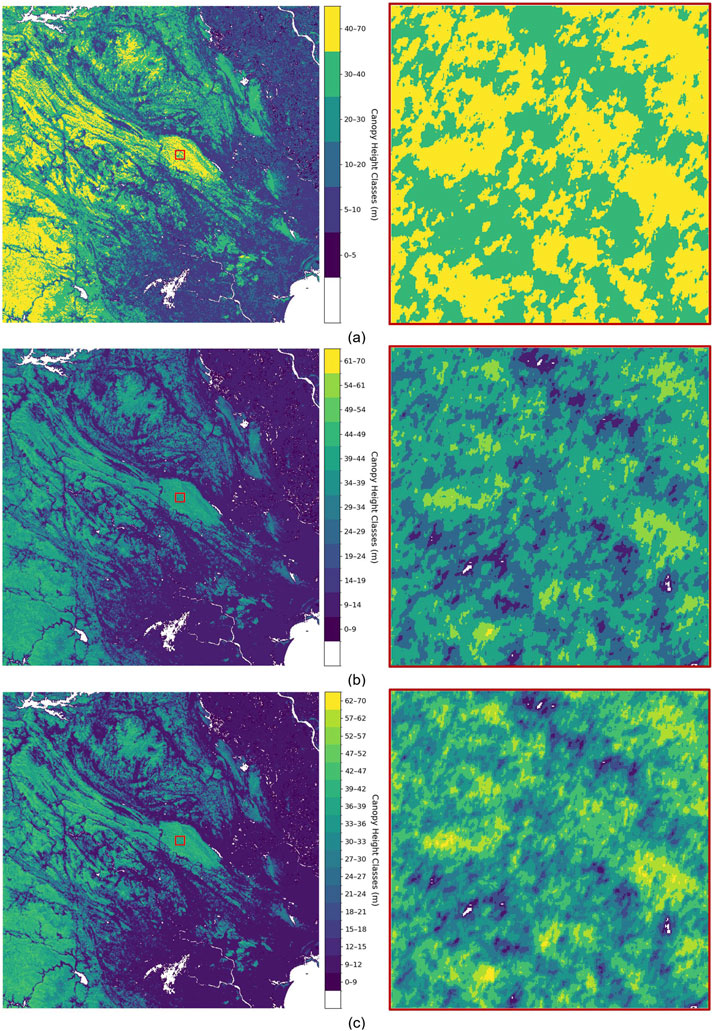
Figure 9. Qualitative visualization of predicted canopy height classification maps over the Cuc Phuong-Pu Luong region under different discretization strategies. Each subfigure shows the full-region prediction (left) and a zoomed-in view of a selected local area (right). (a) Coarse-grained; (b) Medium-grained; (c) Fine-grained classification. The color bars represent the corresponding canopy height intervals in meters.
In contrast, the medium-grained (12-class) classification results shown in Figure 9b demonstrate offers a more refined and ecologically nuanced representation. Canopy height intervals such as 24–29 m, 29–34 m, and 34–39 m are visibly distinct in the map, especially in mid-elevation zones and transitional forest stands. The model maintains smooth and continuous class boundaries, reflecting gradual vertical changes in forest succession or age classes. This finer delineation is particularly evident in the zoomed-in subregions, where the height gradients follow natural terrain undulations and canopy layering more closely than in the coarse-grained map. The medium-grained output strikes a favorable balance between interpretability and spatial detail, making it highly suitable for land-use planning, forest restoration monitoring, and ecosystem services evaluation.
With the fine-grained (17-class) setting, whose visual results are shown in Figure 9c, SenFus-CHCNet delivers the most detailed canopy height maps, capturing subtle variations in vertical forest structure, including local disturbances, gaps, and successional mosaics. This high resolution enables identification of micro-patterns such as plantation edges, regrowth patches, and potentially even forest degradation signals. In highly diverse regions like Cuc Phuong, such precision is invaluable for ecological modeling, habitat suitability assessment, and species distribution analysis.
However, this granularity also increases the sensitivity of the map to prediction noise, particularly in sparsely labeled or geospatially complex regions. Some fine-class transitions appear less spatially stable, and occasional misclassifications are visible, especially at sharp terrain transitions or where GEDI coverage is sparse. Nevertheless, the structural richness preserved in these outputs illustrates the model’s strong capacity to learn fine-scale spatial patterns and generate ecologically meaningful predictions, despite the challenges of label sparsity and class imbalance.
Importantly, across all discretization settings, the predicted maps show strong alignment with known environmental gradients in the region. Areas of dense tropical forest, particularly within the core zones of Cuc Phuong National Park, are consistently mapped with higher canopy classes, while anthropogenically influenced buffer zones and agricultural encroachments are marked with lower canopy categories. This consistency underscores the model’s ability to generalize its learning beyond the GEDI footprint locations and extrapolate accurate forest structure predictions across the broader landscape.
In summary, the qualitative evaluation confirms that SenFus-CHCNet not only achieves high numerical accuracy but also preserves spatial structure, captures ecologically relevant vertical gradients, and adapts to varying levels of classification granularity. These characteristics make it a compelling tool for operational forest monitoring, where the interplay between resolution, realism, and reliability is critical. Depending on the use case–whether national-scale reporting, biodiversity conservation, or precision restoration–the appropriate level of classification granularity can be selected, with SenFus-CHCNet demonstrating robust performance across the spectrum.
6 Future work and limitations
Despite the promising results achieved by the proposed SenFus-CHCNet, several limitations remain and open avenues for future research. First, our model currently does not incorporate any form of uncertainty estimation, which is particularly important given the sparse and potentially noisy nature of the footprint data used for training. Without uncertainty quantification, the model may produce unreliable predictions in certain regions where the forest structure is highly complex or where the quality of the satellite imagery is suboptimal. Future work will explore integrating uncertainty modeling techniques such as Monte Carlo dropout, deep ensembles, or ordinal-to-continuous variance propagation to provide reliable confidence estimates alongside canopy height predictions.
Second, the classification-based formulation used in this study, while offering strong ecological interpretability and robustness under sparse-label conditions, inherently limits the granularity of the predictions to predefined height bins. Although the current binning strategy (5, 12, and 17 classes) was informed by both the data distribution and expert knowledge from local forest specialists, it still relies largely on empirical experience rather than standardized ecological criteria. We plan to further investigate biologically grounded class boundaries based on ecological succession and forest structural studies, and to explore multi-task extensions where a single model can jointly perform both classification and regression to balance interpretability and precision.
Addressing these limitations will not only enhance the robustness and reliability of the proposed approach but also extend its applicability to broader forest monitoring and ecological assessment tasks.
7 Conclusion
In this study, we introduced SenFus-CHCNet, a novel deep learning framework for high-resolution forest canopy height classification through the fusion of multi-source satellite imagery–Sentinel-1 SAR, Sentinel-2 multispectral data, and GEDI LiDAR observations. Addressing the challenges of multi-resolution input integration, label sparsity, and ecological interpretability, our architecture combines resolution-aware embedding, progressive feature upscaling, and sparse supervision within a U-Net-based semantic segmentation pipeline.
We proposed and evaluated three discretization strategies–coarse, medium, and fine-grained–that translate continuous canopy height values into ecologically meaningful classification labels. Across all configurations, SenFus-CHCNet demonstrated superior performance compared to state-of-the-art convolutional and transformer-based baselines, achieving up to 4.5% improvement in relaxed accuracy and 10% gain in F1-score. Beyond quantitative results, qualitative analyses confirmed that our model preserves fine-scale spatial structure, aligns with known ecological and topographic patterns, and maintains generalizability across heterogeneous landscapes.
By leveraging sparse GEDI supervision, enhancing spectral feature integration with SE-based fusion modules, and adopting a multi-resolution processing strategy, SenFus-CHCNet offers a scalable, robust, and ecologically informed solution for canopy height classification. Its strong performance across diverse forest conditions in northern Vietnam underscores its potential for large-scale deployment in tropical forest monitoring, biodiversity assessment, and carbon stock estimation–particularly in data-limited or resource-constrained settings.
Future work will explore extending the model to global forest ecosystems, incorporating temporal dynamics for change detection, and integrating uncertainty quantification to support decision-making in climate policy, conservation planning, and ecosystem management.
Data availability statement
Publicly available datasets were analyzed in this study. This data can be found here: https://dx.doi.org/10.21227/mf73-rz62.
Author contributions
BB-Q: Conceptualization, Data curation, Methodology, Software, Visualization, Writing – original draft, Writing – review and editing. KN-V: Data curation, Formal Analysis, Visualization, Writing – original draft, Writing – review and editing. AV-D: Data curation, Writing – review and editing. NK: Funding acquisition, Methodology, Project administration, Supervision, Validation, Writing – original draft, Writing – review and editing.
Funding
The author(s) declare that financial support was received for the research and/or publication of this article. This work is sponsored by VinUniversity under Grant No. VUNI.CEI.FS_0004.
Acknowledgments
The authors would like to express their sincere gratitude to the Center for Environmental Intelligence (CEI) at VinUniversity for their invaluable support and resources. This work greatly benefited from the expertise and facilities provided by CEI, which were instrumental in conducting our research. We appreciate their dedication to advancing environmental intelligence and fostering innovative research collaborations.
Conflict of interest
The authors declare that the research was conducted in the absence of any commercial or financial relationships that could be construed as a potential conflict of interest.
Generative AI statement
The author(s) declare that Generative AI was used in the creation of this manuscript. During the preparation of this work, the author(s) used ChatGPT 4 in order to improve the English grammar and avoid spelling mistakes. After using this tool/service, the author(s) reviewed and edited the content as needed and take(s) full responsibility for the content of the publication.
Any alternative text (alt text) provided alongside figures in this article has been generated by Frontiers with the support of artificial intelligence and reasonable efforts have been made to ensure accuracy, including review by the authors wherever possible. If you identify any issues, please contact us.
Publisher’s note
All claims expressed in this article are solely those of the authors and do not necessarily represent those of their affiliated organizations, or those of the publisher, the editors and the reviewers. Any product that may be evaluated in this article, or claim that may be made by its manufacturer, is not guaranteed or endorsed by the publisher.
Footnotes
1https://sotnmt.ninhbinh.gov.vn/tin-trong-nuoc/vuon-quoc-gia-cuc-phuong-rung-nguyen-sinh-dep-nhat-viet-nam-106.html
2https://www.vacne.org.vn/gioi-thieu-vqg-cuc-phuong/214218.html
References
Asner, G. P., Powell, G. V. N., Mascaro, J., Knapp, D. E., Clark, J. K., Jacobson, J., et al. (2010). High-resolution forest carbon stocks and emissions in the amazon. Proc. Natl. Acad. Sci. U. S. A. 107 (38), 16738–16742. doi:10.1073/pnas.1004875107
Bont, L., Hill, A., Waser, L., Bürgi, A., Ginzler, C., and Blattert, C. (2020). Airborne-laser-scanning-derived auxiliary information discriminating between broadleaf and conifer trees improves the accuracy of models for predicting timber volume in mixed and heterogeneously structured forests. For. Ecol. Manag. 459, 117856. doi:10.1016/j.foreco.2019.117856
Catalano, I., Sier, H., Yu, X., Westerlund, T., and Queralta, J. P. (2023). “Uav tracking with solid-state lidars: dynamic multi-frequency scan integration,” in 2023 21st International Conference on Advanced Robotics (ICAR), Abu Dhabi, United Arab Emirates, 417–424. doi:10.1109/ICAR58858.2023.10406884
Chere, Z., Zewdie, W., and Biru, D. (2023). Machine learning for modeling forest canopy height and cover from multi-sensor data in northwestern Ethiopia. Environ. Monit. Assess. 195 (1452), 1452. doi:10.1007/s10661-023-12066-z
Clark, D. A., and Clark, D. B. (1994). Climate-induced annual variation in canopy tree growth in a costa rican tropical rain forest. J. Ecol. 82 (4), 865–872. doi:10.2307/2261450
Diakogiannis, F. I., Waldner, F., Caccetta, P., and Wu, C. (2020). Resunet-a: a deep learning framework for semantic segmentation of remotely sensed data. ISPRS J. Photogrammetry Remote Sens. 162, 94–114. doi:10.1016/j.isprsjprs.2020.01.013
Duncanson, L., Neuenschwander, A., Hancock, S., Thomas, N., Fatoyinbo, T., Simard, M., et al. (2020). Biomass estimation from simulated gedi, icesat-2 and nisar across environmental gradients in sonoma county, california. Remote Sens. Environ. 242, 111779. doi:10.1016/j.rse.2020.111779
Duwe, V. K., Vu, L. V., Rintelen, T., Raab-Straube, E., Schmidt, S., Nguyen, S. V., et al. (2022). Contributions to the biodiversity of Vietnam - results of vietbio inventory work and field training in cuc phuong national park. Biodivers. data J. 10, e77025. doi:10.3897/bdj.10.e77025
Fayad, I., Ienco, D., Baghdadi, N., Gaetano, R., Alcarde Alvares, C., Stape, J., et al. (2021). A cnn-based approach for the estimation of canopy heights and wood volume from gedi waveforms. Remote Sens. Environ. 265, 112652. doi:10.1016/j.rse.2021.112652
Fayad, I., Ciais, P., Schwartz, M., Wigneron, J.-P., Baghdadi, N., Truchis, A., et al. (2024). Hy-tec: a hybrid vision transformer model for high-resolution and large-scale mapping of canopy height. Remote Sens. Environ. 302, 113945. doi:10.1016/j.rse.2023.113945
Feng, G., Zhang, J., Girardello, M., Pellissier, V., and Svenning, J. C. (2020). Forest canopy height co-determines taxonomic and functional richness, but not functional dispersion of mammals and birds globally. Glob. Ecol. Biogeogr. 29 (8), 1350–1359. doi:10.1111/geb.13110
Garrido, A., Gobakken, T., ørka, H., Næsset, E., and Bollandsȧs, O. (2020). Reuse of field data in als-assisted forest inventory. Silva Fenn. 54. doi:10.14214/sf.10272
Ghosh, S. M., Behera, M. D., and Paramanik, S. (2020). Canopy height estimation using sentinel series images through machine learning models in a mangrove forest. Remote Sens. 12, 1519. doi:10.3390/rs12091519
Gibbs, H. K., Brown, S., Niles, J. O., and Foley, J. A. (2007). Monitoring and estimating tropical forest carbon stocks: making redd a reality. Environ. Res. Lett. 2, 045023. doi:10.1088/1748-9326/2/4/045023
Gibril, M. B. A., Shafri, H. Z. M., Al-Ruzouq, R., Shanableh, A., Nahas, F., and Al Mansoori, S. (2023). Large-scale date palm tree segmentation from multiscale uav-based and aerial images using deep vision transformers. Drones 7, 93. doi:10.3390/drones7020093
Hansen, M. C., Potapov, P. V., Moore, R., Hancher, M., Turubanova, S. A., Tyukavina, A., et al. (2013). High-resolution global maps of 21st-century forest cover change. Science 342, 850–853. doi:10.1126/science.1244693
He, K., Zhang, X., Ren, S., and Sun, J. (2016). “Deep residual learning for image recognition,” in Proceedings of the IEEE conference on computer vision and pattern recognition (CVPR), 770–778. doi:10.1109/CVPR.2016.90
Huang, G., Liu, Z., Van Der Maaten, L., and Weinberger, K. Q. (2017). “Densely connected convolutional networks,” in 2017 IEEE conference on computer vision and pattern recognition (CVPR), 2261–2269. doi:10.1109/CVPR.2017.243
Kawulok, M., Tarasiewicz, T., Nalepa, J., Tyrna, D., and Kostrzewa, D. (2021). “Deep learning for multiple-image super-resolution of sentinel-2 data,” in 2021 IEEE International Geoscience and Remote Sensing Symposium IGARSS, 3885–3888. doi:10.1109/IGARSS47720.2021.9553243
Kovanič, Ľ., Topitzer, B., Pet́ovský, P., Blišt́an, P., Gergeĺová, M. B., and Blišt́anová, M. (2023). Review of photogrammetric and lidar applications of uav. Appl. Sci. 13 (11), 6732. doi:10.3390/app13116732
Lanaras, C., Bioucas-Dias, J., Galliani, S., Baltsavias, E., and Schindler, K. (2018). Super-resolution of sentinel-2 images: learning a globally applicable deep neural network. ISPRS J. Photogrammetry Remote Sens. 146, 305–319. doi:10.1016/j.isprsjprs.2018.09.018
Lang, N., Jetz, W., Schindler, K., and Wegner, J. D. (2023). A high-resolution canopy height model of the earth. Nat. Ecol. & Evol. 7, 1778–1789. doi:10.1038/s41559-023-02206-6
LeCun, Y., Bengio, Y., and Hinton, G. (2015). Deep learning. Nature 521, 436–444. doi:10.1038/nature14539
MacArthur, R. H., and MacArthur, J. W. (1961). On bird species diversity. Ecology 42 (3), 594–598. doi:10.2307/1932254
Mahesh, R., and Hänsch, R. (2023). Deep learning for forest canopy height estimation from sar. IEEE Int. Geoscience Remote Sens. Symposium (IGARSS). doi:10.1109/IGARSS52108.2023.10281899
Mou, L., and Zhu, X. X. (2018). Im2height: height estimation from single monocular imagery via fully residual convolutional-deconvolutional network. arXiv Prepr. doi:10.48550/arXiv.1802.10249
Nandy, S., Srinet, R., and Padalia, H. (2021). Mapping forest height and aboveground biomass by integrating icesat-2, sentinel-1 and sentinel-2 data using random forest algorithm in northwest himalayan foothills of India. Geophys. Res. Lett. 48, e2021GL093799. doi:10.1029/2021GL093799
Oehmcke, S., Nyegaard-Signori, T., Grogan, K., and Gieseke, F. (2021). “Estimating forest canopy height with multi-spectral and multi-temporal imagery using deep learning,” in 2021 IEEE international conference on big data (big data) (Orlando, FL, USA), 4915–4924. doi:10.1109/BigData52589.2021.9672018
Oquab, M., Darcet, T., Moutakanni, T., Vo, H., Szafraniec, M., Khalidov, V., et al. (2023). Dinov2: learning robust visual features without supervision. arXiv Prepr.
Penne, C., Ahrends, B., Deurer, M., and Boettcher, J. (2010). The impact of the canopy structure on the spatial variability in forest floor carbon stocks. Geoderma 158 (3-4), 282–297. doi:10.1016/j.geoderma.2010.05.007
Potapov, P., Hansen, M. C., Pickens, A., Hernandez-Serna, A., Tyukavina, A., Turubanova, S., et al. (2022). The global 2000-2020 land cover and land use change dataset derived from the landsat archive: first results. Front. Remote Sens. 3, 856903. doi:10.3389/frsen.2022.856903
Reed, C., Gupta, R., Li, S., Brockman, S., Funk, C., Clipp, B., et al. (2022). Scale-mae: a scale-aware masked autoencoder for multiscale geospatial representation learning. arXiv Prepr. doi:10.48550/arXiv.2212.14532
Roll, U., Geffen, E., and Yom-Tov, Y. (2015). Linking vertebrate species richness to tree canopy height on a global scale. Glob. Ecol. Biogeogr. 24 (7), 814–825. doi:10.1111/geb.12325
Ronneberger, O., Fischer, P., and Brox, T. (2015). “U-net: convolutional networks for biomedical image segmentation,”Lecture notes in computer science in Medical image computing and computer-assisted intervention - MICCAI 2015 (Munich, Germany: Springer), 9351, 234–241. doi:10.1007/978-3-319-24574-4_28
Schacher, A., Roger, E., Williams, K. J., Stenson, M. P., Sparrow, B., and Lacey, J. (2023). Use-Specific considerations for optimising data quality trade-offs in citizen science: recommendations from a targeted literature review to improve the usability and utility for the calibration and validation of remotely sensed products. Remote Sens. 15, 1407. doi:10.3390/rs15051407
Shang, C., Coops, N., Wulder, M., White, J., and Hermosilla, T. (2020). Update and spatial extension of strategic forest inventories using time series remote sensing and modeling. Int. J. Appl. Earth Observation Geoinformation 84, 101956. doi:10.1016/j.jag.2019.101956
Sier, H., Yu, X., Catalano, I., Queralta, J. P., Zou, Z., and Westerlund, T. (2023). “Uav tracking with lidar as a camera sensor in gnss-denied environments,” in 2023 international conference on localization and GNSS (ICL-GNSS), 1–7. doi:10.1109/ICL-GNSS57829.2023.10148919
Simard, M., Pinto, N., Fisher, J. B., and Baccini, A. (2011). Mapping forest canopy height globally with spaceborne lidar. J. Geophys. Res. Biogeosciences 116, 04021. doi:10.1029/2011JG001708
Sirko, W., Kashubin, S., Ritter, M., Annkah, A., Bouchareb, Y. S. E., Dauphin, Y. N., et al. (2021). Continental-scale building detection from high resolution satellite imagery. arXiv Prepr.
Solomon, N., Birhane, E., Teklay, M., Negussie, A., and Gidey, T. (2024). Exploring the role of canopy cover and environmental factors in shaping carbon storage in desa’a forest, Ethiopia. Carbon Balance Manag. 19 (1), 30. doi:10.1186/s13021-024-00277-x
Sun, Z., Sonsuthi, A., Jucker, T., Ali, A., Cao, M., Liu, F., et al. (2023). Top canopy height and stem size variation enhance aboveground biomass across spatial scales in seasonal tropical forests. Plants 12, 1343. doi:10.3390/plants12061343
Tolan, J., Yang, H.-I., Nosarzewski, B., Couairon, G., Vo, H. V., Brandt, J., et al. (2024). Very high resolution canopy height maps from rgb imagery using self-supervised vision transformer and convolutional decoder trained on aerial lidar. Remote Sens. Environ. 300, 113888. doi:10.1016/j.rse.2023.113888
Trier, D., Salberg, A. B., Haarpaintner, J., Aarsten, D., Gobakken, T., and Næsset, E. (2018). Multi-sensor forest vegetation height mapping methods for Tanzania. Eur. J. Remote Sens. 51, 587–606. doi:10.1080/22797254.2018.1461533
Valbuena, R., O’Connor, B., Zellweger, F., Simonson, W., Vihervaara, P., Maltamo, M., et al. (2020). Standardizing ecosystem morphological traits from 3d information sources. Trends Ecol. & Evol. 35, 656–667. doi:10.1016/j.tree.2020.03.006
Vargas-Larreta, B., López-Martínez, J., González, E., Corral-Rivas, J., and Hernández, F. (2020). Assessing above-ground biomass-functional diversity relationships in temperate forests in northern Mexico. For. Ecosyst. 8, 1–14. doi:10.21203/rs.3.rs-42734/v2
Wang, W., Tang, C., Wang, X., and Zheng, B. (2022). A vit-based multiscale feature fusion approach for remote sensing image segmentation. IEEE Geoscience Remote Sens. Lett. 19, 1–5. doi:10.1109/LGRS.2022.3187135
Xu, Z., Zhang, W., Zhang, T., Yang, Z., and Li, J. (2021). Efficient transformer for remote sensing image segmentation. Remote Sens. 13, 3585. doi:10.3390/rs13183585
Yanai, R. D., Wayson, C., Lee, D., Espejo, A. B., Campbell, J. L., Green, M. B., et al. (2020). Improving uncertainty in forest carbon accounting for redd+ mitigation efforts. Environ. Res. Lett. 15, 124002. doi:10.1088/1748-9326/abb96f
Zhang, J., Kissling, W. D., and He, F. (2013). Local forest structure, climate and human disturbance determine regional distribution of boreal bird species richness in alberta, Canada. J. Biogeogr. 40 (6), 1131–1142. doi:10.1111/jbi.12063
Zhou, M., Yan, K., Huang, J., Yang, Z., Fu, X., and Zhao, F. (2022). “Mutual information-driven pan-sharpening,” in IEEE/CVF conference on computer vision and pattern recognition (CVPR), 1788–1798. doi:10.1109/CVPR52688.2022.00184
Keywords: canopy height estimation, pixel-wise classification, multi-resolutionfusion, sparse supervision, GEDI, Sentinel-1, Sentinel-2
Citation: Bui-Quoc B, Nguyen-Vi K, Vu-Duc A and Kamel N (2025) SenFus-CHCNet: a multi-resolution fusion framework for sparse-supervised canopy height classification. Front. Remote Sens. 6:1666123. doi: 10.3389/frsen.2025.1666123
Received: 15 July 2025; Accepted: 26 September 2025;
Published: 17 October 2025.
Edited by:
Philemon Tsele, University of Pretoria, South AfricaReviewed by:
Mcebisi Qabaqaba, University of Pretoria, South AfricaXiao Kun, First Affiliated Hospital of Sun Yat-sen University, China
Copyright © 2025 Bui-Quoc, Nguyen-Vi, Vu-Duc and Kamel. This is an open-access article distributed under the terms of the Creative Commons Attribution License (CC BY). The use, distribution or reproduction in other forums is permitted, provided the original author(s) and the copyright owner(s) are credited and that the original publication in this journal is cited, in accordance with accepted academic practice. No use, distribution or reproduction is permitted which does not comply with these terms.
*Correspondence: Nidal Kamel, bmlkYWwua0B2aW51bmkuZWR1LnZu