 Michal Skladan1
 Arunima Singh
 Matej Masný
 Jozef Vyboštok
- 1Department of Forest Harvesting, Logistics and Ameliorations, Faculty of Forestry, Technical University in Zvolen, Zvolen, Slovakia
- 2Q-ForestLab, Department of Environment, Faculty of Bioscience Engineering, Ghent University, Ghent, Belgium
- 3Department of Geography, Faculty of Natural Science, Matej Bel University, Banská Bystrica, Slovakia
Short-rotation plantations of fast-growing trees (FGT) offer a sustainable biomass source to mitigate climate change and boost rural energy self-sufficiency. Accurate estimation of woody above-ground biomass (AGB) is critical for efficient management and utilization of these plantations. This study evaluates modern mobile laser scanning (MLS) techniques for dry-weight AGB estimation, comparing a commercial MLS system with a low-cost prototype built on the Livox Mid-360 sensor. Research was carried out in a dense, second-rotation poplar clone plantation. Thirty-one research plots were scanned using both MLS setups, then harvested and oven-dried to obtain reference dry weights. Point clouds were processed via a voxel-based approach at four resolutions (5, 10, 15 and 20 cm) to develop regression models correlating total voxel volume with dry biomass. The low-cost prototype delivered its best performance at 5 cm voxel size (R2 = 0.84; rRMSE = 12.2%), markedly outperforming the commercial system at the same resolution (R2 = 0.68; rRMSE = 17.5%). The commercial MLS achieved its optimum at 20 cm voxels (R2 = 0.82; rRMSE = 12.9%). Predictive models were validated using 16 plots for training and 15 for testing. The prototype yielded the highest precision for dry weight prediction (R2 = 0.89; rRMSE = 12.9%) at 5 cm resolution, while the commercial MLS excelled in fresh-weight estimation at 15 cm resolution (R2 = 0.92; rRMSE = 12.0%). These results demonstrate that affordable MLS solutions can provide biomass estimates comparable to those of higher-cost systems for dry AGB assessment in high-density poplar stands. Implementing low-cost laser scanning improves monitoring frequency, reduces operational expenses, and enables large-scale application in short-rotation forestry. This approach supports evidence-based decision-making for sustainable bioenergy production. Future work will explore integrating multispectral data and automated processing pipelines to further enhance biomass estimation accuracy and scalability across diverse forest conditions.
1 Introduction
Fast-growing tree (FGT) plantations play a crucial role in increasing the supply of renewable energy to meet the expected global energy demand, projected to rise by approximately 56% by 2040, compared to 2010 (Rodrigues et al., 2021). Biomass from FGT provides a sustainable energy source that contributes to carbon neutrality and can potentially result in negative carbon footprints over its lifecycle. These plantations not only sequester CO2 in biomass and soil, but also offer co-benefits such as enhanced biodiversity, landscape diversity, reduced soil erosion, improved flood management, and mitigate global warming (Fuertes et al., 2023; Sramek et al., 2023). Furthermore, FGT plantations foster employment and sustainable development in rural areas and play a crucial role in the transition towards renewable energy systems by complementing intermittent sources like solar and wind (Fuertes et al., 2023; Scarlat et al., 2015).
Efficient cultivation of FGT requires selecting appropriate sites and continuously monitoring production characteristics, especially biomass estimation. Accurately estimating woody aboveground biomass (AGB) is crucial for optimizing logistics and timing of harvests, as well-managed harvesting can result in significant time and cost savings (Sramek et al., 2023).
Traditional methods for estimating AGB, whether destructive or non-destructive, depend on field measurements. Although these methods are highly accurate, they are also time-consuming and labour-intensive (Adhikari et al., 2024; Dillen et al., 2007). Another approach for estimating AGB involves the use of allometric models, which estimate parameters such as diameter at breast height (DBH), tree height, or mixed models that incorporate elevation and other environmental gradients (Adhikari et al., 2024; Sramek et al., 2023). However, these methods often require measuring all shoots of multi-stemmed trees, which can also be laborious, time-consuming, and costly, especially in plantations that have undergone their first rotation cycle, where multiple shoots often emerge from each stool. Additionally, significant variability caused by genotype-environment interactions poses challenges for biomass prediction, as many existing models are site- and genotype-specific, limiting their broader applicability (Menéndez-Miguélez et al., 2023). Modern technologies, particularly laser scanning, can offer a promising solution for the rapid and reliable estimation of biomass in FGT plantations. While many studies focus on mobile laser scanning (MLS) and terrestrial laser scanning (TLS) for inferring tree parameters in forest environments, there is limited research on their application in FGT plantations.
Menéndez-Miguélez et al. (2023) propose the development of an AGB model for high-density, multi-stemmed poplar plantations, utilizing metrics derived from TLS. The TLS-derived models presented in their study outperform traditional allometric models for estimating AGB. Additionally, they employ varying voxel sizes, bounding boxes, and point cloud slicing for biomass estimation. Puletti et al. (2021) evaluate the reliability of TLS for estimating crown cover (CC) in hybrid poplar plantations using a voxel-based approach, investigating how different voxel sizes and densities affect the accuracy of CC retrieval. Seidel and Ammer (2014) quantify the effect of shadowing on automated basal area measurements obtained from TLS in a densely stocked poplar plantation. Adhikari et al. (2024) developed a model to predict woody AGB of 2-year-old poplar plantations using allometric metrics and MLS. Other studies focus on investigating undergrowth in forest and shrubland environments, with structures similar to those in FGT plantations. For instance, Adhikari et al. (2023) explore the use of MLS to assess understory vegetation biomass in southeastern U.S. coastal forests. By scanning 60 plots in a pine plantation and conducting destructive sampling, their research identifies an MLS-based model for predicting AGB with high accuracy. Another study by Olsoy et al. (2014) examines the decline of sagebrush in the western U.S. using TLS point clouds. They utilize voxels and 3D convex hull models to predict AGB, with results indicating that the 3D convex hull model provides more accurate biomass estimates than the voxel-based method.
While these advancements in TLS and MLS technology demonstrate promising potential for biomass estimation and monitoring of FGT plantations, the high costs associated with most commercial systems pose a significant barrier to widespread adoption, especially in large-scale or resource-limited settings. Therefore, the increasing demand for efficient and cost-effective inventory solutions has driven research into more affordable MLS technologies (Balestra et al., 2024; Tatsumi et al., 2022). Low-cost MLS devices utilizing affordable LiDAR sensors (e.g., Livox MID 360, Livox AVIA), originally developed for autonomous vehicles (Lo et al., 2025), presents a promising alternative. If their effectiveness can be demonstrated, these devices could be widely adopted in forestry applications (Będkowski, 2024; Wang et al., 2023). However, their performance and accuracy in measuring critical tree parameters, such as DBH and tree height, have not yet been thoroughly tested against commercial and professional scanners under field conditions (Balestra et al., 2024).
The main goal of this work is to provide an affordable solution for estimating AGB in FGT plantations. This study utilizes a low-cost MLS prototype based on the Livox MID360 sensor, in comparison with a commercial MLS (Stonex X120GO), to estimate dry woody AGB in a high-density poplar plantation during its second rotation cycle.
AGB was estimated using a simple and time-saving method, which involved regression models linking the dry and wet (fresh) weights of AGB to voxelized point cloud volume; four different voxel sizes (5, 10, 15, and 20 cm) were tested and compared.
2 Methodology
2.1 Study site
The plantation is located in central Slovakia, within the cadastral area of the village of Budča (48.59°N, 19.06°E) (Figure 1). Established in the spring of 2018, it is situated at an elevation of 312 m above sea level. The average annual temperature in this area is 8.3 °C, with annual precipitation ranging from 670 to 850 mm. The soil at the study site is classified as clayey loam with good granularity. This plantation includes a total of 19 approved poplar clones for establishing FGT plantation, comprising clones from the Aigeiros section (black poplar), such as Blanc du Poitou, I-476, Dolomiten, Gelrica, and Spreewald. Each of the clones represents one double row in the plantation. The Tacamahaca section (balsam poplars) is represented by the clones Oxford, Androscoggin, NE-42, and Fritzi Pauley, as well as the Japanese clones MAX1 to MAX5. The plantation is part of a demonstration site for FGT species in Budča, managed by the Technical University in Zvolen. It is arranged in double rows with spacings of 1.2 × 0.5 m, and the distance between double rows is 2.4 m. In autumn 2022, the plantation was harvested, and it is currently in its third year of the second rotation cycle, during which multiple thin shoots grow from each stool, giving the poplar vegetation a dense, bush-like structure rather than a typical tree form. Over its lifespan, some double rows have experienced a significant reduction in the number of individuals, and one double row has been eliminated. This study was conducted in February 2025, when the plantation was leafless.
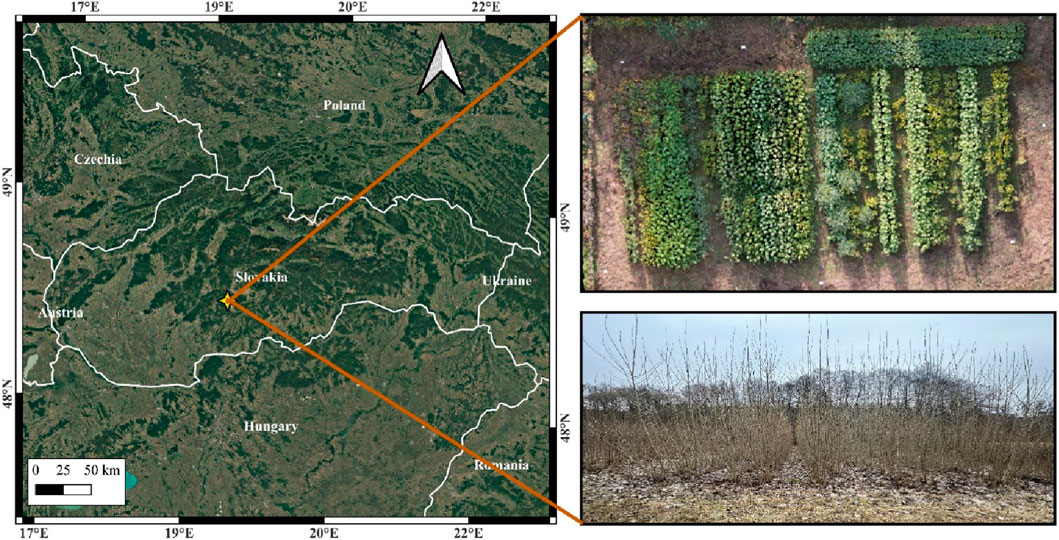
Figure 1. Study site–poplar plantation Budča.
2.2 Research plots establishment
For this research, 31 research plots were established in the plantation. Each plot consisted of two stools of trees, with two plots established for each double row; for those rows that were significantly reduced, only one plot was created. To allow easier recognition of the research plots within the point clouds, wooden stakes were placed into the ground around each plot, and plastic tape was stretched between the stakes (Figure 2). The surrounding areas of the plots were cleared to enable easier extraction of the point clouds for each plot from the overall point cloud of the plantation.

Figure 2. Research plots within the plantation.
2.3 Collection of the 3D data
For MLS data collection, the Stonex X120GO and the prototype based on the Livox MID360 sensor were used. The scanners were held by hand and operated while walking along the double rows and between them, excluding the significantly reduced rows. Scanning began and ended at the same position. The same scanning trajectory was used for both devices. Scanning the entire plantation with each MLS took approximately 8 min. The MLS trajectory is illustrated in Figures 3, 4 illustrates scanning in the plantation and the MLS prototype.
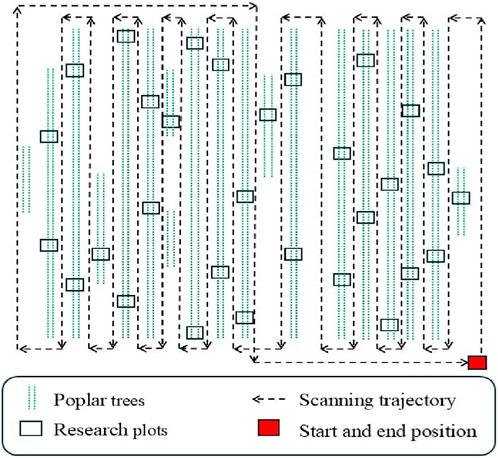
Figure 3. MLS scanning trajectory.
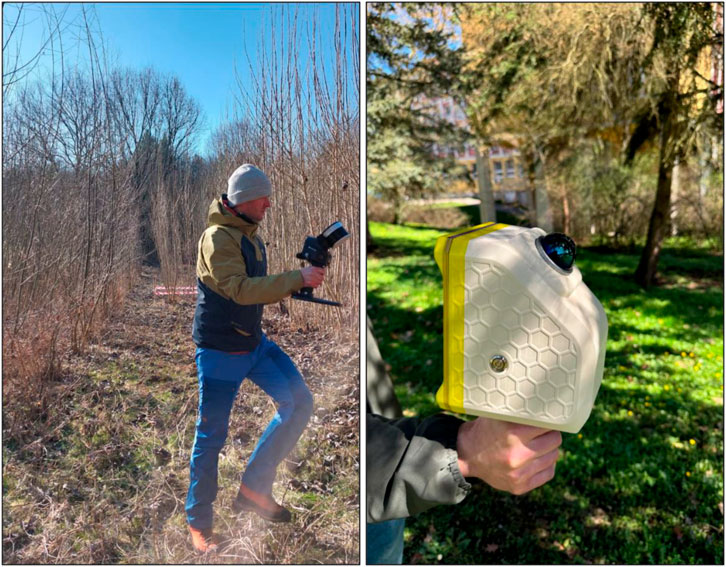
Figure 4. Scanning in the plantation - MLS on the left, and a detail of the low-cost MLS prototype is on the right.
2.4 Reference data collection using the destructive method
After scanning, each research plot was harvested. A hanging scale was used to measure the wet weight immediately in the field, and the weight for each plot was recorded. Four samples, approximately 20 cm in length, were collected from each plot: one from the bottom, one from the middle, one from the top of the stem, and a fourth sample from a side branch. These samples were numbered, sealed in plastic bags, and transported to the laboratory as soon as possible. There, their weights were measured to the nearest hundredth of a gram. The samples were then dried in an oven at 104 °C until they reached a constant weight, after which they were weighed again. This data was used to determine the water content of the study plots and to calculate the dry weight of the harvested biomass (Figure 5). Illustrates the process of harvesting, weighing, and drying.

Figure 5. Harvesting of research plots: Weighing of the harvested plot in the field (left), weighing of samples in the laboratory (middle), and drying of samples (right).
2.5 Processing of point clouds from scanners and voxelization
To extract point clouds from the MLS, raw data were pre-processed using software provided by the scanner manufacturers. Data from the Stonex X120 GO were pre-processed with the GOpost software (X120GO SLAM Laser Scanner, 2023). A freely available open-source SLAM algorithm - Lidar Odometry (Będkowski, 2024) with default settings was used to generate point clouds from the MLS prototype data. This software is specifically optimized for processing data from the Livox MID360 sensor.
The point clouds for the entire plantation from each device, as well as those for each research plot, were processed using CloudCompare 2.13.1 (CloudCompare Development Team, 2021). This software was used to crop the plantation from the entire point cloud, followed by cropping each individual plot, utilizing the segment tool for this purpose. To remove noise from the point clouds, the Statistical Outlier Removal (SOR) filter in CloudCompare was applied. Samples of the point clouds from both scanners are shown in Figure 6.

Figure 6. Sample of the point clouds from both scanners: Stonex X120GO on the left, Livox MID360 prototype on the right.
Voxelization of the point clouds for each research plot (Figure 7) was performed using the lidR (Roussel et al., 2020) package in R. For each point cloud, the resolution for the voxels considered was 5, 10, 15, and 20 cm.
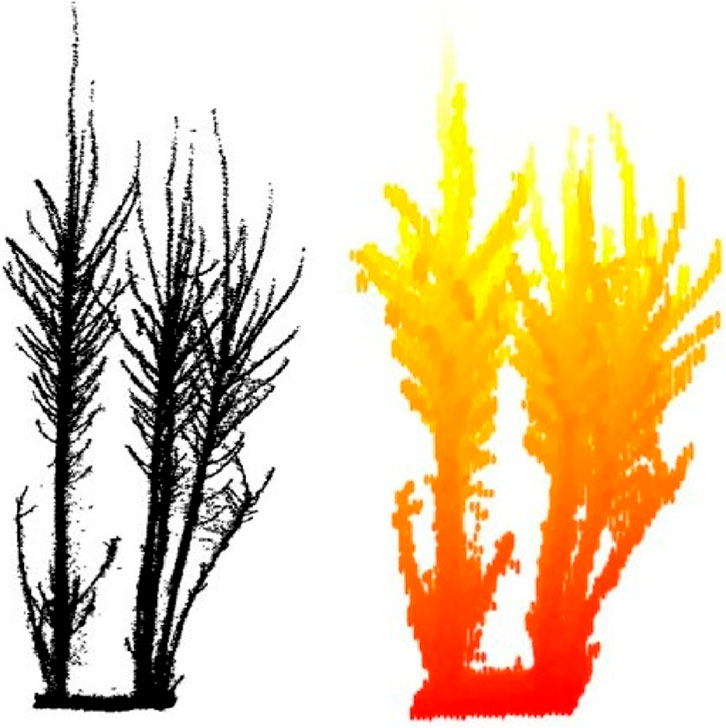
Figure 7. Sample of the voxelized point cloud. Non-voxelized point cloud on the left, 5 cm voxelized point cloud on the right.
2.6 Creation of regression-based predictive models
The weight of woody AGB was estimated using voxel-based volume calculations derived from point clouds obtained by all tested scanners. For developing regression and predictive models, the point clouds of individual research plots, along with an Excel file containing reference weights of wet and dry biomass, were imported into RStudio. Using the lidR package in R, voxelized point clouds were generated for each research plot with different voxel sizes (5, 10, 15, and 20 cm). These voxel sizes were selected based on previous publications (Adhikari et al., 2023; Menéndez-Miguélez et al., 2023) and preliminary results from the experiment which showed that correlation accuracy and the volume of voxelized clouds, along with AGB weight estimates, were considerably lower for both larger and smaller voxel sizes. Figure 7 demonstrates an example, with a non-voxelized point cloud on the left and a 5 cm voxelized point cloud on the right.
Each point cloud was filtered to remove noise and points representing the ground using the ‘CSF’ function, which is an algorithm for classifying ground points. The ‘KNN IDW’ function was then used with parameters k = 10 and p = 2 to normalize the height of the point clouds. Voxels were then divided into empty (without points) and non-empty (with points); only non-empty voxels were used to estimate the volume of the research plots. The volume of each voxel was obtained, and the final volume was estimated by summing the volume of all non-empty voxels. The volume calculated based on voxels was then used to estimate the total volume of the research plot.
Subsequently, regression models were created to analyze the relationships between the volume of voxelized point clouds and both the dry and wet weight of AGB. This analysis included all 31 research plots.
To create a predictive model for dry and wet woody AGB estimation, the randomForest package, also in the R programming language, was used. In this predictive model, 16 research plots were used as training data, while 15 plots served as a test data set, on which predictions for dry and wet biomass were evaluated.
The AGB weight for the entire plantation was estimated based on the regression relationship between the volume of voxelized point clouds of the research plots and their reference weights. This relationship was then applied using the linear model function ‘lm_model’ and extrapolated to determine the weight of the voxelized point cloud of the entire plantation. The workflow followed is depicted in Figure 8.
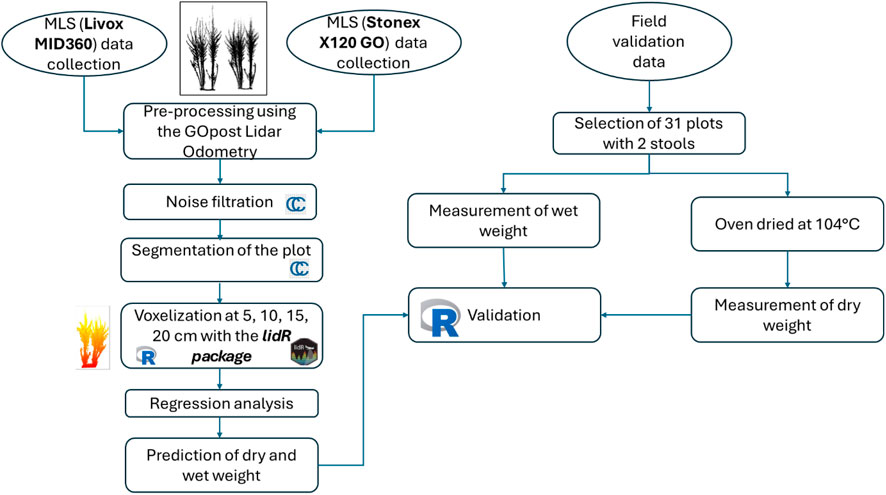
Figure 8. The workflow of the study.
2.7 Statistical analysis
For each scanner and each voxel size, the relationship between actual and estimated dry weight and wet weight of AGB was evaluated using the Root Mean Squared Error (RMSE). The correlation coefficient (R2) and relative Root Mean Squared Error (rRMSE) were also calculated. The statistical analysis was conducted using R software. Equations used for regression and predictive models evaluation:
Where,
3 Results
3.1 Dry weight estimation
Dry weight of AGB was determined by drying samples taken from the research plots, which allowed the determination of the relative moisture and water content of the samples. From the wet weight of AGB of the research plots, the percentage of water calculated from the samples was subtracted to obtain an estimate of the dry weight for each of the study areas. From Figure 9, it can be concluded that there is a high correlation between the wet (weighted) and dry (estimated) weights, indicating a high reliability of the estimation.

Figure 9. Correlation graph between wet-weighted and dry-calculated weight of AGB of research plots in KA Budča.
The average wet weight of the study area, measured immediately after harvesting, was 13.39 kg, with a minimum of 3.90 kg and a maximum of 20.60 kg. By drying the samples, the relative humidity was determined. The average relative humidity of the study area was 56.77%, with values ranging from a minimum of 50.69% to a maximum of 60.92%. The relative humidity among different samples designated as A (bottom of the stem), B (middle), C (top), and D (side branch) showed no significant differences, with averages of 58.09% for A, 58.26% for B, 56.62% for C, and 54.13% for D. The mean dry weight of the study area was 5.77 kg, with a minimum of 1.53 kg and a maximum of 8.57 kg.
3.2 Regression between voxelized point cloud volume and weight of research plots
The results demonstrate that all devices, across all voxel size settings, achieve a correlation higher than R2 = 0.68. The lowest correlation, R2 = 0.68, was observed with the Stonex X120GO for dry weight using a 5 cm voxel size, resulting in an RMSE of 1.01 kg and an rRMSE of 17.46%. Conversely, the highest correlation was achieved with the prototype MLS (Livox MID360) for dry weight using a 10 cm voxel size, with an RMSE of 1.3 kg and an rRMSE of 11.2%. Generally, the highest correlations for all devices were observed with wet weight measurements (Figure 10; Table 1).

Figure 10. Correlation between dry weight, wet weight, and total volume of research plots, with R2, RMSE, and rRMSE.
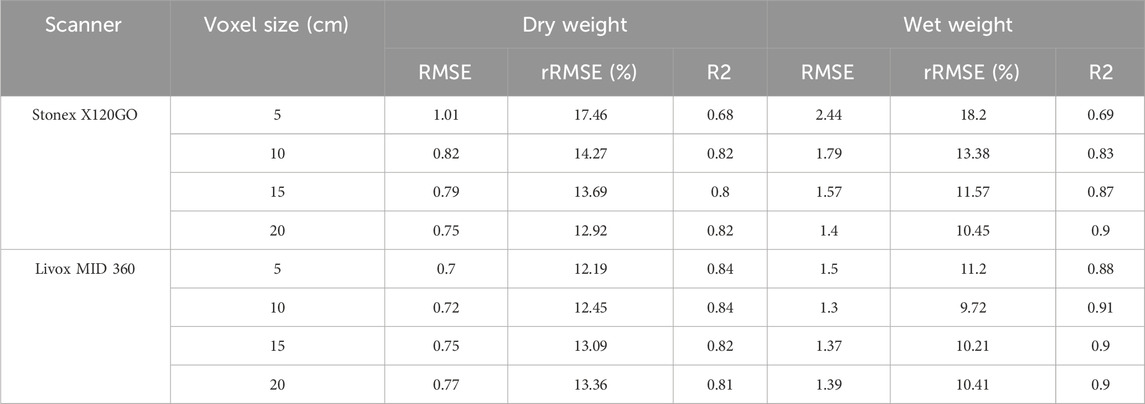
Table 1. Correlation between dry weight, wet weight, and total volume of research plots, with R2, RMSE, and rRMSE.
Voxel size played a key role in having a higher impact on the correlation for the Stonex X120GO, where the least accurate correlation was noted with a 5 cm voxel size. Among the other voxel sizes (10, 15, and 20 cm), no significant difference in accuracy was observed for this device.
For the prototype (Livox MID360), the greatest accuracy in dry weight estimation was achieved with smaller voxels of 5 and 10 cm, and for wet weight, the highest accuracy was with a 10 cm voxel size. However, there was no significant difference noticed in the accuracy across the various voxel size settings.
3.3 Prediction of dry and wet weight of AGB
The relationships illustrating the accuracy of dry weight predictions are shown in Figure 11, with additional information provided in Table 2. Similarly, the relationships for wet weight predictions are presented in Figure 12, and detailed descriptions are mentioned in Table 3.
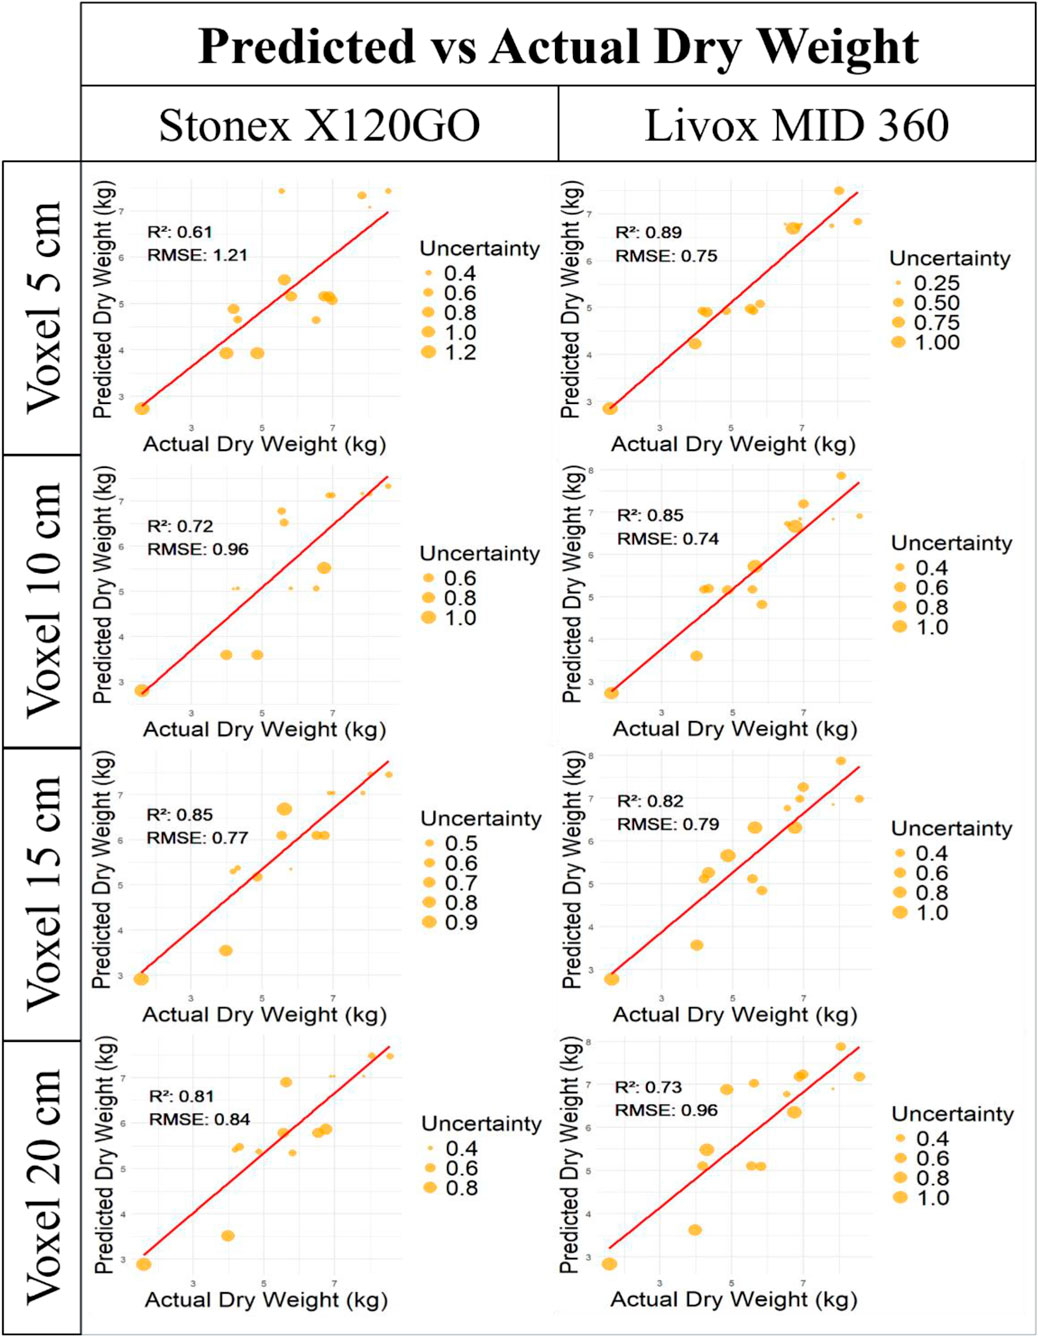
Figure 11. Relationships between predicted dry weight and actual dry weight, showing the R2, RMSE, and rRMSE.

Table 2. Dry weight prediction.
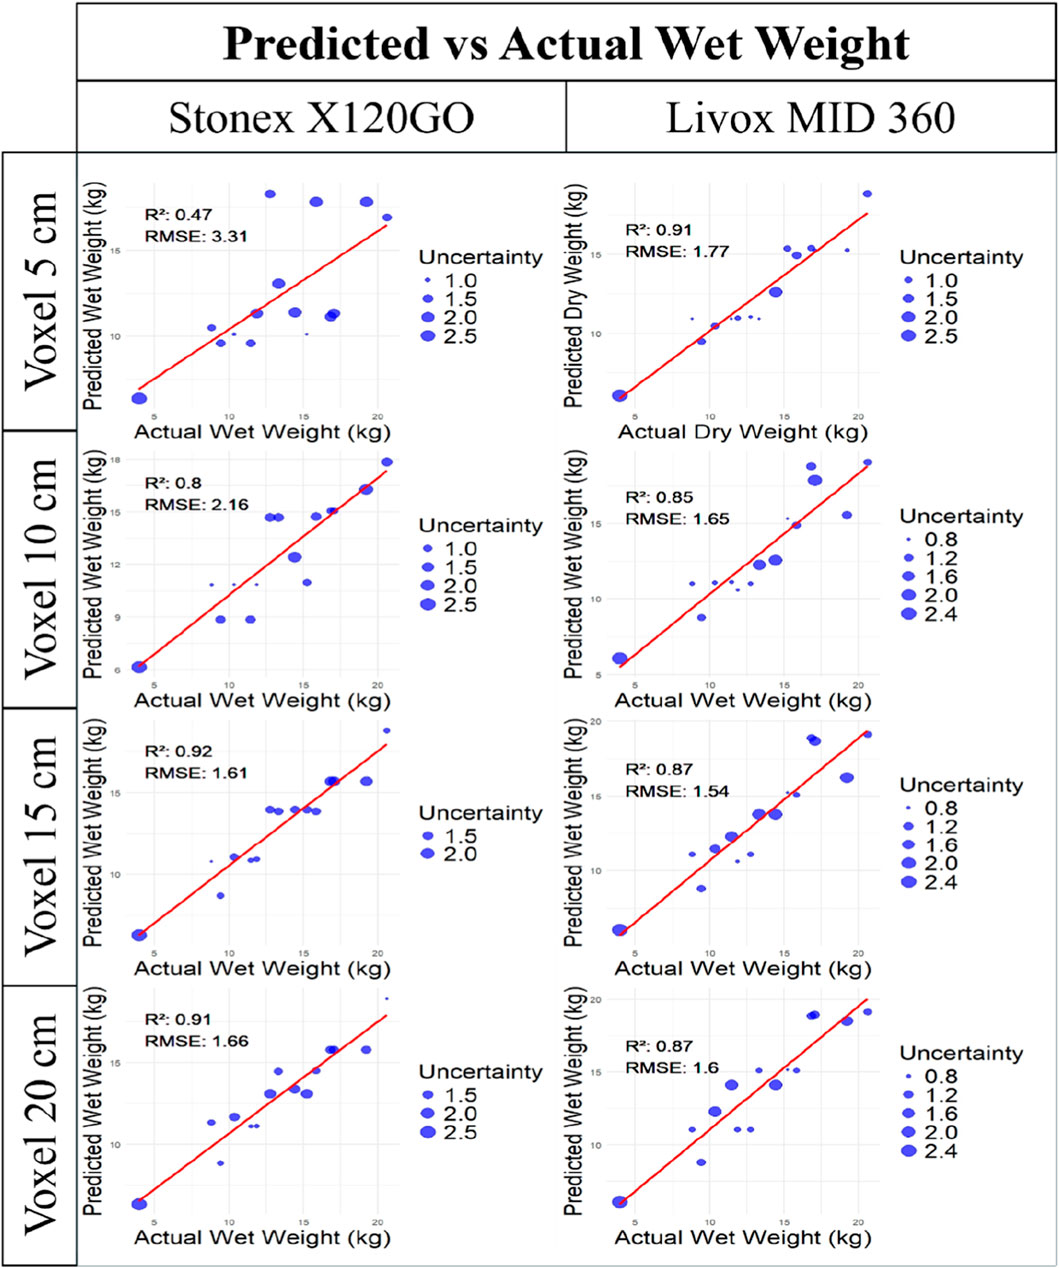
Figure 12. Relationships between predicted wet weight and actual wet weight, showing the R2, RMSE, and rRMSE.
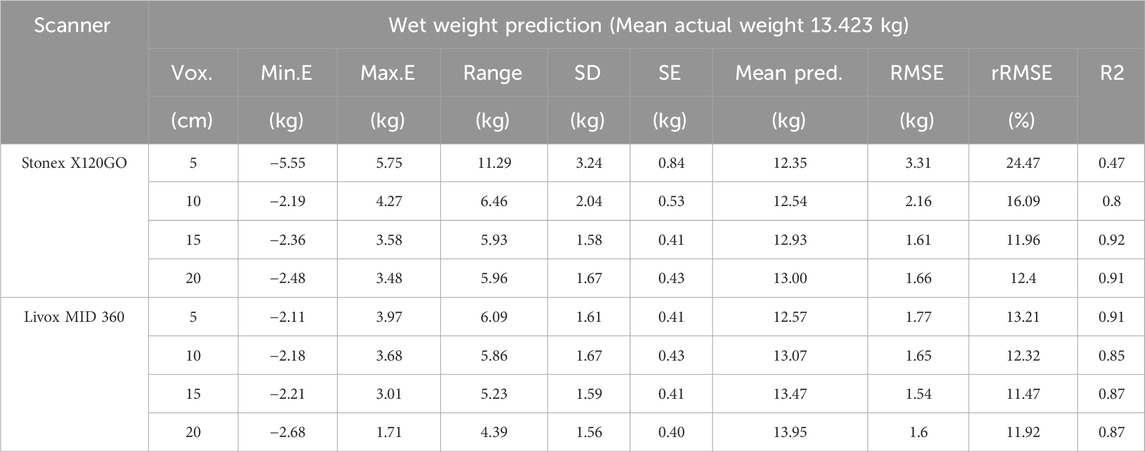
Table 3. Wet weight prediction.
Similar to the correlation between weight and volume for all plots, the predictive models with testing groups showed higher accuracy for wet weight predictions of the research plots. The highest correlation for wet weight prediction was found with the Stonex X120GO using a 15 cm voxel size, achieving an R2 of 0.92 and an RMSE of 1.61 kg, representing an rRMSE of 11.96%. Results with a 20 cm voxel size for the same device were very similar. The prototype (Livox MID360) also achieved accurate results across all voxel sizes, with the highest correlation in wet weight prediction.
Overall, it is possible to conclude that for both wet and dry weight predictions, the 5 cm voxel size for the Stonex X120GO is the least reliable. Correlations for this voxel size ranged from 0.47 for wet weight with Stonex to 0.61 for dry weight with Stonex. Conversely, the prototype provided satisfactory predictions for weight across all voxel sizes. In contrast, in this study, we achieved the highest correlation for wet weight with R2 of 0.92 by Stonex X120 MLS and voxel size 15 cm, and for dry weight, it was R2 of 0.89 by prototype MLS Livox MID360 with 5 cm voxel size.
3.4 AGB estimation for the whole plantation
AGB estimation for the entire plantation was calculated using the regression relationship between the volume of voxelized point clouds from the research plots and their reference weights. This relationship was then applied to determine the weight of the voxelized cloud for the entire plantation. Table 4 presents the weights of wet and dry woody AGB for both scanners and various voxel size settings.
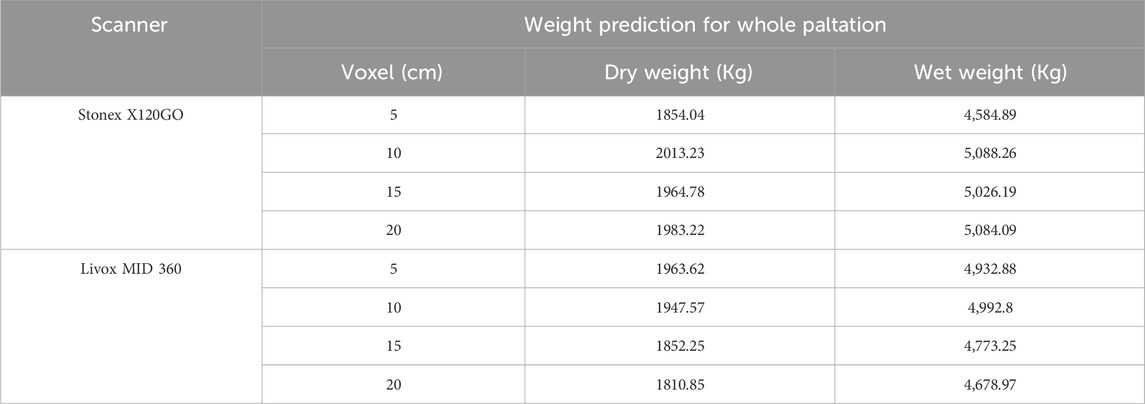
Table 4. Estimated dry and wet weight of AGB for the entire KA Budča plantation.
The weight estimation of woody AGB for the entire plantation could not be reliably verified since the plantation is still growing and has not yet been harvested. Based on the average wet weight of a research plot, which is 13.423 kg, and the average dry weight of a research plot, which is 5.834 kg, along with the number of double-stools (each research plot consisted of one double-stool), of which there were 325 in the plantation at the time of scanning, it is roughly estimated that the total wet weight is 4,362.5 kg and the dry weight is 1896 kg. This information cannot be used as a reference but serves to approximately confirm the reliability of AGB weight estimation using the examined technologies.
4 Discussion
The results of this study demonstrate that the evaluated devices, MLS (Stonex X120GO), and the low-cost MLS prototype (Livox MID360), can be utilized to predict the wet or dry weight of woody AGB in FGT plantations, particularly poplar, in their second rotation cycle. We emphasized the dry weight of woody AGB over volume because it provides a more stable, accurate, and reliable assessment of actual biomass productivity, which is especially valuable for energy and industrial applications. Our main objective was to predict dry weight; however, we also developed models for wet weight estimation, which achieved higher accuracy. This may be because wet weight was directly measured using a scale in the field, whereas dry weight was estimated based on drying four samples from each research plot, potentially leading to less precise reference weights.
The weight prediction accuracy was similar for both the low-cost MLS prototype (Livox MID360) and the Stonex X120GO MLS. Both scanners demonstrated comparable performance, with the exception of the 5 cm voxel size used by the Stonex X120GO, which yielded slightly lower accuracy. Importantly, for the prototype, all voxel sizes produced reliable weight estimations.
From a cost perspective, the Stonex X120GO MLS is priced between €30,000 and €35,000 (Skladan et al., 2025). In contrast, the low-cost prototype, developed for around €2,500, offers an extremely practical solution, especially when budget constraints are a concern, making it convenient and accessible for users.
To the best of the authors’ knowledge, no similar study has been published evaluating the mentioned technologies for woody AGB prediction in coppice poplar plantations during the second rotation cycle. However, there is a similarity to the study by Menéndez-Miguélez et al. (2023), which utilized metrics derived from TLS to estimate AGB in a poplar plantation during its second rotation cycle. They examined the correlation between voxelized point clouds and coppice biomass, using voxel sizes of 2 cm, 5 cm, 10 cm, and 25 cm. The best correlation (r = 0.263) was achieved with 25 cm voxels. However, these voxelization-derived metrics were not used in the final biomass estimation models.
There are other related studies that have employed similar methods in different environments, which are nonetheless comparable to coppice FGT plantations. Adhikari et al. (2023) utilized similar models for estimating AGB and assessed understory weight using 10 and 20 cm voxels. They found that the highest correlation between voxel volume and AGB was achieved with the 20 cm voxel size, yielding an R2 of 0.70. Another study by Olsoy et al. (2014) also employed a voxel-based method, along with other techniques, to predict total AGB biomass of shrubs, achieving a correlation between predicted and actual biomass with an R2 of 0.86, using a voxel size of 1 cm.
5 Conclusion
This study highlights the effectiveness of two MLS technologies: MLS (Stonex X120GO) and the low-cost MLS prototype (Livox MID360) in predicting the wet and dry weight of woody AGB in fast-growing tree plantations, particularly poplar in their second rotation cycle. While both evaluated devices demonstrated utility, the low-cost prototype stands out for providing reliable predictions across multiple voxel sizes, making it an extremely practical solution for woody AGB estimation.
The dry weight estimation accuracy achieved with the prototype Livox MID360 and Stonex X120GO was comparable with rRMSE (13.26%) for voxel size 15 cm and rRMSE (12.75%) for voxel size 10 cm, respectively. The wet weight estimation accuracy achieved with the prototype Livox MID360 and Stonex X120GO were comparable with rRMSE (11.96%) for voxel size 15 cm and rRMSE (11.47%) for voxel size 15 cm,respectively. Additionally, the dry weight estimation for the entire plantation achieved based on our experiment for Livox MID36 and Stonex X120GO were 1852.25 Kg and 2013.23 Kg respectively. The wet weight estimation for the entire plantation achieved based on our experiment for Livox MID36 and Stonex X120GO were 4,773.25 Kg and 5,026.19 Kg respectively.
Perhaps, the prototype’s affordability (approximately €2,500) makes it particularly attractive for users with budget constraints. Notably, this low-cost device facilitates effective biomass monitoring also an accessible entry point for individuals without extensive technical expertise.
Overall, the findings suggest that integrating modern, cost-effective laser scanning technologies could significantly enhance biomass estimation and contribute to better FGT plantation management practices.
Data availability statement
The data analyzed in this study is subject to the following licenses/restrictions: None. Requests to access these datasets should be directed to am96ZWYudnlib3N0b2tAdHV6dm8uc2s=.
Ethics statement
Written informed consent was obtained from the individual for the publication of any potentially identifiable images or data included in this article.
Author contributions
MS: Writing – original draft, Data curation, Methodology. AS: Writing – review and editing, Formal Analysis. JC: Writing – review and editing. ML: Formal Analysis, Data curation, Writing – review and editing. MM: Writing – review and editing. JV: Project administration, Data curation, Resources, Methodology, Writing – original draft, Funding acquisition, Supervision.
Funding
The authors declare that financial support was received for the research and/or publication of this article. The paper was supported by the Slovak Research and Development Agency APVV-20-0391, VV-MVP-24-0412, APVV-24-0290, and by the Ministry of Education of Slovak Republic grant project VEGA 1/0604/24 and VEGA 1/0177/24; Funded by the EU NextGenerationEU through the Recovery and Resilience Plan for Slovakia under the project no.09I03-03-V04-00341.
Conflict of interest
The authors declare that the research was conducted in the absence of any commercial or financial relationships that could be construed as a potential conflict of interest.
Generative AI statement
The authors declare that Generative AI was used in the creation of this manuscript. Generative artificial intelligence was used solely for language editing of this manuscript.
Any alternative text (alt text) provided alongside figures in this article has been generated by Frontiers with the support of artificial intelligence and reasonable efforts have been made to ensure accuracy, including review by the authors wherever possible. If you identify any issues, please contact us.
Publisher’s note
All claims expressed in this article are solely those of the authors and do not necessarily represent those of their affiliated organizations, or those of the publisher, the editors and the reviewers. Any product that may be evaluated in this article, or claim that may be made by its manufacturer, is not guaranteed or endorsed by the publisher.
References
Adhikari, A., Peduzzi, A., Montes, C. R., Osborne, N., and Mishra, D. R. (2023). Assessment of understory vegetation in a plantation forest of the southeastern United States using terrestrial laser scanning. Ecol. Inf. 77, 102254. doi:10.1016/j.ecoinf.2023.102254
Adhikari, S., Ma, Q., Poudel, K., and Renninger, H. J. (2024). Aboveground woody biomass estimation of young bioenergy plantations of populus and its hybrids using mobile (backpack) LiDAR remote sensing. Trees, For. People 18, 100665. doi:10.1016/j.tfp.2024.100665
Balestra, M., Cabo, C., Murtiyoso, A., Vitali, A., Alvarez-Taboada, F., Cantero-Amiano, A., et al. (2024). Advancing forest inventory: a comparative study of low-cost MLS lidar device with professional laser scanners. In: The International Archives of the Photogrammetry, Remote Sensing and Spatial Information Sciences, XLVIII-2-W8-2024, 9–15. ISPRS TC II 8th International ISPRS Workshop LowCost 3D - Sensors, Algorithms, Applications. Brescia, Italy: ISPRS. p. 9–15. doi:10.5194/isprs-archives-XLVIII-2-W8-2024-9-2024
Będkowski, J. (2024). Open source, open hardware hand-held mobile mapping system for large scale surveys. SoftwareX 25, 101618. doi:10.1016/j.softx.2023.101618
Cloud Compare Development Team (2021). CloudCompare (Version 2.12) [Computer software]. Santry, Ireland: CloudCompare Development Team. Available online at: https://www.cloudcompare.org/.
Dillen, S. Y., Marron, N., Bastien, C., Ricciotti, L., Salani, F., Sabatti, M., et al. (2007). Effects of environment and progeny on biomass estimations of five hybrid poplar families grown at three contrasting sites across Europe. For. Ecol. Manag. 252 (1), 12–23. doi:10.1016/j.foreco.2007.06.003
Fuertes, A., Oliveira, N., Canellas, I., Sixto, H., Rodriguez-Soalleiro, R., Hanewinkel, M., et al. (2023). Assessing the potential of poplar short rotation plantations to contribute to a low-carbon bioeconomy under water-limited conditions. J. Environ. Manag. 347, 119062. doi:10.1016/j.jenvman.2023.119062
Lo, Y., Cao, Y., Zhou, X., Zhang, C., and Chen, M. (2025). Performance analysis of low-cost solid-state LiDAR for building elements point-cloud mapping. In: W. Chen, A. PP Abdul Majeed, A. H. Ping Tan, F. Zhang, Y. Yan, Y. Luoet al. editors. Selected proceedings from the 2nd international conference on intelligent manufacturing and robotics, ICIMR 2024. Suzhou, China: Springer Nature. p. 325–338. doi:10.1007/978-981-96-3949-6_25
Menéndez-Miguélez, M., Madrigal, G., Sixto, H., Oliveira, N., and Calama, R. (2023). Terrestrial laser scanning for non-destructive estimation of aboveground biomass in short-rotation poplar coppices. Remote Sens. 15 (7), 1942. doi:10.3390/rs15071942
Olsoy, P. J., Glenn, N. F., Clark, P. E., and Derryberry, D. R. (2014). Aboveground total and green biomass of dryland shrub derived from terrestrial laser scanning. ISPRS J. Photogrammetry Remote Sens. 88, 166–173. doi:10.1016/j.isprsjprs.2013.12.006
Puletti, N., Grotti, Mi., Ferrara, C., and Chianucci, F. (2021). Influence of voxel size and point cloud density on crown cover estimation in poplar plantations using terrestrial laser scanning. Ann. Silvic. Res. 46 (2). doi:10.12899/asr-2256
Rodrigues, A. M., Costa, M. M. G., and Nunes, L. J. R. (2021). Short rotation woody coppices for biomass production: an integrated analysis of the potential as an energy alternative. Curr. Sustainable/Renewable Energy Rep. 8 (1), 70–89. doi:10.1007/s40518-020-00171-3
Roussel, J.-R., Auty, D., Coops, N. C., Tompalski, P., Goodbody, T. R. H., Meador, A. S., et al. (2020). lidR: an R package for analysis of airborne laser scanning (ALS) data. Remote Sens. Environ. 251, 112061. doi:10.1016/j.rse.2020.112061
Scarlat, N., Dallemand, J.-F., Monforti-Ferrario, F., and Nita, V. (2015). The role of biomass and bioenergy in a future bioeconomy: policies and facts. Environ. Dev. 15, 3–34. doi:10.1016/j.envdev.2015.03.006
Seidel, D., and Ammer, C. (2014). Efficient measurements of basal area in short rotation forests based on terrestrial laser scanning under special consideration of shadowing. iForest - Biogeosciences For. 7 (4), 227–232. doi:10.3832/ifor1084-007
Skladan, M., Chudá, J., Singh, A., Masný, M., Lieskovský, M., Pástor, M., et al. (2025). Choosing the right close-range technology for measuring DBH in fast-growing trees plantations. Trees, For. People 19, 100747. doi:10.1016/j.tfp.2024.100747
Sramek, M., Weger, J., Bubenik, J., Matouskova, M., Lengalova, K., and Matula, R. (2023). Effective woody biomass estimation in poplar short-rotation coppices-Populus nigra x P. maximowiczii. Iforest Biogeosci Forestry 16, 202–209. doi:10.103832/ifor4200016
Tatsumi, S., Yamaguchi, K., and Furuya, N. (2022). ForestScanner: a mobile application for measuring and mapping trees with LiDAR-equipped iPhone and iPad. Methods Ecol. Evol. 14, 1603–1609. doi:10.1111/2041-210X.13900
Wang, X., Yao, H., Ma, Y., and Liang, X. (2023). A comparison study of low-cost personal laser scanning systems for forest plot-level inventories. In: The International Archives of the Photogrammetry, Remote Sensing and Spatial Information Sciences, XLVIII-1-W2-2023, 1809–1815. ISPRS Geospatial Week 2023. Cairo, Egypt: ISPRS. p. 1809–1815. doi:10.5194/isprs-archives-XLVIII-1-W2-2023-1809-2023
X120GO SLAM Laser Scanner (2023). Stonex. Available online at: https://www.stonex.it/project/x120go-slam-laser-scanner/.
Keywords: mobile laser scanning, low-cost LiDAR, fast-growing trees plantation, voxelization, dry weight estimation
Citation: Skladan M, Singh A, Chudá J, Lieskovský M, Masný M and Vyboštok J (2025) A low-cost MLS prototype for voxel-based above-ground biomass estimation in short-rotation plantations. Front. Remote Sens. 6:1669081. doi: 10.3389/frsen.2025.1669081
Received: 18 July 2025; Accepted: 31 October 2025;
Published: 10 December 2025.
Edited by:
Yaohui Liu, Aerospace Information Technology University, ChinaReviewed by:
Sumit Chakravarty, Uttar Banga Krishi Viswavidyalaya, IndiaLiu Wenchao, China Agricultural University, China
Copyright © 2025 Skladan, Singh, Chudá, Lieskovský, Masný and Vyboštok. This is an open-access article distributed under the terms of the Creative Commons Attribution License (CC BY). The use, distribution or reproduction in other forums is permitted, provided the original author(s) and the copyright owner(s) are credited and that the original publication in this journal is cited, in accordance with accepted academic practice. No use, distribution or reproduction is permitted which does not comply with these terms.
*Correspondence: Jozef Vyboštok, am96ZWYudnlib3N0b2tAdHV6dm8uc2s=