 Sujung Go
 Alexei Lyapustin
 Myungje Choi
 Sergey Korkin
 Yujie Wang
 Edward J. Hyer
- 1Goddard Earth Sciences Technology and Research (GESTAR) II, University of Maryland Baltimore County, Baltimore, MD, United States
- 2Climate and Radiation Laboratory, NASA Goddard Space Flight Center, Greenbelt, MD, United States
- 3Marine Meteorology Division, US Naval Research Laboratory, Monterey, CA, United States
This study investigates the vertical distribution and seasonal climatology of absorbing iron-oxide minerals, specifically hematite and goethite, in atmospheric dust using the updated MAIAC EPIC version 3 algorithm. Leveraging data from July 2015 to December 2023, the key innovation is the improved Level 2 product which now incorporates Aerosol Layer Height (ALH), enabling the first-ever long-term characterization of their vertical and seasonal distribution globally. Our analysis reveals distinct seasonal and spatial patterns across major dust-emitting regions. Critically, we find that the spectral absorption properties, such as the imaginary refractive index (k) and Single Scattering Albedo (SSA), are strongly proportional to the mass fraction of iron oxides, highlighting the potential of SSA at UV wavelengths as a valuable tool for global monitoring. Furthermore, we confirm that hematite exhibits significant seasonal vertical variability; its concentration is high near the surface in winter but extends up to 2–4 km into the free troposphere in summer, a finding consistent with independent CALIOP observations. The resulting comprehensive climatology provides novel observational constraints for Earth System Models (ESMs), particularly for accurately modeling dust-radiative forcing. The developed methodology is readily applicable to other UV-NIR satellite platforms, such as PACE, GEMS, and TEMPO, demonstrating its broad utility for future atmospheric composition monitoring efforts.
1 Introduction
Global aerosol climatology, based on satellite monitoring (Mishchenko et al., 2002; Remer et al., 2008), provides a comprehensive description of aerosol characteristics and their temporal changes worldwide. This climatology has been used in enhancing our understanding and modeling of the climate forcing associated with aerosols. It encompasses both direct radiative forcing by aerosols and indirect radiative forcing due to aerosol effects on cloud properties (Gautam et al., 2011; Ginoux et al., 2012; Hsu et al., 2012; Kumar et al., 2015; Lee et al., 2016; 2018; Pu et al., 2020; Sogacheva et al., 2020). The primary goals of global aerosol climatology (Mishchenko et al., 2002) are to: (1) analyze satellite radiance observations and field measurements to infer the global distribution of aerosol properties and their seasonal and interannual variations; (2) support advanced modeling studies of aerosol formation, processing, and transport. The ultimate aim is to develop an advanced global aerosol climatology for the entire period of available satellite data, making it suitable for studies of the direct and indirect effects of aerosols on climate and ensuring its wide accessibility (Mishchenko et al., 2002).
Over the past 4 decades, global aerosol climatology derived from satellite monitoring has primarily focused on the aerosol optical depth (AOD), obtained from instruments like the Total Ozone Mapping Spectrometer (TOMS) (Torres et al., 2002), Advanced Very High-Resolution Radiometer (AVHRR) (Zhao et al., 2008), Moderate Resolution Imaging Spectroradiometer (MODIS), and Multi-angle Imaging SpectroRadiometer (MISR) (Lee et al., 2016). Due to the limited lifespan of individual instruments, typically ranging from 5 to 15 years, recent studies have combined AOD data from multiple satellite sensors to create continuous records (Sogacheva et al., 2020) or examined the consistency of AOD between MODIS and VIIRS (Lyapustin et al., 2023; Levy et al., 2015). In addition to AOD, research has examined the spatial and temporal distributions and trends of aerosol size parameters, such as the fine-mode fraction (FMF) and Ångström exponent (AE), as well as absorption properties including single scattering albedo (SSA), Aerosol Index, and absorbing aerosol optical depth (AAOD) (Banerjee et al., 2021; Herman and Celarier, 1997; Kumar et al., 2014; 2015; Schutgens et al., 2020; Torres et al., 2007). Furthermore, the vertical distribution of aerosols has been analyzed using measurements from the Cloud-Aerosol Lidar with Orthogonal Polarization (CALIOP), such as aerosol layer height (ALH) (Song et al., 2021).
Since 2018, the Multi-Angle Implementation of Atmospheric Correction (MAIAC) algorithm has been incorporated into the operational Level 2 products for MODIS, Visible Infrared Imaging Radiometer Suite (VIIRS), Earth Polychromatic Imaging Camera (EPIC), and Ocean Color Imager (OCI) instruments, providing both aerosol (e.g., AOD) and surface information (e.g., Bidirectional Reflectance Distribution Function (BRDF) and bidirectional reflectance factors (BRF)) (Lyapustin et al., 2011a; Lyapustin et al., 2011b, Lyapustin et al., 2012; Lyapustin et al., 2018). Utilizing the aerosol multiple scattering signal in ultraviolet (UV) channels, Lyapustin et al. (2021a) developed a new algorithm for “joint retrieval of AOD and spectral aerosol absorption” parameterized by refractive index imaginary part at 680 nm (k0), and spectral absorption exponent (SAE), assuming an ALH of 1 and 4 km to represent boundary layer and transported aerosol modes, for the Deep Space Climate Observatory (DSCOVR) EPIC instruments (Marshak et al., 2018). This algorithm uses the spectral imaginary refractive index k from 340 to 680 nm, a crucial input for calculating spectral SSA. Go et al. (2022) extended this spectral aerosol absorption algorithm into a dust speciation algorithm, assuming an ALH of 1 km, which retrieves the volume fraction of hematite (α-Fe2O3) and goethite (α-FeOOH) in the atmospheric column, based on the Maxwell-Garnett effective medium approximation theory. Most recently, the MAIAC EPIC version 3 operational algorithm has advanced the “joint retrieval algorithm”, which simultaneously retrieves AOD, k0, SAE, and ALH by combining UV-blue (340, 388, 443 nm) and oxygen-A and -B (680, 687, 764, 779 nm) bands (Lyapustin et al., 2025).
This study builds on a series of papers examining iron-oxide content in atmospheric mineral dust (Go et al., 2022). While previous work utilized the version 2 MAIAC EPIC dataset with an assumed ALH of 1 km and was limited to one-year climatology for 2018, the current study leverages the complete record of version 3 MAIAC EPIC data since 2015 and leverages the improved MAIAC version 3 ALH retrieval (Lyapustin et al., 2025), allowing for the construction and analysis of an updated climatology for absorbing dust mineral species hematite and goethite.
Dust aerosols consist of soil particles suspended in the atmosphere (Kok et al., 2023; Scanza et al., 2015), and the spectral properties of atmospheric dust—both absorbing and scattering—are determined by its mineral composition (Di Biagio et al., 2023). Several Earth system models (ESMs) have incorporated regionally and temporally variable spectral refractive indices for dust, which are parameterized based on soil mineralogy components (Perlwitz et al., 2015a; Perlwitz et al., 2015b), including those from Claquin et al. (1999) and Journet et al. (2014). Iron-oxide species, such as hematite and goethite, exhibit significant absorption in the UV–visible spectrum, making them crucial for estimating the shortwave direct radiative effect (DRE) of dust (Castellanos et al., 2024; Go et al., 2022; Li et al., 2021). A similar analysis of the black and brown carbon content in biomass-derived smoke from the EPIC is provided in a companion paper (Choi et al., 2024).
To investigate the spatial and temporal variability of dust mineral composition—including iron-oxide species—on a global scale, several satellite missions have been developed. One key mission is the Earth Surface Mineral Dust Source Investigation (EMIT) (Green et al., 2020), launched to the International Space Station (ISS) in July 2022. EMIT provides surface soil spectra from dust-emitting regions worldwide (Connelly et al., 2021). Prior to EMIT, various studies focused on detecting small submicron clay-sized (<2 μm diameter) and silt-sized (2–50 μm diameter) minerals using MODIS visible and short-wave infrared (VSWIR) spectra over Southeast Asia (Sanwlani and Das, 2022). Other efforts applied extensive visible, near-infrared, shortwave-infrared, and thermal infrared (VNIR–SWIR–TIR) data acquired by the multi-spectral Advanced Spaceborne Thermal Emission and Reflection Radiometer (ASTER) for geothermal exploration in East Africa (Hewson et al., 2020), and performed mineral identification and mapping with the Airborne Visible/Infrared Imaging Spectrometer (AVIRIS-NG) (Tripathi and Govil, 2019).
One operational satellite mission “algorithm” is the MAIAC EPIC iron-oxide species algorithm, which has been active since June 2015, focusing on UV–visible channels (Go et al., 2022). Another relevant algorithm is the Generalized Retrieval of Aerosol and Surface Properties (GRASP) component processing, which was used with the Polarization and Directionality of the Earth’s Reflectances and the Polarization and Anisotropy of Reflectances for Atmospheric Science (POLDER-3/PARASOL) satellite, operational from March 2005 to October 2013 and covering visible to near-infrared (NIR) channels (Li et al., 2019; 2022). GRASP products enable the direct retrieval of aerosol speciation, including component fractions, without the need for intermediate retrieval of aerosol optical characteristics. In comparison to low-Earth orbit (LEO) satellites such as GRASP POLDER-3/PARASOL, EPIC can characterize the diurnal variability of aerosol loadings. Since 2015, EPIC has been observing the sunlit side of Earth at Lagrangian Point 1 (L1) and remains the only spacecraft or Earth-observing platform offering comprehensive coverage from sunrise to sunset—once every hour during the summer and once every 2 hours in the winter.
The remainder of this paper is organized as follows: Section 2 provides a brief description of the MAIAC EPIC version 3 algorithm and its accuracy. Section 3 details the seasonal, monthly, and vertical distributions of atmospheric mineral dust iron-oxide species for designated dust regions or representative sites. Section 4 discusses the results in the context of satellite aerosol retrieval and mineral dust characterization. Finally, Section 5 presents the conclusions.
2 Description of the MAIAC EPIC version 3 data
As mentioned in the introduction, this study builds on a series of papers examining iron-oxide content in atmospheric mineral dust (Go et al., 2022). While previous work utilized the version 2 MAIAC EPIC dataset with an assumed ALH of 1 km and was limited to one-year climatology for 2018, the current study leverages the complete record of version 3 MAIAC EPIC data since 2015 and contains a developed ALH retrieval (Lyapustin et al., 2025), allowing for the construction and analysis of an updated climatology for absorbing dust mineral species hematite and goethite.
2.1 EPIC instruments
Located approximately 1.5 million kilometers from Earth towards the Sun, which is called Lagrange 1 orbit (L1), EPIC observes the entire sunlit hemisphere of Earth using 10 narrowband spectral channels ranging from 317.5 to 779.5 nm. The DSCOVR orbit at L1 enables global, multi-temporal daytime measurements, with up to 10 observations per day during boreal summer and 6–7 observations per day in winter at mid-latitudes, while tropical latitudes show minimal seasonal variations in observational frequency. EPIC’s spatial resolution ranges from 8 to 16 km at nadir but deteriorates towards the edges of each image. For detailed information on EPIC measurements, see Marshak et al. (2018).
2.2 Updated MAIAC EPIC version 3 processing algorithm
The MAIAC EPIC version 3 processing algorithm begins by gridding the EPIC L1B datasets into a 10 km × 10 km spatial resolution for each spectral channel. Building on the MAIAC MODIS algorithm (Lyapustin et al., 2018), the standard MAIAC algorithm performs cloud detection, atmospheric correction, and aerosol optical depth (AOD) retrieval using regionally designated background aerosol models (background AOD; Lyapustin et al., 2021b).
Additionally, a newly developed “joint AOD–k0–SAE–ALH retrieval” algorithm for absorbing smoke or dust aerosols can be applied to both land and ocean pixels (Lyapustin et al., 2021a; Lyapustin et al., 2025). The “joint AOD–k0–SAE–ALH retrieval” algorithm expresses the spectral imaginary refractive index (k) of aerosols at wavelengths (λ) from the UV to red channels, known as “spectral absorption,” using a conventional power law equation:
where λ0 = 680 nm. The real refractive index is assumed to be spectrally invariant from the UV to red channels, with values of 1.51 for smoke and 1.52 for dust (Lyapustin et al., 2021a). In MAIAC EPIC version 3, the Levenberg–Marquardt nonlinear optimization algorithm (Levenberg, 1944; Marquardt, 1963) is used to simultaneously retrieve four parameters (AOD at 443 nm, k0, SAE, and ALH) by fitting EPIC measurements across UV to NIR wavelengths, including the oxygen-A and -B bands (Lyapustin et al., 2025). The algorithm employs pre-computed look-up tables (LUTs) using scalar code SHARM (Lyapustin, 2005). The atmospheric path reflectance is then replaced with vector solution from code IPOL (Lyapustin et al., 2018). MAIAC LUTs are built assuming pseudospherical correction in single scattering. The maximum AOD at 443 nm in the algorithm is set to 6. Vertically, aerosols are simulated as a box-shaped profile with a 2 km thick layer at varying altitudes, with the reported ALH representing the midpoint of this layer (Lyapustin et al., 2025). To minimize systematic biases in “spectral absorption,” retrieval is performed only over detected absorbing smoke or dust pixels where the AOD at 443 nm, based on the background aerosol model with fixed regional properties, exceeds 0.4. It is important to note that while the initial condition for dust retrievals is constrained by a background AOD at 443 nm > 0.4, the retrieved dust AOD at 443 nm may be less than 0.4 due to variations in microphysical properties and the simultaneous retrieval of “spectral absorption” and ALH. For detailed information on “joint AOD–k0–SAE–ALH retrieval” algorithm, see Lyapustin et al. (2025).
Subsequently, a dust speciation algorithm (Go et al., 2022) has been implemented to infer the contents of hematite and goethite. This methodology is based on the Maxwell–Garnett effective medium approximation and follows the approach of Schuster et al. (2016) with some modifications. In dust mineralogy, the imaginary index magnitudes of both hematite and goethite (10−1–100) are more than 100 times those of other soil mineral components (10−8–10−3) at wavelengths of <1 μm, which means that hematite and goethite dominate absorption while other minerals can be considered non-absorbing. The hematite imaginary index (0.2 at 700 nm to 0.8 at 460 nm) is generally about 3 times higher than that of goethite (∼0.1) (Bedidi and Cervelle, 1993) in the red–near infrared (NIR), the discrepancy further increasing toward blue–UV. At 350–450 nm, the imaginary index of hematite peaks at 1.0–1.2, whereas it changes little for goethite, remaining at ∼ 0.1. This significant difference in spectral absorption between hematite and goethite, particularly across the DSCOVR bands utilized by the MAIAC algorithm, facilitates their separate retrievals. Detailed description of calculating hematite and goethite from EPIC can be found from Go et al. (2022). A simplified explanation is provided below.
2.3 Dust speciation algorithm in MAIAC EPIC version 3
The Maxwell–Garnett approximation can be used to calculate the average dielectric function (εMG) under the assumption that atmospheric aerosols are heterogeneous particles with different complex dielectric functions. The theory assumes that randomly heterogeneous mixtures consist of two inclusions embedded in a homogeneous matrix (Bohren and Huffman, 1983). The host (εh) is modeled as a homogeneous dust or matrix containing inclusions of hematite and goethite. The forward model employs the Maxwell–Garnett effective medium approximation to simulate the complex dielectric function of the total column, using the known refractive index values for hematite, goethite, and the host (Equations 2–5):
where
The volume fraction of the host is (
where the real and imaginary parts of the aerosol mixture derived from the relationship
The inversion minimizes the following cost function (Equation 6) by iteratively updating the volume fraction
of inclusions (
The
2.4 MAIAC EPIC version 3 accuracy assessment
A global-scale evaluation of dust iron-oxide species column amounts derived from MAIAC EPIC is challenging due to the lack of global-scale in situ or ground-based measurement data. Instead, comparisons are made with AERONET (for AOD and spectral SSA) and CALIOP (for ALH). Spectral SSA values for each wavelength were computed from the retrieved k0 and SAE, using aerosol optical properties (such as aerosol volume size distribution and the real part of the refractive index) assumed in the MAIAC EPIC aerosol retrieval. The comparison results for AOD, spectral SSA, and ALH suggest that the MAIAC EPIC-derived dust iron-oxide species data are reasonably accurate. Figures 1, 2 present these comparison results for AOD, spectral SSA, and ALH. A more detailed validation of the global products will be published separately.
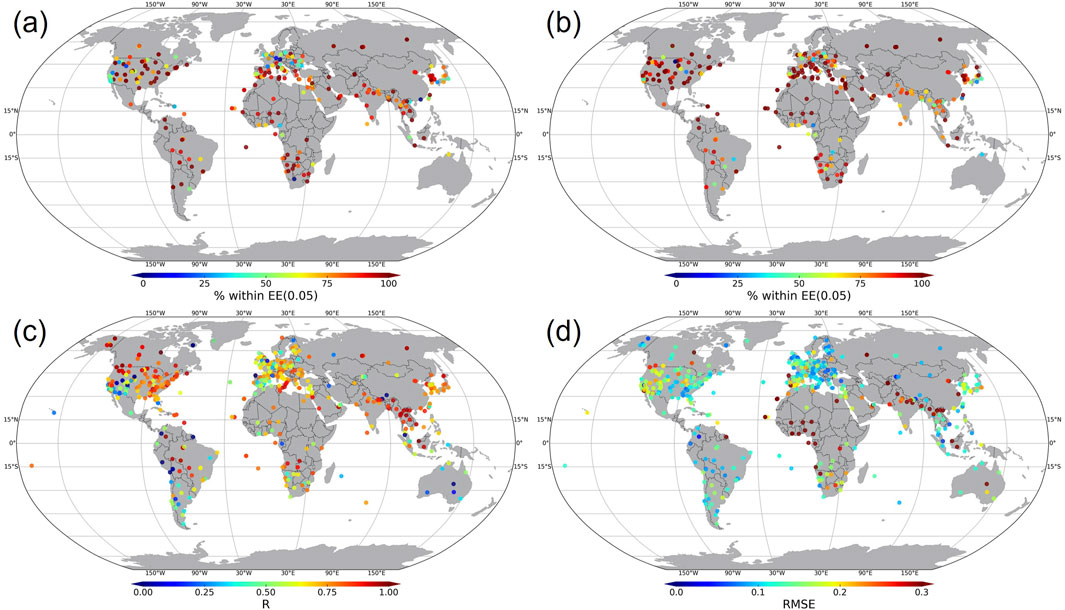
Figure 1. Comparison of MAIAC EPIC global and AERONET. (a) SSA at 443 nm (blue) and (b) SSA at 680 nm (red). The colors represent the fraction of validation points within expected errors (EE) for the SSA (±[AERONET SSA +0.05]; Ahn et al., 2021; only when AERONET AOD >0.6). (c) Correlation coefficients (R) of AOD at 443 nm. (d) Root-mean-square error (RMSE) of AOD at 443 nm. Global AERONET version 3 (level 2) from 1 July 2015 to 31 December 2023 was used.
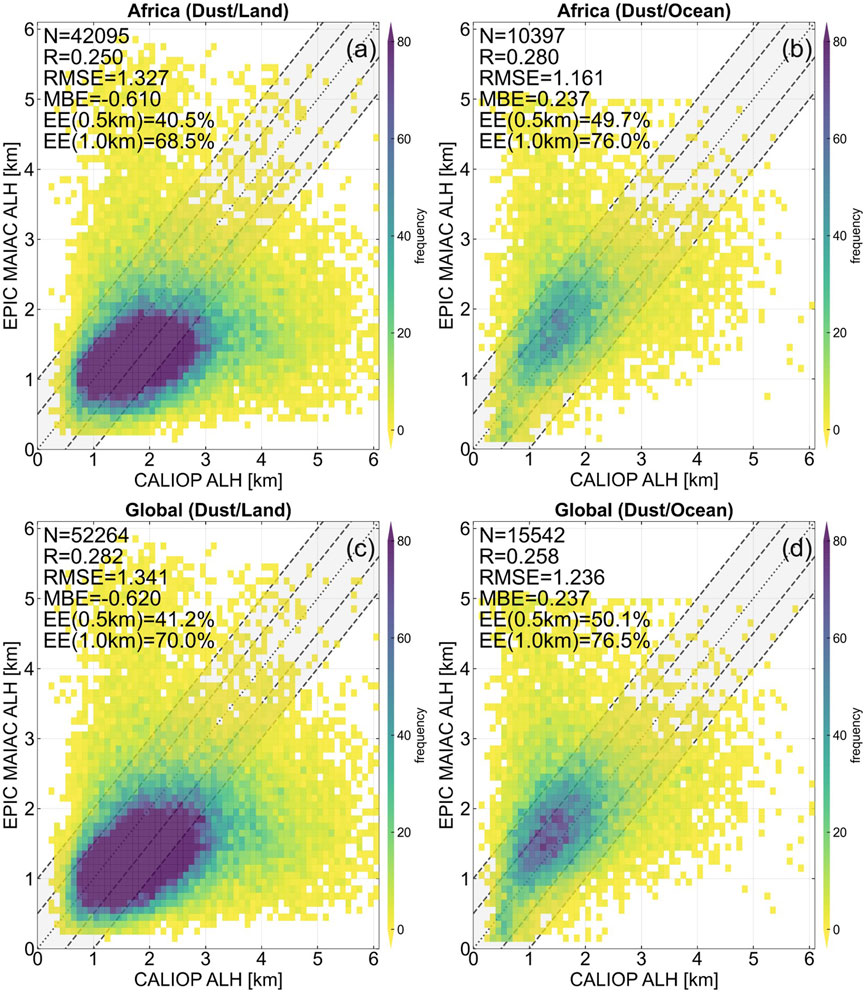
Figure 2. Comparison of MAIAC EPIC ALH with the CALIOP dataset for dust aerosols over (a) land and (b) ocean over Africa only, and (c) land and (d) ocean for global from 1 July 2015 to 31 December 2023. The colors represent the number of collocated comparison points within each 0.1 km range.
Figure 1 shows a comparison of MAIAC EPIC version 3 global AOD for the blue band (443 nm) and SSA for both the blue (443 nm) and red (680 nm) bands. For each AERONET site, the MAIAC EPIC spatially averaged AOD retrievals within a 20 km radius of the site (Sayer et al., 2013) were compared with AERONET direct Sun measurements within a ±30-min window of the satellite overpass time. For SSA comparison, AERONET inversion level 2.0 datasets within a ±3-h window (Sayer et al., 2013) of the satellite overpass time were used.
The SSA comparison results (Figures 1a,b) for both the blue (443 nm) and red (680 nm) bands, which reflect spectral aerosol absorption, show strong agreement with AERONET measurements over major aerosol-affected regions, including areas impacted by smoke and dust. Notably, central Africa (e.g., the Sahara and Sahel regions, dominated by dust aerosols) shows that 83.1% of co-located data points (n = 1,556) at 443 nm fall within ±0.05 of the AERONET data, while 39.8% of the data points fall within the same range at 680 nm.
In terms of AOD validation (Figures 1c,d), the correlation coefficient (R) for AOD exceeds 0.75 over major AERONET sites. Lower R values observed over the western United States and Europe are statistical artifacts, due to generally low AOD values in these regions (e.g., the maximum AOD at the Tucson AERONET site in the western United States in 2022 was less than 0.5). The consistently low Root Mean Square Error (RMSE) values in the United States and Europe further support this explanation.
Figure 2 presents a comparison of MAIAC EPIC ALH with CALIOP measurements for dust-detected aerosols from 1 July 2015 to 31 December 2023. For this comparison, the attenuated backscatter-weighted height (
In Equation 7, Bsc(i) represents the attenuated backscatter (or total backscatter coefficient at 532 nm) at height H(i), with n being the number of layers between the surface and 10 km. As shown in Figure 2, MAIAC EPIC ALH exhibits a global RMSE of approximately 1.2 km and a mean bias error (MBE) of less than 0.8 km for dust-detected aerosols. The comparison indicates that MAIAC EPIC ALH is well-aligned with CALIOP measurements, especially for aerosols near the surface (e.g., over Africa, where ALH is typically less than 2 km), both over land and ocean.
3 Climatology of atmospheric dust iron-oxide species
This section outlines the process used to generate the climatology from the MAIAC EPIC version 3 level 2 datasets. The complete EPIC measurement datasets from July 2015 to December 2023 were utilized. However, it's important to note that EPIC was offline for approximately 9 months starting on 27 June 2019, due to issues with the satellite’s attitude control system (National Environmental Satellite, Data, and Information Service, 2023). Additionally, the MAIAC EPIC data for June 2015 was excluded, as it may not have been fully initialized in the MAIAC algorithm during its first month of processing (Lyapustin et al., 2018).
3.1 Generating the climatology from the MAIAC EPIC version 3 datasets
The MAIAC EPIC level 2 product is provided at a 10 km resolution in a zonal sinusoidal projection. Cloud-free MAIAC data were aggregated to a spatial resolution of 0.5 ° × 0.5 ° and used to compute daily, monthly, and seasonal averages of aerosol properties. During the daily averaging process, pixels with solar zenith angles (SZA) greater than 60° or viewing zenith angles (VZA) greater than 60° were excluded. Additionally, pixels with a spatial fraction (i.e., the number of retrievals relative to the total number of radiance measurement counts) of less than 0.2 were filtered out. The daily average datasets were then subsequently averaged again to generate the monthly climatology. Finally, the seasonal climatology was calculated, ensuring that only pixels with more than 10 points were included to avoid irregularities. These filtering criteria (including the 0.5 ° × 0.5 ° resolution, SZA/VZA threshold of 60°, and minimum retrieval counts) were adopted to ensure the statistical robustness of the climatological means and to maintain high data quality by excluding observations under extreme viewing geometries.
Unlike model-based climatology, satellite-based climatology excludes retrievals over cloud-covered areas or glint pixels over the ocean. Furthermore, the current joint retrieval algorithm parameters are applied only to AOD values greater than 0.4 at 443 nm, which is critical for accurate comparison with models. Therefore, the total number of average points for each 0.5° grid is presented with climatology (column d in Supplementary Figures S1–S3).
3.2 Seasonal distribution of mineral dust iron-oxide species
Figures 3–5 summarize the seasonal climatology of hematite and goethite mass concentrations from MAIAC EPIC retrievals. To enhance the clarity of the spatial distribution, we referenced Ginoux et al. (2012) and overlaid the major dust source regions on a map featuring both hematite and goethite. Additional maps including AOD, SSA, and dust event frequency are shown in the Supplementary Figures S1–S3. In summary, regional differences in hematite versus goethite dominance reflect both source mineralogy and atmospheric transport pathways. The detailed meteorological context (e.g., Harmattan winds, ITCZ variability, and Shamal circulation) is provided in the Supplementary Material.
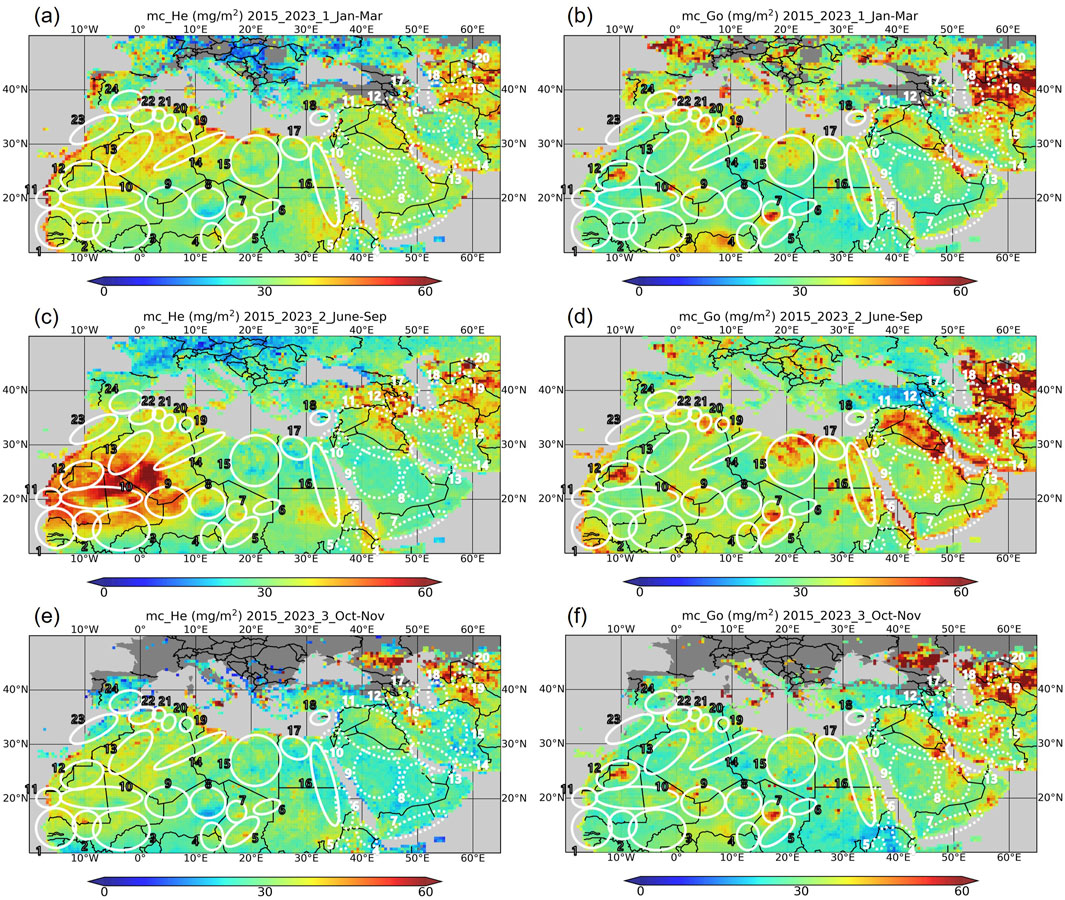
Figure 3. Distribution of the column mass concentration (mg/m2) of hematite (left) and goethite (right) per season [(a,b) January, February, March, (c,d) June, July, August, September, (e,f) October, November] MAIAC AOD443 > 0.4 over Sahara–Sahel–Middle East obtained from 1 July 2015 to 31 December 2023. The white solid circled sources are numbered as follows: 1, Senegal River Basin; 2, Aoukar depression; 3, upper Niger River Basin; 4, Lake Chad; 5,river drainage basin of the Ennedi and Ouaddaï highlands; 6, Mourdi depression; 7, Bodélé depression; 8, Grand Erg of Bilma; 9, river drainage basin of the Aïir; 10, Erg El Djouf; 11, Sebkhet te-n-Dgâmcha; 12, Tiris Zemmour region; 13, Grand Erg Occidental; 14, Grand Erg Oriental; 15, Libyan Desert; 16, Nile River Basin; 17, Qattarah depression; 18, Mesaoria plain in Cyprus; 19, Chott el Jerïd; 20, Chott Melrhir; 21, Chott el Hodma; 22, Chott ech Chergui; 23, Morocco coastal plains; and 24, Andalusia in Spain. The white dashed circled sources are numbered as follows: 4, Danakil Desert of Ethiopia; 5, Lake Tana of Ethiopia; 6, northeast Sudan; 7, Hadramawt region; 8, Empty Quarter; 9, highlands of Saudi Arabia; 10, Jordan River Basin of Jordan; 11, Mesopotamia; 12, Urumia Lake of Iran; 13, coastal desert of Iran; 14, Hamun-i-Mashkel; 15, Dasht-e Lut Desert of Iran; 16, Dasht-e Kavir Desert of Iran; 17, Qobustan in Azerbaijan; 18, Atrek delta of Turkmenistan; 19, Turan plain of Uzbekistan; and 20, Aral Sea.
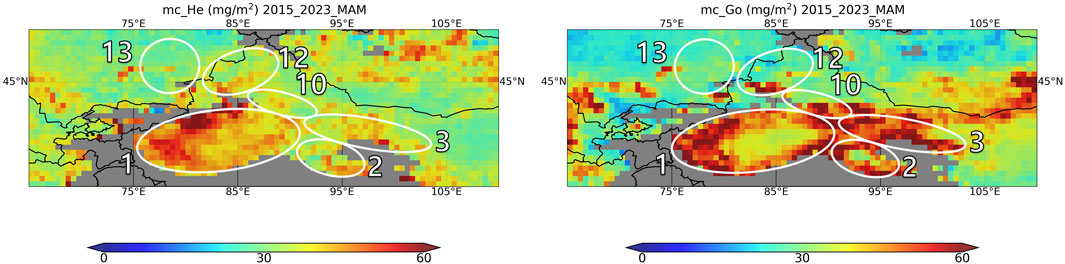
Figure 4. Distribution of the column mass concentration (mg/m2) of hematite (left) and goethite (right) per season (March, April, May) MAIAC AOD443 > 0.4 over Taklamakan desert obtained from 1 July 2015 to 31 December 2023. The white solid circled sources are numbered as follows: 1, Tarim Pendi; 2, Qaidam Pendi; 3, Hexi corridor in Gansu Province; 10, Turpan Pendi; 12, Junggar Pendi; and 13, Balkhash-Alakol depression.
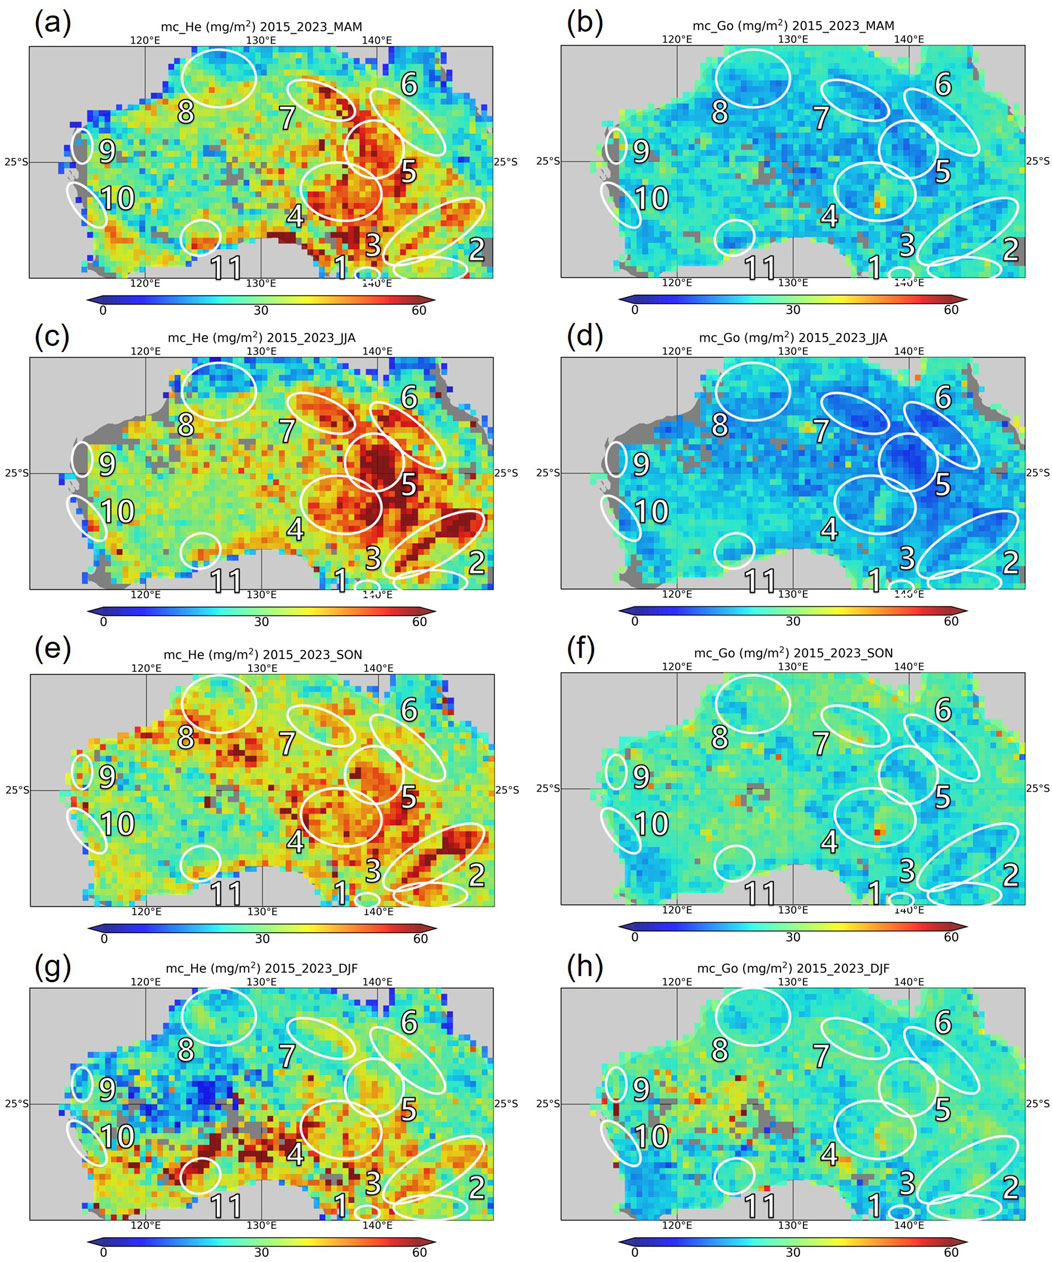
Figure 5. Distribution of the column mass concentration (mg/m2) of hematite (left) and goethite (right) per season (a,b) March, April, May, (c,d) June, July, August, (e,f) September, October, November, (g,h) December, January, February) MAIAC AOD443 > 0.4 over Australia obtained from 1 July 2015 to 31 December 2023. The white solid circled sources are numbered as follows: 1, Victorian Big Desert; 2, Riverina; 3, Barwon-Darling Basin; 4, Lake Eyre Basin; 5, Simpson Desert; 6, lee side of Great Dividing Range; 7, Barkly Tableland; 8, Kimberley Plateau; 9, North West Cape; 10, Darling Front Range; and 11, Nullarbor Plain.
3.2.1 Bodélé depression
The Bodélé Depression (location 7 in Figure 3) is the most extensive dust source in the world with its diatomite sediments (Todd et al., 2007). In our analysis, the spatial distribution of hematite and goethite differs significantly from SSA or from AOD (Supplementary Figure S1) and varies across seasons. Although AOD at 443 nm remains consistently high (above 2.0) near the Bodélé Depression, the iron-oxide mass fraction in this region is consistently low compared to surrounding areas (Todd et al., 2007; Di Biagio et al., 2019). Our climatology analysis indicates that dust over the Bodélé Depression is primarily composed of goethite, with an average mass concentration exceeding 45 mg/m2, particularly in the source region (location 7). Hematite content is even lower, averaging around 20 mg/m2, with the lowest hematite levels appearing slightly westward of the peak goethite concentrations.
3.2.2 North Africa (Sahara–Sahel)
The Western Sahara is another significant contributor of dust aerosols to the atmosphere, particularly during the summer months (June to September). During this period, a substantial dust plume extends from the Sahara to the subtropical eastern Atlantic, as observed in AOD climatology (Supplementary Figure S1), with an average AOD exceeding 1.0. A prominent dust hotspot is observed over West Africa, near the Tiris Zemmour (location 12; approximately 18–21°N, 7.5–0°W) during the summer (Knippertz and Todd, 2012). Notably, our iron-oxide species climatology (Figure 3) reveals that while the dust AOD over the Western Sahara in the summer (June–September) is primarily composed of hematite (over 50 mg/m2 on average), the dust near the hotspot region along the Tiris Zemmour (location 12) and Erg El Djouf (location 10) contains significantly lower hematite content, averaging approximately 30 mg/m2.
3.2.3 Middle east and central Asia
The Shamal dust storm, occurring from June to September, is a seasonal event across the Middle East and the Arabian Peninsula (Yu et al., 2016). The highest concentrations of hematite and goethite (Figure 3) are found in Iraq (location 11; greater than 40 mg/m2 for both minerals), rather than in the southern Arabian Peninsula. Additionally, goethite (more than 50 mg/m2) is more dominant than hematite in Iraq (location 11), especially during June–September, with an average AOD of more than 0.5. In Central Asia, which includes western Kazakhstan, Uzbekistan, and Turkmenistan (as shown in Figure 3), both hematite and goethite are dominant compared to surrounding regions throughout all seasons.
3.2.4 Taklamakan and gobi deserts
The Tarim Basin (Figure 4) is surrounded by mountain ranges about 5 km high to the west, south, and north, causing dust storms to typically blow in from the east at low levels and become trapped in the basin. Dust is generally transported by easterly winds, circulating within the Tarim Basin. These geographical characteristics give the climatology over the Taklamakan Desert an ellipsoidal shape (location 1). The average AOD over the Taklamakan Desert exceeded 2.0 during this period, with regional hematite and goethite contents greater than 50 mg/m2. Shen et al. (2006) measured the hematite-to-goethite ratio in bulk samples of aeolian dust from Dunhuang (40.3°N, 94.5°E), Yulin (38.2°N, 109.4°E), and Tongliao (43.1°N, 122.1°E), reporting values of 0.57 ± 0.26, 0.59 ± 0.16, and 0.46 ± 0.13, respectively. Figure 4 indicates that the climatological analysis of the hematite-to-goethite mass ratio aligns closely with Shen et al. (2006), depending on the specific region.
3.2.5 Australia
In Australia (see Figure 5), the retrieval shows that the continental soil is predominantly hematite especially over Eastern Australia with average hematite contents over 45 mg/m2. The mass contents of goethite were evenly low both spatially and seasonally with less than 30 mg/m2.
3.3 Monthly variations of atmospheric mineral dust iron-oxide species in 2018 over 14 sites
To recall, Go et al. (2022) showed the monthly variations (5th, 50th, and 95th percentiles) of hematite (red shading) and goethite (gray shading) mass fraction (wt. %) calculated from MAIAC EPIC over 15 selected sites for 2018. The study used ground soil sample data from Di Biagio et al. (2019) to undertake a qualitative assessment of the hematite and goethite fraction derived from EPIC. While the previous publication (Go et al., 2022) relied on version 2 MAIAC EPIC dataset based on assumption of ALH = 1 km and limited to 1 year of 2018 climatology, the current work uses the full record of version 3 MAIAC EPIC data with ALH to construct and analyze the updated climatology of absorbing dust mineral species (e.g., hematite, goethite).
In this section, the analysis, monthly variations (5th, 50th, and 95th percentiles) of hematite (red shading) and goethite (gray shading) mass fraction (wt. %) calculated from MAIAC EPIC over 15 selected sites for 2018, is repeated with the version 3 MAIAC EPIC data which includes ALH of EPIC measurements. This study focused on 14 sample sites across various desert regions, including northern Africa, the Sahel, eastern Africa, the Middle East, eastern Asia, and Australia (Figure 6). One site in North America (Arizona site) was excluded from the dust retrieval in the update from MAIAC EPIC version 2 to 3. Consequently, 14 sites are analyzed in this section.
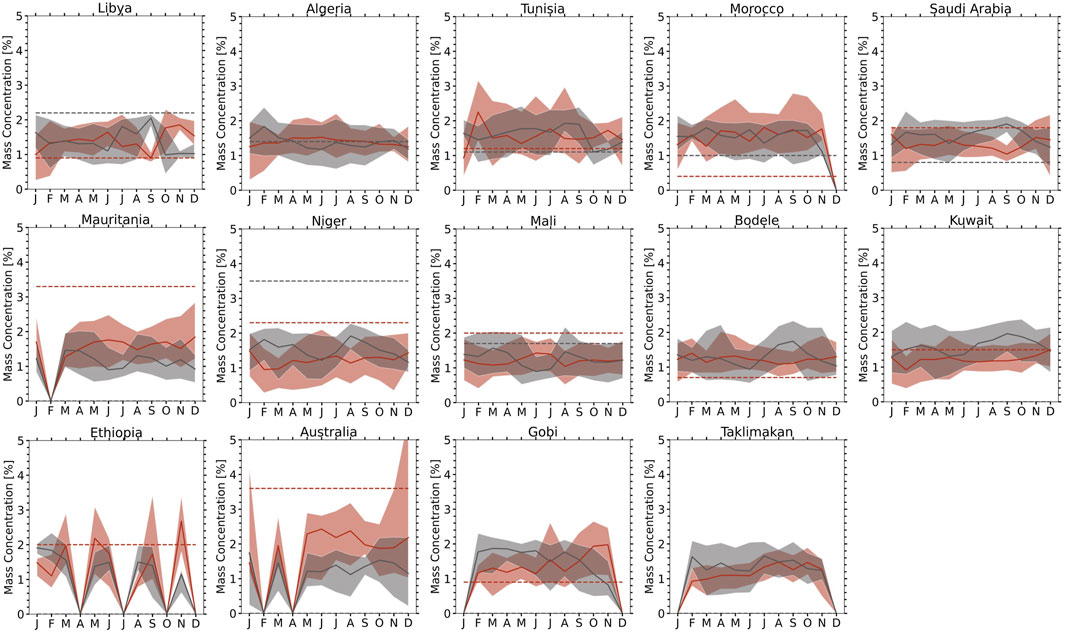
Figure 6. Monthly variations (5th, 50th, and 95th percentiles) of hematite (red shading) and goethite (gray shading) mass fraction (wt.%) calculated from MAIAC EPIC at each site for 2018. The x-axis represents each month from January to December. Solid lines at the centers of shaded areas indicate median values for hematite (red) and goethite (black). Each site represents an area of ±1° for the MAIAC EPIC data (pixels with AOD at 443 nm > 0.6) except for Australia (±3°). Dashed lines indicate hematite (red) and goethite (black) mass fraction with ±10% uncertainty (Di Biagio et al., 2019). For the Algeria site, the two dashed lines coincide (Di Biagio et al., 2019). The missing dashed lines for goethite at Mauritania, Bodélé, Ethiopia, Kuwait, the Gobi, Arizona, and Australia indicate the goethite mass fraction was zero. Di Biagio et al. (2019) did not provide data for the Taklamakan site.
Figure 6 shows monthly variations (5th, 50th, and 95th percentiles) of hematite (red shading) and goethite (gray shading) mass fraction (weight percentage; wt %) with the AOD at 443 nm larger than 0.6. Note that the previous study (Go et al., 2022) was limited to retrievals with the AOD at 443 nm larger than 1.0. The main results remain the same as in Go et al. (2022): (1) there is large variability of hematite and goethite over the Sahara, Sahel, and Middle East; (2) there are similar hematite mass fractions over the Sahel (∼20°N) (or the Niger–Mali–Mauritania corridor; south of 20°N) as the soil measurements of Di Biagio et al. (2019); (3) at the Niger site, the MAIAC algorithm showed the iron-oxide mass fraction to be 2.8% during the Harmattan season (November-March), which aligns with the findings of Lafon et al. (2004). However, during the local erosion season (May-July), the MAIAC retrieval did not achieve an iron-oxide mass fraction of 5.0% as reported by Lafon et al. (2004). This discrepancy could potentially be attributed to rainfall events during the local erosion season (May-July) at the Niger site; (4) a consistently low hematite mass fraction (<1.4%) was observed over the Bodélé Depression; (5) over Saudi Arabia and Kuwait, the goethite contents tend to increase and the relative amounts of hematite and goethite are reversed at the beginning of the Shamal season due to the northwesterly winds; and (6) over the Gobi and Taklamakan deserts, a hematite:goethite mass ratio of ∼0.55 was observed in spring, which is consistent with the study of Shen et al. (2006).
Nevertheless, there are several differences as compared with the results obtained with an assumed height of 1 km (Go et al., 2022). Firstly, the absolute mass fractions of hematite and goethite in this study are lower than expected because we are using an atmospheric layer height (ALH) typically between 1 km and 4 km. This narrower ALH range reduces the variability of hematite and goethite compared to the assumption of a 1 km height. Secondly, Australia has higher mass fraction of hematite of >4% during winter in this study, which is closer to the soil measurements (Di Biagio et al., 2019).
3.4 Vertical distribution of the monthly climatology for hematite and goethite over 14 sites
Supplementary Figures S5, S6 show that the vertical distributions of hematite and goethite from MAIAC EPIC: in winter (December–January), hematite is strongly concentrated near the surface with an exponential-like profile, while in spring (May–June) its maximum extends upward to 3–4 km, consistent with CALIOP dust extinction profiles (Song et al., 2021); by contrast, goethite shows weaker vertical gradients and remains more evenly distributed across altitudes. A summary of peak aerosol layer heights is provided in Supplementary Table S1. This pattern likely reflects the different densities of hematite (5,260 kg/m3), goethite (3,800 kg/m3) and other minerals (2,500 kg/m3), along with the gravitational settling of heavier particles.
One might consider that the vertical distribution of hematite, especially in winter (December–January), could result from algorithmic systematic biases. For instance, if the SSA retrieval depends on aerosol layer height, SSA values at UV-visible wavelengths might be lower with a lower aerosol layer height. However, no such biases or tendencies were observed in our MAIAC EPIC version 3 retrievals. Therefore, the vertical distribution of the monthly climatology for hematite and goethite appears to be reasonable.
4 Discussion from satellite retrieval algorithm perspective
4.1 Relationship between spectral single scattering albedo and iron oxides contents
The sample-to-sample variability of the imaginary part of the refractive index k or the SSA in the shortwave is related to the mineral dust composition (Di Biagio et al., 2019; Moosmüller et al., 2012). Moosmüller et al. (2012) studied the relationship between the aerosol iron content and SSA at two wavelengths (405 nm in the violet and 870 nm in the near IR spectral region) to estimate the spectrally resolved shortwave absorption of dust based on its composition. In this study, the result points toward the potential use of SSA remote sensing to measure aerosol iron content and vice versa. The study concluded that mineral dust single scattering albedo at 405 nm and 870 nm is linearly correlated with iron content. Di Biagio et al. (2019) investigated the dependence of the imaginary part of the refractive index k and the SSA on the particle iron content over the 370–950 nm range and concluded that there was a better correlation of k and SSA with the mass fraction of iron oxides (MCFe-ox%) as compared with the mass fraction of iron (MCFe%), because dust optical properties in the visible wavelengths are mostly sensitive to the fraction of iron oxides, rather than the iron in the crystal structure of silicates. There is no statistically significant correlation between k or SSA and the mass fraction of any other dust compounds (other than iron oxides), such as clays, calcite, quartz, and feldspars, as well as with the mass fractions of other elements. Therefore, these results indicate that iron, particularly in the form of iron oxides (hematite and goethite), is the main driver of shortwave absorption by dust. As such, it is not sufficient to measure the hematite mass fraction only when estimating dust absorption.
The analysis from Di Biagio et al. (2019) and Moosmüller et al. (2012) are based on the laboratory measurements. Here, in contrast, we analyzed the empirical relationships between k680 or SSA and the mass fraction of iron oxides derived from the MAIAC EPIC satellited-based retrieval data over 14 major sites (Figure 7; Supplementary Figures S6, S7). The analysis is unique as it is from satellite-based measurements data which provides the global spatial coverage where the ground-based measurements data are sparse. Also, it may give a clue toward the potential use of SSA remote sensing to measure aerosol iron oxides content and vice versa.
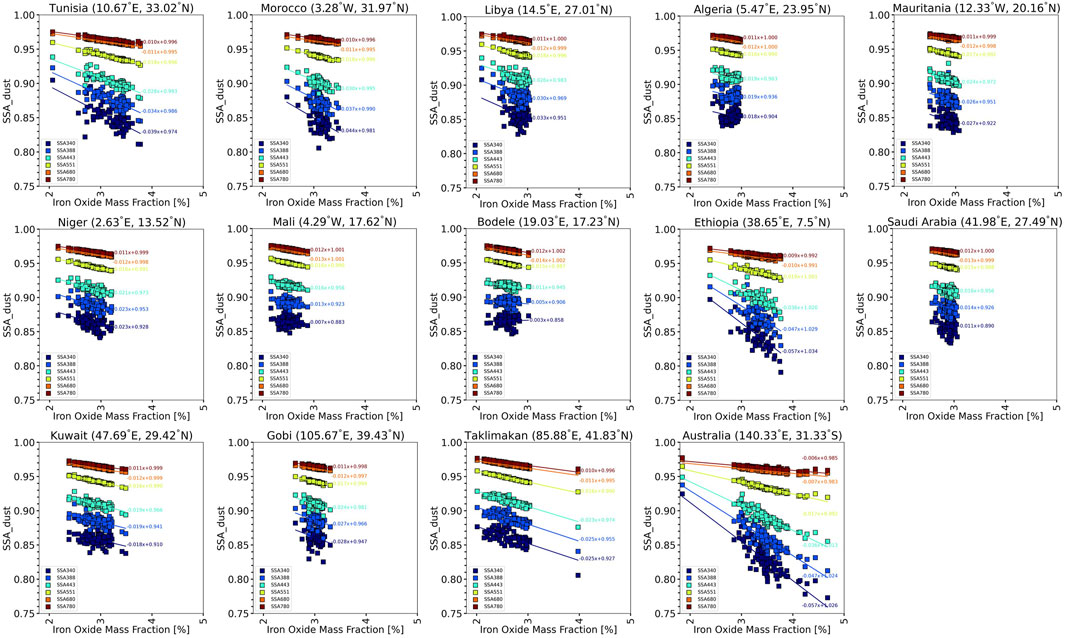
Figure 7. Empirical relationship between SSA and the mass fraction of iron oxides (MCFe-ox%) from EPIC data over 14 major sites. Each square represents the mean value for 1 month of data. Total data periods from 1 July 2015 to 31 December 2023 have been used. The color represents the wavelengths (340 nm: navy, 388 nm: blue, 443 nm: light blue, 551 nm: yellow, 680 nm: orange, 780 nm: red) of dust SSA from MAIAC EPIC.
The data period from July 2015 to December 2023 is used (Figure 7; Supplementary Figures S6, S7). Supplementary Figure S6 shows that k680 is proportional to the mass fraction of iron oxides, although the slope and offset varies depending on the sites. In addition, for a given k680, iron-oxide contents increase with increasing SAE of the dust. Figure 7 shows that the SSA at each wavelength from the UV (340 nm) to near-IR (780 nm) is proportional to the mass fraction of iron oxides. However, the sample-to-sample variability of the SSA is larger for the UV wavelength (340 nm) as compared with the near-IR wavelength (780 nm). Furthermore, the slopes between the SSA 340 nm and mass fraction of iron oxides are different for different sites.
To assess whether the slope of the linear relationship between k680 or SSA 340 nm and the mass fraction of iron oxides is solely dependent on the LUT assumption of the species retrieval, the slope between the k680 or SSA 340 nm and mass fraction of iron oxides have been further analyzed. Supplementary Figure S7 lower right side shows the LUT of the mass fraction of iron oxides determined according to the SAE (y-axis) and k680 (x-axis). The same LUT is applied to the remaining 14 sites, and the scatter plot shows the distribution of the monthly mean retrieval points (x-axis = k680; y-axis = SAE; z-axis = iron oxide mass fraction). In Ethiopia and Australia, the scatter points occur in a higher range of iron-oxide mass fraction (z-axis), whereas the other sites showed a lower range of iron-oxide fraction. Also, the SAE varies widely from 1.0 to 3.0 and k680 ranges from 0.0015 to 0.002. The slope between the SSA 340 nm and iron-oxide mass fractions in Figure 7 can be determined by examining the gradient of the scatter plot of the retrieved points. This gradient is measured along the direction perpendicular to the iron-oxide contour line as k0 increases, even if the LUT used for dust retrieval is the same. The data from Bodélé has the flatest slope in Figure 7. The slope also depends on the hematite content, as can be inferred from that the SAE value increases with increasing hematite content. The large variability of the retrieved SSA 340 nm physically indicates that UV light is relatively sensitive to aerosol absorption, in other words, more sensitive to the hematite:goethite mass fraction ratio. Further analysis regarding the slope and sample-to-sample variability of the SSA at each wavelength is beyond the scope of this study. However, the results (Figure 7; Supplementary Figures S6, S7) indicate that the linear relationship between k0 or SSA and the mass fraction of iron oxides (MCFe-ox%) from the EPIC data could be used as an additional constraint in aerosol model simulations.
In summary, leveraging global DSCOVR EPIC satellite data, Section 4 validates that hematite and goethite are the primary agents of dust shortwave absorption, establishing fundamental relationships. The derived linear relationships (Figure 7; Supplementary Figures S6, S7) between k0 or SSA and iron oxide mass fraction (MCFe-ox%) offer a valuable additional constraint for advancing aerosol model simulations.
4.2 Limitations and future work
To demonstrate the significance of the linear relationships between SSA vs. iron oxides (Figure 7) and k vs. iron oxides (Supplementary Figure S6), statistical metrics such as R2, p-value, and standard error are provided in Table 1 and Supplementary Table S2, respectively. However, some aspects still require further investigation.
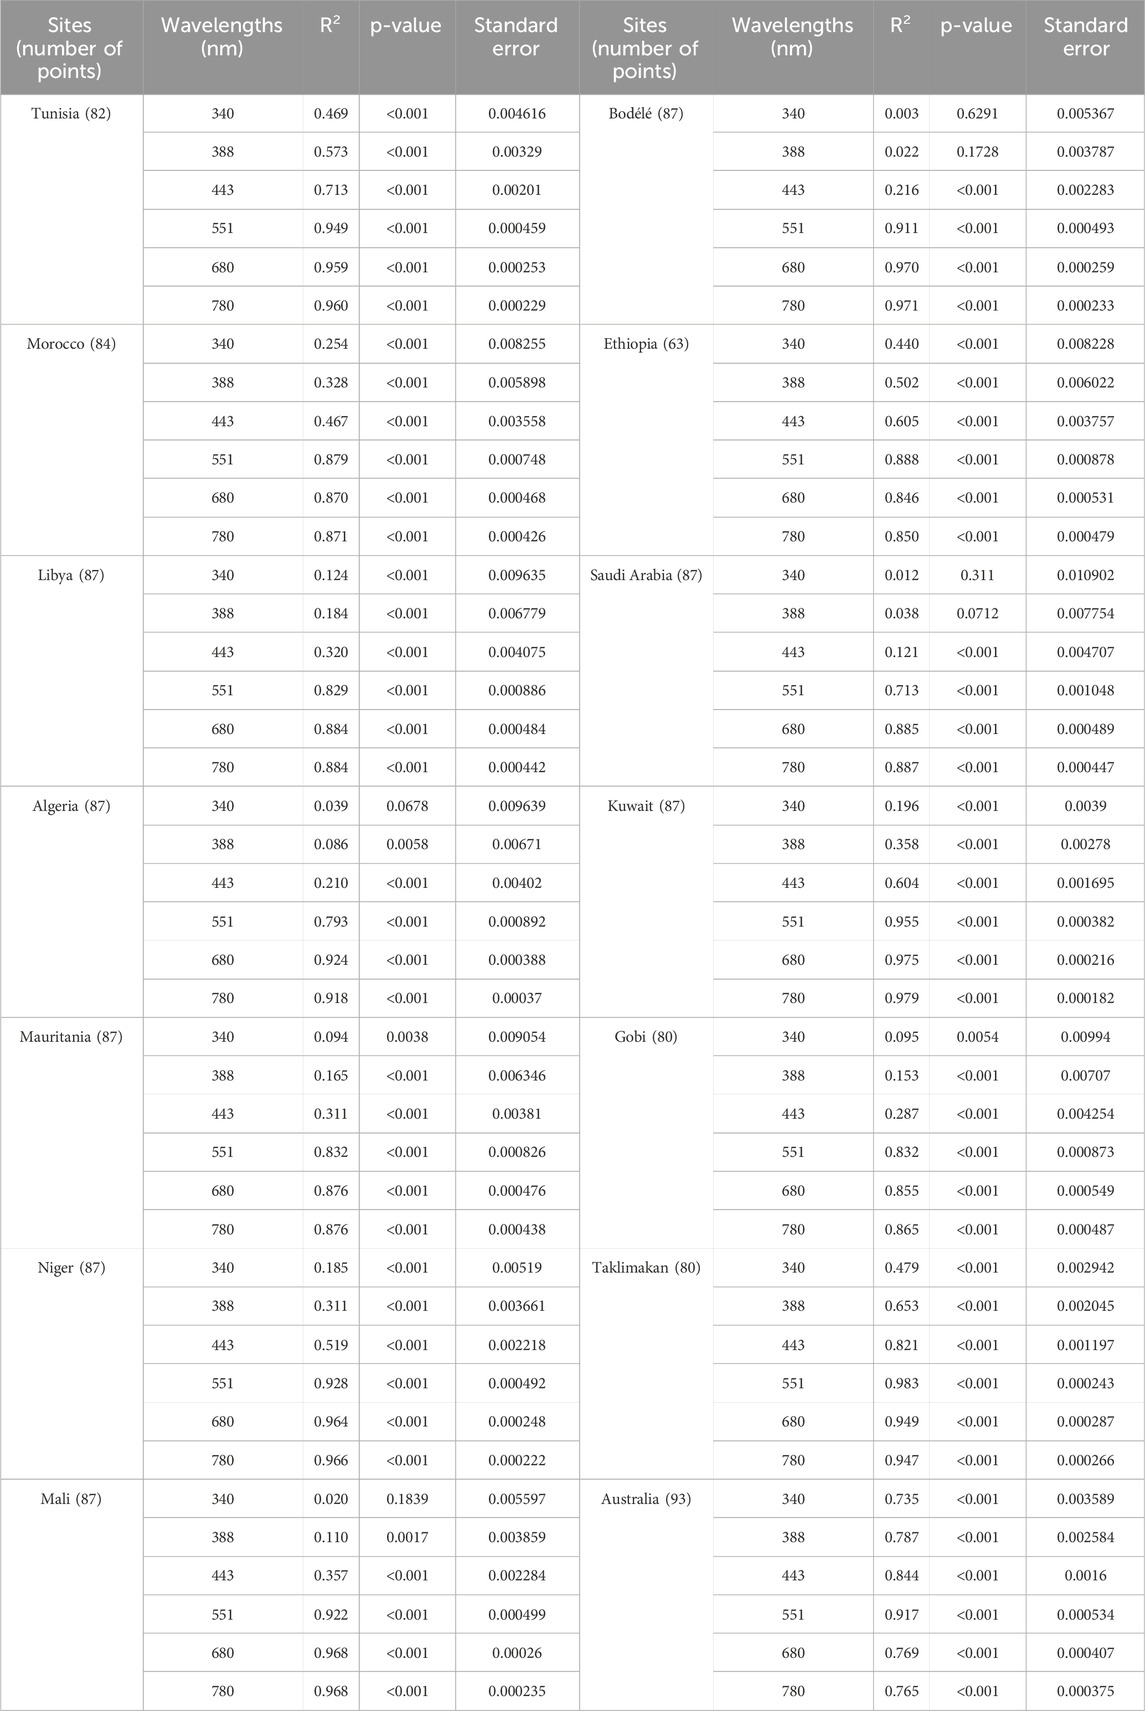
Table 1. Coefficients of determination (R2), p-values, and standard errors for the linear regression between Single Scattering Albedo (SSA) and the mass fraction of iron oxides (MCFe-ox%) at different wavelengths (340–780 nm) for major dust sources in Figure 7.
In particular, the fits between SSA and iron oxides in Figure 7 occasionally show intercepts lower than 1, suggesting that aerosol absorption exists even when the iron oxide concentration is zero. This observation may be explained by two possible factors. First, it could result from mixing with other aerosol types during atmospheric transport, as the algorithm is specifically designed for pure dust conditions (Go et al., 2022). In cases of mixed aerosol columns, the retrieval accuracy may be compromised. Second, this may reflect inherent uncertainties in the algorithm itself. However, it is worth noting that when we carefully selected the pure dust cases globally, the linear relationships between “SSA vs. iron oxides” was apparent with offset of 1.0, as shown in Figure 7 of Go et al. (2022).
Quantifying the uncertainty of iron oxides remains highly challenging, as they can be influenced by multiple factors. First, error may be propagated from input MAIAC EPIC products (AOD, spectral SSA, and ALH). These accuracies are discussed in detail in Lyapustin et al. (2025). Key sources of algorithmic uncertainty may include assumptions such as: (1) the limited volume size distribution with pure dust assumption, (2) the use of a box-shaped vertical aerosol profile with fixed thickness, (3) a fixed, wavelength-independent real refractive index, (4) the application of the Maxwell-Garnett approximation assuming internal mixing, and (5) neglecting absorption by the host material (i.e., setting the imaginary part of the refractive index to zero). Despite the complexity, more detailed uncertainty quantification should be a focus of future research.
5 Conclusion
Utilizing the full eight-year record of the updated MAIAC EPIC version 3 data (2015–2023), including Aerosol Layer Height (ALH), this study constructed a comprehensive climatology of absorbing dust minerals, hematite and goethite. The improved algorithm successfully characterized their seasonal and vertical distribution across major regions, revealing, for instance, hematite’s notable shift from the surface in winter to the free troposphere (2–4 km) in spring, consistent with CALIOP profiles. Crucially, remotely sensed spectral absorption properties (k and SSA) were confirmed to be strongly proportional to iron oxide mass fraction across 14 global sites, where the enhanced sensitivity of UV SSA highlights its potential as a valuable global monitoring tool. This high-frequency data and detailed climatology offer critical observational constraints for Earth System Models. The developed methodology is readily applicable to future satellite missions (PACE, GEMS, TEMPO), supporting synergy with surface composition data (EMIT).
Data availability statement
The datasets analyzed for this study can be found in the https://asdc.larc.nasa.gov/data/DSCOVR/EPIC/L2_MAIAC_02/.
Author contributions
SG: Conceptualization, Funding acquisition, Investigation, Methodology, Software, Supervision, Writing – original draft, Writing – review and editing. AL: Conceptualization, Methodology, Supervision, Writing – original draft. MC: Conceptualization, Data curation, Methodology, Software, Writing – review and editing. SK: Visualization, Writing – review and editing. YW: Data curation, Software, Writing – review and editing. EH: Funding acquisition, Writing – review and editing.
Funding
The author(s) declare that financial support was received for the research and/or publication of this article. This work was supported by the NASA DSCOVR program. The first author was also supported by the Office of Naval Research grant.
Conflict of interest
The authors declare that the research was conducted in the absence of any commercial or financial relationships that could be construed as a potential conflict of interest.
The author(s) declared that they were an editorial board member of Frontiers, at the time of submission. This had no impact on the peer review process and the final decision.
Generative AI statement
The author(s) declare that no Generative AI was used in the creation of this manuscript.
Any alternative text (alt text) provided alongside figures in this article has been generated by Frontiers with the support of artificial intelligence and reasonable efforts have been made to ensure accuracy, including review by the authors wherever possible. If you identify any issues, please contact us.
Publisher’s note
All claims expressed in this article are solely those of the authors and do not necessarily represent those of their affiliated organizations, or those of the publisher, the editors and the reviewers. Any product that may be evaluated in this article, or claim that may be made by its manufacturer, is not guaranteed or endorsed by the publisher.
Supplementary material
The Supplementary Material for this article can be found online at: https://www.frontiersin.org/articles/10.3389/frsen.2025.1676851/full#supplementary-material
References
Ahn, C., Torres, O., Jethva, H., Tiruchirapalli, R., and Huang, L. K. (2021). Evaluation of aerosol properties observed by DSCOVR/EPIC instrument from the earth-sun lagrange 1 orbit. J. Geophys. Res. Atmos. 126 (12), e2020JD033651. doi:10.1029/2020jd033651
Banerjee, T., Shitole, A. S., Mhawish, A., Anand, A., Ranjan, R., Khan, M. F., et al. (2021). Aerosol climatology over south and southeast Asia: aerosol types, vertical profile, and source fields. J. Geophys. Res. Atmos. 126 (6), e2020JD033554. doi:10.1029/2020jd033554
Bedidi, A., and Cervelle, B. (1993). Light scattering by spherical particles with hematite and goethite like optical properties: effect of water impregnation. J. Geophys. Res. 98, 11941–11952. doi:10.1029/93jb00188
Bohren, C. F., and Huffman, D. R. (1983). Absorption and scattering of light by small particles. Wiley.
Castellanos, P., Colarco, P., Espinosa, W. R., Guzewich, S. D., Levy, R. C., Miller, R. L., et al. (2024). Mineral dust optical properties for remote sensing and global modeling: a review. Remote Sens. Environ. 303, 113982. doi:10.1016/j.rse.2023.113982
Choi, M., Lyapustin, A., Schuster, G. L., Go, S., Wang, Y., Korkin, S., et al. (2024). Light-absorbing Black carbon and brown carbon components of smoke aerosol from DSCOVR EPIC measurements over North America and Central Africa. Atmos. Chem. Phys. 24 (18), 10543–10565. doi:10.5194/acp-24-10543-2024
Claquin, T., Schulz, M., and Balkanski, Y. J. (1999). Modeling the mineralogy of atmospheric dust sources. J. Geophys. Res. Atmos. 104 (D18), 22243–22256. doi:10.1029/1999JD900416
Connelly, D. S., Thompson, D. R., Mahowald, N. M., Li, L., Carmon, N., Okin, G. S., et al. (2021). The EMIT mission information yield for mineral dust radiative forcing. Remote Sens. Environ. 258, 112380. doi:10.1016/j.rse.2021.112380
Di Biagio, C., Formenti, P., Balkanski, Y., Caponi, L., Cazaunau, M., Pangui, E., et al. (2019). Complex refractive indices and single-scattering albedo of global dust aerosols in the shortwave spectrum and relationship to size and iron content. Atmos. Chem. Phys. 19 (24), 15503–15531. doi:10.5194/acp-19-15503-2019
Di Biagio, C., Doussin, J. F., Cazaunau, M., Pangui, E., Cuesta, J., Sellitto, P., et al. (2023). Infrared optical signature reveals the source–dependency and along–transport evolution of dust mineralogy as shown by laboratory study. Sci. Rep. 13 (1), 13252. doi:10.1038/s41598-023-39336-7
Formenti, P., Caquineau, S., Chevaillier, S., Klaver, A., Desboeufs, K., Rajot, J. L., et al. (2014). Dominance of goethite over hematite in iron oxides of mineral dust from Western Africa: quantitative partitioning by x-ray absorption spectroscopy. J. Geophys. Res. Atmos. 119 (22), 12–740. doi:10.1002/2014jd021668
Gautam, R., Hsu, N. C., Tsay, S. C., Lau, K. M., Holben, B., Bell, S., et al. (2011). Accumulation of aerosols over the indo-gangetic plains and southern slopes of the himalayas: distribution, properties and radiative effects during the 2009 pre-monsoon season. Atmos. Chem. Phys. 11 (24), 12841–12863. doi:10.5194/acp-11-12841-2011
Ginoux, P., Prospero, J. M., Gill, T. E., Hsu, N. C., and Zhao, M. (2012). Global-scale attribution of anthropogenic and natural dust sources and their emission rates based on MODIS deep blue aerosol products. Rev. Geophys. 50 (3). doi:10.1029/2012rg000388
Go, S., Lyapustin, A., Schuster, G. L., Choi, M., Ginoux, P., Chin, M., et al. (2022). Inferring iron-oxide species content in atmospheric mineral dust from DSCOVR EPIC observations. Atmos. Chem. Phys. 22, 1395–1423. doi:10.5194/acp-22-1395-2022
Green, R. O., Mahowald, N., Ung, C., Thompson, D. R., Bator, L., and Zan, J. (2020). “The Earth surface mineral dust source investigation: an Earth science imaging spectroscopy mission,” in 2020 IEEE aerospace conference (IEEE), 1–15.
Herman, J. R., and Celarier, E. A. (1997). Earth surface reflectivity climatology at 340–380 nm from TOMS data. J. Geophys. Res. Atmos. 102 (D23), 28003–28011. doi:10.1029/97jd02074
Hewson, R., Mshiu, E., Hecker, C., van der Werff, H., van Ruitenbeek, F., Alkema, D., et al. (2020). The application of day and night time ASTER satellite imagery for geothermal and mineral mapping in East Africa. Int. J. Appl. Earth Observation Geoinformation 85, 101991. doi:10.1016/j.jag.2019.101991
Hsu, N. C., Gautam, R., Sayer, A. M., Bettenhausen, C., Li, C., Jeong, M. J., et al. (2012). Global and regional trends of aerosol optical depth over land and ocean using SeaWiFS measurements from 1997 to 2010. Atmos. Chem. Phys. 12 (17), 8037–8053. doi:10.5194/acp-12-8037-2012
Journet, E., Balkanski, Y., and Harrison, S. P. (2014). A new data set of soil mineralogy for dust-cycle modeling. Atmos. Chem. Phys. 14 (8), 3801–3816. doi:10.5194/acp-14-3801-2014
Knippertz, P., and Todd, M. C. (2012). Mineral dust aerosols over the sahara: meteorological controls on emission and transport and implications for modeling. Rev. Geophys. 50 (1). doi:10.1029/2011rg000362
Kok, J. F., Storelvmo, T., Karydis, V. A., Adebiyi, A. A., Mahowald, N. M., Evan, A. T., et al. (2023). Mineral dust aerosol impacts on global climate and climate change. Nat. Rev. Earth and Environ. 4 (2), 71–86. doi:10.1038/s43017-022-00379-5
Kumar, K. R., Sivakumar, V., Yin, Y., Reddy, R. R., Kang, N., Diao, Y., et al. (2014). Long-term (2003–2013) climatological trends and variations in aerosol optical parameters retrieved from MODIS over three stations in South Africa. Atmos. Environ. 95, 400–408. doi:10.1016/j.atmosenv.2014.07.001
Kumar, K. R., Yin, Y., Sivakumar, V., Kang, N., Yu, X., Diao, Y., et al. (2015). Aerosol climatology and discrimination of aerosol types retrieved from MODIS, MISR and OMI over durban (29.88 S, 31.02 E), South Africa. Atmos. Environ. 117, 9–18. doi:10.1016/j.atmosenv.2015.06.058
Lafon, S., Rajot, J. L., Alfaro, S. C., and Gaudichet, A. (2004). Quantification of iron oxides in desert aerosol. Atmos. Environ. 38 (8), 1211–1218. doi:10.1016/j.atmosenv.2003.11.006
Lee, H., Kalashnikova, O. V., Suzuki, K., Braverman, A., Garay, M. J., and Kahn, R. A. (2016). Climatology of the aerosol optical depth by components from the Multi-angle imaging SpectroRadiometer (MISR) and chemistry transport models. Atmos. Chem. Phys. 16 (10), 6627–6640. doi:10.5194/acp-16-6627-2016
Lee, H., Garay, M. J., Kalashnikova, O. V., Yu, Y., and Gibson, P. B. (2018). How long should the MISR record be when evaluating aerosol optical depth climatology in climate models? Remote Sens. 10 (9), 1326. doi:10.3390/rs10091326
Levenberg, K. (1944). A method for the solution of certain non-linear problems in least squares. Q. Appl. Math. 2 (2), 164–168. doi:10.1090/qam/10666
Levy, R. C., Munchak, L. A., Mattoo, S., Patadia, F., Remer, L. A., and Holz, R. E. (2015). Towards a long-term global aerosol optical depth record: applying a consistent aerosol retrieval algorithm to MODIS and VIIRS-Observed reflectance. Atmos. Meas. Tech. 8 (10), 4083–4110. doi:10.5194/amt-8-4083-2015
Li, L., Dubovik, O., Derimian, Y., Schuster, G. L., Lapyonok, T., Litvinov, P., et al. (2019). Retrieval of aerosol components directly from satellite and ground-based measurements. Atmos. Chem. Phys. 19 (21), 13409–13443. doi:10.5194/acp-19-13409-2019
Li, L., Mahowald, N. M., Miller, R. L., Pérez García-Pando, C., Klose, M., Hamilton, D. S., et al. (2021). Quantifying the range of the dust direct radiative effect due to source mineralogy uncertainty. Atmos. Chem. Phys. 21 (5), 3973–4005. doi:10.5194/acp-21-3973-2021
Li, L., Derimian, Y., Chen, C., Zhang, X., Che, H., Schuster, G. L., et al. (2022). Climatology of aerosol component concentrations derived from multi-angular polarimetric POLDER-3 observations using GRASP algorithm. Earth Syst. Sci. Data 14 (7), 3439–3469. doi:10.5194/essd-14-3439-2022
Lyapustin, A. (2005). Radiative transfer code SHARM for atmospheric and terrestrial applications. Appl. Opt. 44, 7764–7772. doi:10.1364/ao.44.007764
Lyapustin, A., Martonchik, J., Wang, Y., Laszlo, I., and Korkin, S. (2011a). Multiangle implementation of atmospheric correction (MAIAC): 1. Radiative transfer basis and Look-Up tables. J. Geophys. Res. 116, D03210. doi:10.1029/2010JD014985
Lyapustin, A., Wang, Y., Laszlo, I., Kahn, R., Korkin, S., Remer, L., et al. (2011b). Multiangle implementation of atmospheric correction (MAIAC): 2. Aerosol algorithm. J. Geophys. Res. 116, D03211. doi:10.1029/2010JD014986
Lyapustin, A. I., Wang, Y., Laszlo, I., Hilker, T. G., Hall, F., Sellers, P. J., et al. (2012). Multi-angle implementation of atmospheric correction for MODIS (MAIAC): 3. Atmospheric correction. Remote Sens. Environ. 127, 385–393. doi:10.1016/j.rse.2012.09.002
Lyapustin, A., Wang, Y., Korkin, S., and Huang, D. (2018). MODIS collection 6 MAIAC algorithm. Atmos. Meas. Tech. 11, 5741–5765. doi:10.5194/amt-11-5741-2018
Lyapustin, A., Go, S., Korkin, S., Wang, Y., Torres, O., Jethva, H., et al. (2021a). Retrievals of aerosol optical depth and spectral absorption from DSCOVR EPIC, front. Remote Sens. 2, 1–14. doi:10.3389/frsen.2021.645794
Lyapustin, A., Wang, Y., Go, S., Choi, M., Korkin, S., Huang, D., et al. (2021b). Atmospheric correction of DSCOVR EPIC: version 2 MAIAC algorithm, front. Remote Sens. 2, 1–10. doi:10.3389/frsen.2021.748362
Lyapustin, A., Wang, Y., Choi, M., Xiong, X., Angal, A., Wu, A., et al. (2023). Calibration of the SNPP and NOAA 20 VIIRS sensors for continuity of the MODIS climate data records. Remote Sens. Environ. 295, 113717. doi:10.1016/j.rse.2023.113717
Lyapustin, A., Choi, M., Wang, Y., Korkin, S., Hyer, E., and Marshak, A. (2025). “Simultaneous retrieval of aerosol optical depth,” in Spectral absorption and layer height from DSCOVR EPIC using MAIAC algorithm.
Marquardt, D. W. (1963). An algorithm for least-squares estimation of nonlinear parameters. J. Soc. Industrial Appl. Math. 11 (2), 431–441. doi:10.1137/0111030
Marshak, A., Herman, J., Adam, S., Karin, B., Carn, S., Cede, A., et al. (2018). Earth observations from DSCOVR EPIC instrument. Bull. Am. Meteorological Soc. 99 (9), 1829–1850. doi:10.1175/bams-d-17-0223.1
Mishchenko, M., Penner, J., and Anderson, D. (2002). Global aerosol climatology project. J. Atmos. Sci. 59 (3), 249. doi:10.1175/1520-0469(2002)059<0249:gacp>2.0.co;2
Moosmüller, H., Engelbrecht, J. P., Skiba, M., Frey, G., Chakrabarty, R. K., and Arnott, W. P. (2012). Single scattering albedo of fine mineral dust aerosols controlled by iron concentration. J. Geophys. Res. Atmos. 117 (D11). doi:10.1029/2011jd016909
National Environmental Satellite, Data, and Information Service (2023). NOAA’s DSCOVR satellite is operating again. Silver Spring, MD: NOAA. Available online at: https://www.nesdis.noaa.gov/news/noaas-dscovr-satellite-operating-again.
Perlwitz, J. P., Pérez García-Pando, C., and Miller, R. L. (2015a). Predicting the mineral composition of dust aerosols–part 1: representing key processes. Atmos. Chem. Phys. 15 (20), 11593–11627. doi:10.5194/acp-15-11593-2015
Perlwitz, J. P., Pérez García-Pando, C., and Miller, R. L. (2015b). Predicting the mineral composition of dust aerosols–part 2: model evaluation and identification of key processes with observations. Atmos. Chem. Phys. 15 (20), 11629–11652. doi:10.5194/acp-15-11629-2015
Pu, B., Ginoux, P., Guo, H., Hsu, N. C., Kimball, J., Marticorena, B., et al. (2020). Retrieving the global distribution of the threshold of wind erosion from satellite data and implementing it into the geophysical fluid dynamics laboratory land–atmosphere model (GFDL AM4. 0/LM4. 0). Atmos. Chem. Phys. 20 (1), 55–81. doi:10.5194/acp-20-55-2020
Remer, L. A., Kleidman, R. G., Levy, R. C., Kaufman, Y. J., Tanré, D., Mattoo, S., et al. (2008). Global aerosol climatology from the MODIS satellite sensors. J. Geophys. Res. Atmos. 113 (D14). doi:10.1029/2007jd009661
Sanwlani, N., and Das, R. (2022). Understanding haze: modeling size-resolved mineral aerosol from satellite remote sensing. Remote Sens. 14 (3), 761. doi:10.3390/rs14030761
Sayer, A. M., Hsu, N. C., Bettenhausen, C., and Jeong, M. J. (2013). Validation and uncertainty estimates for MODIS collection 6 “Deep Blue” aerosol data. J. Geophys. Res. Atmos. 118 (14), 7864–7872. doi:10.1002/jgrd.50600
Scanza, R. A., Mahowald, N., Ghan, S., Zender, C. S., Kok, J. F., Liu, X., et al. (2015). Modeling dust as component minerals in the community atmosphere model: development of framework and impact on radiative forcing. Atmos. Chem. Phys. 15 (1), 537–561. doi:10.5194/acp-15-537-2015
Schuster, G. L., Dubovik, O., and Arola, A. (2016). Remote sensing of soot carbon–part 1: distinguishing different absorbing aerosol species. Atmos. Chem. Phys. 16 (3), 1565–1585. doi:10.5194/acp-16-1565-2016
Schutgens, N., Dubovik, O., Hasekamp, O., Torres, O., Jethva, H., and Stier, P. (2020). AEROCOM/AEROSAT AAOT and SSA study, part I: evaluation and intercomparison of satellite measurements. Atmos. Chem. Phys. Discuss. 2020, 1–35. Available online at: https://acp.copernicus.org/articles/21/6895/2021/.
Shen, Z., Cao, J., Zhang, X., Arimoto, R., Ji, J., Balsam, W., et al. (2006). Spectroscopic analysis of iron-oxide minerals in aerosol particles from northern China. Sci. Total Environ. 367, 899–907. doi:10.1016/j.scitotenv.2006.01.003
Sogacheva, L., Popp, T., Sayer, A. M., Dubovik, O., Garay, M. J., Heckel, A., et al. (2020). Merging regional and global aerosol optical depth records from major available satellite products. Atmos. Chem. Phys. 20, 2031–2056. doi:10.5194/acp-20-2031-2020
Song, Q., Zhang, Z., Yu, H., Ginoux, P., and Shen, J. (2021). Global dust optical depth climatology derived from CALIOP and MODIS aerosol retrievals on decadal timescales: regional and interannual variability. Atmos. Chem. Phys. 21 (17), 13369–13395. doi:10.5194/acp-21-13369-2021
Todd, M. C., Washington, R., Martins, J. V., Dubovik, O., Lizcano, G., M'bainayel, S., et al. (2007). Mineral dust emission from the bodélé depression, northern Chad, during BoDEx 2005. J. Geophys. Res. Atmos. 112 (D6). doi:10.1029/2006JD007170
Torres, O., Bhartia, P. K., Herman, J. R., Syniuk, A., Ginoux, P., and Holben, B. (2002). A long-term record of aerosol optical depth from TOMS observations and comparison to AERONET measurements. J. Atmos. Sci. 59 (3), 398–413. doi:10.1175/1520-0469(2002)059%3C0398:ALTROA%3E2.0.CO;2
Torres, O., Bhartia, P. K., Sinyuk, A., Welton, E. J., and Holben, B. (2005). Total ozone mapping spectrometer measurements of aerosol absorption from space: comparison to SAFARI 2000 ground-based observations. J. Geophys. Res. Atmos. 110 (D10). doi:10.1029/2004jd004611
Torres, O., Tanskanen, A., Veihelmann, B., Ahn, C., Braak, R., Bhartia, P. K., et al. (2007). Aerosols and surface UV products from ozone monitoring instrument observations: an overview. J. Geophys. Res. Atmos. 112 (D24). doi:10.1029/2007jd008809
Torres, O., Ahn, C., and Chen, Z. (2013). Improvements to the OMI near UV aerosol algorithm using A-train CALIOP and AIRS observations. Atmos. Meas. Tech. Discuss. 6 (3), 3257–3270. doi:10.5194/amt-6-3257-2013
Tripathi, M. K., and Govil, H. (2019). Evaluation of AVIRIS-NG hyperspectral images for mineral identification and mapping. Heliyon 5 (11), e02931. doi:10.1016/j.heliyon.2019.e02931
Yu, Y., Notaro, M., Kalashnikova, O. V., and Garay, M. J. (2016). Climatology of summer shamal wind in the Middle East. J. Geophys. Res. Atmos. 121 (1), 289–305. doi:10.1002/2015jd024063
Keywords: climatology, hematite, goethite, iron oxides, imaginary refractive index, single scattering albedo, aerosol layer height
Citation: Go S, Lyapustin A, Choi M, Korkin S, Wang Y and Hyer EJ (2025) MAIAC-based climatology of atmospheric iron-oxide dust species from DSCOVR EPIC observations. Front. Remote Sens. 6:1676851. doi: 10.3389/frsen.2025.1676851
Received: 31 July 2025; Accepted: 13 October 2025;
Published: 30 October 2025.
Edited by:
Diego G. Loyola, German Aerospace Center (DLR), GermanyReviewed by:
Claudia Di Biagio, UMR7583 Laboratoire inter-universitaire des systèmes atmosphèriques (LISA), FranceJiachen Ding, Texas A and M University, United States
Copyright © 2025 Go, Lyapustin, Choi, Korkin, Wang and Hyer. This is an open-access article distributed under the terms of the Creative Commons Attribution License (CC BY). The use, distribution or reproduction in other forums is permitted, provided the original author(s) and the copyright owner(s) are credited and that the original publication in this journal is cited, in accordance with accepted academic practice. No use, distribution or reproduction is permitted which does not comply with these terms.
*Correspondence: Sujung Go, c2dvMUB1bWJjLmVkdQ==