 Mohammed Q. Alkhatib
 Ali Jamali
 Avik Bhattacharya
- 1College of Engineering and IT, University of Dubai, UAE, United Arab Emirates
- 2Department of Geography, Simon Fraser University, Burnaby, BC, Canada
- 3Microwave Remote Sensing Lab, Centre of Studies in Resources Engineering, Indian Institute of Technology Bombay, Mumbai, India
This paper presents ConvAttentionNet, a lightweight and high performing deep learning model developed for accurate and efficient classification of Polarimetric Synthetic Aperture Radar (PolSAR) imagery. The proposed architecture combines multiscale convolutional mixer blocks with a directional convolution based attention mechanism to effectively capture spatial features and suppress background noise. Designed to address the challenges of limited labeled data and computational constraints, ConvAttentionNet achieves superior performance while maintaining a compact model size. Experimental results on three benchmark datasets (Flevoland, San Francisco, and Oberpfaffenhofen) demonstrate that ConvAttentionNet consistently outperforms state of the art CNN based, transformer based, and wavelet based models. It achieves an overall accuracy (OA) of 97.24% and a Kappa coefficient of 96.98 on the Flevoland dataset using only 1% of the training data. These results confirm the model’s robustness, label efficiency, and generalization capabilities, making it a practical solution for operational remote sensing scenarios with limited computational resources. The source code for this work will be publicly available at: https://github.com/aj1365/ConvAttentionNet.
1 Introduction
Polarimetric Synthetic Aperture Radar (PolSAR) has become a critical modality in remote sensing due to its ability to operate in all weather conditions, day or night, and to capture both structural and dielectric properties of surface materials through its polarimetric channels (Hajnsek and Desnos, 2021). These unique advantages make PolSAR suitable for a wide range of Earth observation tasks, including land cover classification, environmental monitoring, and disaster assessment. However, interpreting PolSAR imagery remains a complex task, primarily due to its multidimensional nature and the need for expert annotation. The scarcity of high quality labeled data continues to pose a significant challenge for developing reliable supervised learning models in this domain (Yu et al., 2011).
Traditional approaches to PolSAR data classification have included K nearest neighbors (KNN), support vector machines (SVM), and random forests (Shah Hosseini et al., 2011; Du et al., 2015), which often rely on handcrafted features and struggle with generalization. In recent years, deep learning has brought substantial progress in this area. Convolutional Neural Networks (CNNs), in particular, have demonstrated the ability to learn spatial hierarchies of features directly from the input data (Zhou et al., 2016; Zhang et al., 2018). Enhancements such as wavelet based preprocessing (Jamali et al., 2022), dual branch architectures (Shang et al., 2022), and 3D convolutions (Zhang et al., 2018) have further improved classification accuracy. Recent studies have also focused on efficiency and automatic network design. GICANet introduced ghost convolution with a coordinate attention mechanism to reduce redundancy and improve sensitivity to local textures (Shang et al., 2025), while AutoPolCNN applied neural architecture search to automatically design CNN architectures for PolSAR classification (Liu et al., 2025). More recently, Vision Transformers (ViTs) have been applied to remote sensing problems, including PolSAR data classification, due to their ability to model long range dependencies (Dong et al., 2021; Alkhatib, 2025). Beyond ViTs, diffusion based approaches have been proposed, such as MCDiff, which models class probabilities using scattering characteristics and multiscale noise prediction (Zhang et al., 2025), and complex valued diffusion models that operate in the amplitude and phase domain to enable self supervised learning without labeled data (Kuang et al., 2025b). State space models have also emerged as alternatives, where ECP-Mamba integrates multiscale contrastive learning with a Mamba backbone to improve accuracy and efficiency (Kuang et al., 2025a). Furthermore, complex valued CNN designs remain active, with multi scale feature extraction networks using CV-3D convolutions and CV-SE modules to exploit both amplitude and phase information effectively (Jiang et al., 2025).
Recent research has demonstrated that attention mechanisms play a critical role in enhancing PolSAR image classification by enabling models to better manage complex scattering patterns and emphasize informative features. For instance, the AFS-CNN framework (Dong et al., 2020) integrates attention-driven feature selection into an end-to-end learning pipeline, while the composite sequential network (CSN) (Yang et al., 2021) employs POA attention to model sequences of coherency matrices for improved interpretation of scattering orientation. Other architectures such as attention-based multiscale sequential networks (Hua et al., 2022) effectively leverage multiscale spatial cues, improving segmentation outcomes. Squeeze-and-excitation modules have also been incorporated into multi-branch fusion frameworks (Alkhatib et al., 2025; Hu et al., 2018) to strengthen inter-channel relationships. LSTCNNs (Zhang et al., 2023) enhance spatial awareness by integrating both pixel-level similarity and neighborhood-based texture attention. Despite these advancements, embedding attention mechanisms effectively into feature maps remains a challenge, particularly in lightweight or low-complexity networks. Nevertheless, these studies collectively underscore the substantial contribution of attention mechanisms in advancing PolSAR data classification models.
Despite these advances, two critical challenges persist: (1) the limited availability of annotated PolSAR data, and (2) the high computational complexity of current state of the art models, particularly transformer based architectures (Khan et al., 2022). ViTs, while powerful, require large scale labeled datasets and extensive hardware resources, making them impractical for real time or onboard applications. Conversely, lightweight CNNs, although efficient, often compromise performance, especially in low data regimes. As a result, there is a growing need for architectures that maintain high classification accuracy while being computationally efficient and robust to data scarcity.
In response to these limitations, we propose ConvAttentionNet, a compact and efficient deep learning model tailored for PolSAR image classification. The proposed model integrates multi scale convolutional mixer blocks to extract spatial features at different receptive fields and introduces a lightweight linear attention mechanism to selectively enhance discriminative regions. This architectural design enables ConvAttentionNet to achieve strong classification performance while significantly reducing the number of parameters and floating point operations (FLOPs).
ConvAttentionNet is specifically designed to address three key challenges: (1) effective learning from limited labeled samples, (2) low computational overhead for real time applicability, and (3) a favorable tradeoff between model complexity and accuracy. The model is evaluated on three benchmark PolSAR datasets: Flevoland, San Francisco, and Oberpfaffenhofen, and demonstrates consistent performance gains over existing CNN based, wavelet based, and transformer based models, even when trained with only 1% of available labeled data. These results highlight ConvAttentionNet’s suitability for practical deployment in operational scenarios constrained by limited data and computational resources.
Unlike prior lightweight models developed primarily for natural image analysis, the design of ConvAttentionNet is conceptually motivated by the unique characteristics of PolSAR data. The proposed convolutional mixer block integrates multi-scale convolutions to capture the diverse scattering behaviors present in polarimetric imagery while maintaining computational efficiency. Moreover, the linear convolution-based attention employs directional filters along horizontal and vertical axes, which avoids the loss of fine spatial details typically introduced by global pooling in conventional attention modules, as will be discussed in section 3.3.1. This architectural choice directly addresses the need to preserve polarimetric scattering patterns while enhancing discriminative features under limited training data. Together, these design principles establish ConvAttentionNet as a tailored solution for PolSAR image classification, rather than a simple recombination of existing techniques.
The main contributions of this paper are summarized as follows:
1. Multi Scale Spatial Feature Extraction: The model employs convolutional mixer blocks with varied kernel sizes to effectively capture features at multiple spatial scales.
2. Dynamic Attention Mechanism: A lightweight linear attention module enhances salient features while suppressing background noise, improving classification accuracy.
3. Efficient and Stable Training: Residual connections ensure stable gradient flow and allow for deeper architecture without introducing significant computational cost.
4. Robustness in Low Data Regimes: The model achieves high classification performance using only 1% of labeled training data, demonstrating strong generalization capabilities.
5. Computational Efficiency: ConvAttentionNet significantly reduces the number of parameters and FLOPs compared to transformer based and wavelet based models, making it suitable for real time and resource constrained applications.
The rest of the paper is organized as follows: Section 2 presents the proposed model architecture. Section 3 details the experimental setup and results. Section 4 offers insights and interpretation of the findings. Section 5 concludes the study and outlines directions for future research.
2 Proposed methodology
The ConvAttentionNet model (Figure 1) processes an input PolSAR image tensor
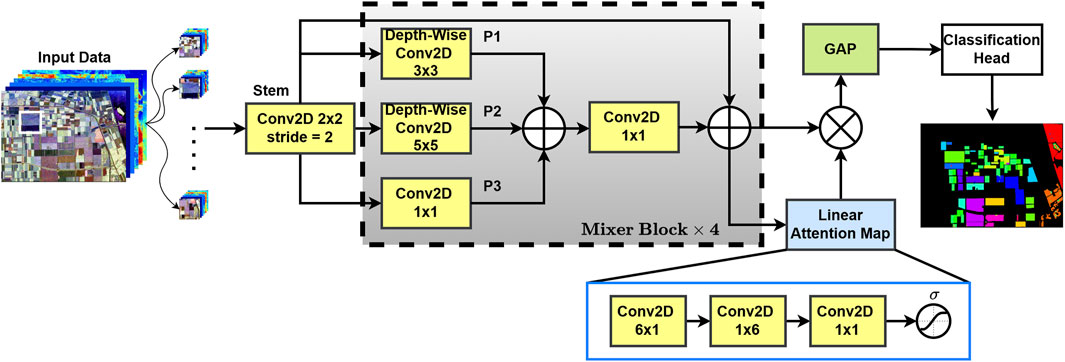
Figure 1. The overall architecture of the developed ConvAttentionNet deep learning model.
Convolutional Stem: The input tensor
where
Convolutional Mixer Blocks: The output
Attention Mechanism: The output
The attention map
where
Global Average Pooling and Classification: The modulated feature map
Finally, the pooled features
2.1 Convolutional mixer block
The Mixer Block enhances spatial feature learning with multi-scale convolutions and residual connections. The input to each mixer block is the output
To capture spatial patterns, we apply depth-wise convolutions with kernel sizes
These feature maps are combined by Equation 8 below:
A point-wise convolution, activation, and batch normalization (Equation 9) are applied:
Finally, we add the activated output to the residuals, in Equation 10:
The output
2.2 Linear attention mechanism
The attention module emphasizes specific spatial dependencies and improves feature representation across various scales by employing linear convolutional filters in both horizontal and vertical directions. Furthermore, the attention map’s last sigmoid activation ensures the module dynamically scales the features, enabling the model to prioritize each image’s most informative areas. Specifically, the sigmoid function normalizes the attention scores between 0 and 1, which enables the network to suppress background responses while emphasizing salient spatial regions. As a result, feature maps corresponding to important scattering patterns receive higher weights, thereby enhancing their contribution during classification. The module optimizes resource allocation during training and inference by enabling refined spatial attention, improving performance without appreciably increasing computational load. To capture horizontal and vertical dependencies, sequential convolutions are applied. First, a horizontal convolution (Equation 11) with kernel size
This is followed by a vertical convolution (Equation 12) with kernel size
Finally, a point-wise convolution (Equation 13) restores the channel dimensions to the desired output size
where
It should be noted that the design of ConvAttentionNet is motivated by the statistical and physical properties of PolSAR data. The multi-scale convolutional mixer blocks allow the network to capture heterogeneous scattering behaviors across different spatial resolutions, while the directional convolution-based attention preserves anisotropic structural details without relying on global pooling. These architectural choices ensure that the model remains lightweight yet well aligned with the domain-specific requirements of PolSAR data classification.
2.3 Polarimetric data of PolSAR image
In fully polarimetric (FP) SAR, the
The scattering vector
The
The resulting
This study utilizes the magnitude of all six unique elements of the coherency matrix
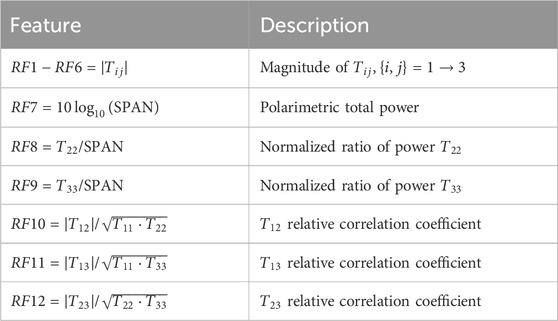
Table 1. Polarimetric descriptor features extracted from the coherency matrix
While complex-valued networks have demonstrated superior classification performance for PolSAR data compared to real valued networks (Alkhatib, 2024), their increased computational complexity, stemming from a larger parameter count, can hinder real time applications. In order to strike an optimal balance between accuracy and efficiency, this work employs feature descriptors carefully selected based on their proven efficacy in enhancing PolSAR data classification (Bi et al., 2018).
3 Experimental results
The results section presents five key analyses: (1) PolSAR dataset specifications, (2) experimental setup details, (3) attention mechanism impact, (4) comparative evaluation with state of the art methods, and (5) performance under varying training data amounts, providing comprehensive validation of our approach.
3.1 Polarimetric SAR datasets
This study evaluates the proposed model using three PolSAR datasets. The first dataset covers the Flevoland region, consisting of L-band four-look PolSAR data acquired by NASA/JPL’s AIRSAR system on 16 August 1989. The image size is
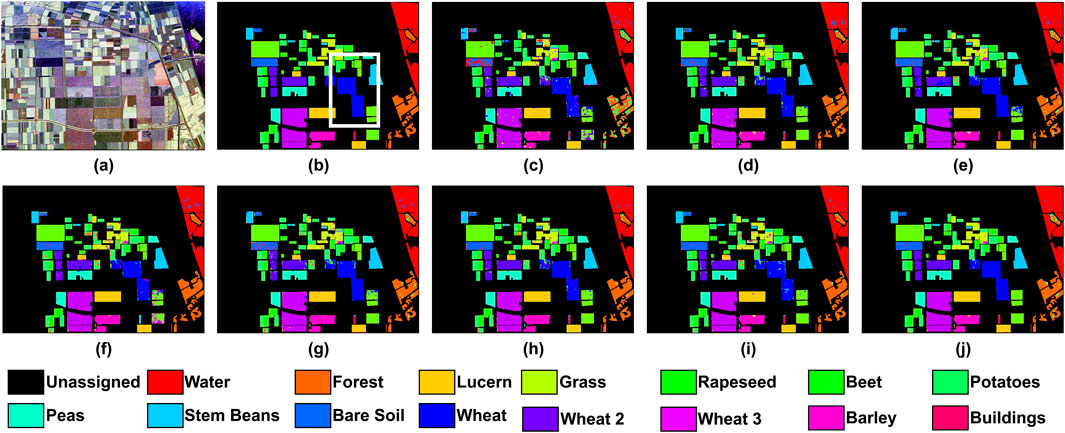
Figure 2. Classification results of the Flevoland dataset. (a) Pauli RGB; (b) Reference Class Map; (c) 2D-CNN; (d) 3D-CNN; (e) WaveletCNN; (f) ViT; (g) Swin T.; (h) PolSARFormer; (i) PolSARConvMixer; (j) ConvAttentionNet.
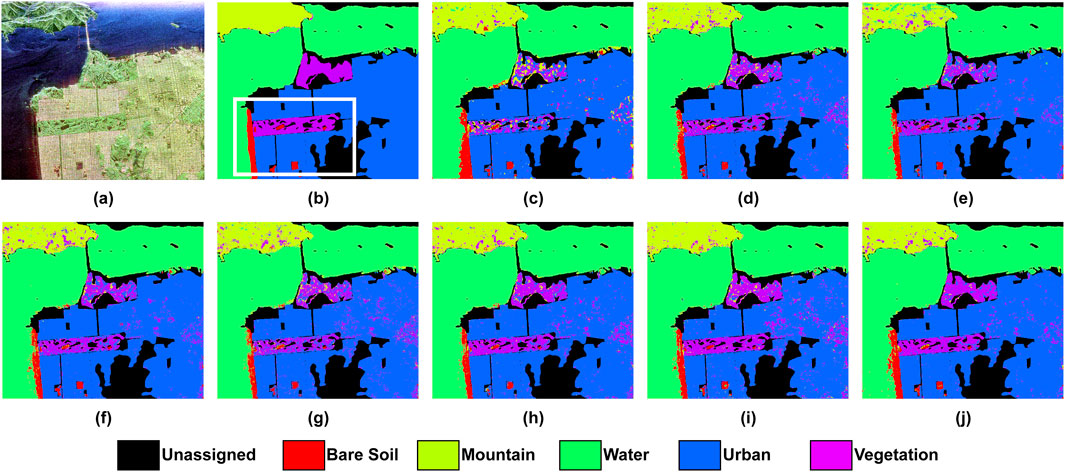
Figure 3. Classification results of the San Francisco dataset. (a) Pauli RGB; (b) Reference Class Map; (c) 2D-CNN; (d) 3D-CNN; (e) WaveletCNN; (f) ViT; (g) Swin T.; (h) PolSARFormer; (i) PolSARConvMixer; (j) ConvAttentionNet.
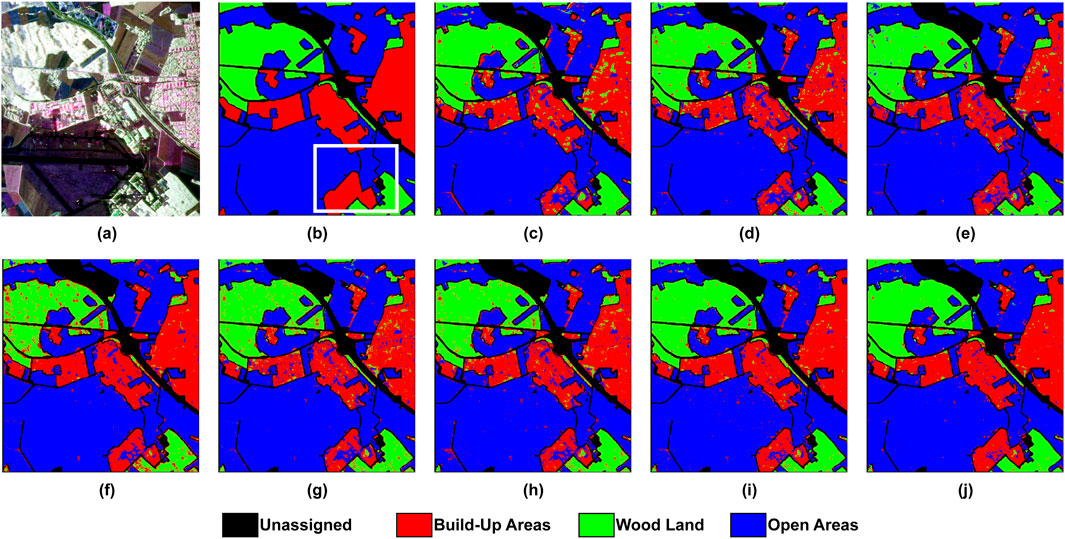
Figure 4. Classification results of the Oberpfaffenhofen dataset. (a) Pauli RGB; (b) Reference Class Map; (c) 2D-CNN; (d) 3D-CNN; (e) WaveletCNN; (f) ViT; (g) Swin T.; (h) PolSARFormer; (i) PolSARConvMixer; (j) ConvAttentionNet.
Although the full images contain 768,000 (Flevoland), 921,600 (San Francisco), and 1,560,000 (Oberpfaffenhofen) pixels, only a subset of these are labeled: 207,832, 802,302, and 1,311,618 pixels respectively. The number of training and testing samples per class is detailed in Tables 5,6,7. In PolSAR data classification (and hyperspectral image classification as well), a patch-based strategy is commonly used, where small image patches centered around a labeled pixel (typically of size
3.2 Experimental configuration and evaluation metrics
All experiments were conducted using Python 3.9 and TensorFlow 2.10.0 on a Windows 10 workstation equipped with 64 GB RAM and an NVIDIA GeForce RTX 2080 GPU (8 GB VRAM). The Adam optimizer was used with a fixed learning rate of
To ensure fair comparison, only 1% of the labeled samples from each dataset were used for training. These were selected in a stratified manner to preserve the original class distribution. For each labeled pixel, a patch of size
To quantitatively evaluate classification performance, several widely adopted metrics were used. These include Overall Accuracy (OA), which measures the proportion of correctly classified pixels across the entire dataset, and Average Accuracy (AA), which computes the mean accuracy across all classes regardless of their frequency. Per-class accuracy was also calculated to assess model performance for each individual land cover type.
In addition, the Kappa coefficient was reported to quantify the agreement between predicted and true labels while accounting for chance agreement. To further assess model behavior in the presence of class imbalance, macro-averaged Precision, Recall, and F1-score were computed. Precision evaluates the proportion of correct positive predictions, while Recall measures the model’s ability to identify all relevant instances. The F1-score, as the harmonic mean of Precision and Recall, provides a balanced indicator of model performance across all classes.
3.3 Impact of attention
This section evaluates the performance enhancement resulting from integrating the attention block into the baseline mixer block. Comparative experiments were conducted on all three benchmark datasets (Flevoland, San Francisco, and Oberpfaffenhofen) with and without the attention mechanism. In addition, this section also serves as an ablation study of the model components, isolating the contribution of the proposed attention design to the overall performance. Table 2 demonstrates consistent performance gains across all evaluation metrics when employing the attention mechanism. For the Flevoland dataset, the OA improves from 96.62% to 97.24%, while AA rises from 95.15% to 95.99%. The Kappa coefficient similarly increases from 96.30 to 96.98. These improvements confirm that the attention mechanism strengthens the model’s discriminative power for land cover classification while boosting generalization capability.
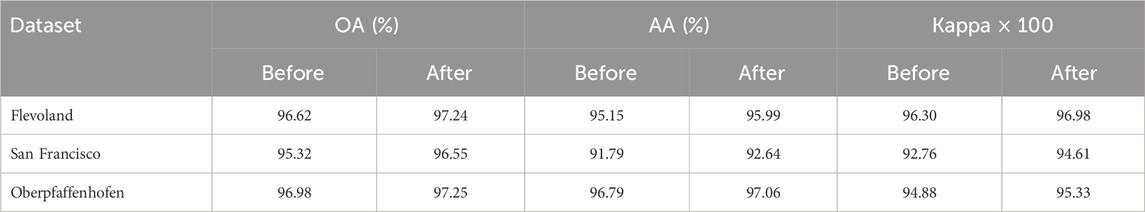
Table 2. Classification results the proposed model before and after the attention block.
The San Francisco dataset exhibits the most substantial performance improvements, with the OA increasing by 1.23% (from 95.32% to 96.55%). The Kappa coefficient rose by 1.85 points (from 92.76 to 94.61). The AA also shows a notable gain from 91.79% to 92.64%, indicating enhanced prediction consistency across all land cover classes. While the Oberpfaffenhofen dataset starts with relatively high baseline performance (OA: 96.98%, Kappa: 94.88), the attention mechanism produces modest improvements, elevating the OA to 97.25% and the Kappa coefficient to 95.33. These consistent improvements across all three datasets demonstrate that the attention mechanism effectively enhances the model’s ability to focus on the most discriminative spatial and contextual features, thereby boosting classification performance across diverse environments.
3.3.1 Comparison with state of the art attention mechanisms
To further validate the effectiveness of the proposed convolution-based attention, a comparison was conducted against several widely used attention modules, namely, Squeeze-and-Excitation (SE) (Hu et al., 2018), Convolutional Block Attention Module (CBAM) (Woo et al., 2018), Efficient Channel Attention (ECA) (Wang et al., 2020), and Coordinate Attention (CA) (Hou et al., 2021). The results of this experiment on Flevoland dataset are summarized in Table 3, where both performance metrics (OA, AA, and Kappa coefficient) and complexity measures (number of parameters, FLOPs, and MACs) are reported.
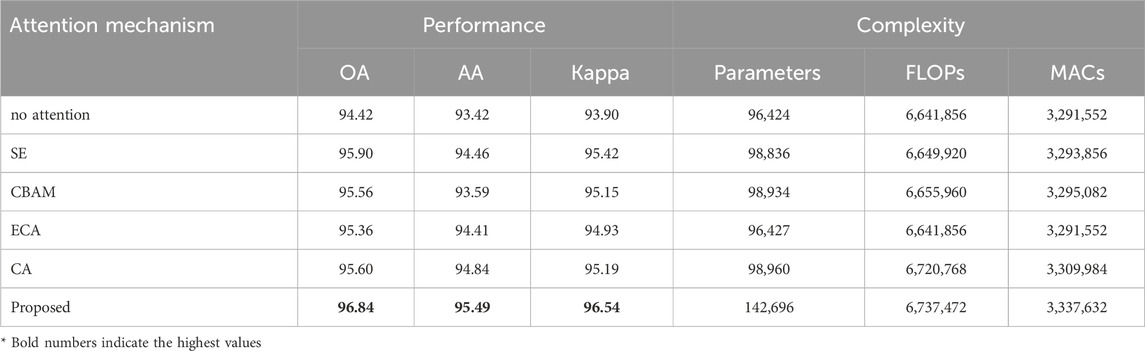
Table 3. Performance comparison of different attention mechanisms.
From a performance perspective, all attention mechanisms improved classification accuracy compared to the baseline network without attention (OA: 94.42%, AA: 93.42%, Kappa: 93.90). Among the existing methods, SE and CA provided consistent gains, achieving OA values of 95.90% and 95.60%, respectively. ECA and CBAM also enhanced performance but to a slightly lesser extent. In contrast, the proposed attention achieved the best results overall, with an OA of 96.84%, AA of 95.49%, and a Kappa coefficient of 96.54, clearly surpassing all other mechanisms. This demonstrates the superior discriminative capability of the proposed design in capturing spatial and contextual information from PolSAR imagery.
In terms of complexity, the baseline model without attention had the lowest number of parameters (96,424), FLOPs (6.64M), and MACs (3.29M). SE and ECA introduced only marginal increases in parameter count and computational cost, while CBAM and CA required slightly more resources. The proposed attention mechanism, although heavier (142,696 parameters, 6.74M FLOPs, and 3.34M MACs), remains computationally efficient and lightweight when compared to transformer-based methods reported in later sections. Importantly, the modest increase in complexity is justified by the substantial gains in performance, highlighting the favorable trade-off achieved by the proposed module.
Overall, this analysis confirms that the proposed attention mechanism outperforms state of the art modules such as SE, ECA, CBAM, and CA in terms of accuracy, while maintaining competitive efficiency. A key reason for this improvement lies in the reliance of conventional modules on global pooling operations (e.g., average or max pooling) to generate attention maps. Although such pooling is effective for reducing dimensionality, it inevitably compresses spatial information and may blur fine scattering details that are critical in PolSAR data classification. In contrast, the proposed mechanism avoids excessive pooling by employing directional convolutional filters that preserve local spatial dependencies while suppressing background noise. This balance between discriminative power and computational efficiency makes the proposed approach particularly well suited for PolSAR data classification tasks, where both accuracy and resource constraints are of primary importance.
3.4 Comparison with other methods
To evaluate ConvAttentionNet, we compare against seven state of the art approaches: the conventional 2D-CNN (Zhou et al., 2016), 3D-CNN (Zhang et al., 2018), wavelet-based CNN (WaveletCNN) (Jamali et al., 2022), Vision Transformer (ViT) (Dong et al., 2021), Swin Transformer (Swin T.) (Liu et al., 2021), Local Window Attention Transformer (PolSARFormer) (Jamali et al., 2023), and PolSARConvMixer (Jamali et al., 2024). For a fair comparison, all models used the same train/test splits and were trained with the optimized hyperparameters reported in their original research, ensuring each model operates under its best-known configuration.
3.4.1 Networks complexity
Table 4 provides a detailed breakdown of each neural network model’s complexity, including the number of parameters, floating point operations (FLOPs), and multiply-accumulate operations (MACs). The number of parameters refers to the total learnable weights in the network, which influences memory usage and storage requirements. FLOPs represent the total number of floating-point operations needed for a single forward pass, indicating the model’s computational demand. MACs count the number of multiply-and-accumulate operations, which are fundamental to convolution and matrix multiplication steps in deep networks. The analysis shows that ConvAttentionNet offers an optimal balance between computational efficiency and performance. With 142,696 parameters, 6,737,472 FLOPs, and 3,337,632 MACs, ConvAttentionNet significantly reduces computational demands compared to models such as WaveletCNN, which requires 195,928,265 FLOPs and 97,964,133 MACs. This highlights ConvAttentionNet’s ability to optimize FLOPs and MACs while retaining high performance, making it a more efficient alternative to more complex models like WaveletCNN and PolSARFormer, and outperforming simpler architectures such as 2D-CNN. While the Swin Transformer demonstrates lower FLOPs and MACs, ConvAttentionNet achieves superior classification accuracy, making it a more suitable choice for PolSAR applications where accuracy is paramount. Moreover, despite its slightly higher computational cost, the model remains practical for real world deployment. Once trained, the inference time required to classify an image is nearly instantaneous, regardless of the number of model parameters, ensuring efficiency in operational scenarios.
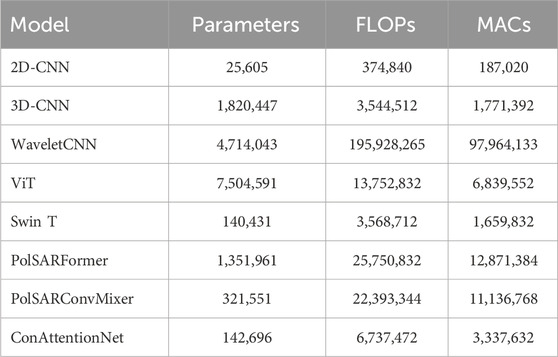
Table 4. Parameters, FLOPs, and MACs of each Model used in this research.
3.4.2 Results on flevoland dataset
Figure 2 presents the classification maps obtained by different models on the Flevoland dataset. A white box is included to highlight a representative area where differences in performance are visually noticeable. The corresponding quantitative results, based on only 1% of the training data, are summarized in Table 5. The proposed ConvAttentionNet achieves state of the art results with 97.24% OA, 95.99% AA, and a 96.98 Kappa coefficient. This represents significant improvements over previous approaches: traditional CNNs (2D-CNN: 87.43%, 3D-CNN: 94.51%, WaveletCNN: 93.40%), transformer-based models (ViT: 93.28%, Swin Transformer: 93.59%), and recent PolSAR specific methods (PolSARFormer: 95.75%, PolSARConvMixer: 95.89%). ConvAttentionNet outperforms these by 1.49% and 1.35%, respectively, demonstrating its superior classification capability.
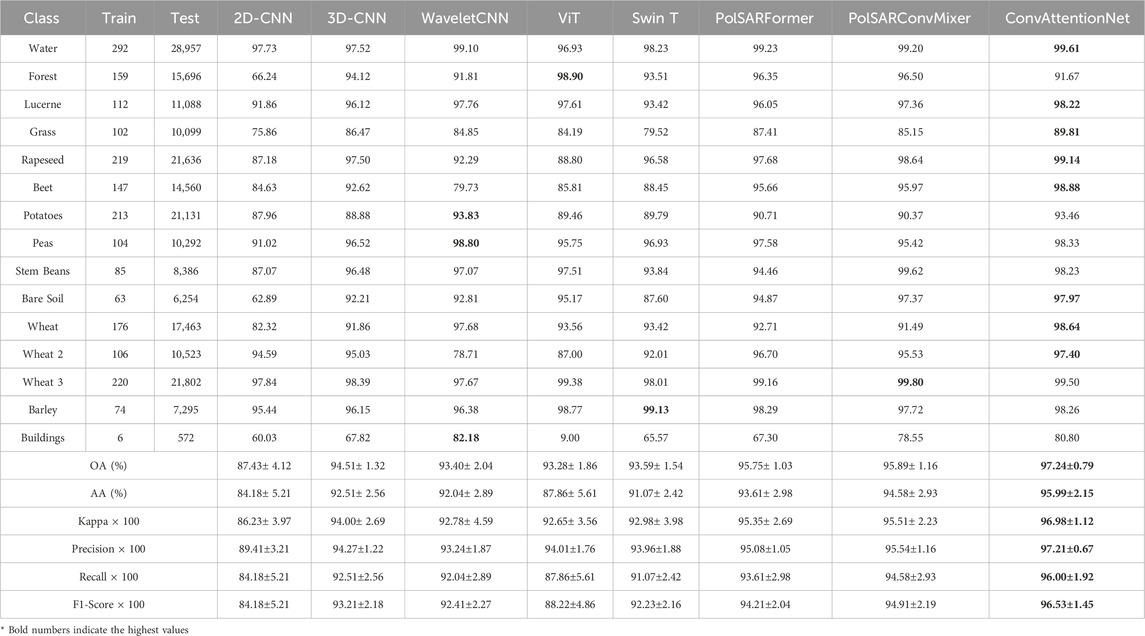
Table 5. Experimental Results of different methods on Flevoland Dataset.
In addition to overall performance, ConvAttentionNet achieves the highest class-wise accuracy in eight of the 15 land cover categories. As shown in Table 5, classification accuracy varies significantly depending on two key factors: (1) the number of available training samples and (2) the complexity of scattering characteristics. Classes with limited training data (e.g., Buildings) exhibit lower accuracy due to insufficient learning, while well-represented classes with distinct backscatter patterns (e.g., Water) achieve better classification. Notably, the Vision Transformer (ViT) model performs poorly on the Buildings class, achieving only 9% accuracy. This can be attributed to the extremely limited number of labeled samples (only 6), which is insufficient to train a data-hungry model like ViT effectively. Urban areas present particular challenges, as their complex scattering mechanisms lead to high intra-class variability and inter-class overlap, often resulting in misclassification. In contrast, homogeneous classes with simple scattering properties (e.g., Bare Soil and Water) show significantly higher accuracy due to their more separable feature distributions.
Beyond overall and class-wise accuracy, ConvAttentionNet also achieves the highest precision (97.21%) across all methods. Precision is a critical metric in applications where false positives must be minimized, such as identifying urban areas or water bodies in remote sensing workflows. The higher precision indicates that ConvAttentionNet is more selective and consistent in its predictions, reducing misclassifications across similar land cover types. This reinforces the model’s ability to avoid over-generalization and maintain robust discriminability, especially in cluttered or ambiguous regions.
3.4.3 Results on San Francisco Dataset
Figure 3 presents the classification maps for the San Francisco dataset, with corresponding quantitative metrics shown in Table 6. The proposed ConvAttentionNet achieves superior performance with 96.55% OA, 92.64% AA, and a 94.61 Kappa coefficient, outperforming all comparison methods. Recent advanced approaches like PolSARConvMixer (95.41% OA, 91.09% AA) and PolSARFormer (95.45% OA, 87.74% AA) show competitive but lower accuracy. Compared to CNN-based methods, ConvAttentionNet demonstrates noticeable gains over both 3D-CNN (95.11% OA) and 2D-CNN (92.76% OA). Transformer architectures achieve good results (ViT: 94.93% OA, 89.21% AA; Swin Transformer: 93.77% OA, 82.52% AA) but exhibit quite weaker class-wise discrimination, particularly in the case of Swin Transformer’s 82.52% AA versus ConvAttentionNet’s 92.64%.
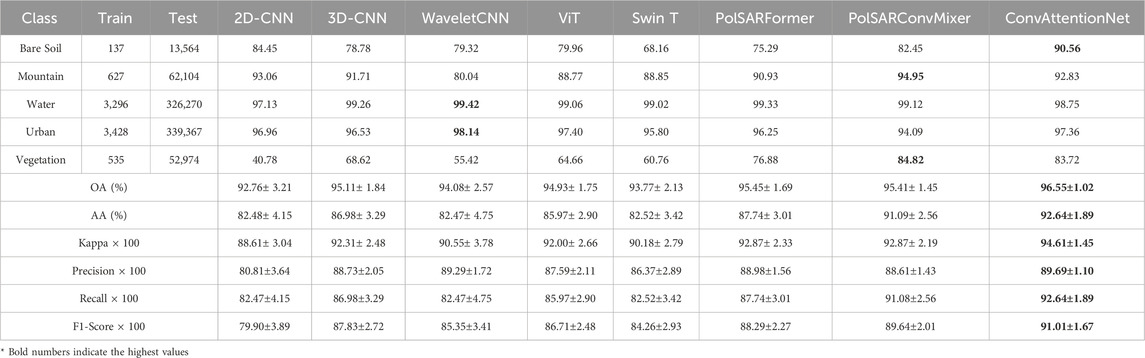
Table 6. Experimental Results of different methods on San Francisco Dataset.
In terms of class-wise performance, ConvAttentionNet gives good accuracy for Bare Soil (90.56%) and Urban (97.36%) while provides competitive results for Mountain (92.83%) and Vegetation (83.72%). In comparison, alternative models (WaveletCNN and PolSARConvMixer) perform better in specific classes such as Water and Mountain. Nonetheless, ConvAttentionNet provides more consistent classification accuracy across all land cover categories. This balanced performance is visually confirmed in Figure 3, where ConvAttentionNet generates more spatially coherent segmentation maps, particularly in heterogeneous urban areas and textured vegetated regions. Overall, the results demonstrate ConvAttentionNet’s robust handling of both the spatial complexity and polarimetric diversity characteristic of the San Francisco scene, even when trained with limited reference data.
Additionally, ConvAttentionNet achieves the highest recall score (92.64%) among all evaluated models. Recall is particularly important in remote sensing applications where missing instances of critical classes—such as urban infrastructure or vegetative cover—can lead to underreporting and operational blind spots. The high recall indicates that ConvAttentionNet effectively captures true positives across all classes, ensuring that fewer relevant pixels are overlooked. This capability is essential in tasks such as environmental monitoring, where complete coverage is often more valuable than selective accuracy.
3.4.4 Results on oberpfaffenhofen dataset
Figure 4 shows the classification maps generated by different models for the Oberpfaffenhofen dataset, with Table 7 providing quantitative performance metrics. The proposed ConvAttentionNet achieves superior performance across all evaluation metrics, attaining 97.25% overall accuracy (OA), 97.06% average accuracy (AA), and a Kappa coefficient of 95.33. PolSARConvMixer demonstrates strong but comparatively lower performance with 96.26% OA and 93.64 Kappa. Conventional CNN-based approaches (2D-CNN, 3D-CNN, and WaveletCNN) exhibit more limited capabilities, with Kappa values ranging from 88.80 to 90.83 and correspondingly lower accuracy measures. Transformer architectures (ViT and Swin Transformer) are comparable to CNNs, achieving Kappa values of 89.82 and 90.04, respectively, but fail to surpass the proposed method’s classification effectiveness.
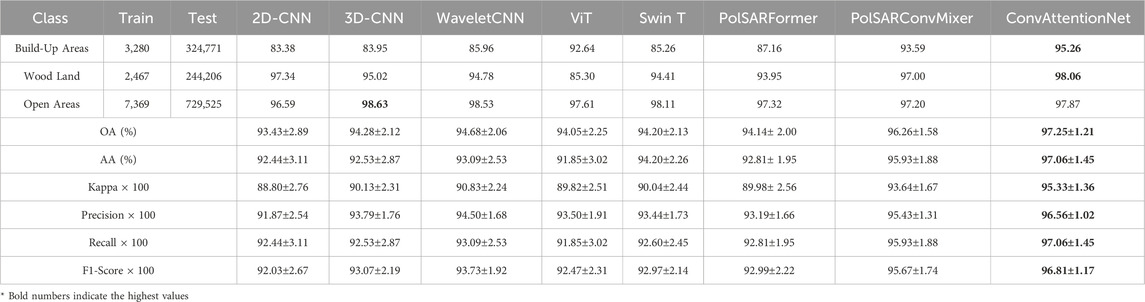
Table 7. Experimental Results of different methods on Oberpfaffenhofen Dataset.
ConvAttentionNet achieves the highest classification accuracy for two of the three land cover classes, attaining 95.26% for Build-Up Areas and 98.06% for Wood Land. In the Open Areas category, 3D-CNN performs best with 98.63% accuracy, followed by WaveletCNN (98.53%) and Swin Transformer (98.11%). ConvAttentionNet achieves a competitive result of 97.87%, ranking fourth among the compared methods. The proposed model demonstrates substantial improvements over competing architectures, outperforming PolSARFormer (a CNN-transformer hybrid) by 5.35 Kappa values and Swin Transformer by 5.29 Kappa values. These quantitative advantages are visually supported by the classification maps in Figure 4, confirming ConvAttentionNet’s enhanced capability to simultaneously capture spatial contextual features in heterogeneous urban areas and polarimetric scattering characteristics across natural land covers.
In addition to traditional accuracy measures, ConvAttentionNet achieves the highest F1-score (96.81%), outperforming all other methods including PolSARConvMixer (95.67%), PolSARFormer (92.99%), and ViT (92.47%). The F1-score reflects the harmonic mean of precision and recall, and is especially useful when class imbalance or asymmetric misclassification costs are present. Its high value for ConvAttentionNet indicates not only that the model avoids both false positives and false negatives effectively, but also that it consistently performs well across all classes. This is particularly important for PolSAR data classification where both missed detections and false alarms can degrade overall mapping reliability. The result highlights the model’s capacity to deliver balanced and dependable predictions, even under varying spatial and polarimetric complexity.
3.5 Model performance across varying training data percentages
To assess the generalization ability of the proposed ConvAttentionNet model under constrained training conditions, a comprehensive evaluation was performed against all baseline methods using training subsets varying from 1% to 5% per class. As shown in Figure 5, ConvAttentionNet consistently delivers superior performance across all training ratios. A clear upward trend in classification accuracy is observed as more training data becomes available.
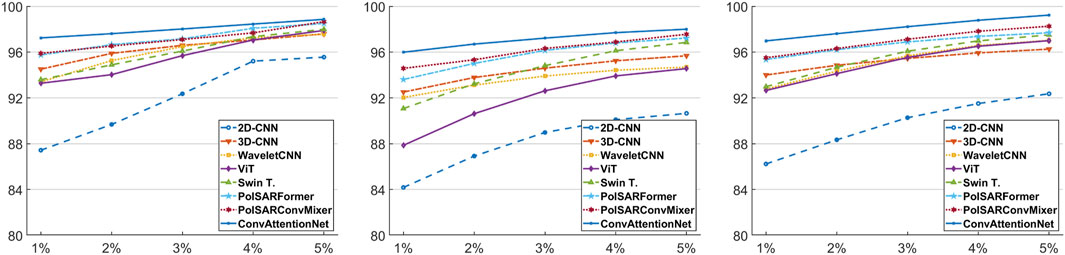
Figure 5. Overall Accuracy with respect to training percentages: (left) FL, (Middle) SF, and (right) Oberpfaffenhofen
Further analysis indicates that CNN-based models tend to outperform Transformer-based architectures such as ViT and Swin when training data is scarce, likely due to the data-hungry nature of Transformers. However, as training data increases, ViT begins to surpass the performance of 3D-CNN in terms of overall accuracy. Notably, ConvAttentionNet achieves gains in OA of approximately 1.60%, 2.01%, and 1.79% under 1%–5% training conditions, respectively, as illustrated in Figure 5.
3.6 Model performance across different values of patch size
In this section, the influence of the image patch spatial characteristics of the various datasets on the ConvAttentionNet model’s performance in classifying PolSAR imagery is analyzed, with particular attention to identifying the optimal patch size for each dataset. The patch size defines the amount of spatial information extracted from the 3D patch, which is then used to label the center pixel. A larger patch may capture excessive neighboring information, possibly incorporating pixels from different classes, which can degrade feature extraction. Conversely, a patch that is too small may result in the loss of critical spatial information, thereby reducing the model’s ability to learn discriminative features effectively. To investigate this effect, experiments were conducted with patch sizes of {
As shown in Table 8, the optimal patch size for the ConvAttentionNet model varies across the three datasets. For the Flevoland dataset, the highest accuracy (97.88%) was achieved with a patch size of
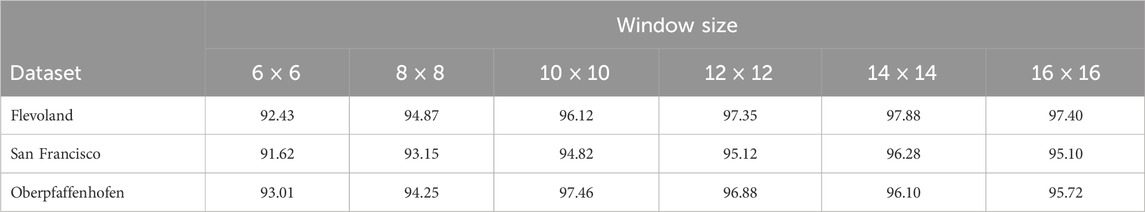
Table 8. Overall Accuracy (%) of ConvAttentionNet across different patch window sizes for the three datasets.
It is also worth noting that the spatial resolution of each dataset may play a role in determining the optimal patch size. The Oberpfaffenhofen dataset has the highest spatial resolution (3 m), which allows finer details to be captured within smaller patches, making
4 Discussion
The experimental results across all datasets confirm that ConvAttentionNet strikes a strong balance between model simplicity and classification effectiveness. One of the most notable aspects of the model is its lightweight architecture. With only 142,696 trainable parameters and modest computational requirements (6.7 million FLOPs and 3.3 million MACs), ConvAttentionNet significantly reduces the burden on processing resources. This compact design enables fast inference and makes the model particularly suitable for real world deployment, especially in environments with limited computational power or memory.
Despite its efficiency, ConvAttentionNet consistently delivers strong classification performance. It achieves the highest overall accuracy, average accuracy, and Kappa coefficient across the Flevoland, San Francisco, and Oberpfaffenhofen datasets. These results reflect not only the model’s effectiveness but also its ability to generalize well across different land cover types, spatial resolutions, and polarimetric complexities.
A key factor behind this strong performance is the model’s ability to learn from very limited training data. Even when trained on just 1% of labeled pixels, ConvAttentionNet outperforms more complex models that typically require much larger datasets to perform well. This is especially important in PolSAR applications, where labeled samples are scarce and difficult to obtain. As the proportion of training data increases, competing methods improve in accuracy, as expected, but ConvAttentionNet maintains its lead across all proportions. This demonstrates the model’s robustness and data efficiency.
The architectural design also plays a crucial role in the model’s success. By incorporating multi-scale convolutional mixer blocks, ConvAttentionNet can capture both fine-grained and broader spatial features, enabling the representation of complex spatial patterns and scattering mechanisms found in PolSAR images. This multiscale feature fusion is particularly important given the heterogeneous scattering responses across different land cover types. The convolutional attention mechanism further refines this process by directing the model’s capacity toward the most informative regions, improving class discrimination and suppressing background noise. Unlike conventional modules that rely on global pooling, the proposed attention employs directional convolutions along horizontal and vertical axes, allowing the model to preserve fine structural details and model anisotropic scattering behaviors more effectively. This domain-driven design choice not only improves classification robustness but also ensures computational efficiency, making ConvAttentionNet well suited for deployment in resource-constrained environments.
Like any model, ConvAttentionNet faces challenges in classifying underrepresented or structurally complex categories. The model consistently achieves high accuracy for classes with distinct and homogeneous scattering characteristics, such as Water, Rapeseed, and Wheat in the Flevoland dataset, or Wood Land and Build Up Areas in the Oberpfaffenhofen scene. These classes benefit from both clearer polarimetric signatures and more abundant labeled samples. In contrast, performance tends to degrade for classes like Buildings in Flevoland or Vegetation in San Francisco. The Buildings class suffers from limited training data and high intra class variability due to heterogeneous man made structures, while Vegetation exhibits significant polarimetric and spatial overlap with other natural classes, complicating discrimination. These cases illustrate how both class imbalance and scattering complexity can impact classification performance. Despite these challenges, ConvAttentionNet maintains robust generalization, outperforming other models even in difficult categories and across varied datasets—demonstrating the effectiveness of its multiscale feature extraction and convolutional attention mechanisms.
Overall, ConvAttentionNet provides a compelling combination of accuracy, efficiency, and generalization. Its design choices allow it to perform well across a range of remote sensing scenarios while remaining practical for operational use.
5 Conclusion
We present ConvAttentionNet, a computationally efficient model designed to enhance PolSAR data classification accuracy while maintaining practical deployability. The model achieves overall accuracies of 97.2% on the Flevoland dataset and 96.6% on San Francisco, surpassing PolSARFormer by 1.4% and 1.1%, respectively. It also attains the highest average accuracy (AA) scores—96.0% for Flevoland and 92.6% for San Francisco—outperforming recent baselines such as PolSARConvMixer and Swin Transformer. ConvAttentionNet’s architecture integrates multi-scale convolutional mixer blocks with a lightweight convolution-based attention mechanism to effectively capture spatial features at varying resolutions, thereby improving both fine-grained classification and noise robustness. With only 142,696 parameters, 6.7 million FLOPs, and 3.3 million MACs, the model demonstrates exceptional computational efficiency compared to heavier alternatives like WaveletCNN (195.9 million FLOPs, 97.9 million MACs). Although slightly more demanding than Swin Transformer (5.2 million FLOPs), ConvAttentionNet delivers significantly higher accuracy, making it highly suitable for real world PolSAR applications. Notably, while the model incorporates an attention mechanism, it does not employ transformer-style self-attention. Instead, it utilizes a convolutional attention module based on directional filters, which enables effective spatial weighting with minimal computational overhead.
Despite its promising results, ConvAttentionNet has several limitations that point to future research directions. The current model relies on real valued polarimetric descriptors, which do not fully capture the complex phase information inherent in PolSAR data; future work will explore complex valued representations to better exploit this information. Additionally, the static attention mechanism may not optimally adapt to variations in scene complexity or input resolution, motivating the development of adaptive attention modules that dynamically respond to contextual features. Although the model is computationally efficient, further optimization through pruning, quantization, or knowledge distillation is necessary for deployment in highly constrained environments. Beyond these architectural improvements, future work will also investigate self supervised learning to reduce reliance on annotated data and multimodal fusion to enhance robustness and generalizability across diverse remote sensing scenarios.
Data availability statement
The original contributions presented in the study are included in the article/supplementary material, further inquiries can be directed to the corresponding author.
Author contributions
MA: Conceptualization, Formal Analysis, Methodology, Software, Supervision, Writing – original draft. AJ: Data curation, Methodology, Validation, Visualization, Writing – original draft. AB: Investigation, Writing – original draft.
Funding
The author(s) declare that no financial support was received for the research and/or publication of this article.
Conflict of interest
The authors declare that the research was conducted in the absence of any commercial or financial relationships that could be construed as a potential conflict of interest.
Generative AI statement
The author(s) declare that no Generative AI was used in the creation of this manuscript.
Any alternative text (alt text) provided alongside figures in this article has been generated by Frontiers with the support of artificial intelligence and reasonable efforts have been made to ensure accuracy, including review by the authors wherever possible. If you identify any issues, please contact us.
Publisher’s note
All claims expressed in this article are solely those of the authors and do not necessarily represent those of their affiliated organizations, or those of the publisher, the editors and the reviewers. Any product that may be evaluated in this article, or claim that may be made by its manufacturer, is not guaranteed or endorsed by the publisher.
References
Alkhatib, M. Q. (2024). PolSAR image classification using a hybrid complex-valued network (HybridCVNet). IEEE Geoscience Remote Sens. Lett. 21, 1–5. doi:10.1109/lgrs.2024.3468190
Alkhatib, M. Q. (2025). PolSAR image classification using complex-valued multiscale attention vision transformer (CV-MsAtViT). Int. J. Appl. Earth Observation Geoinformation 137, 104412. doi:10.1016/j.jag.2025.104412
Alkhatib, M. Q., Zitouni, M. S., Al-Saad, M., Aburaed, N., and Al-Ahmad, H. (2025). Polsar image classification using shallow to deep feature fusion network with complex valued attention. Sci. Rep. 15, 24315. doi:10.1038/s41598-025-10475-3
Bi, H., Sun, J., and Xu, Z. (2018). A graph-based semisupervised deep learning model for PolSAR image classification. IEEE Trans. Geoscience Remote Sens. 57, 2116–2132. doi:10.1109/tgrs.2018.2871504
Cao, Y., Wu, Y., Li, M., Liang, W., and Zhang, P. (2021). Polsar image classification using a superpixel-based composite kernel and elastic net. Remote Sens. 13, 380. doi:10.3390/rs13030380
Cloude, S. R., and Pottier, E. (1996). A review of target decomposition theorems in radar polarimetry. IEEE Trans. geoscience remote Sens. 34, 498–518. doi:10.1109/36.485127
Dong, H., Zhang, L., Lu, D., and Zou, B. (2020). Attention-based polarimetric feature selection convolutional network for polsar image classification. IEEE Geoscience Remote Sens. Lett. 19, 1–5. doi:10.1109/lgrs.2020.3021373
Dong, H., Zhang, L., and Zou, B. (2021). Exploring vision transformers for polarimetric SAR image classification. IEEE Trans. Geoscience Remote Sens. 60, 1–15. doi:10.1109/tgrs.2021.3137383
Du, P., Samat, A., Waske, B., Liu, S., and Li, Z. (2015). Random forest and rotation forest for fully polarized SAR image classification using polarimetric and spatial features. ISPRS J. photogrammetry remote Sens. 105, 38–53. doi:10.1016/j.isprsjprs.2015.03.002
Hajnsek, I., and Desnos, Y.-L. (2021). Polarimetric synthetic aperture radar: principles and application, 25. Springer Nature.
Hochstuhl, S., Pfeffer, N., Thiele, A., Hinz, S., Amao-Oliva, J., Scheiber, R., et al. (2023). Pol-insar-island-a benchmark dataset for multi-frequency pol-insar data land cover classification. ISPRS Open J. Photogrammetry Remote Sens. 10, 100047. doi:10.1016/j.ophoto.2023.100047
Hou, Q., Zhou, D., and Feng, J. (2021). “Coordinate attention for efficient Mobile network design,” in Proceedings of the IEEE/CVF conference on computer vision and pattern recognition, 13713–13722.
Hu, J., Shen, L., and Sun, G. (2018). “Squeeze-and-excitation networks,” in Proceedings of the IEEE conference on computer vision and pattern recognition, 7132–7141.
Hua, W., Wang, X., Zhang, C., and Jin, X. (2022). Attention-based multiscale sequential network for polsar image classification. IEEE Geoscience Remote Sens. Lett. 19, 1–5. doi:10.1109/lgrs.2022.3164464
Jamali, A., Mahdianpari, M., Mohammadimanesh, F., Bhattacharya, A., and Homayouni, S. (2022). PolSAR image classification based on deep convolutional neural networks using wavelet transformation. IEEE Geoscience Remote Sens. Lett. 19, 1–5. doi:10.1109/lgrs.2022.3185118
Jamali, A., Roy, S. K., Bhattacharya, A., and Ghamisi, P. (2023). Local window attention transformer for polarimetric SAR image classification. IEEE Geoscience Remote Sens. Lett. 20, 1–5. doi:10.1109/lgrs.2023.3239263
Jamali, A., Roy, S. K., Lu, B., Bhattacharya, A., and Ghamisi, P. (2024). “PolSARconvmixer: a channel and spatial mixing convolutional algorithm for PolSAR data classification,” in IGARSS 2024-2024 IEEE international geoscience and remote sensing symposium (IEEE), 11248–11251.
Jiang, N., Zhao, W., Guo, J., Zhao, Q., and Zhu, J. (2025). Multi-scale feature extraction with 3D complex-valued network for PolSAR image classification. Remote Sens. 17, 2663. doi:10.3390/rs17152663
Khan, S., Naseer, M., Hayat, M., Zamir, S. W., Khan, F. S., and Shah, M. (2022). Transformers in vision: a survey. ACM computing surveys CSUR. 54, 1–41. doi:10.1145/3505244
Kuang, Z., Bi, H., Li, F., and Xu, C. (2025a). ECP-Mamba: an efficient multi-scale self-supervised contrastive learning method with state space model for PolSAR image classification. IEEE Trans. Geoscience Remote Sens. 63, 1–18. doi:10.1109/tgrs.2025.3601583
Kuang, Z., Liu, K., Bi, H., and Li, F. (2025b). PolSAR image classification with complex-valued diffusion model as representation learners. IEEE Trans. Aerosp. Electron. Syst., 1–21. doi:10.1109/taes.2025.3572877
Liu, Z., Lin, Y., Cao, Y., Hu, H., Wei, Y., Zhang, Z., et al. (2021). “Swin transformer: hierarchical vision transformer using shifted windows,” in Proceedings of the IEEE/CVF international conference on computer vision, 10012–10022.
Liu, X., Jiao, L., Liu, F., Zhang, D., and Tang, X. (2022). “Polsf: polsar image datasets on San Francisco,” in International conference on intelligence science (Springer), 214–219.
Liu, G., Li, Y., Chen, Y., Shang, R., and Jiao, L. (2025). AutoPolCNN: a neural architecture search method of convolutional neural network for PolSAR image classification. Knowledge-Based Syst. 312, 113122. doi:10.1016/j.knosys.2025.113122
Shah Hosseini, R., Entezari, I., Homayouni, S., Motagh, M., and Mansouri, B. (2011). Classification of polarimetric SAR images using support vector machines. Can. J. Remote Sens. 37, 220–233. doi:10.5589/m11-029
Shang, R., Wang, J., Jiao, L., Yang, X., and Li, Y. (2022). Spatial feature-based convolutional neural network for PolSAR image classification. Appl. Soft Comput. 123, 108922. doi:10.1016/j.asoc.2022.108922
Shang, R., Hu, M., Feng, J., Zhang, W., and Xu, S. (2025). A lightweight PolSAR image classification algorithm based on multi-scale feature extraction and local spatial information perception. Appl. Soft Comput. 170, 112676. doi:10.1016/j.asoc.2024.112676
Wang, Q., Wu, B., Zhu, P., Li, P., Zuo, W., and Hu, Q. (2020). “Eca-net: efficient channel attention for deep convolutional neural networks,” in Proceedings of the IEEE/CVF conference on computer vision and pattern recognition, 11534–11542.
Woo, S., Park, J., Lee, J.-Y., and Kweon, I. S. (2018). “Cbam: convolutional block attention module,” in Proceedings of the European conference on computer vision (ECCV), 3–19.
Xing, X., Chen, Q., Yang, S., and Liu, X. (2017). Feature-based nonlocal polarimetric sar filtering. Remote Sens. 9, 1043. doi:10.3390/rs9101043
Yang, R., Xu, X., Gui, R., Xu, Z., and Pu, F. (2021). Composite sequential network with poa attention for polsar image analysis. IEEE Trans. Geosci. Remote Sens. 60, 1–15. doi:10.1109/tgrs.2021.3093059
Yu, P., Qin, A. K., and Clausi, D. A. (2011). Unsupervised polarimetric sar image segmentation and classification using region growing with edge penalty. IEEE Trans. Geoscience Remote Sens. 50, 1302–1317. doi:10.1109/tgrs.2011.2164085
Zhang, L., Chen, Z., Zou, B., and Gao, Y. (2018). “Polarimetric SAR terrain classification using 3d convolutional neural network,” in IGARSS 2018-2018 IEEE international geoscience and remote sensing symposium (IEEE), 4551–4554.
Zhang, Q., He, C., He, B., and Tong, M. (2023). Learning scattering similarity and texture-based attention with convolutional neural networks for polsar image classification. IEEE Trans. Geosci. Remote Sens. 61, 1–19. doi:10.1109/tgrs.2023.3273392
Zhang, Q., Fang, X., Liu, T., Wu, R., Liu, L., and He, C. (2025). MCDiff: a multi-level conditional diffusion model for PolSAR image classification. IEEE J. Sel. Top. Appl. Earth Observations Remote Sens. 18, 6721–6737. doi:10.1109/jstars.2025.3542952
Keywords: PolSAR data classification, mixer network, CNN, deep learning, remote sensing, convolutional attention
Citation: Alkhatib MQ, Jamali A and Bhattacharya A (2025) ConvAttentionNet: a high-performance model for efficient and accurate PolSAR data classification. Front. Remote Sens. 6:1680450. doi: 10.3389/frsen.2025.1680450
Received: 06 August 2025; Accepted: 11 September 2025;
Published: 22 September 2025.
Edited by:
Varun Narayan Mishra, Amity University, IndiaReviewed by:
Nabajyoti Das, Tezpur University, IndiaZhiping Yin, Hefei University of Technology, China
Wenlve Zhou, The South China University of Techonology, China
Copyright © 2025 Alkhatib, Jamali and Bhattacharya. This is an open-access article distributed under the terms of the Creative Commons Attribution License (CC BY). The use, distribution or reproduction in other forums is permitted, provided the original author(s) and the copyright owner(s) are credited and that the original publication in this journal is cited, in accordance with accepted academic practice. No use, distribution or reproduction is permitted which does not comply with these terms.
*Correspondence: Mohammed Q. Alkhatib, bXFhbGtoYXRpYkBpZWVlLm9yZw==