 Gaëlle Viennois
 Hadrien Tulet
 Paul Tresson
 Nicolas Barbier
- AMAP, University Montpellier, IRD, CNRS, CIRAD, INRAE, Montpellier, France
Introduction: Central African forests are key reservoirs of carbon and biodiversity. Developing a detailed, spatially explicit typology of forest types is essential for monitoring and conservation. However, this task remains challenging due to limitations inherent to optical satellite imagery, especially disturbances caused by two major sources of noise: (i) atmospheric effects and (ii) Bidirectional Reflectance Distribution Function (BRDF) distortions, which introduce spectral inconsistencies across image collections. Even after standard corrections, residual errors often persist, masking the subtle ecological signals required for accurate classification. In this study, we evaluate whether recent deep learning models can implicitly learn to account for such distortions, potentially reducing the need for traditional preprocessing steps.
Methods: We produced a 10-m resolution vegetation typology map of the highly heterogeneous TRIDOM landscape (∼180,000 km2) spanning Cameroon, Gabon, and the Republic of Congo, using Sentinel-2 imagery. We compared the performance of Convolutional Neural Networks (CNNs), Vision Transformers (ViTs), and self-supervised ViTs trained with DINOv2.
Results: Our results show that CNNs achieved the highest classification accuracy (OA = 0.91, Kappa = 0.84), outperforming both ViTs and DINOv2-based models (OA ≈ 0.70) on preprocessing images. When uncorrected imagery was used, CNN accuracy dropped to 0.76 (Kappa = 0.59), while ViTs exhibited also a decline (Kappa falling from 0.54 to 0.24).
Discussion: These findings highlight the partial ability of deep learning models to compensate for image noise, but emphasize that traditional preprocessing remains necessary for reliable classification. Our results also demonstrate that CNNs consistently outperform self-supervised Vision Transformers in large-scale forest mapping, providing accurate classification of forest typologies. This work offers new insights into the robustness and current limitations of deep learning architectures when applied to complex tropical landscapes.
1 Introduction
Central African forests are second in extent only to the Amazon and constitute one of the planet’s most important reservoirs of carbon and biodiversity (Zhang et al., 2016). Accurately characterizing these ecosystems and monitoring their spatiotemporal dynamics is crucial for guiding effective conservation efforts and developing informed forest management policies.
A fundamental step toward this goal is the development of a detailed and spatially explicit typology of forest types. However, this task remains particularly challenging due to the extraordinary ecological heterogeneity of Central African forests. Defining and mapping forest typologies is essential not only for biodiversity assessments and carbon stock monitoring, but also for the design of targeted, evidence-based environmental interventions.
However, the large-scale distribution patterns of tropical forest types in the region remain poorly documented. This knowledge gap is largely attributable to two major constraints: First, many forested areas are hard to access and census, which limits field data collection. Second, the cloud cover and canopy heterogeneity of tropical forests constitute challenges for satellite-based approaches in detecting subtle variations in forest structure and composition. Technically, these challenges are compounded by a low signal-to-noise ratio in optical imagery and by artifacts arising from imperfect pre-processing of satellite data (Hoekman et al., 2020; Jha et al., 2021).
Some studies have attempted to overcome these limitations by relying on floristic and functional composition to characterize forest types. For example, Réjou-Méchain et al. (2021) have extrapolated forest inventory plots to predict functional composition across the Congo Basin. However, the coarse spatial resolution of their predictions (10 km × 10 km) remains insufficient to capture the fine-scale mosaic of vegetation formations. Other regional-scale approaches have employed low-resolution satellite imagery (250 m–1 km) to map forest typologies across Central Africa (Mayaux et al., 2004; Viennois et al., 2013; Gond et al., 2015), but these methods also fall short in representing local ecological variability, partly due to the limited informativeness of the spectral signal, as previously discussed.
Distinguishing between formations such as swamp forests in peatlands and riparian zones (edaphic forests), open-canopy forests (e.g., Marantaceae forests), monodominant stands (e.g., Gilbertiodendron or Okoumé), regenerating or degraded forests, and open ecosystems like savannas and Miombo woodlands is essential for refining classification schemes. Achieving this level of detail requires the integration of very high-resolution (VHR) imagery with field-based data to improve both the understanding and modeling of forest dynamics.
1.1 Challenges in optical satellite data for forest mapping
The advent of new-generation satellite sensors has made it possible to monitor ecosystems at large scale and high spatial resolution (10 m). Freely available Sentinel-2 data offer repeated observations over time, unlocking new potential for fine-scale forest typology mapping and gaining deeper insights into tropical forest structure and composition (You et al., 2022; Quang et al., 2022; Waśniewski et al., 2020). However, persistent cloud cover and haze often restrict usable optical time series to just a few cloud-free observations per year, mostly during the dry season. This limitation hampers the detection of subtle variations in canopy reflectance (Morton et al., 2014).
This challenge is further compounded by the fact that optical satellite imagery is inherently affected by various sources of noise, which can obscure ecological signals critical for accurate mapping. Two major sources of noise affect optical satellite imagery used for regional mapping: (i) atmospheric effects, which introduce spectral distortions, and (ii) Bidirectional Reflectance Distribution Function (BRDF) effects due to varying acquisition geometries among a set of images. Despite automated correction algorithms, residual errors often persist, blurring the subtle biological signals conveyed by spectral features (Roy et al., 2017; Marujo et al., 2023). Without adequate correction, this cripples reliable mapping and ecological interpretation of forest types.
1.2 The rise of deep learning in forest mapping
Forest mapping relying on traditional machine learning depends on handcrafted feature selection. However, these features remain very sensible to noise, acquisition effects, and heterogeneity that characterize tropical forests (You et al., 2022; Waśniewski et al., 2020). Deep learning, with its ability to learn descriptors from data itself is more robust than traditional machine learning to this kind of effect (Kim, 2016). As such, researchers have relied more and more on deep learning methods to robustly map land cover and forest types (Sothe et al., 2020).
The development of Convolutional Neural Networks (CNNs) has significantly enhanced forest mapping (Kattenborn et al., 2021). For instance, UNet (Ronneberger et al., 2015) is well suited for large data input and the detection of small objects. It has therefore shown good performances when applied on remote sensing tasks (Ronneberger et al., 2015; Wagner et al., 2019). However, it is important to note that this approach has so far only been applied to relatively small areas (Wagner et al., 2019).
More recently, Vision Transformers models [ViTs, (Dosovitskiy et al., 2020)] have taken deep learning a step further by capturing long-range dependencies in images, leading to improved classification accuracy (Fayad et al., 2024). Indeed, the attention mechanism built in ViTs enables them to better handle the structure of an image rather than focusing mostly on texture like CNN. Moreover, ViTs synergize well with Self-Supervised Learning (SSL), that allow them to learn relevant features from unlabelled data. This combination of attention and SSL have made ViTs the state-of-the-art models for most computer vision tasks (Oquab et al., 2023).
Despite this progress, few studies have applied these powerful models to map tropical forest typology at large scale using satellite data (Picard et al., 2025). In one such effort, Picard went one step further in predicting six major forest types in northern Republic of Congo by leveraging two state-of-the-art architectures EfficientNet-B3 (a CNN) and a ViTs trained on Sentinel-2 images pre-processed for atmospheric and BRDF effects.
The ability of deep learning models to automatically extract relevant features raises the question of whether they can also learn to account for atmospheric and geometric distortions implicitly. In this study, we investigate the extent to which such models can internalize these corrections, potentially simplifying the data preprocessing pipeline while maintaining or even improving classification accuracy.
We apply this approach to a highly heterogeneous forest landscape located at the intersection of Cameroon, Gabon, and the Republic of Congo, known as the TRIDOM landscape (as defined by WWF). This region poses a considerable challenge for high-resolution mapping due to its ecological complexity along with atmospheric and instrumental effects contributing to spectral variability. To address this, we compare deep learning models trained under two different paradigms: standard supervised learning (using CNN and Vision Transformers (ViT) architectures) and Self-Supervised Learning (SSL) (DINOv2 approach). This comparative design allows us to evaluate whether SSL-based models, by learning more generalizable representations from unlabeled data, are better equipped to overcome the limitations imposed by atmospheric and acquisition-related distortions.
The objectives of this study are threefold:
(i) Predict forest types at high spatial resolution (S2 pixel) and over a wide area using deep learning methods, including a CNN, Vision Transformers (ViTs), and ViT DINOv2 SSL based foundation models;
(ii) Evaluate and compare the performance of these two kinds of model architectures;
(iii) Evaluate whether these new methods can dispense with traditional satellite image pre-processing steps, such as atmospheric and BRDF corrections.
2 Materials and methods
2.1 Study area
Our study area is located in the South of the Cameroun (Figure 1A) and sits astride Gabon, Congo and Central African Republic. It covers an area of 178,930 km2 and encompasses two wildlife reserves (Dja, Ngoyla), four National Parks (Lobéké, Boumba Bek, Nki and Mefou) and one fauna sanctuary (Mengame). Proximity to the equator induces a bimodal rainfall regime, with two dry seasons centered in January (main season) and July (small season), totaling four to five dry months, and two wet seasons centered in October and April. Mean annual precipitation is about 1500 mm with a 3-months dry season during December to February (Precipitations <100 mm). The average temperature is 25 °C (Leroux, 1983).
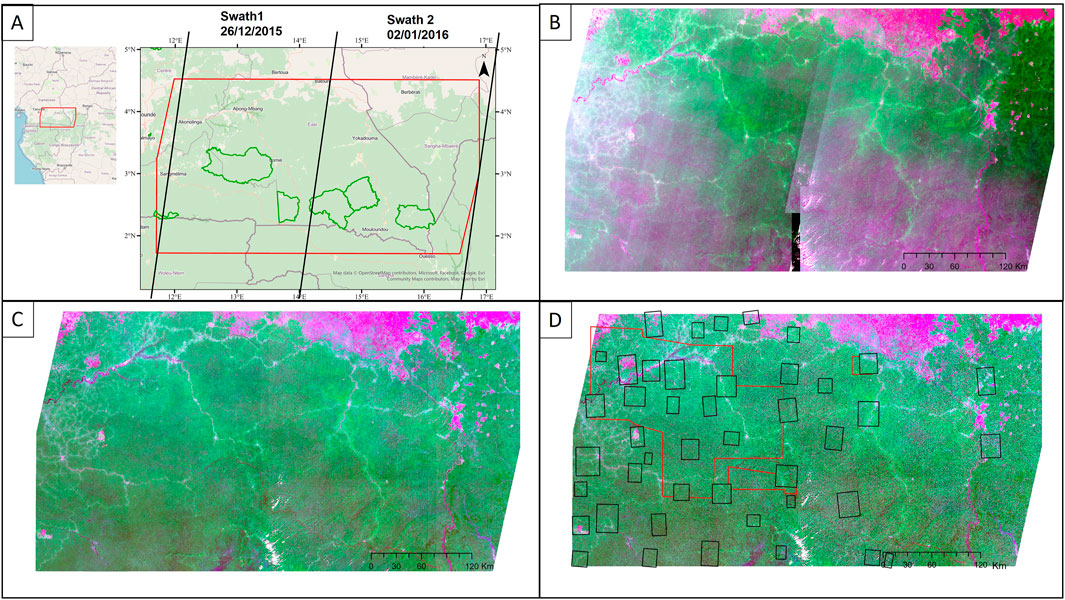
Figure 1. (A) Study area, protected areas, and swath of Sentinel 2 images (map background was taken from OpenStreetMap); (B) Sentinel-2 final mosaic unprocessed (color composite: Red-Nir-Green); (C) Sentinel-2 final mosaic processed and (D) Black polygons: training and testing polygons were sampled over Sentinel-2 images and red polygons: validation polygons were sampled independently over very high-resolution images.
2.2 Satellite data pre-processing
Using Google Earth Engine, we inspected the Sentinel 2 archive available during the dry season (low cloud cover) and downloaded 27 tiles spread over 2 swaths, that is 14 tiles for the first swath acquired on 26/12/2015 and 13 tiles for the second swath acquired a week later, on 02/01/2016. We selected these products at the L1C level, which corresponds to top-of-atmosphere (TOA) reflectance of orthorectified images. This choice allows for in-house correction of atmospheric effects and bidirectional reflectance distribution function (BRDF), both of which significantly influence image reflectance, especially in forested environments. First, the Overland image processing software (developed by Airbus Defense and Space; (Doxani et al., 2023; Feret and Barbier, 2025) was used for atmospheric correction and noise reduction. Second, bidirectional effects were corrected using the Ross-thick Li-sparse model (Lucht et al., 2002) calibrated for tropical forests. Specifically, we used a set of model coefficients fitted using S2 images of tropical forests after Overland correction, using a dataset of 183 granule-level images distributed over 6 acquisition orbits and 37 swath-level acquisitions (Ploton et al. in prep).
Finally, instrumental artifacts, appearing as bands following the acquisition trajectory (“swaths’), can be visible in S2 images (Figure 1B), especially on non-Lambertian surfaces such as forests. These artifacts are mainly due to the non-uniform spectral response at the edges of the S2 detectors, as well as differences in viewing angles between even and odd detectors (Clerc et al., 2021). To correct for these artifacts, we (i) rotated the images according to the S2 track angle, (ii) applied a column-wise centering specific to the band of the resulting matrices, thereby normalizing the spectral response of pixels along the track, and (iii) rotated the matrices back to their original orientation. Last, we used the overlap area between images of the two swaths to perform band wise linear intercalibrations of images from both swaths. The 27 images were then assembled into a final mosaic at a spatial resolution of 10 m. Hill-shading was calculated from the shuttle radar topography mission (SRTM; 30-m resolution) image and interpolated to 10 m. This layer was added to the final mosaic, which therefore contains the 10 spectral bands of S2 and the Hillshade layer. Finally, we converted the final mosaic to 8 bits to reduce the image size from 40 GB to 17 GB (Figure 1C).
2.3 Landcover types and training dataset
We defined 18 landcover classes (Figure 2A) and built a dataset to train classifiers focusing on 35 geographically-balanced training areas throughout the study area (Figure 1D). In total, over 10,000 training polygons were extracted from those training areas and distributed among landcover classes so as to reflect their approximate proportion in the study area (Figure 2B). Approximate landcover proportions were derived from the output of a first classification task using a CNN model trained on 1000 polygons equally-distributed among classes. All polygons were labelled by a single expert (GV) on the basis of visual photo-interpretation of Sentinel2 images in Arcmap using criteria such as canopy texture and spectral information based on an R-NIR-G composite. For instance, Terra Firme forests (FTF) exhibit a high degree of structural and phenological heterogeneity, reflecting diverse compositions that include both deciduous and evergreen species at different phenological stages. Visually, they appear as a mixture of large crowns and bare, pinkish branches of leafless emergent trees, alongside the green-leaved crowns of other broad-leaved species. No obvious symptoms of secondary degradation or signs of disturbance are observed in these FTFs.
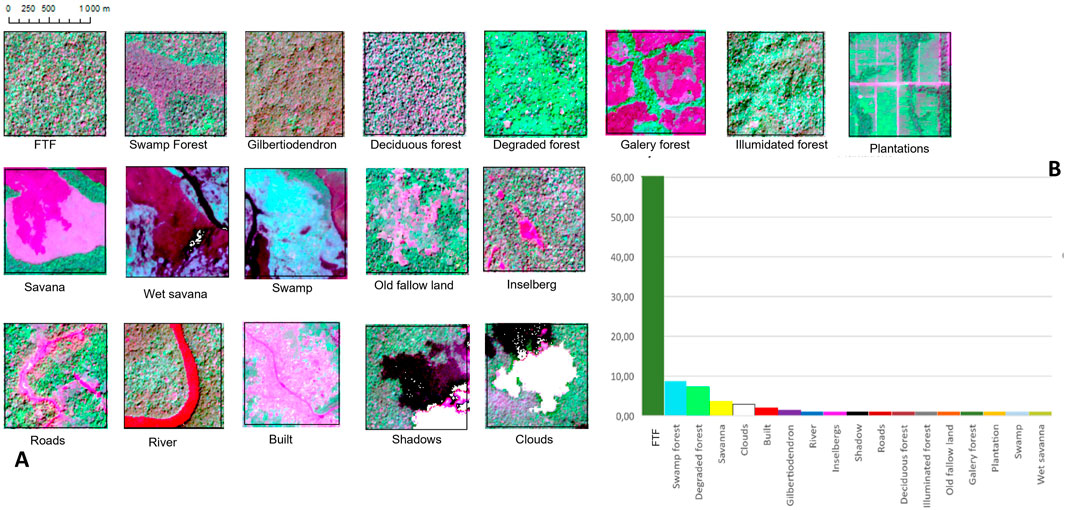
Figure 2. (A) Illustrative caption of the 18 landcover classes and (B) distribution of classes in terms of percentage of training polygons per class. FTF (Terra Firme forests).
Degraded forests in early post-disturbance stages are generally composed of early pioneer species such as Musanga cecropioides that form either a uniform cover or a typical patchwork with very high NIR reflectance values (Figure 2), while deciduous trees are generally absent. Monodominant Gilbertiodendron dewevrei forests (GDF) present a typical fine-grained texture, due to the even-size and high-density distribution of canopy trees. Due to the specific position of young leaves in the dominant evergreen species (hidden below older ones and pendulous), reflectance in the NIR is low, as indicated by dark tones on the mosaic (Figure 3). Swamp forests are easily recognizable by the dominance of Raphia spp. palms with a characteristic star-shaped appearance. In dry-season images, Raphia trees presented low NIR and high Red reflectance, making them appear pinkish. Illuminated Forest corresponds to mountain slopes with a high spectral response in the near infrared (NIR) channel, attributable to direct solar illumination at the time of image acquisition. This radiometric signature is mainly due to the incidence angle of sunlight on the canopy.
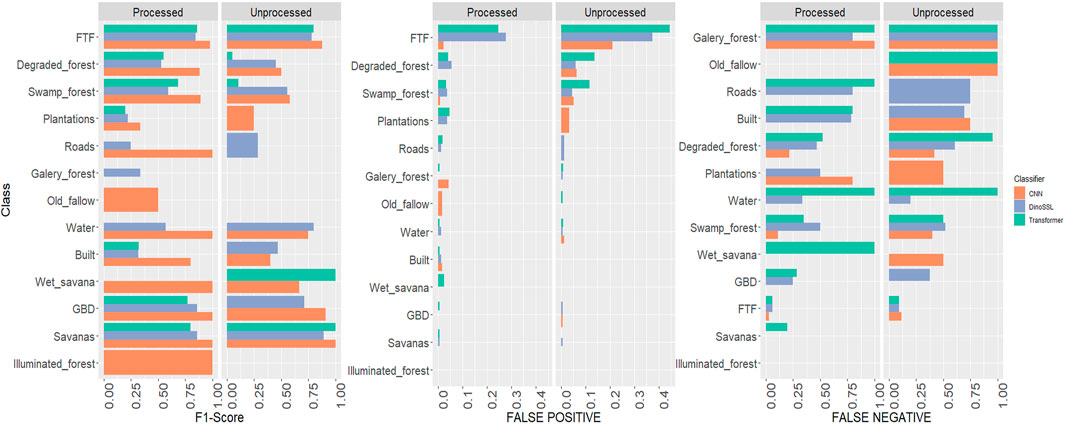
Figure 3. F1-Scores, False positive rate (FPR) and False negative rate (FNR) of different classifiers (CNN, ViT, ViT DINOv2 SSL) on various image classes, for both raw and processed images.
The training polygons or regions of interest (ROI) were divided into two groups: 80% for training and 20% for validation, randomly distributed according to the 18-class distribution.
2.4 Classification by deep learning methods on pre-processed and processed mosaics
2.4.1 Classification with Convolutional Neural Network (CNN)
We used OTBTF, a remote module of the Orfeo ToolBox that provides deep learning framework targeting remote sensing image processing (Cresson, 2018). OTBTF uses TensorFlow to perform numerical computations. For classification, this module uses a small CNN model with three convolutional layers. CNNs are trained on image tiles rather than batches of individual pixels. First, we used the PatchesExtraction application to extract tiles from the final mosaic at each ROI location. We thus created a set of tiles of dimension 16 × 16 pixels associated with the label of the corresponding class name. Next, we trained a deep network, providing the TensorflowModelTrain application with tiles for training and tiles for validation. Inference was then performed via TensorflowModelServe. The very light nature of this model allows for the inference to be done by sliding a window across the whole mosaic with a single pixel stride, thus producing the final classification at pixel resolution (10 m).
2.4.2 Classification with Vision Transformer (ViT)
We then performed the same task using a Vision Transformer [ViT, (Dosovitskiy et al., 2020; Khan et al., 2022)] model as a backbone. We used the “vit_base_patch14_dinov2” model from the timm library (Wightman, 2019), an implementation of a ViT base architecture using DINOv2 (Oquab et al., 2023) pre-trained weights. During training, the resulting model was fed with image tiles of dimension 10 × 10 pixels (or 20 × 20 to test influence of longer range dependencies in images) corresponding to the location of the labelled points. We kept the same tile size during inference, resulting in a classification at tile resolution (100 m). The usage of a smaller stride similar to what was used in the CNN case was found too demanding in computational resources, due to the huge discrepancy in size between both models and the overall large area of testing.
2.4.3 Classification with Vision Transformer with a self-supervised learning step (ViT DINOv2 SSL)
We also trained the ViT model in Self-Supervised Learning (SSL) mode. In a SSL setup, the model first learns features of the dataset in an unsupervised manner via a pretext task (e.g., reconstruction of degraded data or pairing of two transformations of the same data). Afterwards, the model is trained in a supervised way using the labeled dataset. SSL has been shown to ease domain adaptation on various computer vision datasets as well as remote sensing data (Tresson et al., 2024; Prieur et al., 2024). In our case, we hypothesized that the model could learn a representation of the sentinel images robust to atmospheric and BRDF artefacts. The model was trained on unlabeled and uncorrected images using the DINOv2 method (Oquab et al., 2023), starting from pretrained weights provided by the timm library (Wightman, 2019).
2.5 Model evaluation
2.5.1 Test dataset for independent validation of predicted maps
After building up a training and validation dataset covering 18 land cover classes (see Section 2.3), we constructed an independent test set to assess the quality of the maps produced. This set is based on images with a higher spatial resolution than Sentinel-2, enabling us to generate more accurate reference labels over the entire study area, while minimizing spatial autocorrelation with the training data.
Specifically, we have compiled a set of 25 very high resolution (VHR) commercial multispectral images from the SPOT 6/7 (6 m/pixel) and Pleiades (2 m/pixel) sensor archives. These images were acquired during the 2015–2016 dry season, guaranteeing relatively cloud-free coverage (see image metadata in Supplementary Material S1).
The accuracy assessment followed a standardized protocol: (i) we excluded training area footprints from the VHR image coverage (black polygons in Figure 1D) to ensure an independent validation process and to minimize spatial autocorrelation with the training data; the remaining areas then constituted our final validation area (test, red polygons in Figure 1D) (iii) we selected 2200 validation pixels from the final test area using a stratified random sampling strategy following map classes with a sampling intensity proportional to the proportion of each class in the total pixel population. The minimum sample size was set to 100, to ensure a sufficient representativity of rare classes (e.g., Plantation, Old Fallow Land, etc., …) in the test set; (iii) we carried out the visual interpretation of validation samples based on VHR imagery.
2.5.2 Validation statistics
We employed pixel-level validation to assess the performance of the different classifiers, using global metrics such as Overall Accuracy, Cohen’s Kappa, Macro F1-score, and Weighted F1-score. Kappa accounts for agreement expected by chance, offering a more robust measure than accuracy alone. Macro F1 gives equal weight to all classes, which is especially important in our case, where vegetation classes are highly imbalanced. In contrast, the Weighted F1-score takes class frequency into account, reflecting the model’s performance across dominant and rare classes.
To gain deeper insight into the behavior of each classifier, we also conducted a per-class analysis using F1-score, False Positive Rate (FPR), and False Negative Rate (FNR). These fine-grained indicators allowed us to precisely identify the strengths and weaknesses of each model, particularly in their ability to distinguish between visually or structurally similar forest types.
3 Results
3.1 Comparing the performance of different models
Among the three models tested, the Convolutional Neural Network (CNN) yielded the best overall performance (Table 1), particularly when applied to preprocessed images, with an overall accuracy of 0.91 and a Kappa coefficient of 0.84. Its Macro F1-score (0.87) and Weighted F1-score (0.90) suggest a strong balance across all vegetation classes, including the rarest ones. The Vision Transformer model (without additional SSL) and SSL model performed moderately well on preprocessed images, with slightly lower scores than the CNN and had lower Kappa scores (around 0.54).
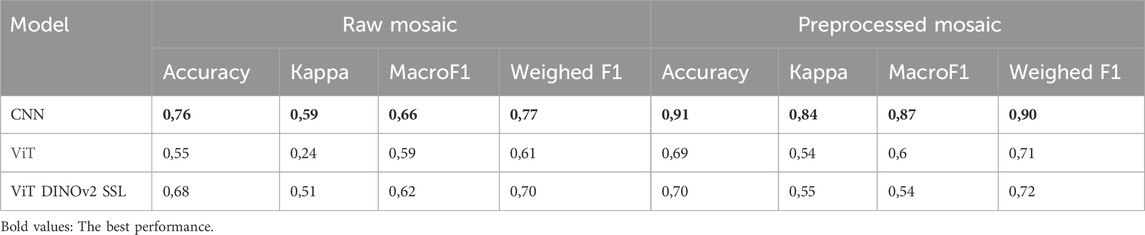
Table 1. Classifiers test statistics on raw and preprocessed.
When applied to unprocessed (raw) images, the performance of all models declined, confirming the positive effect of pre-processing. The CNN experienced a notable drop, with a Kappa of 0.59 and accuracy of 0.76, although it still outperformed the other two models. The Transformer model showed particularly poor performance on raw images, with a Kappa of just 0.24 suggesting significant generalization issues. The ViT DINOv2 SSL model was more robust, achieving a moderate Kappa of 0.51 on raw images, slightly lower than that obtained on processed images (0.55).
Pixel-level analysis of class-wise F1-scores (Figure 4) highlights the CNN’s superior performance across most classes when applied to preprocessed images. It achieved extremely high scores (F1 > 0.98) for several dominant classes such as terra firme forest (FTF), Gilbertiodendron forest (GBD), and savannas. Notably, it was the only model to correctly detect two minor classes: illuminated forest (F1 = 1.0) and old fallow land (F1 = 0.5). In any cases, illuminated forests are not a forest type in themselves, but rather a known artefact due to imperfectly corrected topographic illumination effects under varying direct/diffuse illumination conditions. Gallery forests were not predicted by any model, which can be attributed to the absence of this class in the test dataset, as the footprints of the very high-resolution (VHR) images do not cover areas where gallery forests are present.
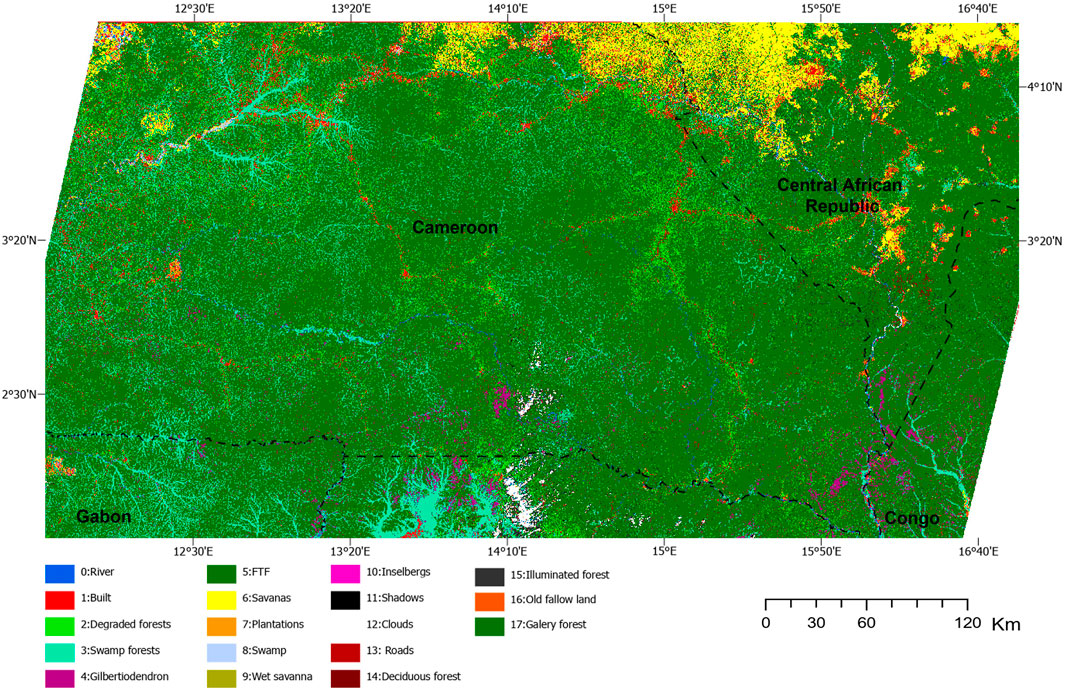
Figure 4. Predicted vegetation map over the study area for CNN on processed image.
The CNN maintained a performance advantage even on raw images, though with slightly reduced F1-scores across the board. Both ViT models exhibited more variable behavior, often underperforming relative to CNN, particularly in detecting minority classes.
The analysis of the CNN confusion matrix based on the processed images (Table 2) shows that, despite a high Kappa coefficient (0.84) and an overall accuracy of 0.91, several classes remain prone to misclassification. In particular, the Built and Old Fallow classes exhibit significant confusion, with error rates of 33% and 67%, respectively. Gallery Forests are not detected at all and are frequently misclassified as Plantations, Terra Firme Forest (FTF), or Degraded Forest.
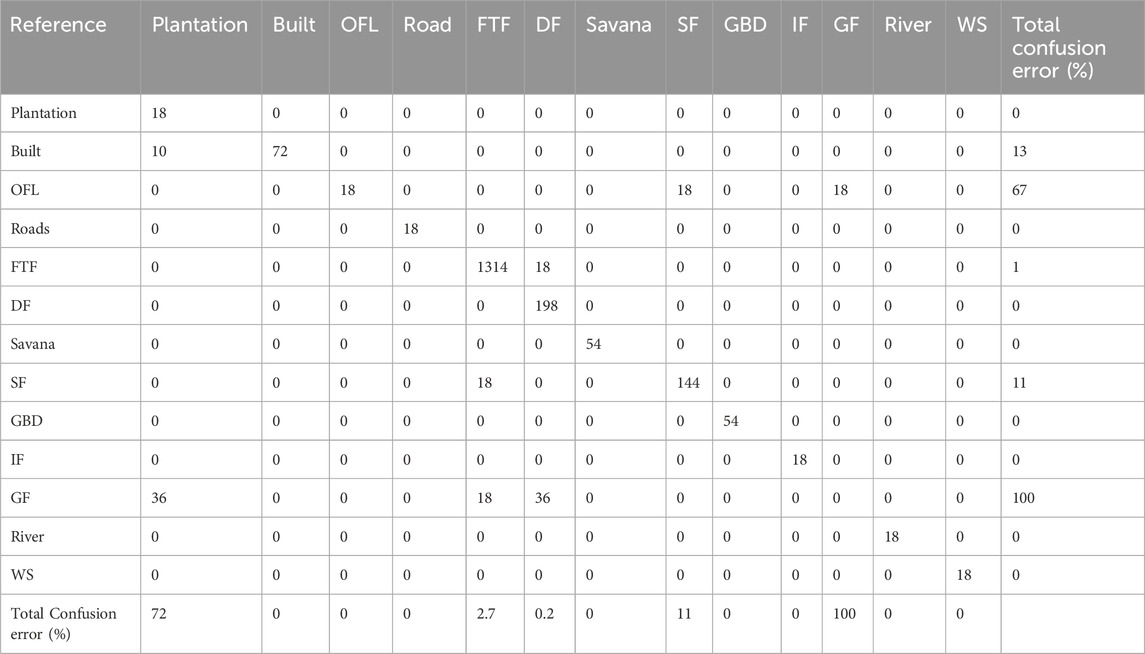
Table 2. Confusion matrix for the CNN model on processed image. OFL (Old Fallow Land), FTF (Terra Firma Forest), SF (Swamp Forest), GBD (Gilbertiodendron), IF (Illuminated Forest), GF (Gallery Forest), DF (Degraded Forest) and WS (Wet savana).
The analysis of False Positive Rates (FPR) and False Negative Rates (FNR) per class (Figure 3) provides further insights into classification errors. Majority classes such as terra firme forest, degraded forest, and swamp forest were frequently over-predicted by both transformer models, as reflected in their high FPRs, on both preprocessed and unprocessed images. In contrast, the CNN demonstrated consistently low FPRs, reflecting higher precision. The ViT, struggled to correctly identify swamp and degraded forests, with FNRs of 0.35 and 0.52 respectively, further highlighting its limitations under challenging conditions.
Across all classifiers, FPRs were higher on unprocessed images, reinforcing the importance of atmospheric and BRDF correction for accurate pixel-level classification. However, this improvement was not uniform across all classes.
3.2 Mapping forest types
Terra Firme Forest, which is a heterogen class, is the predominant vegetation type in the region, covering 70.18% of the study area (Table 3). It is followed by Swamp Forests, which represent 8.81% of the landscape. These swamp forests are well captured by the model, as illustrated in Figure 5, and are especially concentrated in the southern portion of the study area (Figure 4). Degraded Forests are mostly found near roads and built-up areas and account for 4.79% of the total area.
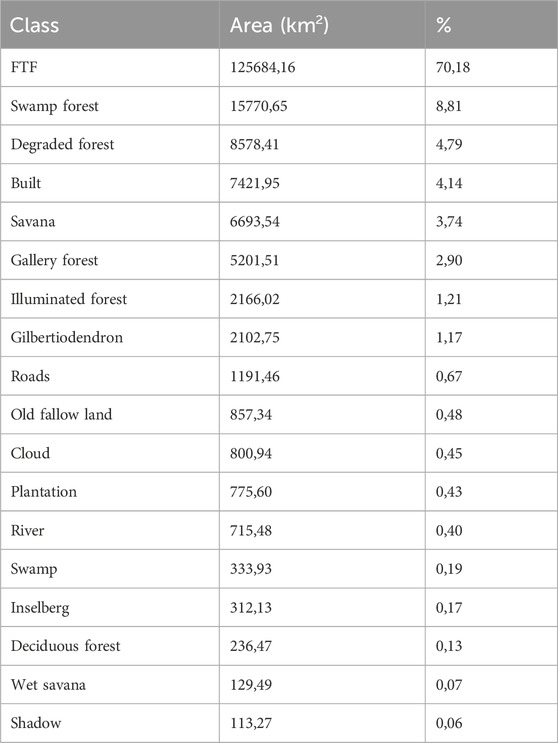
Table 3. Area and proportion of forest type.
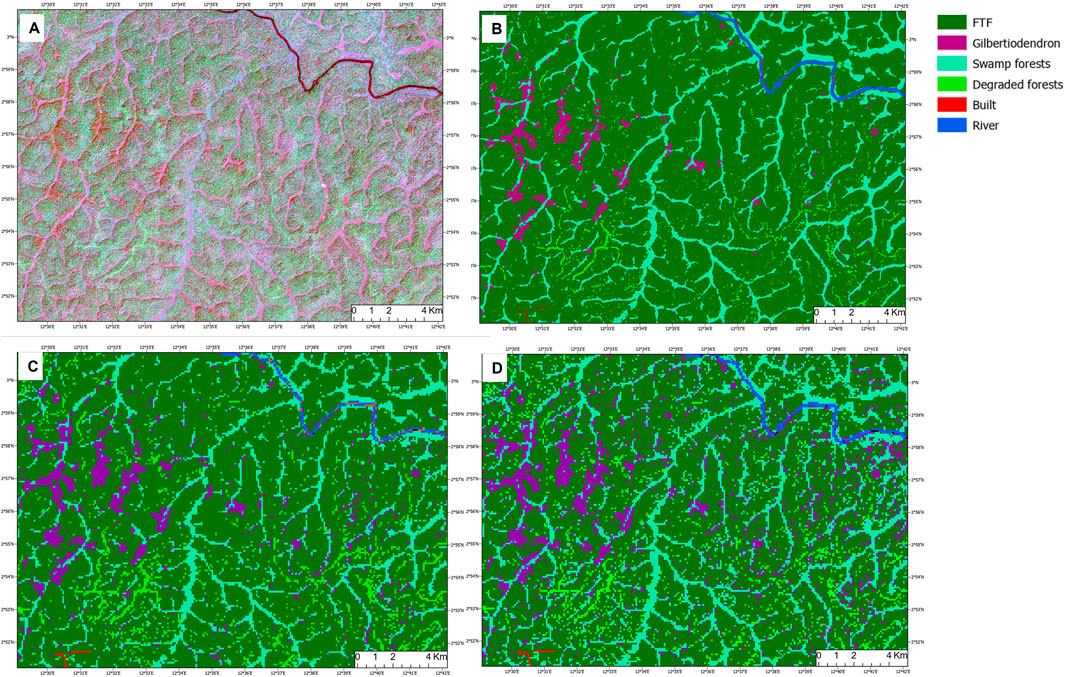
Figure 5. Zoom on Mosaic and visual comparison of prediction models. (A) processed Image (color composite: Red-Nir-Green) (B) CNN; (C) Vision Transformers; (D) Dino SSL and Vision T.ransformers.
The monodominant Gilbertiodendron dewevrei forest type occupies 1.17% of the area and is mainly found in the vicinity of Swamp Forests in the southern part of the site (Figure 4). In contrast, Savannas are primarily located in the northern region and cover 3.74% of the landscape (Figure 4).
Figure 5 offers a detailed view of the south region of Cameroon, highlighting a dense network of Swamp Forests extending outward from the dominant Terra Firme Forest matrix. Scattered patches of G. dewevrei forests are also observed along these swampy zones.
From a visual standpoint, different forest types exhibit distinctive textures, dense canopy, canopy gaps, and degraded zones, which CNNs manage to capture effectively. However, Vision Transformers (ViTs) tend to struggle more with these local variations. Conversely, ViTs perform better in identifying large-scale structures, such as rivers or roads traversing the landscape, where CNNs typically fall short.
4 Discussion
In this study, we produced a forest typology map at a 10-m spatial resolution, achieving with a high-level of spatial detail for automated tropical forest classification over a region of 180,000 km2 comprising 27 S2 tiles. While tropical forests are often represented as a uniform green carpet in global maps and models, our results reveal a much more heterogeneous landscape. Although Terra Firme Forest (FTF) dominated the area covering approximately 70% of the area we successfully mapped ecologically important yet less extensive formations such as swamp forests (8.81%) and monodominant G. dewevrei forests (1.17%), typically found in isolated lowland zones of southeastern Cameroon, consistent with earlier observations by (Letouzey, 1968; Barbier et al., 2017). The surface area of Degraded Forests accounts for 4.79%, slightly higher than the 3.78% covered by Tropical Moist Forests (Vancutsem et al., 2019). It should be noted that in our study, the FTF class is heterogeneous in terms of both structure and composition, with varying proportions of deciduous trees and phenological stages. This heterogeneity has already been highlighted in previous studies, for instance through predictions of deciduousness from inventory data and Sentinel-2 imagery (Feret and Barbier, 2025) or foliage flushing patterns derived from MODIS (Viennois et al., 2013). We plan to explore this internal heterogeneity in future work through continuous and gradient-based mapping approaches, in order to better capture the fine-scale variation in canopy composition and phenology. These continuous gradients of varying phenology and functional/compositional composition are beyond the scope of a categorical/discrete classification. We are investing tremendous effort to improve the characterizations of these gradients, notably using drone-based phenological observatories (www.canobs.net).
To generate these maps, we evaluated several state-of-the-art computer vision models. Our findings demonstrate that in this context, Convolutional Neural Networks (CNNs) outperform Vision Transformer (ViT) architectures, even when trained in a SSL setup. Our CNN with three layers achieved an overall accuracy of 0.91, compared to respectively around 0.70 and 0.69 for the ViT and ViT DINOv2 SSL models despite the latter two being considered cutting-edge in many computer vision tasks. For comparison, the vegetation map produced by Picard et al. (Oquab et al., 2023), which used a Vision Transformer, trained on Sentinel-2 images pre-processed for atmospheric and BRDF effects, reported an overall accuracy of 83% and a final spatial resolution of 100 m. While this map offers some additional detail such as the identification of Marantaceae forests, it covers a much smaller area (18,000 km2) and is based on only two Sentinel-2 tiles from a single swath. In contrast, our map was generated at a finer spatial resolution of 10 m and achieved higher classification accuracy (91%), highlighting the effectiveness of our approach in capturing fine-scale vegetation heterogeneity over large tropical regions.
This difference of performance between CNN and ViT with or without DINOv2 SSL models appears rooted in the way each architecture processes visual information. CNNs primarily capture local texture and spectral patterns, which are critical for distinguishing between forest types with subtle visual differences such as Gilbertiodendron stands or Raphia-dominated swamps. CNNs also tend to perform better with multispectral data, as noted by Adomi et al. (2025) due to their ability to exploit the rich spectral signatures across different bands. In contrast, ViT, which rely on self-attention mechanisms, are optimized for capturing broader spatial structures. As noted by Fogel (2024), ViTs are especially effective in tasks that require the detection of large-scale patterns such as ecological corridors, roads, or linear savanna patches. However, this strength comes at the cost of reduced sensitivity to fine-scale textural variations crucial for forest typology (Marsocci et al., 2024). ViTs are also complex architectures with generally more parameters than CNNs. For example, the vit_base_patch14_dinov2 model used in our experiments has 86.6 million parameters, whereas popular CNN architectures such as ResNet-50 and EfficientNet-B4 have approximately 25 million and 19 million parameters, respectively. In contrast, the lightweight CNN model we employed contains only around 9,000 parameters. This difference has practical implications: in our case, applying ViTs for pixel-level classification proved too computationally expensive. Consequently, selecting an appropriate tiling size for ViT inference (10 × 10 pixel tiles) involves a trade-off between achieving fine spatial resolution in the final map and maintaining reasonable execution time. The lightweight nature of our CNN model, on the other hand, enables efficient inference by sliding a window over the entire mosaic with a single-pixel stride, thereby producing a final classification at the native pixel resolution (10 m). We have performed tests where the ViTs are given a broader context (20 × 20 pixel tiles) but a constant 10 pixel stride in order to give the ViTs more context while still keeping the same computing time and final resolution. This change, however, barely impacted the performances of the model. It is then likely that this tile size is still too small for the ViT to benefit from a larger context that is best suited for this kind of architecture. These results are probably specific to our handling of the data and might be challenged on other use cases, particularly with the upcoming of ViT-based models trained specifically on remote sensing data (Marsocci et al., 2024).
Our results also provide insights into the importance of image pre-processing. While some recent studies particularly in agricultural or multi-temporal settings suggest that deep learning models may implicitly compensate for atmospheric or BRDF effects (Rußwurm and Körner, 2020; Pelletier et al., 2019), our findings challenge this assumption in the context of tropical forest mapping using single-date, high-resolution imagery.
Without pre-processing, CNN accuracy dropped from 0.91 to 0.76, while the Kappa coefficient fell from 0.84 to 0.59. Vision Transformers (ViTs) also suffered, with Kappa falling from 0.54 to 0.24. This underscores the importance of maintaining consistent spectral properties in input imagery to enable accurate discrimination of forest types.
Interestingly, ViT DINOv2 SSL’s performance remained relatively stable, with an kappa approximately 0.51 even on raw, uncorrected images. This robustness may stem from the self-supervised training approach of ViT DINOv2 SSL, which can enable the model to learn more generalizable features even from single-date imagery, although its exposure to diverse atmospheric and illumination conditions is limited. This finding suggests a potential advantage of such models in handling inter-date and inter-sensor variability.
Beyond overall performance, pixel-level analysis of F1 scores by class provides a more nuanced view. The CNN achieved near-perfect scores (F1 > 0.98) for dominant classes such as terra firma forest (FTF), Gilbertiodendron forest (GBD), and savannas, highlighting its strong discrimination ability for widespread vegetation types. However, these classes, particularly FTF, were also frequently overestimated by ViT with or without DINOv2 SSL as indicated by high FPR values. In contrast, ViTs had more difficulty with complex classes: swamp forests and degraded forests showed high FNRs (0.35 and 0.52, respectively), indicating systematic underdetection. Forest gallery also exhibited high and persistent omission errors across all models, highlighting their intrinsic classification difficulty. Finally, certain systematic confusions (e.g., “Built” vs. “Old Fallow”) occurred independently of architecture, reflecting genuine ambiguities in the spectral-structural domain.
Taken together, these results illustrate both the strengths and current limitations of deep learning approaches for tropical forest mapping. CNNs clearly excel at capturing fine-scale spectral and textural differences, yet certain forest types remain systematically misclassified, while ViTs, despite their global contextual awareness, struggle to resolve subtle vegetation contrasts.
These results open a promising direction for future research: incorporating temporal diversity in training datasets to enhance model generalization in remote sensing applications. Indeed, although foundation models such as the selected ViTs are reputed to be robust to noise and lighting conditions due to their extensive pretraining on large and diverse datasets, this robustness does not necessarily extend to the fine-grained spectral and textural distinctions required in tropical forest mapping. It will very likely be beneficial to perform rigorous fine-tuning in the specific context of tropical forests, using training data acquired under varying atmospheric and illumination conditions, before drawing more definitive conclusions.
At this stage, classifying forest types over the whole Congo Basin region will still require applying careful pre-processing for attenuating atmospheric and BRDF effects.
By leveraging the complementarity between CNNs and ViTs, it is possible to combine the fine-grained textural discrimination of CNNs with the global contextual awareness of ViTs, potentially improving classification performance in complex tropical forest landscapes.
Data availability statement
The original contributions presented in the study are included in the article/Supplementary Material, further inquiries can be directed to the corresponding author.
Author contributions
GV: Resources, Conceptualization, Validation, Project administration, Investigation, Visualization, Methodology, Supervision, Writing – review and editing, Writing – original draft, Data curation, Software, Formal Analysis. HT: Writing – review and editing, Methodology. PT: Methodology, Writing – review and editing. PP: Validation, Writing – review and editing, Visualization, Investigation. PC: Resources, Validation, Writing – review and editing, Supervision, Visualization. NB: Writing – review and editing, Supervision, Funding acquisition.
Funding
The author(s) declare that financial support was received for the research and/or publication of this article. One Forest Vision initiative (OFVI) and the support of the EU Biodiversa + Biodivmon program (Project Coforfunc).
Acknowledgments
This research is part of the International Joint Laboratory DYCOFAC, IRD-UYI-IRGM, P.O Box 1857, Yaoundé, Cameroon.
Conflict of interest
The authors declare that the research was conducted in the absence of any commercial or financial relationships that could be construed as a potential conflict of interest.
Generative AI statement
The author(s) declare that Generative AI was used in the creation of this manuscript. We used generative AI technology (OpenAI’s GPT-4-turbo) to assist in writing this manuscript.
Any alternative text (alt text) provided alongside figures in this article has been generated by Frontiers with the support of artificial intelligence and reasonable efforts have been made to ensure accuracy, including review by the authors wherever possible. If you identify any issues, please contact us.
Publisher’s note
All claims expressed in this article are solely those of the authors and do not necessarily represent those of their affiliated organizations, or those of the publisher, the editors and the reviewers. Any product that may be evaluated in this article, or claim that may be made by its manufacturer, is not guaranteed or endorsed by the publisher.
Supplementary material
The Supplementary Material for this article can be found online at: https://www.frontiersin.org/articles/10.3389/frsen.2025.1682132/full#supplementary-material
References
Adorni, P., Pham, M. T., May, S., and Lefèvre, S. (2025). “Towards efficient benchmarking of foundation models in remote sensing: a capabilities encoding approach,” in Proceedings of the computer vision and pattern recognition conference.
Barbier, N., Libalah, M., Katembo, J., Ploton, P., Droissart, V., Texier, N., et al. (2017). Pistes pour l’étude de la distribution des peuplements de Gilbertiodendron dewevrei comme signature des impacts climatiques ou anthropiques anciens. écologie Hist. Afr. Cent. AUF-IRD, Bondy, 157–170.
Clerc, S., Van Malle, M. N., Massera, S., Quang, C., Chambrelan, A., Guyot, F., et al. (2021). “Copernicus SENTINEL-2 geometric calibration status,” in 2021 IEEE International Geoscience and Remote Sensing Symposium IGARSS.
Cresson, R. (2018). A framework for remote sensing images processing using deep learning techniques. IEEE Geoscience Remote Sens. Lett. 16 (1), 25–29. doi:10.1109/lgrs.2018.2867949
Dosovitskiy, A., Beyer, L., Kolesnikov, A., Weissenborn, D., Zhai, X., Unterthiner, T., et al. (2020). An image is worth 16x16 words: transformers for image recognition at scale.
Doxani, G., Vermote, E. F., Roger, J. C., Skakun, S., Gascon, F., Collison, A., et al. (2023). Atmospheric Correction Inter-comparison eXercise, ACIX-II Land: an assessment of atmospheric correction processors for Landsat 8 and Sentinel-2 over land. Remote Sens. Environ. 285, 113412. doi:10.1016/j.rse.2022.113412
Fayad, I., Ciais, P., Schwartz, M., Wigneron, J. P., Baghdadi, N., de Truchis, A., et al. (2024). Hy-TeC: a hybrid vision transformer model for high-resolution and large-scale mapping of canopy height. Remote Sens. Environ. 302, 113945. doi:10.1016/j.rse.2023.113945
Feret, J. B., and Barbier, N. (2025). “S2 BOA reflectance in the context of tropical rainforest: preliminary illustration of the challenges for the extraction of vegetation properties,” in Workshop for Sentinel-2 L2A MAJA products.
Gond, V., Betbeder, J., Fayolle, A., Viennois, G., Cornu, G., Réjou-Méchain, M., et al. (2015). New insights in tropical forest diversity mapping in Central Africa using low resolution remote sensing.
Hoekman, D., Kooij, B., Quiñones, M., Vellekoop, S., Carolita, I., Budhiman, S., et al. (2020). Wide-area near-real-time monitoring of tropical forest degradation and deforestation using Sentinel-1. Remote Sens. 12 (19), 3263. doi:10.3390/rs12193263
Jha, N., Tripathi, N. K., Barbier, N., Virdis, S. G. P., Chanthorn, W., Viennois, G., et al. (2021). The real potential of current passive satellite data to map aboveground biomass in tropical forests. Remote Sens. Ecol. Conserv. Sept. 7 (3), 504–520. doi:10.1002/rse2.203
Kattenborn, T., Leitloff, J., Schiefer, F., and Hinz, S. (2021). Review on Convolutional Neural Networks (CNN) in vegetation remote sensing. ISPRS J. photogrammetry remote Sens. 173, 24–49. doi:10.1016/j.isprsjprs.2020.12.010
Khan, S., Naseer, M., Hayat, M., Zamir, S. W., Khan, F. S., and Shah, M. (2022). Transformers in vision: a survey. ACM Comput. Surv. 31 janv 54 (10s), 1–41. doi:10.1145/3505244
Kim, K. G. (2016). Book review: deep learning. Healthc. Inf. Res. 22 (4), 351. doi:10.4258/hir.2016.22.4.351
Lucht, W., Schaaf, C. B., and Strahler, A. H. (2002). An algorithm for the retrieval of albedo from space using semiempirical BRDF models. IEEE Trans. Geoscience Remote Sens. 38 (2), 977–998. doi:10.1109/36.841980
Marsocci, V., Jia, Y., Bellier, G. L., Kerekes, D., Zeng, L., Hafner, S., et al. (2024). PANGAEA: a global and inclusive benchmark for geospatial foundation models
Marujo, R. de F. B., Carlos, F. M., Costa, R. W. da, Arcanjo, J. de S., Fronza, J. G., Soares, A. R., et al. (2023). A reproducible and replicable approach for harmonizing Landsat-8 and Sentinel-2 images. Front. Remote Sens. 4, 1254242. doi:10.3389/frsen.2023.1254242
Mayaux, P., Bartholomé, E., Fritz, S., and Belward, A. (2004). A new land-cover map of Africa for the year 2000. J. Biogeogr. 31 (6), 861–877. doi:10.1111/j.1365-2699.2004.01073.x
Morton, D. C., Nagol, J., Carabajal, C. C., Rosette, J., Palace, M., Cook, B. D., et al. (2014). Amazon forests maintain consistent canopy structure and greenness during the dry season. Nature 506 (7487), 221–224. doi:10.1038/nature13006
Oquab, M., Darcet, T., Moutakanni, T., Vo, H., Szafraniec, M., Khalidov, V., et al. (2023). DINOv2: learning robust visual features without supervision
Pelletier, C., Webb, G. I., and Petitjean, F. (2019). Temporal convolutional neural network for the classification of satellite image time series. Remote Sens. 11 (5), 523. doi:10.3390/rs11050523
Picard, J., Nungi-Pambu Dembi, M. M., Barbier, N., Cornu, G., Couteron, P., Forni, E., et al. (2025). Combining satellite and field data reveals Congo’s forest types structure, functioning and composition. Remote Sens. Ecol. Conserv. avr 11 (2), 200–220. doi:10.1002/rse2.419
Prieur, C., Braham, N. A. A., Tresson, P., Vincent, G., and Chanussot, J. (2024). “Prospects for mitigating spectral variability in tropical species classification using self-supervised learning,” in 2024 14th workshop on hyperspectral imaging and signal processing: evolution in remote sensing.
Quang, A. V., Delbart, N., Jaffrain, G., Pinet, C., and Moiret, A. (2022). Detection of degraded forests in Guinea, West Africa, based on Sentinel-2 time series by inclusion of moisture-related spectral indices and neighbourhood effect. Remote Sens. Environ. 281, 113230. doi:10.1016/j.rse.2022.113230
Réjou-Méchain, M., Mortier, F., Bastin, J. F., Cornu, G., Barbier, N., Bayol, N., et al. (2021). Unveiling African rainforest composition and vulnerability to global change. Nature 593 (7857), 90–94. doi:10.1038/s41586-021-03483-6
Ronneberger, O., Fischer, P., and Brox, T. (2015). “U-Net: Convolutional networks for biomedical image segmentation,” in Medical image computing and computer-assisted intervention – MICCAI. Editors N. Navab, J. Hornegger, W. M. Wells, and A. F. Frangi
Roy, D. P., Li, J., Zhang, H. K., Yan, L., Huang, H., and Li, Z. (2017). Examination of Sentinel-2A multi-spectral instrument (MSI) reflectance anisotropy and the suitability of a general method to normalize MSI reflectance to nadir BRDF adjusted reflectance. Remote Sens. Environ. 199, 25–38. doi:10.1016/j.rse.2017.06.019
Rußwurm, M., and Körner, M. (2020). Self-attention for raw optical satellite time series classification. ISPRS J. photogrammetry remote Sens. 169, 421–435. doi:10.1016/j.isprsjprs.2020.06.006
Sothe, C., De Almeida, C. M., Schimalski, M. B., Liesenberg, V., La Rosa, L. E. C., Castro, J. D. B., et al. (2020). A comparison of machine and deep-learning algorithms applied to multisource data for a subtropical forest area classification. Int. J. Remote Sens. 41 (5), 1943–1969. doi:10.1080/01431161.2019.1681600
Tresson, P., Dumont, M., Jaeger, M., Borne, F., Boivin, S., Marie-Louise, L., et al. (2024). Self-supervised learning of vision transformers for digital soil mapping using visual data. Geoderma 450, 117056. doi:10.1016/j.geoderma.2024.117056
Vancutsem, C., Achard, F., Pekel, J. F., Vieilledent, G., Carboni, S., Simonetti, D., et al. (2019). Long-term (1990–2019) monitoring of forest cover changes in the humid tropics.
Viennois, G., Barbier, N., Fabre, I., and Couteron, P. (2013). Multiresolution quantification of deciduousness in West-Central African forests. Biogeosciences 10 (11), 6957–6967. doi:10.5194/bg-10-6957-2013
Wagner, F. H., Sanchez, A., Tarabalka, Y., Lotte, R. G., Ferreira, M. P., Aidar, M. P. M., et al. (2019). “Using the U-net convolutional network to map forest types and disturbance in the Atlantic rainforest with very high resolution images,” Remote Sens. Ecol. Conserv. déc. Editors N. Pettorelli, and N. Clerici 5(4)360–375. doi:10.1002/rse2.111
Waśniewski, A., Hościło, A., Zagajewski, B., and Moukétou-Tarazewicz, D. (2020). Assessment of Sentinel-2 satellite images and random forest classifier for rainforest mapping in Gabon. Forests 11 (9), 941. doi:10.3390/f11090941
You, H., Huang, Y., Qin, Z., Chen, J., and Liu, Y. (2022). Forest tree species classification based on Sentinel-2 images and auxiliary data. Forests 13, 1416. doi:10.3390/f13091416
Keywords: deep learning, sentinel 2, vegetation map, tropical forest, BRDF, atmospheric effects
Citation: Viennois G, Tulet H, Tresson P, Ploton P, Couteron P and Barbier N (2025) Sentinel-2 forest typology mapping in Central Africa: assessing deep learning and image preprocessing effects. Front. Remote Sens. 6:1682132. doi: 10.3389/frsen.2025.1682132
Received: 08 August 2025; Accepted: 12 September 2025;
Published: 26 September 2025.
Edited by:
Jean-Pierre Wigneron, l’alimentation et l’environnement (INRAE), FranceReviewed by:
Bertrand Ygorra, INRAE Nouvelle-Aquitaine Bordeaux, FranceAn Vo Quang, Université Sorbonne Paris Cité, France
Copyright © 2025 Viennois, Tulet, Tresson, Ploton, Couteron and Barbier. This is an open-access article distributed under the terms of the Creative Commons Attribution License (CC BY). The use, distribution or reproduction in other forums is permitted, provided the original author(s) and the copyright owner(s) are credited and that the original publication in this journal is cited, in accordance with accepted academic practice. No use, distribution or reproduction is permitted which does not comply with these terms.
*Correspondence: Gaëlle Viennois, Z2FlbGxlLnZpZW5ub2lzQGNpcmFkLmZy