 Kailun Liu
 Yanbo Wei
 Zhizhong Lu1*
- 1College of Intelligent Systems Science and Engineering, Harbin Engineering University, Harbin, Heilongjiang, China
- 2College of Electrical Engineering and Automation, Luoyang Normal University, Luoyang, Henan, China
Since estimating the encountered sea wave is particularly important, retrieving significant wave height (SWH) from ship motion response (SMR) and X-band marine radar images is investigated. Although SMR and radar images have been widely utilized separately for estimating SWH, the retrieving accuracy and reliability under complex nonlinear sea conditions should be further enhanced. In this paper, the features of SMR and the radar images are investigated. A feature fusion method based on the statistical characteristic extracted from SMR historical data and the signal-to-noise ratio (SNR) feature achieved from radar images is proposed for estimating SWH. The feature vector and observation matrix are constructed using the significant values extracted from SMR historical data and the wave SNR extracted from radar images. Then, the weight coefficient of the feature vector, which is used to estimate SWH, is determined based on the least-squares fitting algorithm. Using the simulated SMR historical data and radar images, the experimental results demonstrate that the proposed feature fusion approach has better retrieval accuracy than the SNR-based approach; the colorization coefficient (CC) of the retrieved SWH approximately approaches 1, and the root mean square error (RMSE) decreases to 0.14 m.
1 Introduction
Estimating the sea states around a ship is particularly important, and external information on the waves encountered is needed as input for the shipboard decision support system to enhance accuracy and reliability. In ocean engineering and ocean science, precise wave height measurement has always been a major research focus (Dankert et al., 2005; Liu et al., 2017).
The traditional wave height measurement tool mainly includes a wave buoy, X-band marine radar, high-frequency radar, and satellite remote sensing (Majidian et al., 2022; Huang et al., 2017). Although the wave buoy is highly accurate, continuous observation of a large sea area cannot be achieved because of layout, recovery, and cost limitations. The radar and satellite remote sensing can cover a large sea area. However, the accuracy of satellite remote sensing is relatively low, and it is affected by environmental factors such as cloud cover. The high-frequency radar requires fewer installation and startup conditions due to the limited installation size in the ship and the fingerprint exposure problem (Chen et al., 2019; Zhao et al., 2022).
X-band marine radar is commonly deployed for ship navigation and marine environment monitoring as it can accurately reflect changes in the sea surface due to its high spatial and temporal resolution (Chen et al., 2017; Wang et al., 2025, Wang et al., 2023; Yang and Huang, 2022). Therefore, significant wave height (SWH) can be derived by analyzing the X-band radar images, and the study on estimating wave parameters from radar images has received significant attention.
Currently, according to the acquired X-band radar images, SWH inversion technology mainly includes methods based on spectrum analysis, the shadow statistical method, and machine learning (Yang et al., 2022; Wu et al., 2022).
The Fourier transform of the radar image sequence, a designed band-pass filter based on the dispersion relation, and the modulation transfer function (MTF) are used to derive the wave spectrum and the signal-to-noise ratio (SNR). The SWH is determined by using a linear relation with the square root of the SNR (Nieto-Borge et al., 2004; Nieto-Borge et al., 2008; Qiu et al., 2017). As a result, external equipment is essential for calibrating the image spectrum and deriving the coefficient of the linear relation. The classical Fourier transform-based method yields good results, but the inversion accuracy is greatly affected by the non-homogeneous and non-stationary characteristics of ocean waves in the nearshore area (Atkinson et al., 2021).
Instead of using the SNR feature of the wave signal, the shadow statistical method is developed, which analyzes the illumination ratio of the shadow area based on the principles of geometric optics (Plant and Farquharson, 2012; Gangeskar, 2014; Wei et al., 2023a). However, the estimated wave slope and wave height are sensitive to the non-wave targets in the observed area of interest. The estimation accuracy depends on the angle between the wind direction and the emitted electromagnetic wave, and the performance of the shadow statistical method should be further verified under different sea conditions (Navarro et al., 2019; Ludeno and Serafino, 2019; Wei et al., 2023b).
Methods based on wavelet transform and neural networks have received more attention. These methods can better adapt to the non-stationary characteristics of ocean waves and improve the accuracy of SWH inversion (Chuang et al., 2008; An et al., 2015). Furthermore, the technique, combined with the traditional SNR feature and machine learning technology, is proposed to improve the estimation accuracy (Salcedo-Sanz et al., 2015; Cornejo-Bueno et al., 2016). Deep learning techniques can automatically learn features from large amounts of data to model complex wave environments, which is anticipated to improve the precision and efficiency of wave height inversion (Chen and Huang, 2022; Huang et al., 2021; Wang et al., 2022; Yang and Huang, 2024). By utilizing extracted multi-scale deep spatial features, a method is proposed to effectively improve the accuracy of wave height and wave period using a convolutional neural network model and a self-attention mechanism (Zuo et al., 2024).
In addition, the sea state parameter, such as SWH, can be estimated from the ship motion response (SMR) by considering the ship a large wave buoy. The ship’s motion is used to retrieve encounter wave information, a method known as the ship analogy to a wave buoy (SAWB). With its low cost and reduced sensitivity to weather conditions, the SAWB has attracted considerable attention for estimating the sea state (Majidian et al., 2022). When the ship moves under the action of waves, SMR reflects the wave encountered by the ship. Therefore, the wave parameters could probably be extracted from the recorded SMR historical information, such as pitching and heaving. With the development of SAWB technology, real-time estimation of wave height based on SMR has gradually received more attention.
Retrieving encounter wave information from SMR is an essential means of wave monitoring and has the advantage of low cost. Real-time estimation of sea states could be obtained from SMR without installing additional sensors for the SAWB method. By developing the relation between SMR and the wave spectrum, the 6-degree-of-freedom (DOF) SMR data are used to construct a parameterized model for direct sea state analysis (Sun et al., 2025).
Wave height measurement based on the SAWB is divided into model-based frequency-domain analysis and data-driven time-domain analysis. Based on the wave spectrum parameter model, the wave spectrum is estimated by combining the SMR spectrum and the transfer function (Nielsen, 2006; Pascoal and Soares, 2008). An iterative process and Bayesian optimization approaches are commonly used to establish the matching spectrum. Both strategies manipulate the gauged response function to map from sea state to vessel motion, which has been further optimized through sailing experiments (Iseki and Ohtsu, 2000) and more efficient sea state computation (Nielsen et al., 2018).
The frequency-domain analysis is separated into parametric and non-parametric inversion approaches. A method for calculating the actual wave direction spectrum is proposed based on the ship’s roll, pitch, and heave historical data over a short time period (Tannuri et al., 2003; Pascoal et al., 2007). Traditional model-based spectrum analysis methods rely mainly on empirical formulas and have limitations in describing the non-linear characteristics of ocean waves (Hinostroza and Guedes Soares, 2016, Hinostroza and Guedes Soares, 2020). The results show that the inversion of SMR has good consistency with the Joint North Sea Wave Project (JONSWAP) spectrum at low sailing speeds (Montazeri et al., 2016). Research on the problem of wave inversion under high sailing speeds should be further developed.
The SMR is analyzed based on the combined statistical features extracted from the obtained historical data and spectrum features using the wavelet transform. The cross-spectrum is obtained using the Fourier transform on SMR data in the model-based frequency-domain analysis method. The frequency-domain method relies on the assumption of linearity between SMR and the wave, which makes it less applicable to non-linear wave conditions under medium and high sea states (Nielsen, 2017; Pascoal et al., 2017). In addition, the inversion accuracy significantly depends on the transfer function.
Since the non-linear relationship between the wave and the ship motion is complex to model, instead of optimization in the spectral domain, data-driven models such as Kalman filtering (Kim et al., 2019; Pascoal and Guedes Soares, 2009) and the stepwise method (Atkinson et al., 2021) are developed for estimating SWH. The Kalman filter method is widely used to estimate hull models and pose, improving the accuracy and stability of the inversion result.
Then, the constructed features and machine learning models are used to verify the performance based on wave height and wave peak. To compensate for the limited data within a narrow range of sea states, a hybrid approach that integrates machine learning with a model-based method is proposed (Han et al., 2022). To better generalize the data-driven model, a semi-supervised transfer-learning approach with two attention mechanisms for estimating SWH is proposed (Cheng et al., 2024). Based on SMR data, a class-imbalanced cross-scale model, which can learn abundant coarse- and fine-level features from the imbalanced state, is designed (Cheng et al., 2023). To prevent performance degradation directly in the target system, a supervised transfer learning-based framework, which focuses on determining the relationship between the target and the source marine system, is proposed (Cheng et al., 2022). Although the proposed inversion model uses an artificial neural network to extract features from the non-stationary and non-linear SMR historical data (Qin et al., 2022), deviations at peaks and troughs have been observed in validation against the ship model water tank experiment data from the same study.
Although marine radar images and SMR historical data have been used separately to retrieve SWH, the fusion method using both SMR and radar data is rare. Currently, marine radar images are combined with the SAWB algorithm to enhance the estimation accuracy of wave frequency and direction (Stredulinsky and Thornhill, 2011). Since the X-band marine radar provides accurate wave frequency and direction information, a data fusion method using the pitching and heaving information recorded by the motion response to correct the wave spectrum extracted from radar images is proposed to refine shipboard wave height measurement.
For the SAWB technology, the SWH can be estimated using the SMR without installing additional sensors. To improve the accuracy and reliability of SWH, the statistical characteristics obtained from SMR historical data are integrated into the wave measurement process based on X-band marine radar images in this paper. By combining the ship motion features obtained using SAWB technology and the extracted SNR from marine radar images, a feature fusion method is proposed for estimating SWH. The remainder of this paper is organized as follows: in Section 2, the simulation of SMR historical data and the extraction of significant values are described. The simulation of radar images and the SNR extraction are also presented. Subsequently, the feature fusion model is proposed, and the SWH is estimated using the constructed feature vector and obtained weight coefficients. In Section 3, the performance of the proposed feature fusion method is demonstrated and analyzed.
2 Feature fusion method proposed for estimating the SWH
To establish a more accurate and reliable SWH measurement model, the main idea of estimating wave height is to combine the statistical characteristics extracted from the SMR and the SNR feature of radar images. In this paper, the SWH is derived by fusing the SNR obtained from non-coherent radar images with the significant values of the pitching and heaving historical data. The flowchart of estimating SWH using the feature fusion method is illustrated in Figure 1.
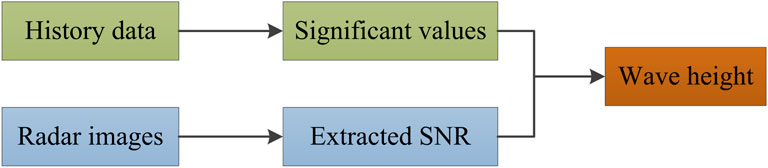
Figure 1. Flowchart of SWH estimation using the data fusion of the multi-sensor.
2.1 Simulation of SMR historical data and extraction of statistical characteristics
2.1.1 Historical data simulation
Currently, nonlinear ship motion simulation methods are mainly based on the potential flow dynamic analysis model and the sticky water dynamic analysis model (Qin et al., 2022). The sticky water method has an advantage in ship force calculation since the viscosity between the water and the hull is considered. However, it relies on a large number of iterative calculations, and the computational efficiency is very low. The potential flow method has a high level of accuracy and efficiency and can accurately simulate the nonlinear motion analysis of a ship under harsh sea conditions. It is suitable for multi-sea-condition, multi-speed, and multi-wave calculations in optimizing ship type selection and evaluating hydrodynamic performance. The potential flow method can finely simulate the SMR under external excitation and has high computational efficiency. The two-dimensional (2D) half-theory is a classical potential flow calculation method that performs motion calculations in three dimensions (3D) to achieve a balance between calculation efficiency and accuracy (Duan and Ma, 2004; Ma et al., 2004).
2.1.1.1 Solution condition for the unsteady perturbation potential
In view of the linear potential flow theory in the time domain, the flow field velocity around a moving ship in sea waves is composed of both steady and unsteady potentials, as presented in Equation 1 (Qin et al., 2022; Duan and Ma, 2004).
where
where
where
2.1.1.2 Numerical solution of the unsteady perturbation potential
The solution of Formula 3 can be considered a 2D time-surface problem. When the flow field potential is solved in the time step, the perimeter of the column section varies from the bow to the stern, and the flow field for each transverse section is determined by the step solution method. The 2D time-domain Green function is used to construct a distributed source boundary integral equation to calculate
2.1.1.3 Steady-state SMR in regular wave
The ship motion in the wave belongs to the rigid body 6-DOF movement, which can be represented by the line displacement along the three axes of the ship translation frame and the three angular displacements around the origin. Considering the hydrodynamic load and hydrostatic recovery force acting on the ship, the motion equation of the ship in the wave is presented in Equation 4 as follows (Qin et al., 2022; Ma et al., 2004):
where
After solving the unsteady disturbance potential, the hydrodynamic calculation of radiation and diffraction can be carried out. Then, the oscillatory displacement of the ship motion
2.1.2 Extraction of statistical characteristics from SMR historical data
According to the real ship model, under the typical sea conditions with different wave periods and wave heights, the ship motion is simulated to obtain the historical data on the ship heaving and pitching. When ships sail on the waves, the actions of wind and waves will produce the 6-DOF movement, among which the rolling, pitching, and heaving movements on the ship are more prominent (Wang, 2020). In addition, the reliability of simulated pitching and heaving is higher than that of rolling. Thus, the historical data on pitching and heaving are mainly considered in this paper.
Based on the recorded historical data on ship heaving and pitching, the corresponding statistical characteristics, such as maximum wave height, maximum wave period,
where
Based on the historical data on heaving and pitching for ships under level 6 sea conditions with an SWH of 4.2 m and a wave peak period of 11.5 s, the calculated height and angle for each waveform of heaving and pitching are presented in Figure 2. The horizontal axis in Figure 2a represents the waveform number of the heaving data, and the vertical axis represents the height of each waveform in the heaving data. The horizontal axis in Figure 2b represents the waveform number of the pitching data, and the vertical axis is the waveform angle of the pitching data. Based on the calculated height and angle, the
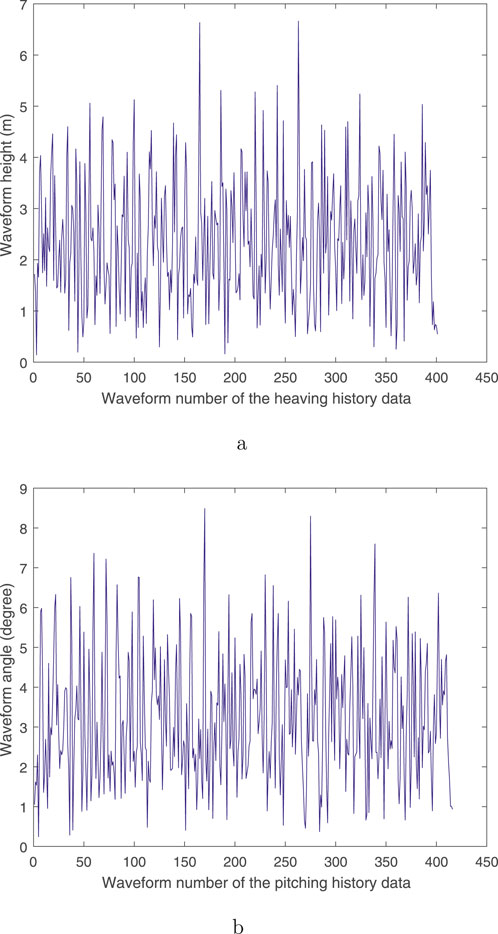
Figure 2. Calculated height and angle for each waveform in heaving and pitching data. (a) Waveform height of heaving data. (b) Waveform angle degree of pitching data.
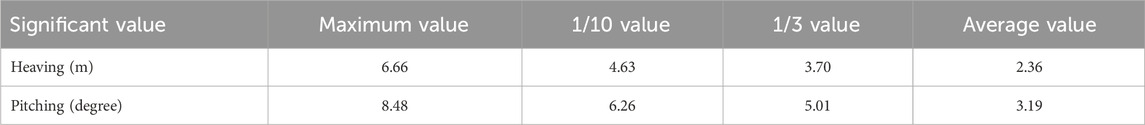
Table 1. Calculated significant value of heaving and pitching using the historical data.
In this paper, the
2.2 Radar image simulation and extraction of the SNR
2.2.1 Simulated radar images
According to the operating conditions in practice and the corresponding wave parameters of the SMR, the simulation of the radar images is performed. Based on the input sea state conditions and the characteristics of a typical sea area, the wave spectrum and sea surface elevation are obtained. By combining the installation height of the radar with the imaging mechanism of radar images, the sea surface elevation data are used to generate an approximate actual radar image.
For the typical sea states and radar antenna height of the ship, the simulation of the sea clutter image in the effective observation area is carried out. Sea waves are a complex natural phenomenon with apparent spatial and temporal randomness. Commonly, the Longuet–Higgins model is selected to simulate the sea surface field, as presented in Equation 8 (Huang et al., 2017; Wei et al., 2020).
where
where
where
Since the sea wave energy is distributed within a certain frequency range and has different propagation directions, the directional propagation function
where
In practice, marine radar performance is restricted by its installation height, resulting in a low-grazing-angle observation geometry. Under this specific configuration, although sea surface backscattering is theoretically influenced by tilt and hydrodynamic modulation, their effects on image contrast are significantly less dominant than those of shadow modulation. The radar image is, therefore, primarily governed by the shadowing effect. This is because the wave undulations cause significant occlusion, generating decisive bright and dark structures in the image that directly correlate with the macroscopic geometric profile of the waves (e.g., wavelength and wave height). Since the primary goal of this study is wave height inversion, capturing these geometric features is essential. Consequently, focusing on shadow modulation represents a reasonable and effective simplification for our retrieval objective. Owing to the undulating movement of the sea surface along the incident direction of the electromagnetic wave, the lower wave would be blocked by the higher wave in front of it, making it impossible for the radar to detect the blocked sea surface. For convenience, the binary shadow mask is denoted by
A simulated radar image under level 4 sea conditions is presented in Figure 3. The radar antenna height is 25 m, and the image resolution in distance is 7.5 m. The SNR feature could be extracted based on the simulated radar image sequence.
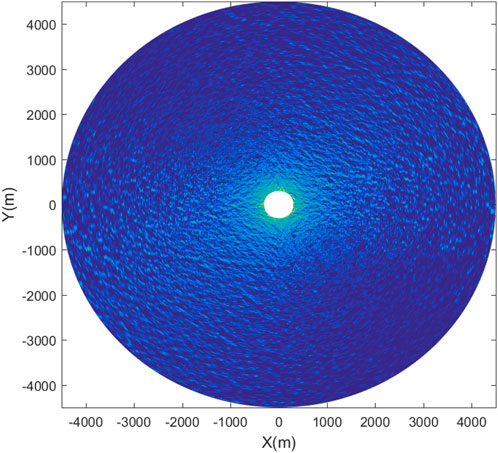
Figure 3. Simulated X-band marine radar image.
2.2.2 Extraction of the SNR feature of the wave signal based on the Fourier transform
Currently, the Fourier transform on the radar image sequence is used to gain the image spectrum, which is filtered and corrected to achieve the wave spectrum and its SNR. Assuming that the wave field on the sea surface is homogeneous in the spatial domain and stationary in the temporal domain within the selected area, the 3D Fourier transform technology is currently a mainstream method for extracting the wavenumber frequency spectrum using radar images in practice (Nieto-Borge et al., 2004, Nieto-Borge et al., 2008). The non-wave signal is filtered out based on the dispersion band-pass filter, and the wave spectrum is obtained using the modulation transfer function. Finally, the wave SNR is derived from the obtained wave spectrum, and SWH is calculated using the linear empirical relationship with the SNR.
The ocean wave is a typical non-stationary random process, and the radar echo intensity decreases non-linearly with increasing distance to the radar antenna. Since the sea wave is usually regarded as a stochastic process of smooth states in engineering applications, an analysis region is selected when using the 3D Fourier transform. By using X-band marine radar images, the classical approach for retrieving SNR and SWH is presented in the following sub-sections (Nieto-Borge et al., 2004, Nieto-Borge et al., 2008).
2.2.2.1 Coordinate transform
Since the original images collected using the marine radar are in the polar coordinate system
2.2.2.2 3D Fourier transform
By performing a 3D Fourier transform on the selected analysis area of the radar image sequence
where
2.2.2.3 Extracting wave energy
Under the assumption that waves are consistent with the linear wave theory, the wave energy in the image spectrum should be distributed near the dispersion relation surface. The 3D wavenumber frequency energy spectrum is filtered using the band-pass filter.
In general engineering practice, a dispersion band-pass filter with the maximum surface current
where
2.2.2.4 Determination of the wave spectrum using the MTF
Due to the nonlinearity of sea clutter imaging, the real wave spectrum varies slightly from the 2D image spectrum obtained. The empirical MTF is utilized to achieve the conversion between
where
2.2.2.5 Calculation of the SNR and SWH
Based on the linear relationship between wave height and the square root of the SNR extracted from sea clutter images, the SWH can be obtained by determining the coefficient of the linear relationship, as shown in Equation 18 (Lund et al., 2014; Lund et al., 2016).
where
where
2.3 Feature vector construction based on extracted statistical characteristics and SNR
A model for estimating SWH using the SMR and radar images is established in this paper. Different sea conditions are used as the truth value to simulate radar images and generate SMR historical data. The feature vector is constructed using the SNR extracted from the non-coherent radar image and the statistical feature obtained from SMR historical data, as presented in Equation 20:
2.4 Solving weight coefficients of the combined feature vector
A method that fuses the significant value of SMR historical data, such as pitching and heaving, with the wave SNR from radar images is proposed to estimate SWH. The feature vectors constructed under different sea conditions are divided into two parts: training and test sets. Figure 4 displays the flowchart of estimating the weight coefficients of each feature based on the training set data.
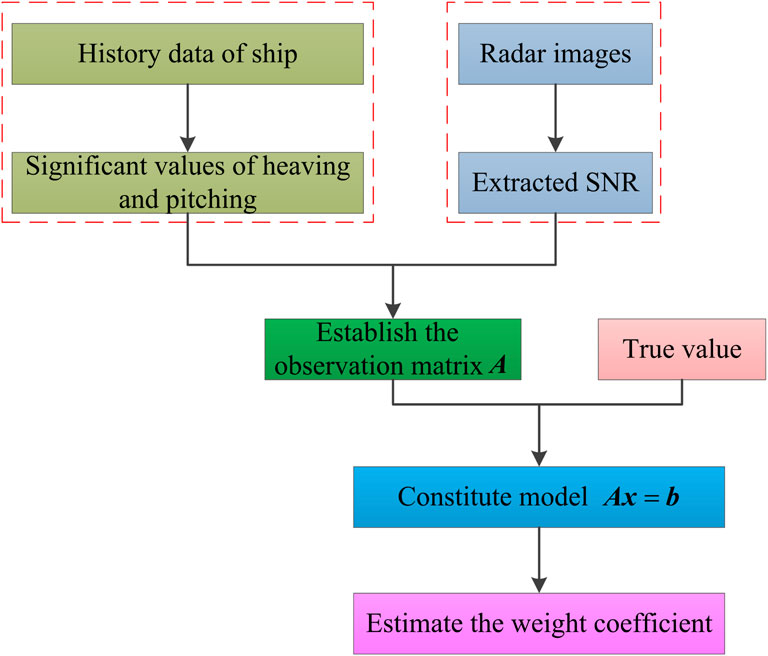
Figure 4. Flowchart of SWH estimation using the data fusion of the multi-sensor.
The wave feature parameters under different sea conditions, which are input to simulate radar images and the historical data of SMR, are taken as the true value. The feature matrix
where the observation matrix
where
Commonly, the rank
2.5 Estimation of the SWH based on the obtained weight coefficient
The test set is used to verify the accuracy and effectiveness of the multi-sensor information fusion model and method. According to the weight coefficients
where
3 Experimental results and analysis
3.1 Description of simulation software and the parameter configuration
According to the real ship model and the typical sea conditions, the SMR is simulated to obtain the historical data on heaving and pitching. The S175 container ship, which is one of the main vessel types and has most of the characteristics of container ships, is selected as an example ship to carry out the hydrodynamic feature calculation and SMR simulation. The main scale information of the S175 container ship is presented in Table 2.

Table 2. Main scale parameters of the S175 container ship.
In this paper, the simulated SMR data are achieved based on the self-developed ship wave resistance calculation program, as provided by Duan and Ma (2004) and Ma et al. (2004). The 2D half-theory is used to develop the numerical simulation for the S175 container ship under different regular sea conditions. Based on the long-term distribution characteristics of standard sea conditions in the International Maritime Organization in SDC 1/INF. 6.0, the specific SWH and wave period are selected, which are presented in Table 3. The ship speed is set to zero to simplify the simulation and calculation under different working conditions. According to the specific working conditions described in Table 3, the historical data on heaving and pitching under seven working conditions are obtained. The total time duration of the historical data is 3,600 s, and the time resolution is 0.1 s.
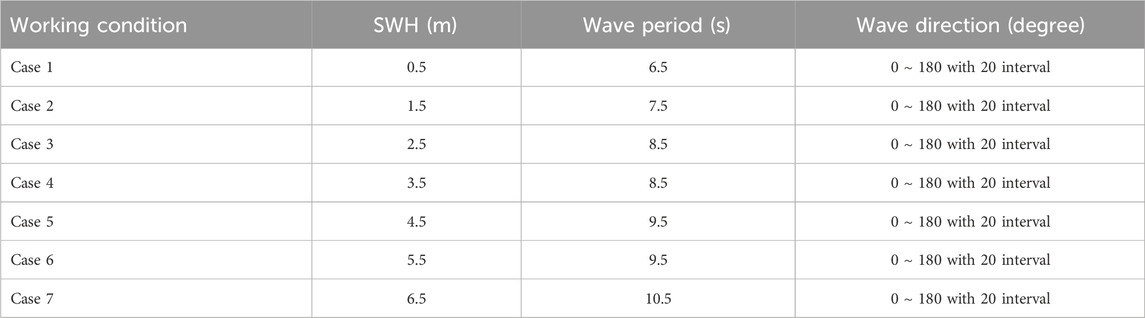
Table 3. Specific working conditions and corresponding parameters.
3.2 Statistical characteristic analysis of the SMR
The relationship between sea conditions and statistical characteristics of historical heaving and pitching data is investigated. The significant value of heaving and pitching under the upward wave direction and a wave direction of 120° is presented in Figures 5, 6. The horizontal and vertical coordinates denote the working condition and the extracted significant value, respectively. The vertical axis represents the
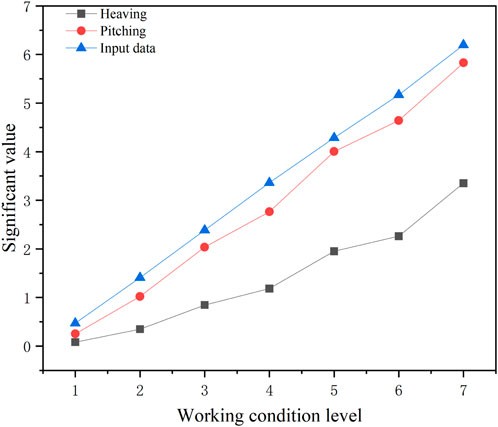
Figure 5. Significant value of heaving and pitching under an upward wave direction.
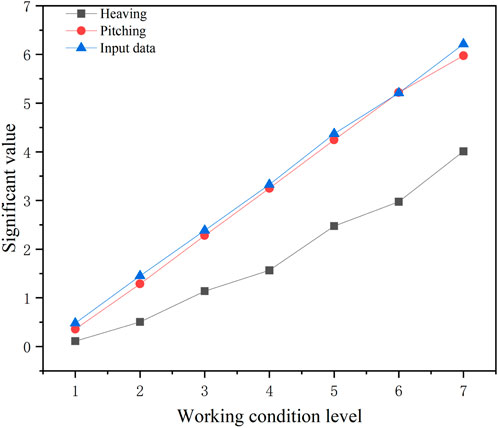
Figure 6. Significant value of heaving and pitching under a wave direction of 40°.
Using the simulated historical data under the condition of an SWH of 1.5 m and a wave period of 7.5 s, the significant value of heaving and pitching changing with the wave direction is detailed in Figure 7. The horizontal coordinate denotes the wave direction with a 20° interval, while the vertical axis represents the
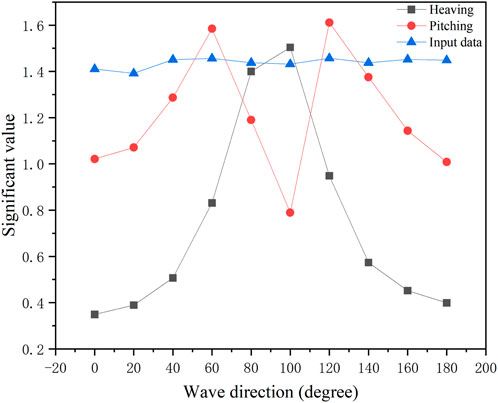
Figure 7. Significant values extracted from historical data under an SWH of 1.5 m.
When the SWH is 5.5 m and the wave period is 9.5 s, the extracted significant value of heaving and pitching and the true value, which changes with the wave direction, are provided in Figure 8. As the SWH is 5.5 m, the vertical axis corresponds to the
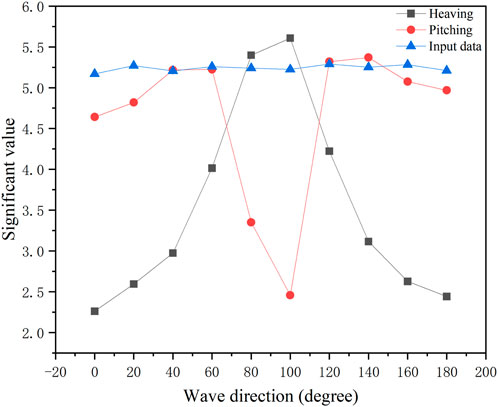
Figure 8. Significant values extracted from historical data under an SWH of 5.5 m.
By investigating the extracted statistical characteristics according to the historical data under different sea conditions, we found that the significant values of pitching and heaving differ considerably with wave directions. The significant value of heaving increases, subsequently decreases, and reaches the maximum value at a wave direction of approximately 90°. The significant value of pitching is minimum when the course is perpendicular to the wave direction and reaches the maximum at wave directions of approximately 60 and 120°.
3.3 Performance of the proposed feature fusion method
To verify the validity of the proposed multi-sensor fusion method for estimating SWH, the simulated SMR historical data and radar image sequences are used to extract features and conduct experiments. The input sea condition parameters in the simulation are used as the truth value.
The time resolution of the simulated radar image is 2.3 s. According to the actual conditions of radar data acquisition, the simulated radar image sequence contains 32 images, with an interval of 4 min between consecutive images. Commonly, the estimated SWH from radar image sequences is averaged over 20 min. Thus, the one-hour ship historical data are divided into three groups with 20-min intervals. According to the seven different working conditions with 10 different wave directions, 210 sets of experimental data were generated.
In this paper, the generated historical data on SMR and radar images under different sea conditions are randomly separated into training and test sets with a ratio of 1:1. The training set is used to determine the feature weight coefficients in different wave directions, and the test set is used to verify the accuracy of the multi-sensor fusion model of inversion SWH using the calculated weight coefficients. The simulated SMR historical data and radar images under an upward wave direction are used to verify the effectiveness of the feature fusion method. The correlation coefficient (CC) and root mean square error (RMSE) of the SWH are used to evaluate the performance of the proposed method.
Figure 9 shows the SWH extracted using the SNR feature. The red solid line with crosses represents the true value, and the blue dashed line with triangles represents the SWH estimated using only the SNR feature obtained from radar image sequences. It can be observed that the SWH estimated using the SNR increases with increasing sea state, but it deviates greatly from the true value. Figure 10 shows a scatterplot between the truth value and the estimated SWH using the SNR feature, with a CC of 0.83 and an RMSE of 1.08 m.
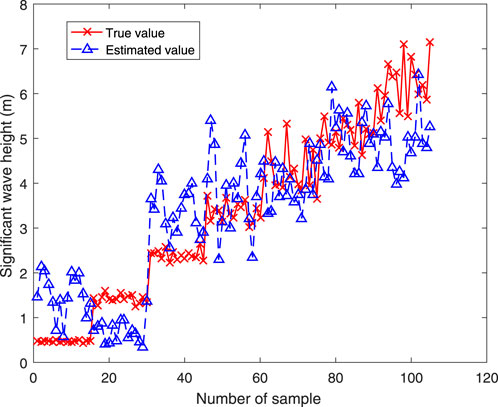
Figure 9. SWH estimated using the SNR feature.
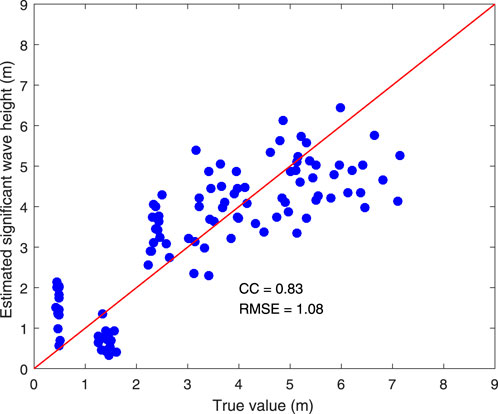
Figure 10. Scatterplot of wave height between the truth value and estimated SWH using the SNR feature.
The calculated SWH based on the fusion of the significant value extracted from historical data and SNR extracted from radar images is illustrated in Figure 11. The red solid line with crosses represents the true value, and the blue dashed line with triangles represents the wave height estimated using the combined features. It can be observed from Figure 11 that the SWH estimated based on the combined feature also increases with the working condition, and the estimated SWH is basically consistent with the change in the true value. However, the large error still exists, especially when the estimated SWH is less than 1 m.
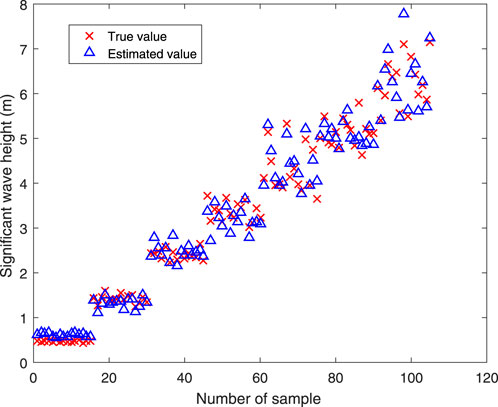
Figure 11. Estimated SWH using the feature fusion of the multi-sensor.
Figure 12 shows a scatterplot between the true value and SWH estimated using the feature fusion of significant values and SNR extracted, with an RMSE of 0.22 m and a correlation coefficient of 0.99. Compared to the estimated SWH in Figure 9, the estimated SWH based on the proposed fusion method can better follow the true value. Using extracted features from SMR historical data and radar images under the condition of the upward wave direction, the CC of SWH estimated using the combined feature is 0.16 higher and the RMSE error is 0.86 m lower than those obtained using the SNR-based feature.
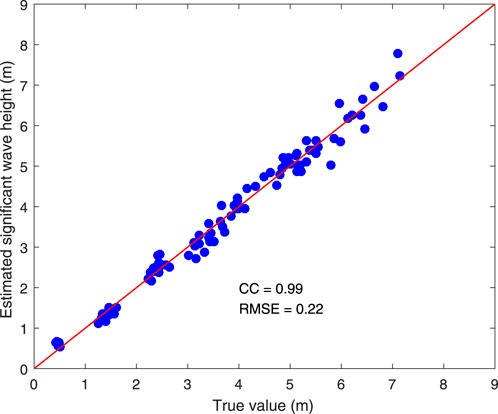
Figure 12. Scatterplot of SWH between the truth value and the information fusion of the multi-sensor.
To further verify the effectiveness of the wave measurement scheme based on data fusion, the features extracted from the historical data in different wave directions are fused with the SNR extracted from the radar images.
The wave height estimated using the significant value in the wave direction of 20° is shown in Figure 13. The SWH estimated based on the combined features increases with the increasing sea conditions, but the estimated SWH deviates from the true value under high sea conditions. When the SWH is less than 3.5 m, the estimated SWH agrees reasonably well with the true value. However, the deviation becomes larger when the wave height exceeds 3.5 m. The scatterplot between the truth value and SWH estimated based on combined features for a wave direction of 20° is presented in Figure 14. The CC reaches 0.99, and the RMSE is 0.24 m.
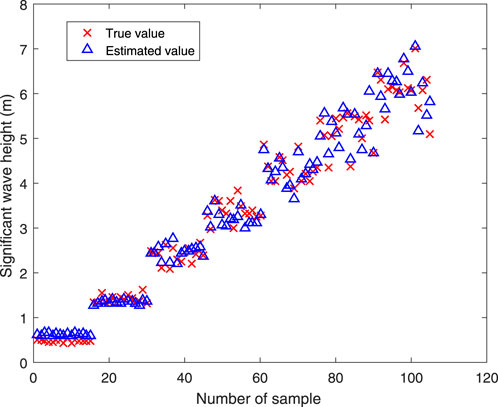
Figure 13. Estimated SWH based on the combined features under a wave direction of 20°.
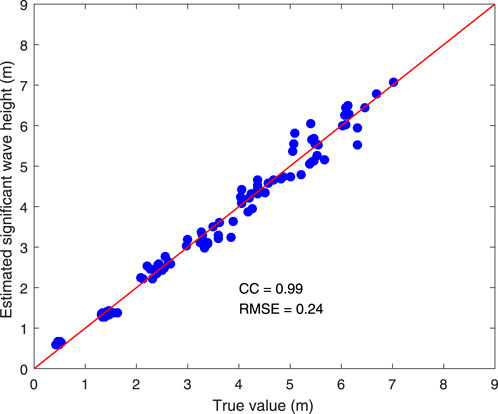
Figure 14. Scatterplot of SWH between truth value and the estimated value under a wave direction of 20°.
For a wave direction of 40°, the SWH estimated based on the significant value derived from the historical data and SNR extracted from radar images is shown in Figure 15. The SWH estimated based on the combined features increases with the increasing sea conditions, but the estimated SWH deviates from the true value under high sea conditions. When the wave height is less than 4.5 m, the estimated SWH is basically consistent with the true value. However, the obvious deviation exists when the wave is higher than 4.5 m.
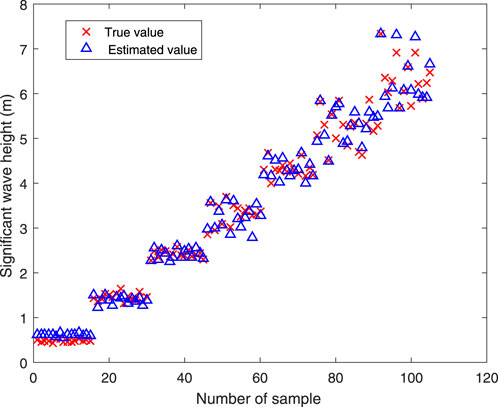
Figure 15. Estimated SWH based on the combined features under a wave direction of 40°.
The scatterplot of wave height between the truth value and SWH estimated based on combined features for the wave direction of 40° is illustrated in Figure 16. The CC approaches approximately 1, and the RMSE decreases to 0.19 m. The experimental results show that the SWH inversion method, which fuses ship motion information and X-band radar images, not only achieves high precision and small error but also offers low-cost marine environment monitoring.
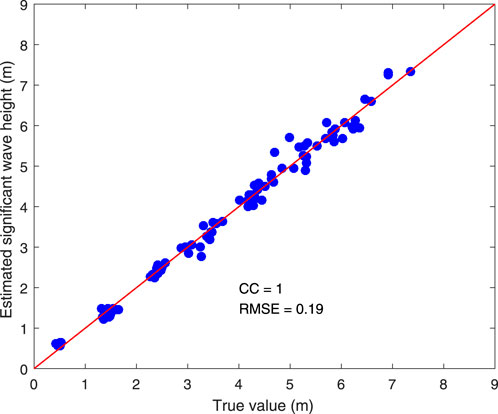
Figure 16. Scatterplot of SWH between the truth value and the estimated value under a wave direction of 40°.
Based on the simulated SMR historical data and radar images, the experimental results in different wave directions are presented in Table 4. The results of the experiments showed that the proposed fusion method using the radar images and SMR could improve the accuracy of the estimated SWH under different wave directions. However, the accuracy and performance of the fusion method still need to be verified using real data in the future.
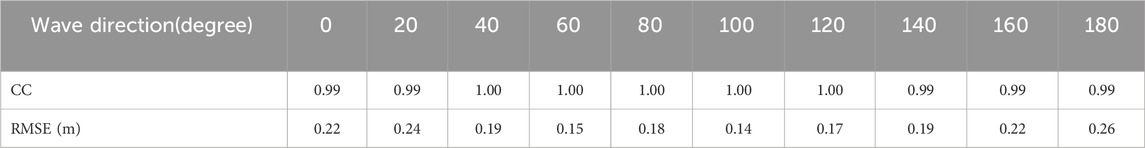
Table 4. Performance of the proposed feature fusion method under different wave directions.
4 Discussion
Although this study relies on simulation-based validation where both radar images and ship motion data were synthetically generated, this approach provides an essential proof-of-concept under controlled conditions. The ship motion data were specifically obtained from high-fidelity hydrodynamic simulations conducted using Harbin Engineering University’s digital towing tank platform, ensuring physical credibility. The core innovation of this work lies in the effective fusion of marine radar imaging and ship motion dynamics—two distinct sensing domains. We acknowledge that further validation with real-world measurements is necessary, and conducting such field experiments has been explicitly identified as a primary direction for our future research.
The selection of zero-speed conditions in this study represents a necessary simplification for initial validation, justified by both methodological and practical considerations. Since the temporal statistical features extracted from historical data for our fusion framework are inherently robust to speed variations, the core methodology remains applicable under normal sailing conditions. Although the current implementation utilizes specialized filtering to ensure physical authenticity in radar simulations at zero speed, future work will focus on integrating motion compensation algorithms to extend this approach to realistic sailing scenarios.
The fusion method for measuring SWH based on SMR and radar images has broad application prospects with the continuous advancement of technology. In this paper, the feature fusion method requires estimating the weight coefficients in different wave directions. The SWH is calculated using the derived weight coefficients and the feature vector. Although the proposed fusion method performs well for different wave directions, the wave direction should be obtained in advance. Since feature weight coefficients are different in different wave directions, the performance of the proposed method depends on the accuracy of the wave direction. To simplify the simulation of the SMR, the historical data on pitching and heaving are generated under zero-speed conditions. In the future, the effectiveness of the proposed method should be further verified under sailing conditions. In addition, more complex sea states, such as bimodal waves, should be used to test the performance of the feature fusion method.
For complex sea states, in addition to heaving and pitching, the historical data on other degrees of freedom may need to be considered to achieve optimal performance. Meanwhile, the influence of the significant value of the wave period on the estimation accuracy should also be analyzed in practice.
Currently, estimating SWH in real time requires at least 8 min of historical data based on the SMR (Majidian et al., 2022). However, the SWH could be estimated from radar images, and the time consumption can be reduced by tens of seconds. Although 20 min of SMR historical data are used to estimate SWH in this paper, real-time performance is expected to improve further when the radar images are introduced. The proposed feature fusion method, based on the statistical characteristic of SMR and features extracted from radar images can not only overcome the limitations of traditional measurement methods but also provide real-time and efficient access to sea state information.
5 Conclusion
Although this study uses specific radar and ship parameters, the proposed methodology is inherently generalizable. Based on established physics rather than empirical fitting, the framework can adapt to different ship types by integrating their respective parameters. Moreover, the reliance on shadow modulation, a mechanism that persists across low grazing angles, ensures robustness to variations in radar height. The adaptability of the method will be quantitatively validated in future studies.
In this paper, the wave statistical characteristics extracted based on the SMR are integrated into the process of conventional non-coherent radar wave measurement. To enhance the reliability and accuracy of the estimated SWH, a new multi-sensor information fusion model is established. The significant value of heaving and pitching extracted from SMR historical data and the SNR feature of the radar images are combined to calculate a more accurate wave height. The estimation results could accurately reflect the actual sea state conditions. Using the simulated radar images and SMR historical data, the CC reaches approximately 1, and RMSE is 0.14 m for the proposed multi-sensor fusion method.
Currently, SMR historical data and radar images have been used separately to estimate SWH. However, research on estimating SWH by synchronously using the SMR and radar images is rare. Since simulated SMR data are used, simulated marine radar images are also used in this paper. In practical applications, SMR and marine radar images can be synchronously collected for course ships during navigation. Thus, real SMR data and radar images could be used to verify the method in the future.
Estimating SWH based on radar images can be further investigated under low-wind speeds or rain-contaminated conditions. When the significant value of SMR is considered, the proposed fusion method is expected to improve the situation. The complex relationship between SMR and SWH can be further investigated to enhance the accuracy and adaptability of the proposed algorithm in practice. In addition, artificial intelligence technology can be used to achieve the fusion and analysis of multi-source data under low-wind speed or heavy rainfall conditions, providing more comprehensive and accurate wave information for ocean engineering and navigation safety.
Data availability statement
The raw data supporting the conclusions of this article will be made available by the authors, without undue reservation.
Author contributions
KL: Conceptualization, Formal Analysis, Writing – original draft, Methodology. YW: Validation, Investigation, Writing – review and editing. ZL: Writing – review and editing, Supervision, Data curation, Project administration, Resources.
Funding
The author(s) declare that financial support was received for the research and/or publication of this article. This work was supported in part by the Key Scientific Research Project in Colleges and Universities of Henan Province under grant no. 25B170006.
Acknowledgements
In this section, you can acknowledge any support given which is not covered by the author contribution or funding sections. This may include administrative and technical support, or donations in kind (e.g., materials used for experiments).
Conflict of interest
The authors declare that the research was conducted in the absence of any commercial or financial relationships that could be construed as a potential conflict of interest.
Generative AI statement
The author(s) declare that no Generative AI was used in the creation of this manuscript.
Any alternative text (alt text) provided alongside figures in this article has been generated by Frontiers with the support of artificial intelligence and reasonable efforts have been made to ensure accuracy, including review by the authors wherever possible. If you identify any issues, please contact us.
Publisher’s note
All claims expressed in this article are solely those of the authors and do not necessarily represent those of their affiliated organizations, or those of the publisher, the editors and the reviewers. Any product that may be evaluated in this article, or claim that may be made by its manufacturer, is not guaranteed or endorsed by the publisher.
References
An, J., Huang, W., and Gill, E. W. (2015). A self-adaptive wavelet-based algorithm for wave measurement using nautical radar. IEEE Trans. Geosci. Remote Sens. 53, 567–577. doi:10.1109/TGRS.2014.2325782
Atkinson, J., Esteves, L. S., Williams, J. J., Bell, P. S., and McCann, D. L. (2021). Nearshore monitoring with x-band radar: maximizing utility in dynamic and complex environments. J. Geophys. Res. Ocean. 126, e2020JC016841. doi:10.1029/2020JC016841
Chen, X., and Huang, W. (2022). Spatial-temporal convolutional gated recurrent unit network for significant wave height estimation from shipborne marine radar data. IEEE Trans. Geosci. Remote Sens. 60, 1–11. doi:10.1109/TGRS.2021.3074075
Chen, Z., He, Y., and Zhang, B. (2017). An automatic algorithm to retrieve wave height from x-band marine radar image sequence. IEEE Trans. Geosci. Remote Sens. 55, 5084–5092. doi:10.1109/TGRS.2017.2702192
Chen, Z., Chen, X., Zhao, C., Li, J., Huang, W., and Gill, E. W. (2019). Observation and intercomparison of wave motion and wave measurement using shore-based coherent microwave radar and hf radar. IEEE Trans. Geosci. Remote Sens. 57, 7594–7605. doi:10.1109/TGRS.2019.2914437
Cheng, X., Li, G., Han, P., Skulstad, R., Chen, S., and Zhang, H. (2022). Data-driven modeling for transferable sea state estimation between marine systems. IEEE Trans. Intelligent Transp. Syst. 23, 2561–2571. doi:10.1109/TITS.2021.3129916
Cheng, X., Wang, K., Liu, X., Yu, Q., Shi, F., Ren, Z., et al. (2023). A novel class-imbalanced ship motion data-based cross-scale model for sea state estimation. IEEE Trans. Intelligent Transp. Syst. 24, 15907–15919. doi:10.1109/TITS.2023.3315674
Cheng, X., Li, G., Skulstad, R., and Zhang, H. (2024). Safeness: a semi-supervised transfer learning approach for sea state estimation using ship motion data. IEEE Trans. Intelligent Transp. Syst. 25, 3352–3363. doi:10.1109/TITS.2023.3326281
Chuang, L. Z.-H., Wu, L.-C., Doong, D.-J., and Kao, C. C. (2008). Two-dimensional continuous wavelet transform of simulated spatial images of waves on a slowly varying topography. Ocean. Eng. 35, 1039–1051. doi:10.1016/j.oceaneng.2008.02.008
Cornejo-Bueno, L., Nieto-Borge, J. C., Alexandre, E., Hessner, K., and Salcedo-Sanz, S. (2016). Accurate estimation of significant wave height with support vector regression algorithms and marine radar images. Ocean. Eng. 114, 233–243. doi:10.1016/j.coastaleng.2016.04.007
Dankert, H., Horstmann, J., and Rosenthal, W. (2005). Wind- and wave-field measurements using marine x-band radar-image sequences. IEEE J. Ocean. Eng. 30, 534–542. doi:10.1109/JOE.2005.857524
Duan, W., and Ma, S. (2004). Stable algorithm of 2.5d theory for estimation of hydrodynamic forces on ships with forward speed. J. Ship Mech. 8, 27–34.
Gangeskar, R. (2014). An algorithm for estimation of wave height from shadowing in x-band radar sea surface images. IEEE Trans. Geosci. Remote Sens. 52, 3373–3381. doi:10.1109/TGRS.2013.2272701
Han, P., Li, G., Cheng, X., Skjong, S., and Zhang, H. (2022). An uncertainty-aware hybrid approach for sea state estimation using ship motion responses. IEEE Trans. Industrial Inf. 18, 891–900. doi:10.1109/TII.2021.3073462
Hinostroza, M. A., and Guedes Soares, C. (2016). Parametric estimation of the directional wave spectrum from ship motions. Int. J. Marit. Eng. 158, A121–A130. doi:10.5750/ijme.v158ia2.981
Hinostroza, M. A., and Guedes Soares, C. (2020). “Uncertainty analysis of parametric wave spectrum estimation from ship motions,” in Sustainable development and innovations in marine technologies. Editors P. Georgiev, and C. Soares (Varna, Bulgaria: CRC Press), 70–78.
Hochstenbach, M. E., McNinch, N., and Reichel, L. (2012). Discrete ill-posed least-squares problems with a solution norm constraint. Linear Algebra Appl. 436, 3801–3818. doi:10.1016/j.laa.2011.07.028
Huang, W., Liu, X., and Gill, E. W. (2017). Ocean wind and wave measurements using x-band marine radar: a comprehensive review. Remote Sens. 9, 1261. doi:10.3390/rs9121261
Huang, W., Yang, Z., and Chen, X. (2021). Wave height estimation from x-band nautical radar images using temporal convolutional network. IEEE J. Sel. Top. Appl. Earth Obs. Remote Sens. 14, 11395–11405. doi:10.1109/JSTARS.2021.3124969
Iseki, T., and Ohtsu, K. (2000). Bayesian estimation of directional wave spectra based on ship motions. Control Eng. Pract. 8, 215–219. doi:10.1016/S0967-0661(99)00156-2
Kim, H. S., Kang, H. Y., and Kim, M.-H. (2019). Real-time inverse estimation of ocean wave spectra from vessel-motion sensors using adaptive kalman filter. Appl. Sci. 9, 2797. doi:10.3390/app9142797
Liu, X., Huang, W., and Gill, E. W. (2017). Estimation of significant wave height from x-band marine radar images based on ensemble empirical mode decomposition. IEEE Geosci. Remote Sens. Lett. 14, 1740–1744. doi:10.1109/LGRS.2017.2733538
Ludeno, G., and Serafino, F. (2019). Estimation of the significant wave height from marine radar images without external reference. Mar. Sci. Eng. 7, 432. doi:10.3390/jmse7120432
Lund, B., Collins, C. O., Graber, H. C., Terrill, E., and Herbers, T. H. C. (2014). Marine radar ocean wave retrieval’s dependency on range and azimuth. Ocean. Dynam 64, 999–1018. doi:10.1007/s10236-014-0725-6
Lund, B., Collins, C. O., Tamura, H., and Graber, H. C. (2016). Multi-directional wave spectra from marine x-band radar. Ocean. Dynam 66, 973–988. doi:10.1007/s10236-016-0961-z
Ma, S., Song, J., and Duan, W. (2004). Comparison of 2 - 1/2d theory and n.s.m. applied for high - speed ships. J. Ship Mech. 8, 35–43.
Majidian, H., Wang, L., and Enshaei, H. (2022). Part. a: a review of the real-time sea-state estimation, using wave buoy analogy. Ocean. Eng. 266, 111684. doi:10.1016/j.oceaneng.2022.111684
Montazeri, N., Nielsen, U. D., and Jensen, J. J. (2016). Estimation of wind sea and swell using shipboard measurements-a refined parametric modelling approach. Appl. Ocean. Res. 54, 73–86. doi:10.1016/j.apor.2015.11.004
Navarro, W., Velez, J. C., Orfila, A., and Lonin, S. (2019). A shadowing mitigation approach for sea state parameters estimation using x-band remotely sensing radar data in coastal areas. IEEE Trans. Geosci. Remote Sens. 57, 6292–6310. doi:10.1109/TGRS.2019.2905104
Nielsen, U. D. (2006). Estimations of on-site directional wave spectra from measured ship responses. Mar. Struct. 19, 33–69. doi:10.1016/j.marstruc.2006.06.001
Nielsen, U. D. (2017). A concise account of techniques available for shipboard sea state estimation. Ocean. Eng. 129, 352–362. doi:10.1016/j.oceaneng.2016.11.035
Nielsen, U. D., Brodtkorb, A. H., and Sorensen, A. J. (2018). A brute-force spectral approach for wave estimation using measured vessel motions. Mar. Struct. 60, 101–121. doi:10.1016/j.marstruc.2018.03.011
Nieto-Borge, J. C., RodrÍguez, G. R., Hessner, K., and González, P. I. (2004). Inversion of marine radar images for surface wave analysis. J. Atmos. Ocean. Technol. 21, 1291–1300. doi:10.1175/1520-0426(2004)021⟨1291:IOMRIF⟩2.0
Nieto-Borge, J. C., Hessner, K., Jarabo-Amores, P., and de la Mata-Moya, D. (2008). Signal-to-noise ratio analysis to estimate ocean wave heights from X-band marine radar image time series. IET Radar Sonar Navig. 2, 35–41. doi:10.1049/iet-rsn:20070027
Pascoal, R., and Guedes Soares, C. (2009). Kalman filtering of vessel motions for ocean wave directional spectrum estimation. Ocean. Eng. 36, 477–488. doi:10.1016/j.oceaneng.2009.01.013
Pascoal, R., and Soares, C. G. (2008). Non-parametric wave spectral estimation using vessel motions. Appl. Ocean Res. 30, 46–53. doi:10.1016/j.apor.2008.03.003
Pascoal, R., Soares, C. G., and Sorensen, A. J. (2007). Ocean wave spectral estimation using vessel wave frequency motions. J. Offshore Mech. Arct. Eng. 129, 90–96. doi:10.1115/1.2426986
Pascoal, R., Perera, L., and Guedes Soares, C. (2017). Estimation of directional sea spectra from ship motions in sea trials. Ocean. Eng. 132, 126–137. doi:10.1016/j.oceaneng.2017.01.020
Plant, W. J., and Farquharson, G. (2012). Wave shadowing and modulation of microwave backscatter from the ocean. J. Geophys. Res. Ocean. 117. doi:10.1029/2012JC007912
Qin, Y., Huang, L., Wang, X., Ma, X., Duan, W., and Hao, W. (2022). Feasibility of wave measurement by using a sailing buoy and the artificial neural network technique. J. Shanghai Jiao Tong Univ. 56, 498–505. doi:10.16183/j.cnki.jsjtu.2021.094
Qiu, J., Zhang, B., Chen, Z., and He, Y. (2017). A new modulation transfer function with range and azimuth dependence for ocean wave spectra retrieval from x-band marine radar observations. IEEE Trans. Geosci. Remote Sens. 14, 1373–1377. doi:10.1109/LGRS.2017.2713438
Salcedo-Sanz, S., Nieto-Borge, J. C., Carro-Calvo, L., Cuadra, L., Hessner, K., and Alexandre, E. (2015). Significant wave height estimation using svr algorithms and shadowing information from simulated and real measured x-band radar images of the sea surface. Ocean. Eng. 101, 244–253. doi:10.1016/j.oceaneng.2015.04.041
Stredulinsky, D. C., and Thornhill, E. M. (2011). Ship motion and wave radar data fusion for shipboard wave measurement. J. Ship Res. 55, 73–85. doi:10.5957/jsr.2011.55.2.73
Sun, J., Hu, S.-L. J., and Li, H. (2025). A laplace domain method for estimating wave elevation from the transient motion responses of floating structures. J. Fluids Struct. 137, 104338. doi:10.1016/j.jfluidstructs.2025.104338
Tannuri, E., Sparano, J., Simos, A., and Da Cruz, J. (2003). Estimating directional wave spectrum based on stationary ship motion measurements. Appl. Ocean Res. 25, 243–261. doi:10.1016/j.apor.2004.01.003
Wang, G. (2020). “Modeling of ship sea-keeping motion based on response amplitude operator,” in Master’s thesis (Dalian, China: Dalian Maritime University). doi:10.26989/d.cnki.gdlhu.2020.000135
Wang, L., Mei, H., and Yi, K. (2022). Improved cyclegan-based shadow estimation for ocean wave height inversion from marine x-band radar images. Geocarto Int. 37, 14050–14064. doi:10.1080/10106049.2022.2086630
Wang, H., Li, S., Qiu, H., Lu, Z., Wei, Y., Zhu, Z., et al. (2023). Development of a fast convergence gray-level co-occurrence matrix for sea surface wind direction extraction from marine radar images. REMOTE Sens. 15, 2078. doi:10.3390/rs15082078
Wang, H., Qiu, H., Wang, L., Huang, J., and Ruan, X. (2025). Sea surface wind speed retrieval from marine radar image sequences based on glcm-derived texture features. ENTROPY 27, 877. doi:10.3390/e27080877
Wei, Y., Zheng, Y., and Lu, Z. (2020). A method for retrieving wave parameters from synthetic x-band marine radar images. IEEE Access 8, 204880–204890. doi:10.1109/ACCESS.2020.3037157
Wei, Y., Song, H., Lei, Y., Liu, K., and Lu, Z. (2023a). A method of retrieving significant wave height based on shadowing from x-band marine radar images. Int. J. Remote Sens. 44, 5259–5282. doi:10.1080/01431161.2023.2244643
Wei, Y., Wang, Y., He, C., Song, H., Lu, Z., and Wang, H. (2023b). A method of extracting the swh based on a constituted wave slope feature vector (wsfv) from x-band marine radar images. Remote Sens. 15, 5355. doi:10.3390/rs15225355
Wu, L.-C., Doong, D.-J., and Lai, J.-W. (2022). Influences of nononshore winds on significant wave height estimations using coastal x-band radar images. IEEE Trans. Geosci. Remote Sens. 60, 1–11. doi:10.1109/TGRS.2021.3077903
Yang, Z., and Huang, W. (2022). Wave height estimation from x-band radar data using variational mode decomposition. IEEE Geosci. Remote Sens. Lett. 19, 1–5. doi:10.1109/LGRS.2022.3195675
Yang, Z., and Huang, W. (2024). Swhformer: a vision transformer for significant wave height estimation from nautical radar images. IEEE Trans. Geosci. Remote Sens. 62, 1–13. doi:10.1109/TGRS.2024.3376471
Yang, Z., Huang, W., and Chen, X. (2022). Mitigation of rain effect on wave height measurement using x-band radar sensor. IEEE Sensors J. 22, 5929–5938. doi:10.1109/JSEN.2022.3149852
Zhao, C., Deng, M., Chen, Z., Ding, F., and Huang, W. (2022). Ocean wave parameters and nondirectional spectrum measurements using multifrequency hf radar. IEEE Trans. Geosci. Remote Sens. 60, 1–13. doi:10.1109/TGRS.2021.3115761
Keywords: feature fusion, marine radar images, ship motion, wave height, signal-to-noise ratio (SNR)
Citation: Liu K, Wei Y and Lu Z (2025) Estimating wave height based on feature fusion of ship motion response and X-band radar images. Front. Remote Sens. 6:1693042. doi: 10.3389/frsen.2025.1693042
Received: 26 August 2025; Accepted: 22 October 2025;
Published: 12 November 2025.
Edited by:
Tongwen Li, Sun Yat-sen University, ChinaReviewed by:
Thomas Kabel, Aarhus University, DenmarkHui Wang, Guangzhou Preschool Teachers College, China
Copyright © 2025 Liu, Wei and Lu. This is an open-access article distributed under the terms of the Creative Commons Attribution License (CC BY). The use, distribution or reproduction in other forums is permitted, provided the original author(s) and the copyright owner(s) are credited and that the original publication in this journal is cited, in accordance with accepted academic practice. No use, distribution or reproduction is permitted which does not comply with these terms.
*Correspondence: Zhizhong Lu, bHV6aGl6aG9uZ0BocmJldS5lZHUuY24=