 Madjid Hadjal
 Brian B. Barnes
 Chuanmin Hu
 Lin Qi2
 Konstantinos Topouzelis
- 1College of Marine Science, University of South Florida, St Peterburg, FL, United States
- 2NOAA Center for Satellite Applications and Research, College Park, MD, United States
- 3Department of Marine Sciences, University of the Aegean, Mytilene, Greece
Remote detection of floating matter, such as macroalgae, plastics, or other debris, primarily relies on the use of passive optical imagery that requires daytime collection and an absence of clouds, sun glint, and thick aerosols. Synthetic aperture radar (SAR) sensors are not affected by these issues, but their capacity in such detection has not been robustly characterized. As such, this study qualitatively evaluates the capacity of Capella Space X-band (9.6 GHz) SAR, which provides data at a spatial resolution of 0.35–1 m, 100 to 800 times higher than what is currently available from Sentinel-1 C-band (5.4 GHz) SAR. A controlled experiment with floating plastic targets of 1 m2, 2 m2, and 3 m2 showed that only the 3 m2 target and 1 m2 mooring buoys were clearly detected and only in a single collection mode. Some macroalgae and floating plants, such as Ulva prolifera and hyacinth, were consistently detected by Capella SAR. However, Sargassum horneri and Sargassum natans/fluitans were only partially detected by Capella SAR, with larger aggregations providing more positive detections. Surface scums of phytoplankton such as Trichodesmium or Noctiluca were not detected. The main detection limitations arise from the weak contrast between the floating matter and the surrounding water, as well as the low signal-to-noise ratios (SNRs) of the three different collection modes of Capella SAR, which range from 2 to 6 (±0.03–0.35). On the other hand, Capella SAR successfully detected floating material in Lake Skadar/Shkodra (Albania and Montenegro) and foam and potential brine shrimp cysts in the Great Salt Lake, while these targets were not detected using Sentinel-1. Despite a limited dataset of only 33 SAR images paired with concurrent and co-located optical images, these preliminary results show the value of high-resolution X-band SAR in detecting relatively large mats of plastics and certain types of macroalgae. The findings can also help task the satellites to collect targeted images for event response.
1 Introduction
Various floating objects, such as vegetation or litter, can be observed at the surface of water bodies across the globe using remote sensing data (Mifdal et al., 2021; Park et al., 2023). The nature and source of the objects vary as they originate either from the water (such as floating macroalgae) or land (such as wood, debris, or plastic). Recent trends seem to show increasing coverage of biological floating matter in response to human interactions with the environment, with examples for macroalgae such as Ulva prolifera in the Yellow Sea or Sargassum horneri from the Bohai Sea and the East China Sea (Hu et al., 2023b; Qi et al., 2023a). Similarly, Sargassum natans/fluitans, historically present in the Sargasso Sea and Gulf of Mexico (Godínez-Ortega et al., 2021), has been observed since 2011 in the northern equatorial Atlantic (Gower et al., 2013), spanning the entire basin and forming the Great Atlantic Sargassum Belt (Wang et al., 2019). These macroalgae drift under the influence of wind and surface currents and can cause economic and environmental issues when they reach the shore and degrade (Rodríguez-Martínez et al., 2019).
Other floating microalgae form surface features that can be observed through satellite remote sensing, for example, Trichodesmium (Qi et al., 2023b), cyanobacteria scums (Reinart and Kutser, 2006), and Noctiluca scintillans blooms (Al-Azri et al., 2007; Piontkovski et al., 2021). Additional floating matter has been detected, such as mucilage [also called “sea snot” (Degobbis et al., 1999; Hu et al., 2022)], pine pollen (Huet al., 2023a), and brine shrimp (Artemia) cysts (Marden et al., 2012; Qi et al., 2021). Plastic waste detection through remote sensing (Biermann et al., 2020; de Fockert et al., 2024; Topouzelis et al., 2019; 2020) is attracting increased attention, but approaches to detect these types of matter using passive imagery require additional caution (Hu, 2022). Nevertheless, marine debris caused by hurricanes (Hu et al., 2023b), floods (Song et al., 2021), or tsunamis (Qi et al., 2024) has been successfully detected using remote sensing data.
Due to the generally patchy and ephemeral nature of such floating matter, passive optical satellite datasets have historically been the main approach for detection and quantification. For floating vegetation, detection is possible using the radiance signal in the near infrared because water strongly absorbs photons at these wavelengths [∼0.2–2 m−1 from 600 nm to 900 nm (Mobley, 1995)] and most vegetation produces a “red-edge” effect which increases the reflected signal after 700 nm (Horler et al., 1983). Similarly, unique spectral features of other floating matter may be used in detection and discrimination, and global open source datasets have begun to become available for automatic extraction method development (Kikaki et al., 2022). Additionally, synthetic aperture radar (SAR) C-band sensors onboard the Sentinel-1 satellite have been used to successfully detect detritus agglomerations (Simpson et al., 2022b), offshore oil spills (de Moura et al., 2022; Marghany, 2001), floating aquaculture rafts (Gao et al., 2022b), and macroalgal blooms (Gao et al., 2022a; Shen et al., 2014), among others. SAR sensors differ from passive optical sensors in that they emit photons (at 5.405 GHz or ∼5.5 cm for Sentinel-1 C-band and 9.6 GHz or ∼3.2 cm for Capella Space X-band) that are scattered by the different materials present at the Earth’s surface. SAR can detect and characterize floating matter on the ocean surface based on differences in radar scattering behavior between the floating material and the background water, manifested as either positive (enhanced scattering) or negative (dampened surface waves) contrast features. Several scattering effects (single, volume, double bounce) occur depending on the target observed (Murata et al., 2019). In total, floating matter may manifest as positive contrasts in SAR imagery (i.e., enhanced scattering) if the floating matter emerges from the water surface, or negative contrasts if slightly submerged matter dampens surface roughness (Qi et al., 2022b).
Notably, SAR imagery can observe Earth’s surface under most conditions. In contrast, passive imagery is not available during nighttime and is negatively impacted by glint and atmospheric aerosols. The wavelengths used by SAR are largely insensitive to cloud and sun glint presence, making them a good candidate for floating object detection, especially considering that ∼67% of Earth is covered by clouds on average [for 1 km resolution sensors, (King et al., 2013)]. Therefore, SAR may be favored over optical imagery for tasks that need consistent target tracking over a short time period, such as tracking of a ship (Eldhuset, 1996; Tello et al., 2005), an ice sheet (Joughin, 2002; Mouginot et al., 2017), oil slicks (Li and Li, 2010; Shirvany et al., 2012), or marine debris after a tsunami (Arii et al., 2014). Qi et al. (2022b) performed an extensive study on the use of Sentinel-1 C-band SAR sensors to detect many of the floating seaweeds previously mentioned. For U. prolifera, they found Sentinel-1 could detect floating matter in 90% of U. prolifera detections made by the passive optical Sentinel-2 Multispectral Instrument (MSI). For S. horneri and S. natans/fluitans, presence confirmation with Sentinel-1 was substantially lower than with Sentinel-2 MSI, ranging from negligible to 20%.
The detection capability for floating material, using either passive or active sensors, is a function of (1) the spatial resolution and signal-to-noise ratio (SNR) of the sensor and (2) the degree of contrast between the floating matter and the background water, which further depends on the sub-pixel fraction of floating matter. The latter informs the detectability differences between passive optical and SAR capabilities and may also differ between SAR wavelengths, with controlled experiments showing X-band SAR is more adept at detecting floating plastic than C-band SAR (de Fockert et al., 2024; Simpson et al., 2023). It is unknown, however, if this finding applies to other materials such as macroalgae, whereby more detection might be possible using X-band over C-band. Concerning the SNR, Sentinel-1 data have an image-based SNR of ∼11 (unitless) in interferometric wide swath (IW) collection mode (Qi et al., 2022b), with a spatial resolution of approximately 10 m. Higher resolution sensors with similar SNRs could potentially improve the detection limit, such that smaller floating material aggregations could potentially be detected.
Unfortunately, there are currently very few X-band SAR satellite datasets available publicly, but proprietary high-resolution (<1 m) X-band SAR data have been collected by Capella Space, which were made available to researchers funded by the US NASA. These data come from a constellation of satellites equipped with single-polarization X-band (9.4–9.9 GHz or ∼3.2–3 cm) SAR sensors, providing data at spatial resolution ranging from 0.35 m to 1.1 m depending on the collection mode. However, SNRs for these data collected over marine targets have not yet been reported. The satellites can be tasked for data collection across the entire globe if an area of interest and its timing are justified. As such, the purpose of this study is to a) quantify the SNRs of the different collection modes of Capella Space X-band sensors for marine targets and b) evaluate their detection capabilities for different floating materials identified through concurrent and co-located passive imagery. Because of this strict requirement (i.e., image pairing between SAR and optical imagery with the latter showing floating materials) and because of the satellite’s small collection footprint, only 33 SAR and optical image pairs were available to make a qualitative assessment (see below). Nevertheless, the findings from this assessment help define what is possible/optimal in using X-band SAR for floating matter detection and may be useful toward tasking the satellites for event response in the future.
2 Data and methods
2.1 Remote sensing data
The evaluation of the capacity of Capella SAR data in detecting floating matter required paired SAR and passive optical images (co-located and temporally adjacent) from Sentinel-2 MSI (or PlanetScope Dove sensors). Additionally, the passive imagery must contain floating matter to serve as “ground truth” in the evaluation of Capella SAR. The steps in finding such image pairs followed the methodology developed initially by Qi et al., (2022b). However, due to the nature of the data sources (commercial SAR data compared to publicly accessible optical data), the small footprint of very high-resolution SAR data (5 × 5 km to 5 × 20 km), the ephemeral nature of the different floating materials, and the high cost of Capella images (approximately USD 6,000 per image), tasking SAR collection was carried out with extensive preparation. The workflow on how to obtain such image “pairs” is illustrated in Figure 1.

Figure 1. Workflow used to obtain the Capella and Sentinel-2 MSI image pairs, with both containing floating matter. The workflow is the same for the Capella and PlanetScope image pairs. FM, floating matter. FM hotspots determined from Qi et al. (2020).
Due to the above-noted limitations, only 33 paired images were successfully collected during this evaluation (excluding the images used in SNR calculations). These limited numbers do not allow the possibility of producing a quantitative analysis for X-band SAR sensors, as was previously done for C-band SAR (Qi et al., 2022), which would require several thousand paired images. Nevertheless, a quantitative analysis from these limited image pairs can still yield novel information on whether certain floating materials can be detected in high-resolution X-band SAR imagery with three different determinations: “yes,” “no,” and “maybe.”
Below, we describe the characteristics of both SAR and optical images, followed by how we searched for and found the paired SAR and optical images.
2.1.1 Capella Space X-band SAR sensors
Capella Space provides on-demand Earth imagery. Since 2018, they have launched 14 small satellites to build and maintain a constellation that can provide on-demand observation of most places on Earth within a week of a tasking request. The satellites are equipped with single-polarization mode SAR sensors, providing either HH (for horizontal emission, horizontal reception) or VV (for vertical emission, vertical reception) data. Three collection modes are available for the sensors: stripmap (SM), which provides single-look images with a 5 km × 20 km footprint and pixel spatial resolution of 1.0 m for average viewing angles (range from 25° to 50°), sliding spotlight (SS, five looks, 5 km × 10 km, 0.6 m), and spotlight (SP, nine looks, 5 km × 5 km, 0.35 m) (Capella Space, 2023, 2024). Each look corresponds to dwell time collection of ∼3 s and collection with ground range and azimuth resolutions on the order of 1–3 m. Integration of multiple looks increases the acquisition dwell time and is intended to reduce image speckle and increase spatial resolution. A single polarization and collection mode (either HH or VV) is available for each image. The incidence, squint, and azimuth angle of the center of the image are provided in image-specific metadata.
The data used in this study were geocoded terrain corrected (GEO) products using a high-resolution digital elevation model (DEM), consisting of the radiometrically calibrated range-compressed intensity values for the specific collection and polarization mode selected (Capella Space, 2023), with reported geolocation precision of less than 2 m (Farquharson et al., 2021). The images were either downloaded from the Capella archives or tasked to be collected at a specific date and location using the Capella Space portal (https://console.capellaspace.com) and the workflow described in Figure 1. The tasking window ranged from October 2023 to April 2024, and the archive provides commercial data from 2020 onward. Tasking requests for this project specified data collection over user-specified locations within a 24-h window, with no control over the collection geometry (incidence, azimuth, or squint angle) or time within the window. Due to competition with other commercial users and a limited constellation, the number of potential collections available for a specified location and date varied from 0 to 5.
The 16-bit linear intensity (DN) was converted to dB using Equation 1:
with the scale factor provided through the metadata of each file (Capella Space, 2025). Each image was visually analyzed to identify any positive and/or negative contrast features. The Lee algorithm (Lee, 1981) was also applied (using kernel windows from 3 pixels to 15 pixels) in order to reduce speckle and highlight any contrast features. For images, display thresholds were varied (minimum: −20 dB to −25 dB and maximum: −15 dB to −5 dB) to ensure no weak features were overlooked. Existing algorithms for quantification or classification of these features (Liu et al., 2019; 2023; Marghany, 2019; 2024) were not applied due to the limitations of the dataset (33 single-polarization images) and our research objectives (determining detection capabilities).
2.1.2 Visible and near infrared sensors
The two main high-resolution passive optical data sources used in this study were Sentinel-2 MSI and the PlanetScope constellation. MSI on the Sentinel-2A and -2B satellites is a spectrometer collecting photons reflected by Earth’s surface at 13 distinct wavebands from the visible to short-wave infrared (443–2,200 nm), with spatial resolutions of 10 m, 20 m, or 60 m depending on the wavelength. With data from two sensors available starting in July 2017 (and throughout this study) and a swath of ∼250 km, Sentinel-2 satellites provide a revisit time of 5 days and cover most of Earth’s land surface and coastal areas. The Sentinel-2 data were either downloaded at Level 1C from the Copernicus website1 and processed locally or directly observed using the EO Browser portal website2 (now depreciated, Sinergise Solutions d.o.o., a Planet Labs company).
The PlanetScope constellation currently consists of ∼430 satellites equipped with one of three different spectroradiometers: PS2 (hereafter referred to as “Dove,” collecting data in three visible wavebands), PS2.SD [“DoveR,” four bands including near infrared (NIR)] and PSB2.SD (“SuperDove,” eight bands). All three sensors provide a resolution of approximately 3 m at nadir for each band and a swath of ∼30 km. The constellation covers the majority of Earth’s land surface daily, including most inland waterbodies and up to several hundred kilometers of coastal waters. PlanetScope top-of-atmosphere reflectances were downloaded or visualized from the Planet portal website3.
DoveR, SuperDove, and Sentinel-2 MSI sensors have an NIR band at ∼865 nm. This band allows detection of most floating vegetation that would return an enhanced signal due to the red-edge effect (Horler et al., 1983). To detect floating material, “false” color red–blue–green images (FRGB) were created for both MSI and PlanetScope sensors, using the 865 nm band as the green channel, the ∼490 nm band as the blue channel, and the ∼660 nm band as the red channel. Similarly, enhanced RGB images (ERGB) were generated using the NIR band for the red channel and the ∼555 nm band for the green channel. The normalized difference water index algorithm [NDWI; Gao (1996)] and the normalized difference vegetation index [NDVI; Rouse et al. (1974)] were also applied to some Sentinel-2 images. The NDWI uses the ratio of the difference between the NIR band (842 nm) and green band (560 nm) and their sum, which allows accurate detection of floating macroalgae. The NDVI replaces the green band with a red band (665 nm). For Dove FRGB or Sentinel-2 pixel extraction, the reflectance used for image creation was the Rayleigh corrected reflectance, processed using the Acolite4 software (Vanhellmont and Ruddick, 2016). For Dove RGB and non-NDWI Sentinel-2 images shown, the reflectance was at the top of the atmosphere (Level 1C). For Sentinel-2 NDWI, the reflectance was at the bottom of the atmosphere (Level 2A), after application of a Sen2Cor atmospheric correction following the European Space Agency (ESA) methodology (Main-Knorn et al., 2017). In the following figures, floating matter is displayed using SAR and passive optical composite images (e.g., NDVI, NDWI, ERGB, FRGB, or true-color RGB), with images individually scaled and/or sharpened to highlight the features of interest. Regardless of the optical image algorithm shown, our approach was to use passive imagery to highlight the presence/absence of a floating material rather than to quantify the density of the aggregations.
2.2 Generating paired optical/SAR images
Great effort was undertaken to ensure that the tasked SAR imagery targeted floating material and could be paired with high-resolution passive optical data, mostly from Sentinel-2 MSI (Figure 1). Toward this end, data visualization browsers for numerous publicly available satellite datasets (e.g., the ESA EO Browser, the National Aeronautics and Space Administration (NASA) worldview5, and the National Oceanic and Atmospheric Administration (NOAA) ocean color view, OCView6) were used to identify optimal locations and times for Capella SAR tasking using previously monitored locations described by Qi et al. (2020). From these browsers, data from Sentinel-1 C-band SAR, Sentinel-2 MSI, Sentinel-3 OLCI (Ocean and Land Colour Instrument), Landsat-8 and -9 OLI (Operational Land Imager), PlanetScope Dove, and MODIS (Moderate Resolution Imaging Spectroradiometer) were visualized to verify material presence prior to making an active Capella collection. Features detected using passive optical data were identified/classified using all available spectral bands in combination with published/news reports of a particular floating matter presence.
Not enough Capella SAR data were available to evaluate all collection possibilities (e.g., polarization, viewing angle, and collection mode) over each of the different floating matter targets. As such, a quantitative evaluation of the different floating matter detections could not be produced, and most of the paired images come as a single SAR image available over a known target. Therefore, this study provides a qualitative rather than a quantitative assessment of SAR X-band capabilities from this data source. Due to the different nature of the targets (plastic, vegetation, and particles), the detections were not automated (Eldhuset, 1996; Solberg et al., 1999; Wackerman et al., 2001) but based on visual inspections using the passive imagery and a short temporal window. If a positive detection was made by SAR in a reasonable temporal window, it follows that the material can be detected at least in similar conditions (viewing angle, mode, and resolution). If a negative detection was made by SAR (within a relatively short temporal window, that is, minutes to hours), we inferred that SAR cannot detect said material, at least in this polarization mode and under similar conditions.
In summary, floating matter representing four different categories was included in the analysis: floating plastic targets from a controlled experiment, floating plants/macroalgae, phytoplankton scums, and other materials. The plants/macroalgae evaluation included U. prolifera from the China Marginal Sea (Hu et al., 2010), Eichhornia spp. (water hyacinth) from Vembanad Lake in India (Retnamma et al., 2023; Simpson et al., 2022a), S. natans/fluitans in the tropical-equatorial Atlantic (Gower et al., 2013), and S. horneri in the Yellow Sea (Xing et al., 2017). Phytoplankton observations consisted of Trichodesmium scums from the Australian coast (Qi et al., 2023b) and green N. scintillans in the Gulf of Oman (Piontkovski et al., 2021). Other targets included unidentified floating material from Lake Skadar/Shkodra between Albania and Montenegro (Pešić et al., 2018), brine shrimp cysts (Artemia franciscana) in the Great Salt Lake (Qi et al., 2021), and potential foam in the same area.
2.3 Signal-to-noise ratio and signal-to-clutter ratio
This study merges both SAR and optical observations, and different approaches to quantify SNR are preferred by the respective communities. The traditional SAR metric of noise equivalent sigma zero (NESZ; expressed in dB), which includes the thermal, digital conversion, and processing, has been reported by Capella for the various collection modes and look angles (Capella Space, 2020). For this research, we focus on the image-based formulation of SNR (Equation 2) commonly employed in optical analyses, enabling comparison with previous floating matter detection studies using Sentinel-1 SAR (Qi et al., 2022b) and optical datasets (Fiete and Tantalo, 2001). Specifically, for each of the 44 Capella images available for SNR calculation, a polygon was manually drawn over a homogeneous water-only area. For each pixel inside the polygon, the mean value of a moving box surrounding each pixel was divided by the standard deviation of the same box, with the result yielding the SNR. Different sizes of the box (i.e., the kernel size) were tested to account for potential interpolation issues. The SNR calculation was conducted on approximately 106 pixels for stripmap images and up to 107 pixels for spotlight images due to the spatial resolution difference, which provides a robust SNR assessment even if some pixels can contain small image artifacts or features (e.g., boats, buoys). In this study, SNR was calculated as defined in Equation 2:
with
To describe target detection capabilities for the various floating materials, we also calculated the signal-to-clutter ratio (SCR) (Osmanoglu et al., 2023), defined as the power signal of a target divided by the power signal of the surrounding water defined in Equation 3:
where S is the mean backscattered intensity over the target and C is the mean backscattered intensity of the surrounding water (the Clutter, which does not include the target). For each image where a target was visible, the area of elevated backscatter intensity associated with the target was selected as the Signal (500–20,000 pixels, depending on its size), excluding the edges of the target that could be mixed with water. Similarly, an area composed only of water surrounding this target was selected as Clutter (∼10,000–100,000 pixels, always larger than the target’s size), excluding the area directly surrounding the target to avoid mixed pixels. Both Signal and Clutter are relatively close on each image and should have the same viewing angles. A larger SCR value means that the target can be detected more easily.
2.4 Plastic Litter Project experiment
Three artificial plastic targets were deployed in November 2023 in the nearshore region of Lesvos Island, Greece, as part of the Plastic Litter Project (PLP) (Papageorgiou et al., 2022). The three targets consisted of square frames made from PVC tubing, with a white HDPE tarpaulin fastened to them, each with a surface area of exactly 1 m2, 2 m2, or 3 m2. Small white boat fenders were used at the underside corners of the 2 m2 and 3 m2 targets to improve the buoyancy of the tarpaulin. Each target was attached with two ∼20 m lines to two 1 m2 buoys that reached up to 90–160 cm (including spires) above the water surface. The buoys were tethered to solid concrete block anchors (assumed to be immovable) using 8 m heavy chain and ∼8 m heavy rope, at a water depth of 12 m. Due to the heavy rigging and the relatively short line length in proportion to water depth, the maximum lateral movement of the buoys was estimated to be 3 m.
2.5 Wind speed
The wind speed plays a crucial role when observing floating materials from both optical (Laval et al., 2025) and SAR platforms. Particularly, higher winds may submerge floating materials, and the overlying water strongly absorbs light in the detection wavebands (i.e., X-band and NIR), reducing the signal reflected by the floating material. In this study, the locations of the various images vary greatly; therefore, a global wind speed product was required. As such, we acquired data from the Level 4 Cross-Calibrated Multi-Platform (CCMP7) product, which provides global coverage of wind speed at 10 m above the surface every 6 h with a resolution of 0.25 × 0.25°. The CCMP pixel closest in time and space to each SAR image center was used. For each image, the wind speed is reported as W, expressed in m s–1. For images collected over lakes and bays, if a nearby weather station was available, its values were reported rather than the CCMP product. Most weather stations report the wind measured at 10 m above the surface and provide an hourly average speed and direction.
3 Results
3.1 SNR evaluation of Capella sensors
Figure 2 displays an example of a Capella SAR image, including the polygon area (outlined in red) within which the SNR was calculated. The distribution of the Capella SAR SNRs is reported in Figure 2B, with both median and peak values. Different kernel size values (3 × 3 pixels, 5 × 5 pixels, 7 × 7 pixels, and 9 × 9 pixels) were tested over the 44 images available for the SNR calculation because the spatial resolution differs across the three collection modes (SP, SS, and SM). Both the peak and median values averaged over all 44 images are reported in Table 1. The results show a greater effect of the kernel size on the median value than on the peak, with minor SNR differences for kernels ≥5 × 5 pixels. Additionally, kernels ≥5 × 5 pixels produced more consistent (lower std) SNRs than the 3 × 3 kernel.

Figure 2. (A) Example Capella SAR X-band image collected using the spotlight mode and VV polarization south of Tobago [11.1336°N, 60.7822°W] on 29/02/2024 at 21:56 UTC. The SNR was calculated using a 3 × 3 kernel for pixels within the red area shown in Panel (A) (∼2 km2). The small bright object indicated by the red arrow is the overturned “Gulfstream” vessel that was actively leaking oil during the time of the SAR data collection. This oil spill was not detected in this SAR image. The SCR for the vessel was 6.42 dB. (B) Histogram of the red polygon area from (A).

Table 1. SNR median values of the different collection modes for Capella X-band SAR images collected over homogeneous ocean surfaces, using different kernel sizes. The resolution reported is for optimal conditions of each collection mode. The NESZ reported is from Capella Space (2020).
Among the 44 images of sufficient quality for the SNR evaluation, 26 were collected in VV and 18 in HH. Unfortunately, this dataset included very few examples of “extremes” in either wind speed (e.g., only two images with wind speed >8 m s−1) or incidence angle (four images with angle <20° and 0 with angle >55°). This unbalanced dataset prevented rigorous interpretation of these extremes (for which reduced SNRs would be expected) within the ANOVA. Nevertheless, we partitioned wind speed into two groups, separated according to a 5 m s−1 threshold, while incidence angle was separated into three categories (I < 30°, 30° ≤ I ≤ 40°, and I > 40°). These thresholds were selected to reflect the “optimal” incidence angle at approximately 30° for dampening ratios (Meng et al., 2024) and to maximize balance in the groupings. Furthermore, due to limited representation in our dataset, Capella sensors C3 (N = 1), C6 (N = 2), and C11 (N = 2) were grouped together within the ANOVA.
Overall, our analyses revealed no significant differences in 5 × 5 median SNRs based on the polarization mode (HH or VV; p = 0.25), sensor (p = 0.31), or wind speed (p = 0.78). The incidence angle showed a significant impact on SNR (F = 4.3, p = 0.02), with pairwise comparisons indicating slightly reduced SNRs for low (I < 30°) compared to high (I > 40°) incidence. However, collection mode showed the strongest impact on SNR (F = 1,228; p = 2 × 10⁻³²). Due to the nearly singular importance of this parameter, Table 1 reports summary values from all images partitioned according only to collection mode. Briefly, the SNRs for Capella SAR X-band sensors over the ocean were approximately 6, 4, and 2 for the SP, SS, and SM collection modes, respectively, with standard deviation values ranging from 0 to 0.38. The NESZ values reported by Capella Space (2020) are included in Table 1 for reference and are known to depend on the incidence angles. The metrics for all images analyzed are available in Supplementary Table S1.
3.2 Evaluation of floating material detection
In the following, for each floating matter target except the PLP experiment, at least one Sentinel-2, PlanetScope, or Landsat-8/9 image with observed presence of floating material is shown, and the evaluation consists of the capacity of Capella SAR data in observing the same object within a reasonable temporal window. Table 2 lists the different targets assessed and the detection capabilities of the SAR sensors. The passive imagery available for comparison is listed, along with the time difference in data collection between the passive optical and SAR sources. Among the 64 total Capella SAR images available, 33 were collected at locations and times where floating material was likely present.

Table 2. List of floating materials observed during this study. “Positive” means detection by Capella SAR, and “Negative” means no detection by Capella SAR.
3.2.1 Controlled plastic targets experiment
All three Capella collection modes at both polarizations (HH and VV) were tasked over the PLP location in November 2023. Figure 3 shows the six images collected by various Capella sensors (Figures 3A–F). The 3 m2 target and all six buoys were observed by the SP HH image (Figure 3A). While some buoys were also potentially observed in other images (Figures 3B–D), none of the three targets were detected for the other configurations. The wind speed was collected at a nearby weather station (9 km northwest of the experiment), which ranged from low (2 m s−1) to relatively high values (>10 m s−1), especially on 11 November 2023, during the SS experiment (Figures 3C,D). This experiment only returned partial detections of buoys: #1 and #9 for HH polarization and #3 and #7 for VV. Regardless of the shape of the observed object, all SAR detections manifested elongated features (smear effect, bottom row of Figure 3) in the azimuth direction, likely due to radial motion during the collection. Additionally, all buoys and the target detected were roughly 10–30 pixels in size. For context, at 0.35 m resolution, a 1 m2 target corresponds to 9 pixels, while a 3 m2 target would be roughly 25 pixels. There were no detections possible from Sentinel-2 imagery, likely due to the small size of the buoys and targets. PlanetScope SuperDove data, with a pixel resolution of 3 m2, potentially observed the 3 m2 target for 3 of 5 clear images available during the 2-week experiment duration (data not shown), where a single pixel showed a noticeably white signal at the approximate location of the 3 m2 target. The SCRs of the different targets visible in panel A and displayed in the bottom row are annotated.
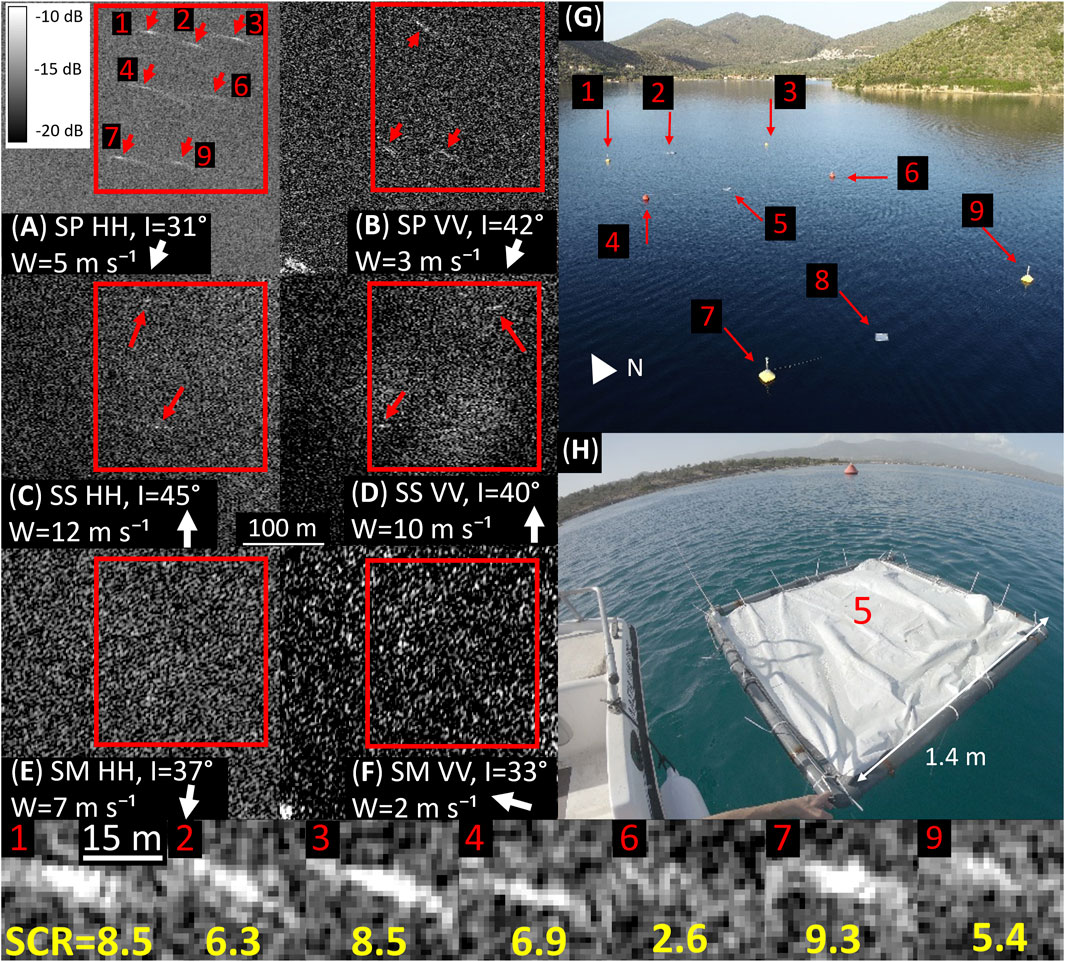
Figure 3. Floating target experiment in Lesvos, Greece [∼39.0392°N, 26.5245°E]. (A–F) SAR imagery in three collection modes (SP, SS, and SM) and both polarization methods (HH and VV, reported in the panels). Images were collected in 2023 on November 9 (for SP), 11 (for SS), and 16 and 17 (for SM HH and VV, respectively). (G) Photo of the experiment: the 3 m2 target is in the northern part of the scene (annotated as #2 in G), the 2 m2 is in the middle (#5 in G), and the 1 m2 is in the southern part (#8 in G). The 2 m2 target is also displayed on (H). Only the 3 m2 target and the buoys were unambiguously detected by Capella SAR imagery and only in SP HH mode. The bottom row shows enlargements of the detections in the SP HH image (A) at the same zoom level, while the SCRs of the different targets (in dB) are annotated in yellow.
3.2.2 Floating plants and macroalgae
3.2.2.1 Ulva prolifera
Different species of seaweed are present at the surface of the ocean and can be detected through remote sensing. U. prolifera is a green macroalgae that is originally attached to the benthos and can turn into a floating macroalgae under certain conditions (Hu and He, 2008). U. prolifera was initially detected remotely in 1999 in the western Yellow Sea (Hu et al., 2023a), and the first outbreak was observed during the 2008 summer near the city of Qingdao, China (Hu et al., 2010). These algae form mats or rafts that can float at the surface of the water due to their gas vesicles. The mats show increased backscattered signals in the green and NIR wavelengths, which make them easily identifiable using passive optical imagery. We collected three paired SAR/passive optical images for U. prolifera, with all three showing floating material clearly present in the SAR data. For example, one pair of images for Sentinel-2 and Capella Space SAR sensors was generated for the 25th of June 2022 near Qingdao Naval Base (∼35.7°N, 120°E, Figure 4). NDWI data are shown for Sentinel-2 imagery (Figure 4A), with green features highlighting vegetation on land and U. prolifera in water. The algae moved toward the harbor over the next 10 h, at which point the slicks can be clearly identified in the SAR imagery (Figure 4B). The SCR calculated over a dense patch of U. prolifera (indicated by the yellow circle) was ∼10.92 dB.

Figure 4. Qingdao Naval Base [∼35.7050°N, 119.9777°E] on 25/06/2022, where a bloom of nearshore Ulva prolifera is identified as green patches in (A) Sentinel-2 NDWI image (02:58 UTC), while (B) Capella SAR SS VV (12:35 UTC) shows clear positive contrast features. In the 10 intervening hours, some of the floating algae moved into the harbor area (inside the breakwaters).
3.2.2.2 Hyacinth
Water hyacinths (Eichhornia crassipes and Monochoria vaginalis) are aquatic freshwater plants that possess aerenchyma, which allows them to float at the surface of the water. Native to the Amazon basin, they are present across sub-tropical regions (Havel et al., 2015). In non-native regions, they form large mats and are considered invasive species that cause socio-economic damage (Retnamma et al., 2023; Villamagna and Murphy, 2010). Detecting them remotely is possible using passive optical imagery (Thamaga and Dube, 2018). Figure 5 shows successful detections of hyacinth by a Capella Space SAR X-band sensor on the 27th of October 2023, in Vembanad Lake, India (∼9.7°N, 76.4°E, Figure 5A). They were also observed 3 days later using Sentinel-2 FRGB in the same lake (Figure 5B). The Sentinel-2 image seems to be able to detect higher coverage over the entire image, but without a direct matchup between both images, it is difficult to estimate what percentage can be detected using SAR imagery for this type of floating plant.

Figure 5. Hyacinth in Vembanad Lake, India [∼9.7004°N–76.3824°E]. (A) Capella SS HH (27/10/2023, 04:40 UTC). (B) Sentinel-2 FRGB 3 days later (30/10/2023, 05:26 UTC), which still shows the presence of hyacinth at similar locations.
3.2.2.3 Sargassum natans/fluitans
Sargassum natans/fluitans have long been observed in the Sargasso Sea and Gulf of Mexico (Parr, 1939) and have more recently established a standing population in the tropical northern Atlantic area [5°S to 40°N (Wang et al., 2019)]. Previous research shows that their presence/absence and fractional surface coverage can be quantified using passive optical satellites (Wang and Hu, 2016). For Sentinel-2, the detection limit is ∼2% of a pixel (Qi and Hu, 2021), meaning that a pixel covered by at least 2 m2 of S. natans/fluitans can be discriminated from the background using Sentinel-2 data. S. natans/fluitans are aggregated and dispersed by wind and surface currents (Putman et al., 2020). In Figure 6, large S. natans/fluitans aggregations are visible, with a 5-km-long raft in the northern part (red rectangle in Figures 6A,C) visible using Sentinel-2 (Rouse et al., 1974). The surface area covered by the largest aggregation in the center of Figure 6A (inside the yellow circle, zoomed as insets of Figures 6A,C) is ∼5 km2. The width of the long raft inside the red rectangle displayed in Figures 6B,D reaches up to 90 m. Many smaller S. natans/fluitans rafts were detected throughout the Sentinel-2 image. The optical image is affected by glint, which allows observation of swell (inset in Figure 6A) and shear currents (Figure 6, darker surface line features), which appear to aggregate Sargassum.

Figure 6. Sargassum natans/fluitans near Cayman Islands [∼19.2165°N, 81.3201°W] on 04 October 2023. (A) Sentinel-2 NDVI collected at 16:08 UTC with (B) a zoom on the red rectangle area. (C) Capella SM HH collected at 14:44 UTC with (D) a zoom on the red rectangle area. Two almost linear Sargassum distributions are clearly identified using passive imagery in (B), but only minor areas of the larger rafts can be detected by SAR. (E–H) Zoomed version of the observed mats in (D). SAR was only capable of partial detections within the red square, with no detections for the red circled area. The SCR calculated for the largest SAR-detected Sargassum raft (yellow circle) was ∼5.11 dB.
Capella X-band data (Figures 6C–H) show positive contrast features for only some of the S. natans/fluitans patches identified in the MSI data. In Figures 6E–H, several of the positive detections from both SAR and passive imagery within the red rectangle are enlarged. However, many other MSI-based detections of S. natans/fluitans (particularly those inside the yellow circle, Figure 6B) were not identified in the SAR data (Figure 6D). Notably, both the SAR and optical data show a negative contrast feature inside the red circle, likely corresponding to an aggregation zone (Klemas, 2012) or dampened surface waves (Qi et al., 2022b). Among the 24 SAR images tasked over S. natans/fluitans, we estimate that 11 likely contained floating material in the field of view. Of these, six showed at least partial detection of the S. natans/fluitans, while five did not show any unambiguous floating matter features. Due to the small footprint of the SAR sensor coupled to the drifting of the material, 13 collections likely missed the material. Even for positive detections, only partial areas of the images returned positive SAR detections (as in Figure 6).
3.2.2.4 Sargassum horneri
Sargassum horneri is a floating species of macroalgae, present in the East China Sea region and near Japan (Yendo, 1907). Patches can usually be observed in the area from February to August, with the first observations identified from remote sensing in 2000 and the first large-scale outbreak occurring in 2015 (Qi et al., 2022a). Sentinel-3 OLCI imagery on 25 April 2024 showed the widespread presence of massive S. horneri patches across the East China Sea. A very close temporal matchup (4 min apart) between Sentinel-2 and a Capella SAR sensor was achieved on 27 April 2024 (Figure 7). The boat on the right side of the image moved by ∼1 km during the 4 min that separate both images and crossed just east of an S. horneri patch (displayed as pink on the ERGB image, Figure 7B). Additional S. horneri patches were present across the scene (Figure 7A), yet only the two larger slicks in the center of the image (200 m × 100 m for the large one) can be noticed in the Capella image (yellow circle). Otherwise, no discernible features were detected in the SAR data (Figures 7C,D) which correspond to the S. horneri patches observed in the MSI data (Figures 7A,B). The ship wake is absent from the SAR imagery (Figure 7D) despite the ship being large (approximately 160 m × 30 m) and moving ∼3.3 m s–1, creating a large disturbance clearly visible from passive imagery (Figure 7B).

Figure 7. Sargassum horneri observed between the Yellow Sea and East China Sea [∼34.6°N, 122.4°E] on 27/04/2024 by (A) Sentinel-2 NDWI data collected at 02:48 UTC and (B) ERGB image for the red square area, showing S. horneri in pink. (C) Capella SM VV collected at 02:44 UTC with (D) a zoom on the red square area where the large S. horneri patch was not detected. A large Sargassum raft (yellow circle) is present in the image but was barely observed by SAR imagery. The “ghost” effect on the right of the ship in D is likely due to the ship’s presence. The SCRs are 2.09 dB for the large S. horneri raft and 15.53 dB for the large ship.
3.2.3 Phytoplankton: surface scums of Trichodesmium, green Noctiluca, and freshwater cyanobacteria scums
Some phytoplankton species can aggregate and form slicks due to their buoyancy. Trichodesmium spp. are cyanobacteria that contain gas vesicles that enable them to float at the surface of the water and migrate vertically due to their ballast capabilities (Villareal and Carpenter, 1990). Trichodesmium with gas vesicles can float on the ocean surface as scum and can be visible to passive optical imagery (Capone et al., 1997). They are primarily observed in situ in tropical areas and were recently characterized remotely in Australian coastal waters (Qi et al., 2023b). For the current assessment, several images were collected from the northern coast of Australia. The triangle-shaped island visible from Figure 8 is Eaglehawk Island, west of the city of Karratha (∼20.66°S, 116.44°E). Almost the entire area is covered by Trichodesmium mats visible from Sentinel-2 FRGB imagery collected on 11 October 2023. One day later, SuperDove data collected over a portion of the same area showed persistence of the bloom (Figure 8B). Capella SAR data tasked for this region (Figure 8C; rectangle polygon in Figures 8A,B) 7 h later showed no surface features consistent with the Trichodesmium surface slicks. Three additional images were tasked over areas with persistent Trichodesmium blooms. Although no floating matter was detected in these SAR data, optical imagery indicated that the Trichodesmium was likely no longer present by the time of the SAR observations.
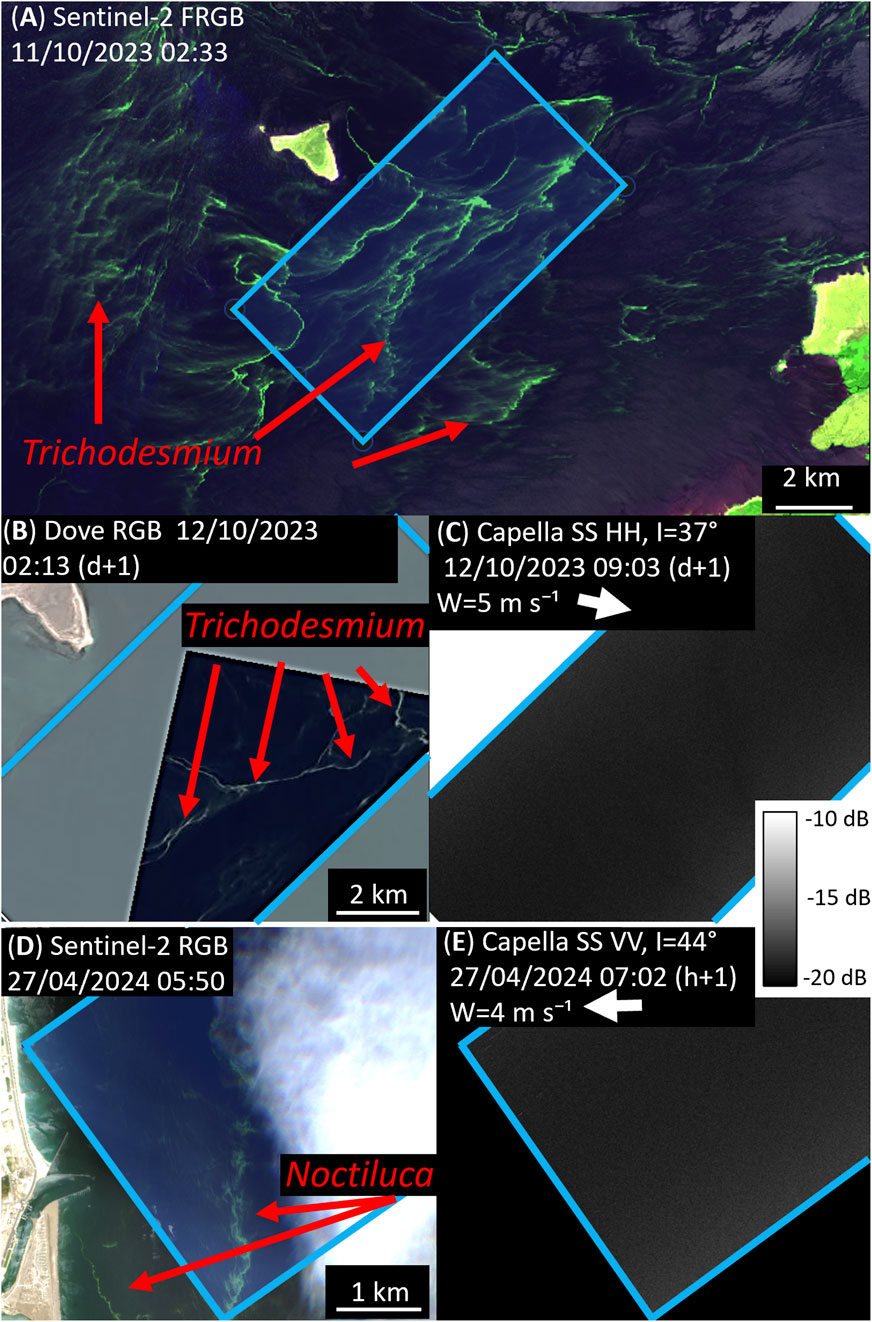
Figure 8. Trichodesmium observed near the city of Karratha, Australia [∼20.66°S, 116.44°E, (A–C)] on 11/10/2023 by (A) Sentinel-2 FRGB (02:33 UTC), a day later by (B) Planet SuperDove L1C RGB (02:13 UTC), and (C) Capella SS HH (09:03 UTC). Green Noctiluca scintillans (dinoflagellates) observed offshore Kalba, UAE [∼25.05°N, 56.36°E, (D) and (E)] on 27/04/2024 by (D) Sentinel-2 FRGB (05:50 UTC) and (E) Capella SS VV (07:02 UTC). Neither Trichodesmium nor Noctiluca was detected by SAR in these examples [(C) and (E), respectively]. (B) image © 2024 Planet Labs PBC.
Noctiluca scintillans is a species of dinoflagellate with large cells (200–600 µm) that has high buoyancy and floats at the surface of the ocean, which can manifest as either red or green tides (Harrison et al., 2011). Green N. scintillans forms large surface aggregations over most of the Gulf of Oman and Arabian Sea and is now commonly found in the area in winter due to hypoxic conditions (do Rosário Gomes et al., 2014). Noctiluca aggregations were observed with Sentinel-2 RGB imagery on the 27th of April 2024, displayed in Figure 8D. A Capella scene was tasked and collected over the area during the same day, 72 min later (Figure 8E), but showed no surface features.
Rio Tocantins (northern Brazil, ∼4.2°S, 49.6°W) contains an artificial freshwater lake created through the construction of the Tucuruí dam in 1980–1984. Increased phytoplankton blooms have been observed in the lake since the 2000s (Guimarães et al., 2020), dominated by Synechococcus (Baraúna et al., 2012), as well as in the river (Menezes et al., 2015). This lake displayed a massive outbreak of surface algal aggregations during the first half of April 2024, manifesting as long, thin slicks clearly visible in multiple satellite images (Figure 9). Capella SAR imagery was tasked (Figure 9A) for the 19th of April, with three collocated observations available from Sentinel-2 (Figure 9B), Planet Scope (Figure 9C), and Landsat-9 (Figure 9D) during the same day. The images were all collected within a span of 30 min. No floating matter signal was observed from Capella SAR imagery (Figure 9A) as the only visible features are land. In Figures 8, 9, neither phytoplankton shows either a positive or negative contrast feature.

Figure 9. Cyanobacteria (potentially Synechococcus) observed in Rio Tocantins, Brazil [∼4.2°S, 49.6°W] on 19/04/2024 by (A) Capella SM VV (13:24 UTC), (B) Sentinel-2 RGB (13:43), (C) Planet SuperDove L1C RGB (13:50 UTC), and (D) Landsat-9 RGB (13:29 UTC). Despite cyanobacteria being visible to multiple optical sensors within a 30-min timeframe, no signal is observed in the Capella SAR imagery. The red polygon in the SAR image (A) shows the bounds of the Sentinel-2 and Planet images (B and C, respectively). Similarly, the yellow polygon in A shows the bounds of the Landsat data (D), while the SAR bounds are indicated in red for (B) and (C). (C) image © 2024 Planet Labs PBC.
3.2.4 Other targets
3.2.4.1 Brine shrimp cysts
In the Great Salt Lake (∼40.7°N, 112.3°W), brine shrimp (A. franciscana) lay eggs [called cysts, with a diameter of 200–300 μm (Wu et al., 2022)] that float and aggregate at the surface of the lake. Brine shrimp are found in salty waters (Litvinenko et al., 2007), and the Great Salt Lake is a major commercial source (Belovsky and Perschon, 2019). They form streaks of several kilometers long and a few meters wide that can be observed using high-resolution passive imagery (Qi et al., 2021). Their associated reflectance signal is higher for red wavebands (600–750 nm), such that they can be easily differentiated from surrounding waters when the eggs float at the surface (Qi and Hu, 2021). Figure 10 shows an example of a matchup between SAR and passive imagery. The cysts can be barely detected by Capella SP VV imagery but are easily identified from Planet FRGB imagery (green slicks from Figure 10B, ∼8 h later). Using images collected by Planet earlier and on previous days, the cysts moved westward during the hours prior (Figure 10B), and the location where the signal was being detected by SAR imagery could match an 8-h slow drift westward. Two additional SAR collections tasked missed the material by ∼5 km.

Figure 10. Southern part of the Great Salt Lake, Utah [∼40.7097°N, 112.3754°W] observed on 29/03/2024 by (A) Capella SP VV collected at 10:58 UTC and (B) Planet SuperDove FRGB collected at 18:23 UTC. Brine shrimp cysts are easily identifiable from PlanetScope images but can barely be noticed in the Capella SAR data. (B) image © 2024 Planet Labs PBC.
3.2.4.2 Potential foam
In the northern part of the Great Salt Lake, foam is often detected in satellite imagery. Foam is produced by the interaction of water and turbulence, mostly induced by wind, and can be found in coastal regions and over salty lakes. Foam is present when the rate at which the bubbles are formed due to the presence of other material (for example, salt) is higher than the rate at which they dissipate (Napolitano and Cicerone, 1999). A Capella SAR image collected on 12 March 2024 indicated widespread features consistent with foam (Figure 11A). Due to persistent clouds in the region, however, a direct matchup with PlanetScope passive optical imagery was not possible until 10 days later (Figure 11B). Nevertheless, foam was identified in the SuperDove image on 22 March 2024 and in images collected on many subsequent days. Notably, such surface features have not been observed in this region by Sentinel-1 VV or VH modes since the sensor’s launch in 2014 (568 images).
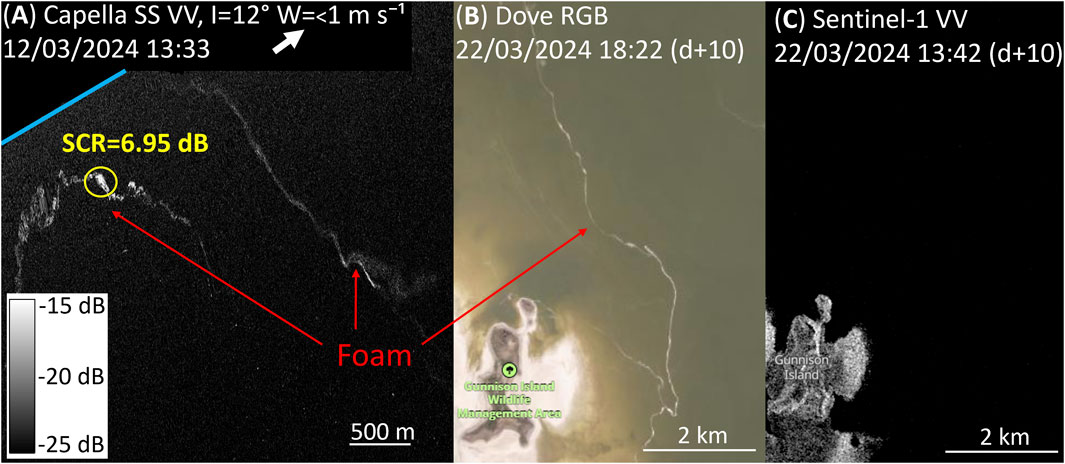
Figure 11. Northern part of the Great Salt Lake [∼41.2566°N, 112.8092°W] foam observed by (A) Capella SS VV (12/03/2024, 13:33 UTC). Images from 22/03/2024 for (B) Planet SuperDove RGB (18:22 UTC) and (C) Sentinel-1 SAR C-band VV (13:42 UTC) slightly north of the area, where foam was detected by Planet imagery. Capella SAR X-band SS VV (A) successfully detected foam for this image, but no passive observation was available due to cloud cover on that day. SAR sensors of Sentinel-1 (C) did not detect a similar signal at any given time over the area (10-year span). (B) image © 2024 Planet Labs PBC.
Two other Capella SAR/SuperDove pairs over the Salton Sea Lake and in the southern part of the Great Salt Lake were also collected (not shown). Notably, while thin (1–2 pixels wide, that is, 3–6 m large) foam features were observed in the optical imagery, these slicks were not detected in SAR. Similarly, with all images observed through this study, mostly in coastal waters and over lakes, the presence of boat wakes was not observed directly using SAR X-band, regardless of the collection mode, while they were consistently detected in optical imagery. This highlights that the bubbles produced by boats, or foam, may not be detected by radars at such frequencies and resolutions.
3.2.4.3 Floating matter in Lake Skadar/Shkodra
Additional unidentified floating matter was noted in the southern part of the Albania–Montenegro Lake Skadar/Shkodra [∼42°N, 19.4°E], as shown in Figure 12. Images were collected on 18 February 2021 using Capella SM HH mode (Figure 12A), conjointly with Planet Scope Dove PS2 (Figure 12B) and Sentinel-1 SAR (Figure 12C). All sensors showed positive signals at similar locations. Visualizing the floating target using a true-color RGB composite (not shown) showed a brown/dark hue, which could indicate vegetation. Notably, several features present in the Sentinel-1 image (Figure 12C) had no match with other imaging methods and thus likely represent noise or other artifacts in the Sentinel-1 data.

Figure 12. Lake Skadar/Shkodra, Albania–Montenegro [∼42.0800°N, 19.3337°E], on 18/02/2021 as observed by (A) Capella SM VV (06:45 UTC), (B) PlanetScope DoveR FRGB (09:12 UTC), and (C) Sentinel-1 VV (16:32 UTC). The Capella footprint is shown as the blue polygon in (C). Spectral analysis of the floating material patches (not shown) shows characteristics of floating vegetation. Sentinel-1 features match those observed by both Capella and Planet sensors, but several other features (yellow arrows) can be observed in areas of the image where no floating matter was detected using Planet or Capella imagery. (B) image © 2024 Planet Labs PBC.
Although features are clearly visible in the PlanetScope image from 18 February (Figure 12B), the Dove sensor has insufficient wavebands for target identification using the reflectance spectrum. However, similar slicks in the same region were observed in a Sentinel-2 image on the 15th and in each cloud-free Sentinel-2 image collected over the preceding 2 months. The identified slicks showed features composed of floating vegetation with a strong red-edge effect from 700 nm and smaller values observed near 667 nm, characteristic of the absorption by chlorophyll a pigments (Bricaud et al., 1995). Lake Skadar/Shkodra is known for its vegetation diversity (Hadžiablahović, 2018), with many floating seaweeds visible in the area. It is not possible to identify species using the passive optical data without a distinct spectral signature, but based on previous reports, it is likely that the unidentified target observed in Figure 12 was the free-floating macrophyte Lemna minor (Kastratović et al., 2015), Nymphaea alba (water lilies), or Nuphar luteum (Pešić et al., 2018).
3.3 Summary of the detection capabilities over the different targets
Overall, the strongest target SCRs of floating materials were calculated for U. prolifera and the unidentified seaweed (∼11 dB, Figures 4, 12, respectively). The 3 m2 plastic target (Figure 3), hyacinth (Figure 5), large patches of S. natans/fluitans (Figure 6), and foam (Figure 11) all returned intermediate SCR values (5–7 dB). We note large variations in the detection of S. natans/fluitans slicks across the available images (Figure 6), with small slicks not being detected and large slicks producing moderate SCR values. Similarly, even within the same SAR collection, buoys #1, #3, #7, and #9 or buoys #4 and #6, returned substantially different SCR values (Figure 3; Table 3) despite being identical objects. Low SCRs were returned by S. horneri (Figure 7) and brine shrimp cysts (Figure 10) (∼0.5–2 dB). No damping effects (i.e., signal lower than sea clutter) were observed for phytoplankton (Figures 8, 9), and they were not distinguishable from the water.

Table 3. Signal-to-clutter ratio calculated for the different targets. Information on the SAR collection conditions and wind speed is also included.
4 Discussion
Despite the preliminary nature of this study due to the scarcity of available Capella SAR images and limitations in tasking collections, to the best of our knowledge, this is the first study to evaluate the capacity of high-resolution satellite X-band SAR imagery in capturing various types of floating matter in aquatic environments. While such a capacity in detecting plastic targets has been evaluated in the laboratory under controlled conditions (de Fockert et al., 2024; Simpson et al., 2023), this study is the first to assess more realistic conditions in the natural environment. Although the detection results varied for the various targets, these findings still provide valuable information for both researchers and managers when determining whether and how to task X-band SAR collection, particularly in response to disastrous events (e.g., hurricanes, tsunamis). Although this study concerns detection of various targets, the use of an automatic detection algorithm (Touzi et al., 1988) was not conducted because (1) the PLP experiment provided known target locations (with a maximum of 1 m horizontal displacement) and (2) most of the other targets were much larger than the pixel resolution and were identified by passive imagery prior to SAR collection, with the objective to provide an initial estimation of various materials being detected or not by Capella SAR sensors.
Overall, our analysis revealed that the SNR of Capella SAR data is primarily a function of collection mode. Specifically, SS and SP collections reduce the speckle by integrating single looks (from ∼3 s to ∼30 s dwell for SM and SP modes, respectively). Nevertheless, some of the SAR images presented high backscattered signals where only water was present, with Figure 12C being a good example for Sentinel-1. This noise was also visible in some parts of the Capella image, indicating that such features were likely induced by localized high winds. Images with such features were not used for SNR calculations.
As the increased dwell time (number of looks) and spatial resolution covary for these collection modes, it was not possible to directly separate the impacts of dwell time and spatial resolution on SNR. Nevertheless, our kernel size analysis indicates stability in results for kernels ≥5 × 5 (Table 1). Comparing the median SNR for SS using a 5 × 5 kernel to that calculated for an equivalent SP footprint (9 × 9 kernel), we note that the SP SNR is substantially greater.
Within the floating plastic target experiment, all six 1 m2 buoys were detected in the SP HH imagery. However, some plastic targets (1 m2 and 2 m2) were not unambiguously detectable due to lower contrast against the background water, despite a spatial resolution of ∼30 cm. Notably, the plastic targets were only slightly emergent above the water surface, while the buoys extended 90–160 cm (including the spire) out of the water. Despite equivalent SNR and spatial resolution, the SP VV image had less capacity to identify the floating targets and buoys, indicating a difference in contrast related to polarization (Figure 3). This is consistent with previous research indicating that solid materials are better observed using HH polarization mode than VV polarization modes (Guo et al., 2021; Marghany, 2019; Qi et al., 2022b), although slight differences in wind speed and incidence angle may also contribute to differences in detectability for these two collections. For the other imaging modes (SS and SM), none of the plastic targets were observable in the SAR imagery, while only some of the buoys (Figures 3C–F) can be considered detected. As such, the detection limit for Capella in SP HH mode for solid objects seems to be at least 3 m2 if the target is only slightly emergent from the water or 1 m2 if it floats distinctly above the surface, but this is likely dependent on the wind speed and incidence angle (Meng et al., 2024; Skrunes et al., 2018). Other collection modes showed less detection capabilities, as expected, particularly given that the target size was at/near the individual pixel footprint size. Notably, despite the proximity of the identical buoys (Figure 3G), detecting one of the buoys did not lead to detecting all buoys of the same group. These results, together with the noted decrease in SNR with increasing kernel size (particularly from 3 × 3 to 5 × 5), indicate that the Capella data for all three collection modes are supersampled at their provided resolutions.
Nevertheless, even using the highest-resolution passive optical data considered (3 m Planet data), none of the buoys and only the largest target from the controlled floating targets experiment (PLP) were potentially observable, and this is a net advantage of Capella Space’s high-resolution sensors over most current passive optical sensors. All of the other floating matters assessed, however, were clearly identified using passive optical data with 10 m spatial resolution or greater. Thus, aerial extent should not be a major impediment to SAR detection. However, the detection of a floating target using SAR imagery is directly limited by the target’s elevation above water (Arii et al., 2014).
As examples, the large vessel (Figure 7) produced the highest SCR of the study (15.53 dB), in agreement with what was observed for single polarization previously reported from the RADARSAT-2 SAR C-band [∼12–15 dB, Table 2 in Liu et al. (2023)]. The detectability could be improved if automatic detection algorithms could be applied, but they often require multi-polarization for advanced algorithms (Liu et al., 2019; 2023; Marghany, 2019; 2024), which are not available for Capella sensors. Similarly, U. prolifera and hyacinth have high buoyancy, which results in them being consistently above the surface, and thus they were clearly observed by SAR imagery. Still, while U. prolifera returned high SCR values (>10 dB), hyacinth only yielded moderate SCR values (∼6 dB) despite relatively low wind speeds. These detection differences may be due to the higher incidence angle of the data collected for hyacinth. Qi et al. (2022b) quantified that when U. prolifera was identified through Sentinel-2 imagery, it was also detected by Sentinel-1 C-band for 90% of the cases. Capella X-band SAR sensors improve beyond what is currently available from Sentinel-1 C-band SAR imagery because of the improved spatial resolutions (10–30 times higher), with a comparison demonstrating the improved delineation of floating vegetation in Lake Skadar/Shkodra (Figure 12).
Floating Sargassum aggregations are slightly less buoyant, resulting in more variable detection using SAR. For instance, Figure 6 provides both positive and negative detections of S. natans/fluitans within the same image. The large patch (∼5 km2) in Figure 6C inset produced an SCR of 5.11 dB. Smaller slicks, most of which are much larger than the 1 m spatial resolution of the SM dataset (Figure 6B), were mostly not detected by SAR. Depending on the sea state, these blooms can be submerged by a few centimeters below the surface and disappear from SAR signals due to the high dielectric constant of the water. Thus, wind has a dual effect for floating material detection by SAR imagery: it can both increase the noise of an image and contribute to the sinking of a material (Laval et al., 2025). The larger spatial aggregations are more likely to be detected, potentially due to their center remaining above the surface due to the raft cohesion. Still, almost no SAR detections of S. horneri aggregations were observed (Figure 7C). Specifically, despite ideal collection conditions (low wind, moderate incidence angle), large aggregations identified in near-simultaneous passive imagery (Figure 7A) were barely noticeable from SAR imagery (SCR ∼2 dB). The detectability of S. horneri may be linked to lower buoyancy than S. natans/fluitans as similar observations using Sentinel-1 SAR C-band were reported, noting broadly low detectability for both materials (Qi et al., 2022b). Overall, Capella SAR shows a low ability to detect S. natans/fluitans and S. horneri macroalgae mats.
For phytoplankton, Trichodesmium scums are only slightly emergent, and N. scintillans may be slightly submerged (0–60 cm), hampering their detectability using SAR. Due to the weak depth penetration of photons at these wavelengths (X- and C-bands, 10−3 to 10−2 m, two to four orders of magnitude lower than optical imagery), even slightly submerged features may be invisible to SAR sensors (Segelstein, 1981). Notably, submerged objects can still be detected by SAR signals if they dampen surface waves, which reduces the observed signal and creates a negative contrast (Johannessen et al., 2005). However, if this impact is small or compensated by associated positive contrast features, detection using SAR is impossible. Negative surface features were only observed in our SAR dataset from shear currents, which should flatten the sea surface, where S. natans/fluitans seemed to aggregate (Figure 6). Several studies proposed that SAR can detect phytoplankton blooms by returning a negative contrast with the ocean (Svejkovsky and Shandley, 2001; Wu et al., 2018), but no dampening linked to the presence of phytoplankton scums was observed in this study.
Nevertheless, brine shrimp cysts were detected (Figure 10) despite being composed of 200–300 µm diameter cells (Wu et al., 2022), half the size of typical large N. scintillans cells [up to 600 μm (Uhlig and Sahling, 1990)]. Although they can create similar spatial features with large surface slicks, their high buoyancy makes them remain at the very surface, which allows their detection through SAR imagery. Foam slicks were also potentially observed through SAR imagery (Figure 11), but the exact details require further validation. Specifically, as no direct matchup with passive optical data was available for the specific example date due to the cloud coverage and lack of passive imagery, foam could have been mixed with brine shrimp cysts. Regardless of the target observed that day, the Sentinel-1 C-band did not show any signal from the area. Moreover, although numerous examples of foam and brine shrimp cyst presence throughout the year were observed in the area from passive optical data, none of the 568 images collected by Sentinel-1 SAR (2016–2024) over this region showed any such feature. One reason could be the unusual incidence angle of the Capella SAR image (12°), which may either allow foam to be detected or reduce the SCRs calculated over foam compared to a more optimal incidence angle. Nevertheless, this is one of the major improvements provided by Capella SAR beyond the current capabilities of Sentinel-1. The key component for this comparison may either come from the higher spatial resolution available from Capella SAR over Sentinel-1 SAR or from X-band over C-band. For example, within controlled environments, de Fockert et al. (2024) found that the backscattered signal from floating plastic was higher when observed from the X-band in VV polarization than from the C-band in any polarization, while Simpson et al. (2023) noted significantly better performance of X-band SAR (relative to C-band) in detecting floating plastic. Compared to other currently publicly available SAR imagery, Capella sensors greatly improve floating material delineation and allow detection of additional targets.
Some limitations of the Capella SAR dataset for detecting floating matter may be removed in the near future by new sensors equipped with instruments measuring at different frequencies or providing cross- and multi-polarization collection modes as these collection modes are often used conjointly for classification (Lee et al., 2001; Scheuchl and Cumming, 2005). As an example, the recently launched NASA ISRO NISAR satellite (Rosen et al., 2017) conjointly carries a sensor with both S- and L-bands (9 cm and 24 cm, respectively), which will enhance current water penetration limits by one order of magnitude (cm instead of mm). The BIOMASS mission, soon to be launched by ESA (Quegan et al., 2019), will include the first spaceborne SAR P-band sensor, which provides penetration depths equivalent to the current near infrared capabilities, which should allow detection of even slightly submerged material. Eventually, future sensors using very high frequencies (VHF, 1–10 m) may further advance such detection capabilities.
One of the remaining challenges affecting Capella SAR and high-resolution sensors in general is the small footprint (5 × 5 km to 5 × 20 km). Monitoring large areas would require a robust collection regime, likely with additional sensors in the constellation. Identification of a specific floating target currently requires previous knowledge, usually achieved by consistent observations of concurrent in situ samples and/or optical imagery. The small footprint limitation prevented rigorous quantitative assessment of floating matter capabilities using the current dataset and also resulted in the time intervals between the paired SAR-passive optical imagery being occasionally longer than ideal. For the positive detection of floating matter using SAR, even temporal windows of a few days may be acceptable if the floating matter is persistent in the region. However, proving negative detection capabilities is much more challenging as the floating matter could have moved with surface currents or submerged. In this study, the matchup intervals for S. horneri and S. natans/fluitans (4–72 min, respectively) are certainly sufficient to infer negative detection capabilities. However, Trichodesmium scums were observed through SAR at 17:03 local time, compared to 10:13 local time for the 7-h adjacent passive optical imagery. As some Trichodesmium species can migrate vertically on a diel cycle (Villareal and Carpenter, 1990), the interpretation of negative capability from the images in Figure 8 alone is thus much more tenuous. The other three images tasked over Trichodesmium targets (all in VV mode) did not show the presence of material in concurrent optical imagery. With limited attempts and a single matchup in a single collection mode, no conclusion can be made for Trichodesmium detection capabilities using X-band SAR.
Difficulties in achieving paired SAR/optical imagery further highlight the difficulty in catching such brief and sparse events with active tasking sensors, along with the limitation from high-resolution passive imagery with long revisit times. Overall, despite our efforts to generate paired SAR/optical image pairs, nearly half of our SAR collections were likely of areas with no floating material present, mostly due to the disappearance of the material (e.g., by vertical migration), spatially missing it by several kilometers, or cloud coverage precluding determination. Nevertheless, the detection capabilities noted for this X-band SAR dataset are consistent with expectations based on light interactions with water and various materials and with previous findings using the Sentinel-1 dataset (Qi et al., 2022b), which has no such coverage limitation.
Several additional key factors could not be addressed in this study due to the limited number of images available from the satellite mission, including the effect of the incidence angle and wind speed and wind direction, which are known to alter the backscattering signal when observing the ocean, at least for plastic [Figure 6 in de Fockert et al. (2024)], marine debris [Figure 2 in Arii et al. (2014)] or oil slicks (Skrunes et al., 2018). When more images are collected by X-band satellites in the future over known floating material targets, these effects may be further assessed. Moreover, the absence of a customizable incidence angle for tasking purposes, along with the absence of a dual/quad polarization mode, limited further evaluation over oceanic targets as needed to build automated detection for ocean targets (Guo et al., 2021).
Despite these limitations, because SAR sensors can be operated under all weather conditions during both day and night, the use of Capella SAR over known areas for event response (e.g., to detect plastic litter after flooding events or hurricanes) may complement other satellite observations to help with cleaning and impact mitigation efforts. As an example, the U. prolifera observed from high-resolution imagery in Figure 4A was not observed again in passive optical imagery (either PlanetScope or MSI) until 5 days later. During this time period, the algae were transported into the harbor and could present a hazard to navigation. With sufficient tasking and constellation capability, Capella data could observe this bloom multiple times a day (or night) regardless of cloud cover, representing a clear advantage of SAR over passive optical imagery. As such, optimal monitoring of floating matter requires coupling of data from passive optical and SAR datasets, while improvements in the SAR data collection (additional polarization modes, additional frequencies, and untasked acquisition) will improve floating matter detection capabilities.
5 Summary and conclusion
The capacity of high-resolution Capella X-band SAR sensors in detecting various types of floating matter was evaluated by analyzing co-located and concurrent passive optical images. Despite data scarcity, the following can be summarized.
• Detecting floating macroplastics is possible with relatively large targets and a specific SAR configuration. Of the various sizes of floating plastic targets (1 m2, 2 m2, and 3 m2), only the 3 m2 target could be detected with one of the six SAR collection configurations, despite being up to 25 times the size of a pixel.
• Detecting U. prolifera macroalgae mats, hyacinth, and freshwater seaweed is straightforward, possibly because the high buoyancy makes them float slightly above the water surface, leading to enhanced SAR signals.
• Detecting S. natans/fluitans is possible, but only in limited cases when large mats are observed in companion optical images.
• Detecting S. horneri mats is nearly impossible, possibly due to the higher density (compared to S. natans/fluitans), which makes them slightly submerged in water.
• Detecting brine shrimp cysts and foam shows variable results, but occasional possible detections by Capella X-band SAR were not observed with Sentinel-1 C-band SAR.
• Phytoplankton surface scums and freshwater cyanobacteria are not detectable in Capella SAR X-band imagery. Further evaluations are required to conclusively assess Trichodesmium detectability.
While in theory, floating matter may manifest as positive contrast (enhanced SAR scattering) or negative contrast (dampened surface waves) in SAR imagery, in this study, only positive contrast features were identified as concomitant with optically identified floating matter. The relatively low SNR of the Capella SAR collections (2–6) may also contribute to the variable results obtained here. Nevertheless, the strengths and limitations of Capella SAR in detecting various types of floating matter are clearly demonstrated. In the future, if hot spots of potential floating plastic litter can be predicted based on either historical data or event response (e.g., after hurricanes or flooding events), Capella SAR or similar sensors can be tasked to detect large mats of plastic litter to help mitigation efforts, even when passive optical sensing is impossible due to atmospheric conditions. In such cases, the logic of applying the above findings will be as follows: if Capella SAR images capture signal anomalies that can be inferred to be certain types of floating materials based on a priori knowledge of the area of interest, then the answer to detection is positive. Otherwise, if Capella SAR images show no signal anomalies, then the answer is not negative but unknown.
Data availability statement
The datasets presented in this article are not readily available because high-resolution data (Capella and Planet) are proprietary. All other data (satellite, modeled wind, in situ wind) are public. Derived SNRs for all individual collections are included in Supplementary Table S1. Requests to access the datasets should be directed to bbarnes4@usf.edu.
Author contributions
MH: Data curation, Formal analysis, Methodology, Writing – original draft, Conceptualization, Writing – review and editing, Investigation. BB: Writing – review and editing, Funding acquisition, Methodology, Formal analysis, Writing – original draft, Conceptualization. CH: Formal analysis, Visualization, Data curation, Writing – review and editing, Conceptualization, Investigation. LQ: Writing – review and editing, Software, Validation, Investigation. DP: Validation, Writing – review and editing, Investigation, Methodology. KT: Writing – review and editing, Validation, Investigation, Methodology.
Funding
The authors declare that financial support was received for the research and/or publication of this article. Funding was provided by the National Aeronautics and Space Administration under the grants 80NSSC23K0713, 80NSSC21K0422, and 80NSSC25K7427.
Acknowledgements
The authors thank ESA, USGS, and NASA for providing satellite data used in this study (Sentinel-1, Sentinel-2, Sentinel-3, MODIS, VIIRS, and Landsat) and Sentinel Hub (Sinergise Solutions d.o.o., a Planet Labs company) for providing the modified Copernicus Sentinel data accessed through the EO Browser. Access to commercial data from Planet and Capella was provided through the NASA Commercial Satellite Data Acquisition (CSDA) program. The scientific results and conclusions, as well as any views or opinions expressed herein, are those of the authors and do not necessarily reflect those of NOAA or the Department of Commerce.
Conflict of interest
The authors declare that the research was conducted in the absence of any commercial or financial relationships that could be construed as a potential conflict of interest.
Generative AI statement
The authors declare that no Generative AI was used in the creation of this manuscript.
Any alternative text (alt text) provided alongside figures in this article has been generated by Frontiers with the support of artificial intelligence and reasonable efforts have been made to ensure accuracy, including review by the authors wherever possible. If you identify any issues, please contact us.
Publisher’s note
All claims expressed in this article are solely those of the authors and do not necessarily represent those of their affiliated organizations, or those of the publisher, the editors and the reviewers. Any product that may be evaluated in this article, or claim that may be made by its manufacturer, is not guaranteed or endorsed by the publisher.
Supplementary material
The Supplementary Material for this article can be found online at: https://www.frontiersin.org/articles/10.3389/frsen.2025.1693286/full#supplementary-material
References
Al-Azri, A., Al-Hashmi, K., Goes, J., Gomes, H., Rushdi, A. I., Al-Habsi, H., et al. (2007). Seasonality of the bloom-forming heterotrophic dinoflagellate Noctiluca scintillans in the Gulf of Oman in relation to environmental conditions. Int. J. Oceans Oceanogr. 2 (1), 51–60.
Arii, M., Koiwa, M., and Aoki, Y. (2014). Applicability of SAR to marine debris surveillance after the Great East Japan earthquake. IEEE J. Sel. Top. Appl. Earth Observations Remote Sens. 7 (5), 1729–1744. doi:10.1109/JSTARS.2014.2308550
Baraúna, R. A., Graças, D. A., Miranda, P. R., Ghilardi, R., Barbosa, M. S., Schneider, M. P. C., et al. (2012). Prokaryotic diversity of the tucuruí hydropower plant reservoir in the Brazilian Amazon. Aquatic Sci. Technol. 1 (1), 181–199. doi:10.5296/ast.v1i1.2981
Belovsky, G. E., and Perschon, W. C. (2019). A management case study for a new commercial fishery: brine shrimp harvesting in Great Salt Lake, Utah, USA. Ecol. Appl. A Publ. Ecol. Soc. Am. 29 (3), e01864. doi:10.1002/eap.1864
Biermann, L., Clewley, D., Martinez-Vicente, V., and Topouzelis, K. (2020). Finding plastic patches in coastal waters using optical satellite data. Sci. Rep. 10 (1), 5364. doi:10.1038/s41598-020-62298-z
Bricaud, A., Babin, M., Morel, A., and Claustre, H. (1995). Variability in the chlorophyll-specific absorption coefficients of natural phytoplankton: analysis and parameterization. J. Geophys. Res. 100 (13), 13321–13332. doi:10.1029/95JC00463
Capella Space (2020). SAR system performance v2.0. Available online at: https://geokom.ba/wp-content/uploads/2020/12/Capella_Space_SAR_System_Performance.pdf (Accessed December 18, 2024).
Capella Space (2023). SAR imagery product guide v4.1. Available online at: https://support.capellaspace.com/hc/en-us/articles/4626115099796-SAR-Imagery-Products-Guide (Accessed December 18, 2024).
Capella Space (2024). SAR products format specification v1.7. Available online at: https://support.capellaspace.com/hc/en-us/articles/5607458273940-SAR-Imagery-Products-Format-Specification (Accessed December 18, 2024).
Capella Space (2025). Capella space. Available online at: https://support.capellaspace.com/scaling-geo-images-in-qgis (Accessed November 21, 2025).
Capone, D. G., Zehr, J. P., Paerl, H. W., Bergman, B., and Carpenter, E. J. (1997). Trichodesmium, a globally significant marine cyanobacterium. Science 276 (5316), 1221–1229. doi:10.1126/science.276.5316.1221
de Fockert, A., Eleveld, M., Bakker, W., Felício, J. M., Costa, T., Vala, M., et al. (2024). Assessing the detection of floating plastic litter with advanced remote sensing technologies in a hydrodynamic test facility. Sci. Rep. 14 (1), 25902. doi:10.1038/s41598-024-74332-5
de Moura, N. V. A., de Carvalho, O. L. F., Gomes, R. A. T., Guimarães, R. F., and de Carvalho Júnior, O. A. (2022). Deep-water oil-spill monitoring and recurrence analysis in the Brazilian territory using Sentinel-1 time series and deep learning. Int. J. Appl. Earth Observation Geoinformation 107, 102695. doi:10.1016/j.jag.2022.102695
Degobbis, D., Malej, A., and Umani, S. F. (1999). The mucilage phenomenon in the northern Adriatic Sea. A critical review of the present scientific hypotheses. Ann. Dell’Istituto Super. Di Sanita 35 (3), 373–381.
do Rosário Gomes, H., Goes, J. I., Matondkar, S. G. P., Buskey, E. J., Basu, S., Parab, S., et al. (2014). Massive outbreaks of Noctiluca scintillans blooms in the Arabian Sea due to spread of hypoxia. Nat. Commun. 5, 4862. doi:10.1038/ncomms5862
Eldhuset, K. (1996). An automatic ship and ship wake detection system for spaceborne SAR images in coastal regions. IEEE Trans. Geoscience Remote Sens. 34 (4), 1010–1019. doi:10.1109/36.508418
Farquharson, G., Castelletti, D., Stringham, C., and Eddy, D. (2021). “An update on the Capella Space radar constellation,” in EUSAR 2021; 13th European conference on synthetic aperture radar, 1–4. Available online at: https://ieeexplore.ieee.org/abstract/document/9472631 (Accessed November 21, 2025).
Fiete, R. D., and Tantalo, T. (2001). Comparison of SNR image quality metrics for remote sensing systems. Opt. Eng. 40 (4), 574–585. doi:10.1117/1.1355251
Gao, B. (1996). NDWI—A normalized difference water index for remote sensing of vegetation liquid water from space. Remote Sens. Environ. 58 (3), 257–266. doi:10.1016/S0034-4257(96)00067-3
Gao, L., Li, X., Kong, F., Yu, R., Guo, Y., and Ren, Y. (2022a). AlgaeNet: a deep-learning framework to detect floating green algae from optical and SAR imagery. IEEE J. Sel. Top. Appl. Earth Observations Remote Sens. 15, 2782–2796. doi:10.1109/JSTARS.2022.3162387
Gao, L., Wang, C., Liu, K., Chen, S., Dong, G., and Su, H. (2022b). Extraction of floating raft aquaculture areas from Sentinel-1 SAR images by a dense residual U-Net model with pre-trained Resnet34 as the encoder. Remote Sens. 14 (13), 3003. doi:10.3390/rs14133003
Godínez-Ortega, J. L., Cuatlán-Cortés, J. V., López-Bautista, J. M., Tussenbroek, B. I. van, Godínez-Ortega, J. L., Cuatlán-Cortés, J. V., et al. (2021). “A natural history of floating sargassum species (Sargasso) from Mexico,” in Natural history and ecology of Mexico and central America (London, United Kingdom: IntechOpen). doi:10.5772/intechopen.97230
Gower, J., Young, E., and King, S. (2013). Satellite images suggest a new Sargassum source region in 2011. Remote Sens. Lett. 4 (8), 764–773. doi:10.1080/2150704X.2013.796433
Guimarães, A., da Silva, P. H., Carneiro, F. M., and Silva, D. P. (2020). Using distribution models to estimate blooms of phytosanitary Cyanobacteria in Brazil. Biota Neotropica 20, e20190756. doi:10.1590/1676-0611-BN-2019-0756
Guo, R., Zhang, Z., Gao, R., Jing, G., Xing, M., and Zhi, Y. (2021). Ocean target investigation using spaceborne sar under dual-polarization strip-map mode, (Shanghai: China). 1–5.
Hadžiablahović, S. (2018). The diversity of the flora and vegetation of Lake Skadar/Shkodra. Skadar/Shkodra Lake Environ., 203–238. doi:10.1007/698_2018_236
Harrison, P. J., Furuya, K., Glibert, P. M., Xu, J., Liu, H. B., Yin, K., et al. (2011). Geographical distribution of red and green Noctiluca scintillans. Chin. J. Oceanol. Limnol. 29 (4), 807–831. doi:10.1007/s00343-011-0510-z
Havel, J. E., Kovalenko, K. E., Thomaz, S. M., Amalfitano, S., and Kats, L. B. (2015). Aquatic invasive species: challenges for the future. Hydrobiologia 750 (1), 147–170. doi:10.1007/s10750-014-2166-0
Horler, D. N. H., Dockray, M., and Barber, J. (1983). The red edge of plant leaf reflectance. Int. J. Remote Sens. 4 (2), 273–288. doi:10.1080/01431168308948546
Hu, C. (2022). Remote detection of marine debris using Sentinel-2 imagery: a cautious note on spectral interpretations. Mar. Pollut. Bull. 183, 114082. doi:10.1016/j.marpolbul.2022.114082
Hu, C., and He, M.-X. (2008). Origin and offshore extent of floating algae in olympic sailing area. Eos, Trans. Am. Geophys. Union 89 (33), 302–303. doi:10.1029/2008EO330002
Hu, C., Li, D., Chen, C., Ge, J., Muller-Karger, F. E., Liu, J., et al. (2010). On the recurrent Ulva prolifera blooms in the Yellow Sea and East China Sea. J. Geophys. Res. Oceans 115 (C5). doi:10.1029/2009JC005561
Hu, C., Qi, L., Xie, Y., Zhang, S., and Barnes, B. B. (2022). Spectral characteristics of sea snot reflectance observed from satellites: implications for remote sensing of marine debris. Remote Sens. Environ. 269, 112842. doi:10.1016/j.rse.2021.112842
Hu, C., Qi, L., English, D. C., Wang, M., Mikelsons, K., Barnes, B. B., et al. (2023a). Pollen in the Baltic Sea as viewed from space. Remote Sens. Environ. 284, 113337. doi:10.1016/j.rse.2022.113337
Hu, C., Qi, L., Wang, M., and Park, Y.-J. (2023b). Floating debris in the Northern Gulf of Mexico after Hurricane Katrina. Environ. Sci. Technol. 57 (28), 10373–10381. doi:10.1021/acs.est.3c01689
Johannessen, J. A., Kudryavtsev, V., Akimov, D., Eldevik, T., Winther, N., and Chapron, B. (2005). On radar imaging of current features: 2. Mesoscale eddy and current front detection. J. Geophys. Res. Oceans 110 (C7). doi:10.1029/2004JC002802
Joughin, I. (2002). Ice-sheet velocity mapping: a combined interferometric and speckle-tracking approach. Ann. Glaciol. 34, 195–201. doi:10.3189/172756402781817978
Kastratović, V., Jaćimović, Ž., Đurović, D., Bigović, M., and Krivokapić, S. (2015). Lemna minor L.: as bioindicator of heavy metal pollution in Skadar lake: montenegro. Kragujevac J. Sci. 37, 123–134. doi:10.5937/KgJSci1537123K
Kikaki, K., Kakogeorgiou, I., Mikeli, P., Raitsos, D. E., and Karantzalos, K. (2022). MARIDA: a benchmark for Marine Debris detection from Sentinel-2 remote sensing data. PloS One 17 (1), e0262247. doi:10.1371/journal.pone.0262247
King, M. D., Platnick, S., Menzel, W. P., Ackerman, S. A., and Hubanks, P. A. (2013). Spatial and temporal distribution of clouds observed by MODIS onboard the terra and aqua satellites. IEEE Trans. Geoscience Remote Sens. 51 (7), 3826–3852. doi:10.1109/TGRS.2012.2227333
Klemas, V. (2012). Remote sensing of Ocean internal waves: an overview. J. Coast. Res. 28 (3), 540–546. doi:10.2112/JCOASTRES-D-11-00156.1
Laval, M., Aimene, Y., Descloitres, J., Courtrai, L., Duarte-Neto, P., Salazar-Garibay, A., et al. (2025). The Influence of wind on the spatial distribution of pelagic Sargassum aggregations in the Tropical Atlantic. Water 17 (6), 776. doi:10.3390/w17060776
Lee, J.-S. (1981). Speckle analysis and smoothing of synthetic aperture radar images. Comput. Graph. Image Process. 17 (1), 24–32. doi:10.1016/s0146-664x(81)80005-6
Lee, J.-S., Grunes, M. R., and Pottier, E. (2001). Quantitative comparison of classification capability: fully polarimetric versus dual and single-polarization SAR. IEEE Trans. Geoscience Remote Sens. 39 (11), 2343–2351. doi:10.1109/36.964970
Li, Y., and Li, J. (2010). Oil spill detection from SAR intensity imagery using a marked point process. Remote Sens. Environ. 114 (7), 1590–1601. doi:10.1016/j.rse.2010.02.013
Litvinenko, L. I., Kozlov, A. V., Kovalenko, A. I., and Bauer, D. S. (2007). Salinity of water as a factor to determine the development of the brine shrimp Artemia populations in Siberian lakes. Hydrobiologia 576 (1), 95–101. doi:10.1007/s10750-006-0296-8
Liu, G., Zhang, X., and Meng, J. (2019). A small ship target detection method based on polarimetric SAR. Remote Sens. 11 (24), 2938. doi:10.3390/rs11242938
Liu, G., Zhang, J., Zhang, X., Zhang, Y., Gao, G., Meng, J., et al. (2023). Ship detection in nonhomogeneous Sea clutter based on polarization-time–frequency optimal using polarimetric SAR. IEEE J. Miniaturization Air Space Syst. 4 (1), 2–8. doi:10.1109/JMASS.2022.3216815
Main-Knorn, M., Pflug, B., Louis, J., Debaecker, V., Müller-Wilm, U., and Gascon, F. (2017). Sen2Cor for Sentinel-2. Image Signal Process. Remote Sens. XXIII 10427, 3–48. doi:10.1117/12.2278218
Marden, B., Van Stappen, G., Musaev, A., Mirabdullayev, I., Joldasova, I., and Sorgeloos, P. (2012). Assessment of the production potential of an emerging Artemia population in the Aral Sea, Uzbekistan. J. Mar. Syst. 92 (1), 42–52. doi:10.1016/j.jmarsys.2011.10.004
Marghany, M. (2001). RADARSAT automatic algorithms for detecting coastal oil spill pollution. Int. J. Appl. Earth Observation Geoinformation 3 (2), 191–196. doi:10.1016/s0303-2434(01)85011-x
Marghany, M. (2019). Synthetic aperture radar imaging mechanism for oil spills. Oxford, United Kingdom: Gulf Professional Publishing.
Marghany, M. (2024). Synthetic aperture radar image processing algorithms for nonlinear oceanic turbulence and front modeling. Amsterdam, Netherlands: Elsevier.
Menezes, M., Bicudo, C. E. M., Moura, C. W. N., Alves, A. M., Santos, A. A., Pedrini, A. de G., et al. (2015). Update of the Brazilian floristic list of Algae and Cyanobacteria. Rodriguésia 66, 1047–1062. doi:10.1590/2175-7860201566408
Meng, T., Nunziata, F., Yang, X., Buono, A., and Migliaccio, M. (2024). Model-based comparisons of near-coincident TerraSAR-X and COSMO-SkyMed VV-polarized SAR measurements over sea surface with and without oil slicks. Geo-Spatial Inf. Sci. 27 (3), 822–835. doi:10.1080/10095020.2023.2296969
Mifdal, J., Longépé, N., and Rußwurm, M. (2021). Towards detecting floating objects on a global scale with learned spatial features using sentinel 2. ISPRS Ann. Photogrammetry, Remote Sens. Spatial Inf. Sci. V-3-2021, 285–293. doi:10.5194/isprs-annals-v-3-2021-285-2021
Mouginot, J., Rignot, E., Scheuchl, B., and Millan, R. (2017). Comprehensive annual ice sheet velocity mapping using Landsat-8, Sentinel-1, and RADARSAT-2 data. Remote Sens. 9 (4), 364. doi:10.3390/rs9040364
Murata, H., Komatsu, T., and Yonezawa, C. (2019). Detection and discrimination of aquacultural facilities in Matsushima Bay, Japan, for integrated coastal zone management and marine spatial planning using full polarimetric L-band airborne synthetic aperture radar. Int. J. Remote Sens. 40 (13), 5141–5157. doi:10.1080/01431161.2019.1579380
Napolitano, G. E., and Cicerone, D. S. (1999). “Lipids in water-surface microlayers and foams,” in Lipids in freshwater ecosystems. Editors M. T. Arts, and B. C. Wainman (New York: Springer), 235–262. doi:10.1007/978-1-4612-0547-0_11
Osmanoglu, B., Huang, S., Jones, C., Scheuchl, B., Khazendar, A., Sauber, J., et al. (2023). Benefit assessment of commercial synthetic aperture radar observations for NASA’s surface deformation and change mission study. Int. Archives Photogrammetry, Remote Sens. Spatial Inf. Sci. 48, 225–232. doi:10.5194/isprs-archives-xlviii-m-1-2023-225-2023
Papageorgiou, D., Topouzelis, K., Suaria, G., Aliani, S., and Corradi, P. (2022). Sentinel-2 detection of floating marine litter targets with partial spectral unmixing and spectral comparison with other floating materials (plastic litter Project 2021). Remote Sens. 14 (23), 5997. doi:10.3390/rs14235997
Park, J.-J., Park, K.-A., Kim, T.-S., Oh, S., and Lee, M. (2023). Aerial hyperspectral remote sensing detection for maritime search and surveillance of floating small objects. Adv. Space Res. 72 (6), 2118–2136. doi:10.1016/j.asr.2023.06.055
Parr, A. E. (1939). Quantitative observations on the pelagic Sargassum vegetation of the western North Atlantic. Bull. Bingham Oceanogr. Coll. 6, 1–94.
Pešić, V., Karaman, G. S., Kostianoy, A. G., and Vukašinović-Pešić, V. (2018). Conclusions: recent advances and the future prospects of the Lake Skadar/Shkodra environment. Skadar/Shkodra Lake Environ., 80, 481–500. doi:10.1007/698_2018_274
Piontkovski, S. A., Serikova, I. M., Evstigneev, V. P., Prusova, I.Yu., Zagorodnaya, Y. A., Al-Hashmi, K. A., et al. (2021). Seasonal blooms of the dinoflagellate algae Noctiluca scintillans: regional and global scale aspects. Regional Stud. Mar. Sci. 44, 101771. doi:10.1016/j.rsma.2021.101771
Putman, N. F., Lumpkin, R., Olascoaga, M. J., Trinanes, J., and Goni, G. J. (2020). Improving transport predictions of pelagic Sargassum. J. Exp. Mar. Biol. Ecol. 529, 151398. doi:10.1016/j.jembe.2020.151398
Qi, L., and Hu, C. (2021). To what extent can Ulva and Sargassum be detected and separated in satellite imagery? Harmful Algae 103, 102001. doi:10.1016/j.hal.2021.102001
Qi, L., Hu, C., Mikelsons, K., Wang, M., Lance, V., Sun, S., et al. (2020). In search of floating algae and other organisms in global oceans and lakes. Remote Sens. Environ. 239, 111659. doi:10.1016/j.rse.2020.111659
Qi, L., Yao, Y., English, D. E., Ma, R., Luft, J., and Hu, C. (2021). Remote sensing of brine shrimp cysts in salt lakes. Remote Sens. Environ. 266, 112695. doi:10.1016/j.rse.2021.112695
Qi, L., Hu, C., Barnes, B. B., Lapointe, B. E., Chen, Y., Xie, Y., et al. (2022a). Climate and anthropogenic controls of seaweed expansions in the East China Sea and yellow Sea. Geophys. Res. Lett. 49 (19), e2022GL098185. doi:10.1029/2022GL098185
Qi, L., Wang, M., Hu, C., and Holt, B. (2022b). On the capacity of Sentinel-1 synthetic aperture radar in detecting floating macroalgae and other floating matters. Remote Sens. Environ. 280, 113188. doi:10.1016/j.rse.2022.113188
Qi, L., Cheng, P., Wang, M., Hu, C., Xie, Y., and Mao, K. (2023a). Where does floating Sargassum in the East China Sea come from? Harmful Algae 129, 102523. doi:10.1016/j.hal.2023.102523
Qi, L., Wang, M., Hu, C., Capone, D. G., Subramaniam, A., Carpenter, E. J., et al. (2023b). Trichodesmium around Australia: a view from space. Geophys. Res. Lett. 50 (16), e2023GL104092. doi:10.1029/2023GL104092
Qi, L., Wang, M., Hu, C., Jiao, J., and Park, Y.-J. (2024). Marine debris induced by the Great East Japan Earthquake and Tsunami: a multi-sensor remote sensing assessment. Mar. Pollut. Bull. 207, 116888. doi:10.1016/j.marpolbul.2024.116888
Quegan, S., Le Toan, T., Chave, J., Dall, J., Exbrayat, J.-F., Minh, D. H. T., et al. (2019). The European Space Agency BIOMASS mission: measuring forest above-ground biomass from space. Remote Sens. Environ. 227, 44–60. doi:10.1016/j.rse.2019.03.032
Reinart, A., and Kutser, T. (2006). Comparison of different satellite sensors in detecting cyanobacterial bloom events in the Baltic Sea. Remote Sens. Environ. 102 (1), 74–85. doi:10.1016/j.rse.2006.02.013
Retnamma, J., Sarath, S., Balachandran, K. K., Krishnan, S. S., Karnan, C., Arunpandi, N., et al. (2023). Environmental and human facets of the waterweed proliferation in a Vast Tropical Ramsar Wetland-Vembanad Lake System. Environ. Monit. Assess. 195 (7), 900. doi:10.1007/s10661-023-11417-0
Rodríguez-Martínez, R. E., Medina-Valmaseda, A. E., Blanchon, P., Monroy-Velázquez, L. V., Almazán-Becerril, A., Delgado-Pech, B., et al. (2019). Faunal mortality associated with massive beaching and decomposition of pelagic Sargassum. Mar. Pollut. Bull. 146, 201–205. doi:10.1016/j.marpolbul.2019.06.015
Rosen, P. A., Kim, Y., Kumar, R., Misra, T., Bhan, R., and Sagi, V. R. (2017). “Global persistent SAR sampling with the NASA-ISRO SAR (NISAR) mission,” in 2017 IEEE radar conference. Seattle, Washington, DC: (RadarConf), 0410–0414. doi:10.1109/RADAR.2017.7944237
Rouse, J. W., Haas, R. H., Deering, D. W., Schell, J. A., and Harlan, J. C. (1974). Monitoring the vernal advancement and retrogradation (Green wave effect) of natural vegetation (Nos. E75-10354). Available online at: https://ntrs.nasa.gov/citations/19750020419 (Accessed November 21, 2025).
Scheuchl, B., and Cumming, I. (2005). “Analysis of the influence of NESZ variations on cross-polarized signatures of sea ice,” in Proceedings. 2005 IEEE international geoscience and remote sensing symposium, 2005. IGARSS ‘05’. 7, 5157–5160. Available online at: http://sar.ece.ubc.ca/papers/Bernd_IGARSS_2005.pdf (Accessed November 21, 2025).
Segelstein, D. J. (1981). The complex refractive index of water. Thesis, KS, United States: University of Missouri--Kansas City. Available online at: https://mospace.umsystem.edu/xmlui/handle/10355/11599 (Accessed November 11, 2025).
Shen, H., Perrie, W., Liu, Q., and He, Y. (2014). Detection of macroalgae blooms by complex SAR imagery. Mar. Pollut. Bull. 78 (1), 190–195. doi:10.1016/j.marpolbul.2013.10.044
Shirvany, R., Chabert, M., and Tourneret, J.-Y. (2012). Ship and oil-spill detection using the degree of polarization in linear and hybrid/compact dual-pol SAR. IEEE J. Sel. Top. Appl. Earth Observations Remote Sens. 5 (3), 885–892. doi:10.1109/jstars.2012.2182760
Simpson, M. D., Akbari, V., Marino, A., Prabhu, G. N., Bhowmik, D., Rupavatharam, S., et al. (2022a). Detecting water hyacinth infestation in Kuttanad, India, using dual-pol Sentinel-1 SAR imagery. Remote Sens. 14 (12), 2845. doi:10.3390/rs14122845
Simpson, M. D., Marino, A., de Maagt, P., Gandini, E., Hunter, P., Spyrakos, E., et al. (2022b). Monitoring of plastic Islands in River environment using Sentinel-1 SAR data. Remote Sens. 14 (18), 4473. doi:10.3390/rs14184473
Simpson, M. D., Marino, A., de Maagt, P., Gandini, E., de Fockert, A., Hunter, P., et al. (2023). Investigating the backscatter of marine plastic litter using a C-and X-band ground radar, during a measurement campaign in Deltares. Remote Sens. 15 (6), 1654. doi:10.3390/rs15061654
Skrunes, S., Brekke, C., Jones, C. E., Espeseth, M. M., and Holt, B. (2018). Effect of wind direction and incidence angle on polarimetric SAR observations of slicked and unslicked sea surfaces. Remote Sens. Environ. 213, 73–91. doi:10.1016/j.rse.2018.05.001
Solberg, A. S., Storvik, G., Solberg, R., and Volden, E. (1999). Automatic detection of oil spills in ERS SAR images. IEEE Trans. Geoscience Remote Sens. 37 (4), 1916–1924. doi:10.1109/36.774704
Song, S., Sakuno, Y., Taniguchi, N., and Iwashita, H. (2021). Reproduction of the marine debris distribution in the Seto Inland Sea immediately after the July 2018 heavy rains in Western Japan using multidate Landsat-8 data. Remote Sens. 13 (24), 5048. doi:10.3390/rs13245048
Svejkovsky, J., and Shandley, J. (2001). Detection of offshore plankton blooms with AVHRR and SAR imagery. Int. J. Remote Sens. 22 (2–3), 471–485. doi:10.1080/014311601450040
Tello, M., López-Martínez, C., and Mallorqui, J. J. (2005). A novel algorithm for ship detection in SAR imagery based on the wavelet transform. IEEE Geoscience Remote Sens. Lett. 2 (2), 201–205. doi:10.1109/lgrs.2005.845033
Thamaga, K. H., and Dube, T. (2018). Remote sensing of invasive water hyacinth (Eichhornia crassipes): a review on applications and challenges. Remote Sens. Appl. Soc. Environ. 10, 36–46. doi:10.1016/j.rsase.2018.02.005
Topouzelis, K., Papakonstantinou, A., and Garaba, S. P. (2019). Detection of floating plastics from satellite and unmanned aerial systems (Plastic Litter Project 2018). Int. J. Appl. Earth Observat. Geoinformat. 79, 175–183. doi:10.1016/j.jag.2019.03.011
Topouzelis, K., Papageorgiou, D., Karagaitanakis, A., Papakonstantinou, A., and Arias Ballesteros, M. (2020). Remote sensing of Sea surface artificial floating plastic targets with Sentinel-2 and unmanned aerial systems (plastic litter Project 2019). Remote Sens. 12 (12), 2013. doi:10.3390/rs12122013
Touzi, R., Lopes, A., and Bousquet, P. (1988). A statistical and geometrical edge detector for SAR images. IEEE Trans. Geoscience Remote Sens. 26 (6), 764–773. doi:10.1109/36.7708
Uhlig, G., and Sahling, G. (1990). Long-term studies on Noctiluca scintillans in the German Bight population dynamics and red tide phenomena 1968–1988. Neth. J. Sea Res. 25 (1), 101–112. doi:10.1016/0077-7579(90)90012-6
Vanhellmont, Q., and Ruddick, K. (2016). Acolite for Sentinel-2: aquatic applications of MSI imagery. Living Planet Symp. 740, 55.
Villamagna, A. M., and Murphy, B. R. (2010). Ecological and socio-economic impacts of invasive water hyacinth (Eichhornia crassipes): a review. Freshw. Biol. 55 (2), 282–298. doi:10.1111/j.1365-2427.2009.02294.x
Villareal, T. A., and Carpenter, E. J. (1990). Diel buoyancy regulation in the marine diazotrophic cyanobacterium Trichodesmium thiebautii. Limnol. Oceanogr. 35 (8), 1832–1837. doi:10.4319/lo.1990.35.8.1832
Wackerman, C. C., Friedman, K. S., Pichel, W. G., Clemente-Colón, P., and Li, X. (2001). Automatic detection of ships in RADARSAT-1 SAR imagery. Can. J. Remote Sens. 27 (5), 371–378. doi:10.1080/07038992.2001.10854879
Wang, M., and Hu, C. (2016). Mapping and quantifying Sargassum distribution and coverage in the Central West Atlantic using MODIS observations. Remote Sens. Environ. 183, 350–367. doi:10.1016/j.rse.2016.04.019
Wang, M., Hu, C., Barnes, B. B., Mitchum, G., Lapointe, B., and Montoya, J. P. (2019). The great Atlantic Sargassum belt. Science 365 (6448), 83–87. doi:10.1126/science.aaw7912
Wu, L., Wang, L., Min, L., Hou, W., Guo, Z., Zhao, J., et al. (2018). Discrimination of algal-bloom using spaceborne SAR observations of Great Lakes in China. Remote Sens. 10 (5), 767. doi:10.3390/rs10050767
Wu, X.-F., Shen, C.-Y., Fu, C.-Z., Yang, N., Wang, P.-Z., Eimanifar, A., et al. (2022). Cyst size variability in invasive American Artemia franciscana Kellogg, 1906 (Branchiopoda, Anostraca) in Asia: a commercial approach. Crustaceana 95, 573–584. doi:10.1163/15685403-bja10206
Xing, Q., Guo, R., Wu, L., An, D., Cong, M., Qin, S., et al. (2017). High-Resolution satellite observations of a new hazard of golden tides caused by floating Sargassum in Winter in the yellow Sea. IEEE Geoscience Remote Sens. Lett. 14 (10), 1815–1819. doi:10.1109/LGRS.2017.2737079
Keywords: high resolution, macroalgae, plastic, remote sensing, SAR, X-band
Citation: Hadjal M, Barnes BB, Hu C, Qi L, Papageorgiou D and Topouzelis K (2025) Detection potential of floating matter in high-resolution X-band SAR data: initial results with visual interpretations. Front. Remote Sens. 6:1693286. doi: 10.3389/frsen.2025.1693286
Received: 26 August 2025; Accepted: 28 October 2025;
Published: 16 December 2025.
Edited by:
Cláudia Maria Almeida, National Institute of Space Research (INPE), BrazilReviewed by:
Maged Marghany, Universitas Malikussaleh, IndonesiaArnaldo Silva, Federal University of Para, Brazil
Copyright © 2025 Hadjal, Barnes, Hu, Qi, Papageorgiou and Topouzelis. This is an open-access article distributed under the terms of the Creative Commons Attribution License (CC BY). The use, distribution or reproduction in other forums is permitted, provided the original author(s) and the copyright owner(s) are credited and that the original publication in this journal is cited, in accordance with accepted academic practice. No use, distribution or reproduction is permitted which does not comply with these terms.
*Correspondence: Brian B. Barnes, YmJhcm5lczRAdXNmLmVkdQ==