 Qianrui Huang1
 Xinyi Ding
 Huicong Jia
- 1Yunnan Land and Resources Vocational College, Kunming, China
- 2International Research Center of Big Data for Sustainable Development Goals, Beijing, China
- 3Key laboratory of digital earth science, Aerospace Information Research Institute, Chinese academy of sciences, Beijing, China
- 4Chenjiang Laboratory, Chenzhou, China
- 5University of Chinese Academy of Sciences, Beijing, China
Introduction: Coffee, a vital beverage and cultural symbol, significantly influences global economic and cultural development. Due to the characteristics of agricultural production activities, such as areas, significant differences, and relatively low economic benefits per unit area, Traditional ground surveys often fail to accurately capture coffee crop distribution due to the large-scale, regionally varied, and economically modest nature of agricultural production. Remote sensing offers a promising alternative but faces challenges in distinguishing coffee from vegetation with similar spectral characteristics, especially in areas with complex land cover and dense canopies.
Methods: This study focuses on Pu’er City in Yunnan Province, China, renowned as the ‘golden belt’ of global coffee cultivation. Using Sentinel-2 remote sensing imagery, we analyzed key phenological features through time-series curves of the Normalized Difference Vegetation Index (NDVI), Ratio Vegetation Index (RVI), and Difference Vegetation Index (DVI). To ensure a balanced and representative dataset, interpretation keys were established from 1,617 field-measured sampling points, yielding a total of 4,000 coffee and non-coffee samples. Employing the Random Forest (RF) algorithm, we constructed a refined coffee crop extraction model incorporating spectral, texture, terrain, and regional pattern features.
Results: The findings indicate: (1) Incorporating administrative division features and using a larger texture window size (5 × 5) enhances model accuracy, achieving an overall accuracy (OA) of 93.92% and a Kappa coefficient of 0.8783. (2) The four-period segmentation approach significantly improved accuracy, with the highest OA reaching 94.80%, identifying October to December (coffee fruiting season) as the most critical period for classification. (3) Administrative Division Features (ID), Topographical features (SLOPE) and vegetation indices (NDVI and DVI) were the most crucial for coffee classification, while texture features, except for Sum Average (SAVG), generally had lower importance.
Discussion: This study validates the effectiveness of remote sensing in monitoring and mapping coffee cultivation. The proposed feature input strategy shows strong potential for application in other regions with similar agro-ecological conditions, supporting precision agricultural management and promoting sustainable coffee farming practices.
1 Introduction
Remote sensing technology has gained widespread application in agricultural research, offering robust technical support for crop planting information extraction (Hunt et al., 2020). As one of the most important cash crops worldwide, coffee provides livelihoods for more than 125 million people across over 70 producing countries, particularly in tropical and subtropical regions (Krishnan, 2017). Its economic value extends far beyond primary production, supporting large downstream industries such as processing, trade, and retail. However, despite its global economic significance, coffee has received relatively limited attention in remote sensing-based studies concerning its cultivation information. The unique characteristics of coffee cultivation—including its extensive growing areas, pronounced regional variations, and relatively low economic returns per unit area—present significant challenges for traditional ground-based survey methods in accurately mapping coffee distribution to meet practical demands (Zhang et al., 2015). From a phenological perspective, coffee exhibits distinct growth stages—including flowering, fruit development, ripening, and harvesting—that vary by region and are strongly influenced by climatic factors such as temperature and precipitation (DaMatta et al., 2007). These phenological variations directly affect canopy structure and spectral reflectance characteristics, thereby influencing the performance of remote sensing-based identification and classification of coffee plantations. Consequently, implementing timely remote sensing monitoring of coffee cultivation areas and precisely acquiring planting information and spatial distribution patterns of coffee hold substantial importance for advancing the global coffee industry’s development.
In recent years, remote sensing technology has demonstrated significant potential in both coffee plantation monitoring and yield prediction. Regarding plantation monitoring, Ortega-Huerta et al. achieved successful differentiation between distinct coffee plantation types (“open-canopy” and “closed-canopy”) and other land cover categories through hybrid classification of multi-temporal Landsat TM satellite imagery (Ortega-Huerta et al., 2012). Building upon this foundation, Martins et al. identified the critical importance of red, red-edge, and near-infrared spectral bands in distinguishing healthy coffee plants from those with varying infection levels, effectively mapping the spatial distribution of healthy, moderately infected, and severely infected coffee plants, thereby highlighting the capability of remote sensing in plant health assessment (Martins et al., 2017). Chemura et al. employed VIS/NIR bands coupled with random forest (RF) algorithms to investigate water stress effects on coffee plants, demonstrating that selected reflectance-sensitive bands exhibited strong predictive capabilities for detecting coffee water content (Chemura et al., 2017). Tridawati et al. integrated multi-resolution, multi-temporal, and multi-sensor remote sensing data to derive 29 variables, subsequently utilizing RF algorithms to map Indonesian coffee plantations and identify 12 key predictive variables (Tridawati et al., 2020). From an ecological perspective, Zhang Mingda et al. conducted a sophisticated ecological suitability analysis and zoning study for Yunnan’s small-grain coffee cultivation areas (Zhang et al., 2020). Their methodology, based on the ArcGIS platform, incorporated climatic, soil, and topographic factors through Analytic Hierarchy Process (AHP) analysis. Velásquez et al. developed an innovative cyber-physical data collection system that synergized remote sensing data with wireless sensor networks, enabling early detection of coffee leaf rust (CLR) and providing novel technical solutions for disease control (Velásquez et al., 2021). Escobar-López et al. conducted a comprehensive review of remote sensing applications in identifying Coffee Agroforestry Systems (AFS) from 2000 to 2020 (Escobar-López et al., 2024). Their work emphasized the influence of shade tree density and species composition on classification accuracy, providing valuable insights for sustainable coffee cultivation practices.
Although remote sensing technology has made some achievements in coffee monitoring, there are still problems such as how to solve the problem of coffee sample concentration, how to accurately extract key information of coffee production, how to deal with the fusion of data from different sources and resolutions, and how to combine temporal and geographic information to improve the accuracy of prediction (Bernardes et al., 2012; Kouadio et al., 2021; de Carvalho Alves et al., 2022; Van Viet and Thuy, 2023). In China, Yunnan Province serves as the country’s primary coffee-growing region, accounting for more than 98% of the national coffee production, with Pu’er City recognized as its core production area (Lv et al., 2025). This study uses Sentinel-2 as the primary remote sensing data source for the study area, supplemented by vector boundary data, land use data, and topographic data of the region. Spectral, texture, terrain, and township features are extracted and combined with field survey data to construct a fine-extraction model for coffee crops in Pu’er City, resulting in a thematic map of coffee planting information.
The objective of this study is threefold: (1) assess the importance of various features in coffee crop classification, and develop strategies to mitigate misclassification errors; (2) develop a high-accuracy coffee crop extraction model leveraging phenological features and high-resolution remote sensing data; and (3) construct a fine coffee crop mapping framework by incorporating multi-scale spatial and temporal features, ultimately generating a detailed spatial distribution map of coffee plantations in Pu’er City. Through this approach, we aim to systematically assess the relative importance of different features, optimize feature extraction strategies, and determine the optimal time periods for accurate classification, producing a replicable approach for mapping coffee plantations that can be applied to other regions with similar agro-ecological conditions, thereby supporting sustainable coffee cultivation and precision agricultural management.
2 Materials and methods
2.1 Study area
Pu’er City is located in southwestern Yunnan Province, China, spanning latitudes 22°02′N to 24°50′N and longitudes 99°09′E to 102°19′E (Zhang et al., 2020). With a total area of 44,300 km2, the city governs Simao District and nine autonomous counties. This region features a subtropical highland monsoon climate, characterized by a combination of low-latitude, monsoon, and plateau climatic attributes (Chen et al., 2018). It is characterized by pronounced diurnal temperature variations, warm winters, cool summers, abundant rainfall, and ample sunlight, all of which provide an optimal environment for coffee cultivation.
Pu’er exhibits a diverse topography, with elevations decreasing from north to south, leading to a broad altitudinal range (Li et al., 2002). The forest coverage in Pu’er exceeds 64.9%. The region’s soil types are diverse, primarily comprising red soil, lateritic red soil, and latosol, with pH values ranging from 5.5 to 6.5 (Zhang et al., 2020). These environmental factors collectively create optimal conditions for coffee cultivation.
2.2 Data source
Arabica coffee cultivation in Yunnan is primarily concentrated in the southern and western regions, including Pu’er, Xishuangbanna, Wenshan, Baoshan, Dehong, and Lincang. Although Pu’er is renowned for its tea production, it has a 150-year history of coffee cultivation. Since the late 1990s, Pu’er has prioritized coffee cultivation as a key industry to adjust its industrial structure to promote economic development and enhance farmers’ incomes. Coffee cultivation spans 54 townships across nine counties and one district in Pu’er City (Zhang et al., 2017; Lamquin et al., 2018). In Pu’er, coffee cultivation is primarily concentrated along the Lancang River and in mountainous areas, particularly in Menglian County, Lancang County, Ximeng County, Simao District, and Mojiang County. As the core coffee-producing region in China, Pu’er plays a vital role in supporting the country’s coffee supply chain and promoting rural industrial transformation. In recent years, the coffee industry has emerged as a crucial driver of rural revitalization and industrial development in Pu’er City. In 2022, in Menglian Dai, Lahu, and Wa Autonomous County of Pu’er City, the coffee industry increased the income of local people by 150 million yuan (Thao et al., 2022), attracting a large number of talented individuals to return home to start businesses, and promoting the sustainable development of the local economy and society. Figure 1 illustrates the geographical location of the study area. Data Sources.
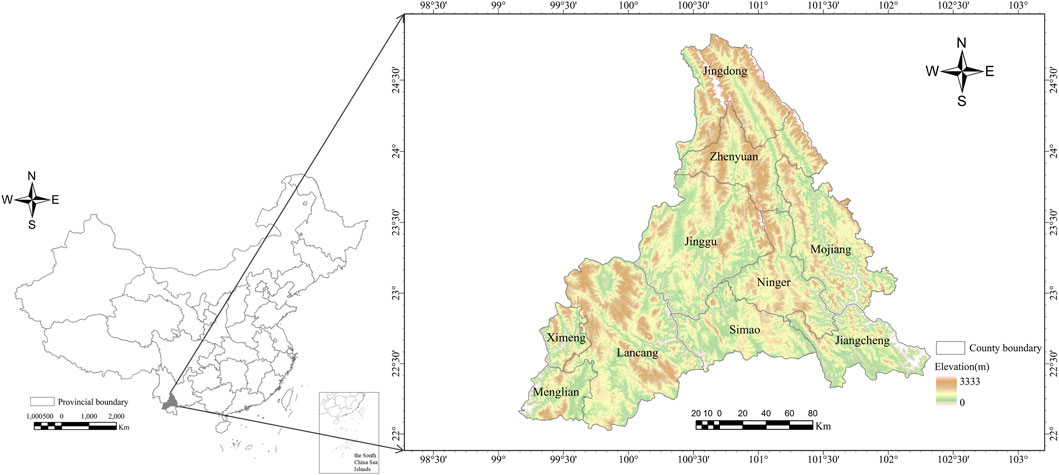
Figure 1. Location map of the study area.
2.2.1 Selection of sample points
Field surveys were conducted to collect representative samples of key land surface features in Pu’er City, Yunnan Province (Figure 2). The sampling routes covered major transportation corridors, including Provincial Road 221, National Highway 215, the Kunming-Mohei Expressway, the Jiangcheng-Menglian Expressway, the Cemeng Line, and the Kadong Line.
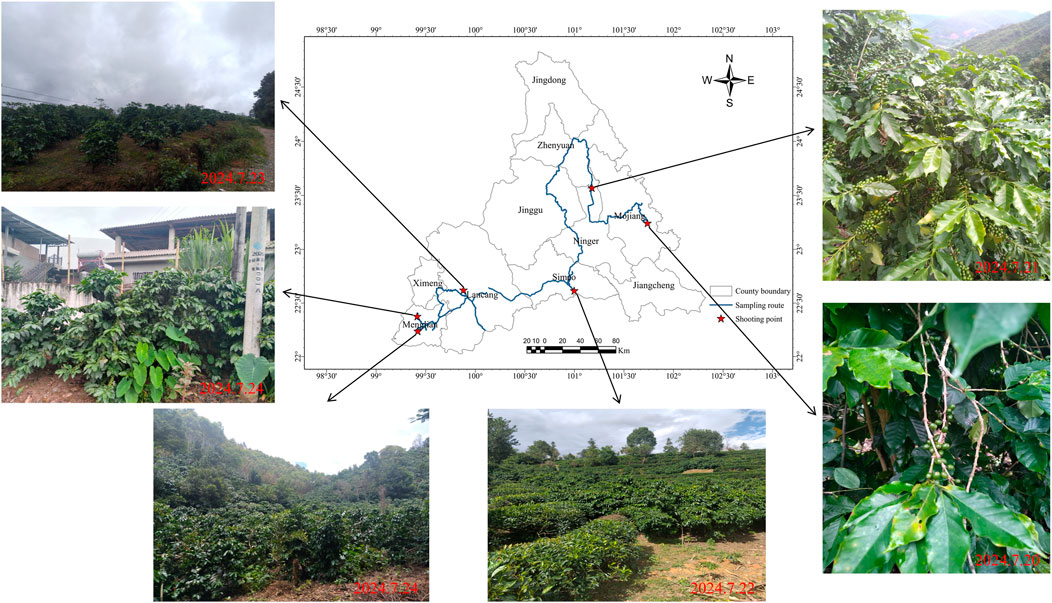
Figure 2. Sampling routes and typical coffee photo points.
A total of 1,617 field-measured sampling points were collected during field surveys, including 421 coffee points and 1,196 non-coffee points. In conjunction with high-resolution Google Earth imagery, visual interpretation keys were developed, as presented in Table 1. Based on these interpretation keys, Regions of Interest (ROIs) were subsequently delineated, comprising 251 coffee ROIs and 437 non-coffee ROIs (including forest, cropland, buildings, water bodies, etc.). To reduce the potential bias caused by class imbalance, a balanced dataset was constructed by randomly selecting 2,000 coffee points and 2,000 non-coffee points within the delineated ROIs. The detailed statistics of field-measured sampling points, ROIs, and input samples are summarized in Table 2. These balanced samples were subsequently used as the input dataset for model training and validation, with their spatial distribution depicted in Figure 3. In this study, the classifier was trained using 80% of the samples, with the remaining 20% reserved for validation, following a standard random split to ensure that both training and validation sets adequately represent the main features of the study area (Melichar et al., 2023; Schulthess et al., 2023; Zhang et al., 2024).
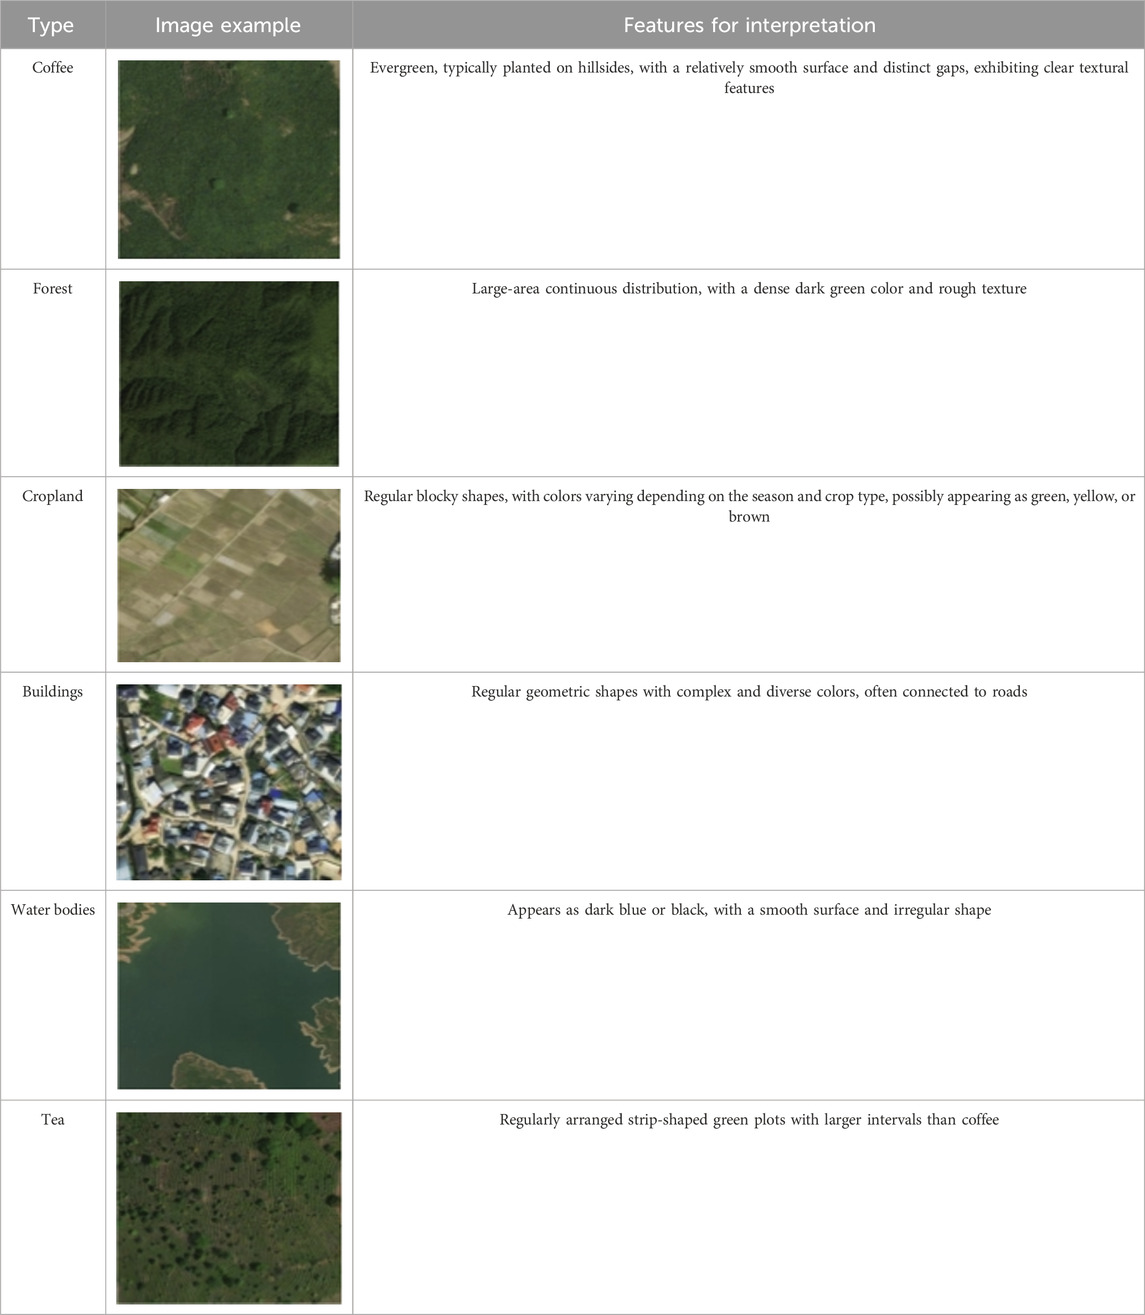
Table 1. Visual interpretation key for typical ground features.
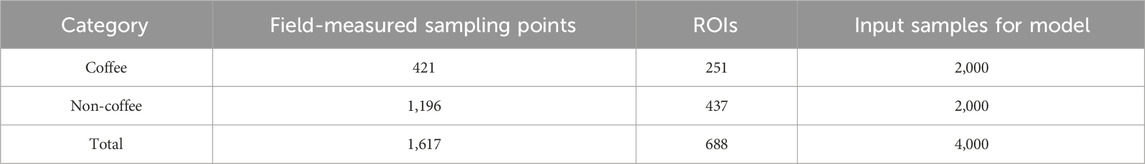
Table 2. Statistics of field-measured sampling points, ROIs, and input samples for classification model.
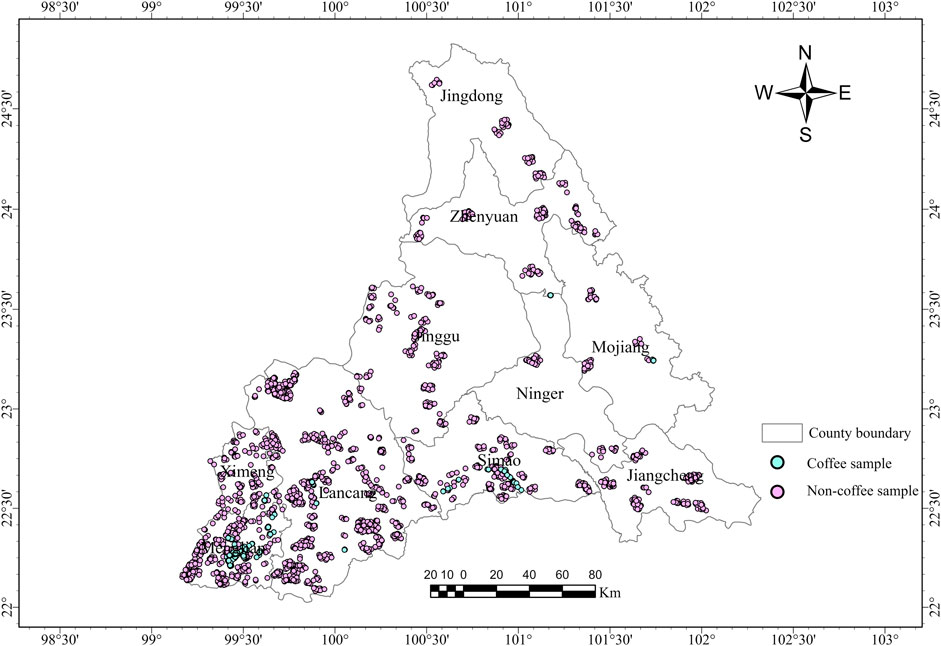
Figure 3. Distribution of sample points (Coffee points:2,000; Non-coffee points:2,000)
2.2.2 Satellite imagery data
The Sentinel-2 satellite system, a key component of the European Space Agency’s Copernicus program, comprises two satellites: Sentinel-2A and Sentinel-2B (Li and Roy, 2017). It is equipped with a multispectral imager comprising 13 bands that span various wavelength ranges, including visible, near-infrared, and short-wave infrared, with spatial resolutions of 10 m, 20 m, and 60 m (Liu et al., 2018). The multi-spectral and multi-resolution imaging capabilities of Sentinel-2 make it widely utilized for land cover classification, change detection, and environmental monitoring.
Sentinel-2 provides a range of product levels, each with varying degrees of data processing and correction, tailored for different applications (Xiong et al., 2017). This study selected Sentinel-2 Level-2A satellite imagery from 2023 (2023-01-01 to 2023-12-31) as the optical data source. The imagery, referenced as “COPERNICUS/S2_SR_HARMONIZED” in Google Earth Engine, was first filtered by the study area and cloud coverage, excluding scenes with “CLOUDY_PIXEL_PERCENTAGE” greater than 35%. Cloud and cirrus pixels were then masked using the “QA60” band, effectively mitigating the influence of clouds and cloud shadows, and pixel values were scaled from integers (0-10000) to actual reflectance (0-1). This processing resulted in a Sentinel-2 image dataset for the study area, comprising 472 scenes in total. The number of images utilized in this study is presented in Table 3. For feature calculation, median aggregation was applied across all valid observations within each time period to reduce the influence of outliers and residual cloud contamination.

Table 3. The statistics of the number of images for different months.
2.2.3 Auxiliary data
2.2.3.1 Topographic data
Digital Elevation Models (DEMs) are essential for classification tasks, particularly in fields such as land use, vegetation types, and geomorphological classification (Claverie et al., 2018). The terrain information they provide effectively complements the limitations of optical remote sensing data, enhancing both the accuracy and detail of classification and, ultimately, improving overall classification performance (Maurya et al., 2021).
NASADEM (NASA Digital Elevation Model), a reprocessed version of SRTM (Shuttle Radar Topography Mission) data, offers advantages, including high resolution, multi-source data fusion, extensive coverage, and superior data quality (Olofsson et al., 2014). This study utilizes NASADEM as auxiliary data for classification.
2.2.3.2 Land use data
The Esri 10 m Land Use data (https://livingatlas.arcgis.com/landcoverexplorer) provides a global land cover map at a spatial resolution of 10 m, encompassing nine land cover classes: water, trees, flooded vegetation, cropland, built-up areas, bare ground, snow/ice, clouds, and rangeland (Karra et al., 2021). To improve classification performance, this study utilizes the data to generate a mask by extracting forest land, flooded vegetation, cropland, and rangeland, using the actual coffee distribution as a reference.
2.2.3.3 Vector boundary data
The administrative division data utilized in this study is sourced from the China Admin Division SHP-master dataset, in ESRI Shapefile format, and comprises four levels of administrative divisions: country, province/municipality, city, and district/county.
2.3 Feature selection
2.3.1 Spectral features
The vegetation index is employed as a spectral feature for extracting coffee plantation information, primarily due to the significant differences in spectral reflectance characteristics between coffee crops and other land cover types (e.g., bare soil, water bodies, buildings) (Moguel and Toledo, 1999). It effectively differentiates vegetated areas from non-vegetated areas and reflects the growth conditions of the crops. As a typical form of green vegetation, coffee crops exhibit distinctive spectral response characteristics (Rizvi et al., 2013). The application of vegetation indices enhances classification accuracy and facilitates the precise extraction of coffee plantation areas.
Among the various vegetation indices, the Normalized Difference Vegetation Index (NDVI), Ratio Vegetation Index (RVI), and Difference Vegetation Index (DVI) were incorporated as spectral features in the information extraction model (Hailu et al., 2015; Hunt et al., 2020; Tridawati et al., 2020; Arteaga-López et al., 2022), selected for their complementary strengths in coffee plantation mapping. NDVI is highly sensitive to chlorophyll content and overall vegetation vigor (Chen et al., 2021; Tian et al., 2023), RVI enhances contrast in areas with dense canopies (He et al., 2023), and DVI mitigates soil background effects (Zeng et al., 2021), together providing robust discrimination of coffee crops across heterogeneous landscapes. Compared to NDVI, both RVI and DVI are more suitable for areas with dense vegetation coverage. The calculation formulas are shown in Equations 1–3.
Here,
The temporal characteristics of vegetation indices reflect growth conditions and seasonal variations over different periods, thereby enhancing the model’s capacity to capture long-term trends and seasonal fluctuations. This approach also minimizes errors induced by environmental changes or temporary anomalies (e.g., cloud cover) in single-date data, offering more precise criteria for distinguishing various crop types and enhancing classification accuracy and robustness.
The growth period of coffee in Yunnan is influenced by factors such as altitude, variety, and annual climatic conditions, leading to some variations. In the primary coffee-producing areas of Pu’er City, Yunnan, the flowering period typically spans from March to May. However, this period can be influenced by the timing of the rainy season and temperature, which may cause variations in its onset. Flowering typically concentrates following several rainfall events, leading to multiple flowering periods. After the flowers wither, the coffee plants enter the young fruit (or pinhead) period, which typically lasts from April to June. The fruit expansion period, during which the fruit rapidly grows and increases in size, primarily occurs from May to September. The maturation period typically spans from October to March of the following year. During this period, the coffee fruit begins to change color, transitioning from green to yellow, orange, and eventually red (or deep red, with some varieties turning yellow). Areas with lower altitudes and higher temperatures typically mature earlier, while areas at higher altitudes and lower temperatures mature later. The harvesting period significantly overlaps with the maturation period, typically beginning in late October and lasting until March or April of the following year, or even later.
This study comprehensively considered the image coverage within the study area and proposed two approaches: (1) To maximize temporal resolution, image data from seven time periods—January, February, March, April, May–June, July–September, and October–December—were included in the classification analysis; (2) To identify seasonal patterns, image data from four time periods—January–March, April–June, July–September, and October–December—were included in the analysis.
2.3.2 Texture features
Texture features are quantified by statistically analyzing the variations in gray levels across multiple pixel regions in an image. Unlike features based on individual pixel values, texture features reflect the structural information of pixel arrangements within local spatial areas (Gomez et al., 2010). In the context of coffee plantation mapping, texture features are particularly useful because coffee canopies exhibit distinct spatial patterns and structural characteristics that differ from surrounding vegetation, bare soil, or built-up areas. They effectively describe differences in coarseness, density, and other image characteristics, possess rotation invariance, and demonstrate strong resistance to noise. Texture features are widely applicable to tasks such as land cover classification, object recognition, and more (Gaertner et al., 2017).
In 1973, Haralick et al. introduced the Gray-Level Co-occurrence Matrix (GLCM) as a method to describe texture features (Haralick et al., 1973). They proposed calculating the co-occurrence matrix by statistically analyzing the gray level combinations of adjacent pixels in an image. The GLCM is a matrix where each element represents the frequency of specific gray level combinations occurring at certain directions and distances. Based on this matrix, multiple texture features can be derived. A total of 18 texture feature quantities (referred to as second-order statistics) can be derived using the Gray-Level Co-occurrence Matrix.
The B3, B4, and B8 bands of the Sentinel-2 imagery are selected, and a weighted linear combination is performed to obtain the grayscale image Gray, which serves as the input image for the Gray-Level Co-occurrence Matrix (GLCM). This approach simplifies the calculation complexity and avoids the high computational load associated with directly processing multi-band data. It is also consistent with the GLCM framework established by Haralick et al. (1973), which requires a single-channel grayscale image as input for texture feature extraction. The formula is as follows Equation 4:
Here,
Using the GLCM, nine statistical features are extracted, including angular second moment (ASM), contrast (CON), correlation (CORR), entropy (ENT), variance (VAR), inverse difference moment (IDM), sum average (SAVG), sum entropy (SENT), and sum variance (SVAR). These features were chosen to comprehensively capture various aspects of texture, such as homogeneity, contrast, linear dependencies, randomness, and variability in gray-level distributions, allowing the model to effectively distinguish coffee plantations from other land cover types, particularly in areas with complex spatial patterns or heterogeneous vegetation structures. The definitions of each statistical feature are provided in Table 4.
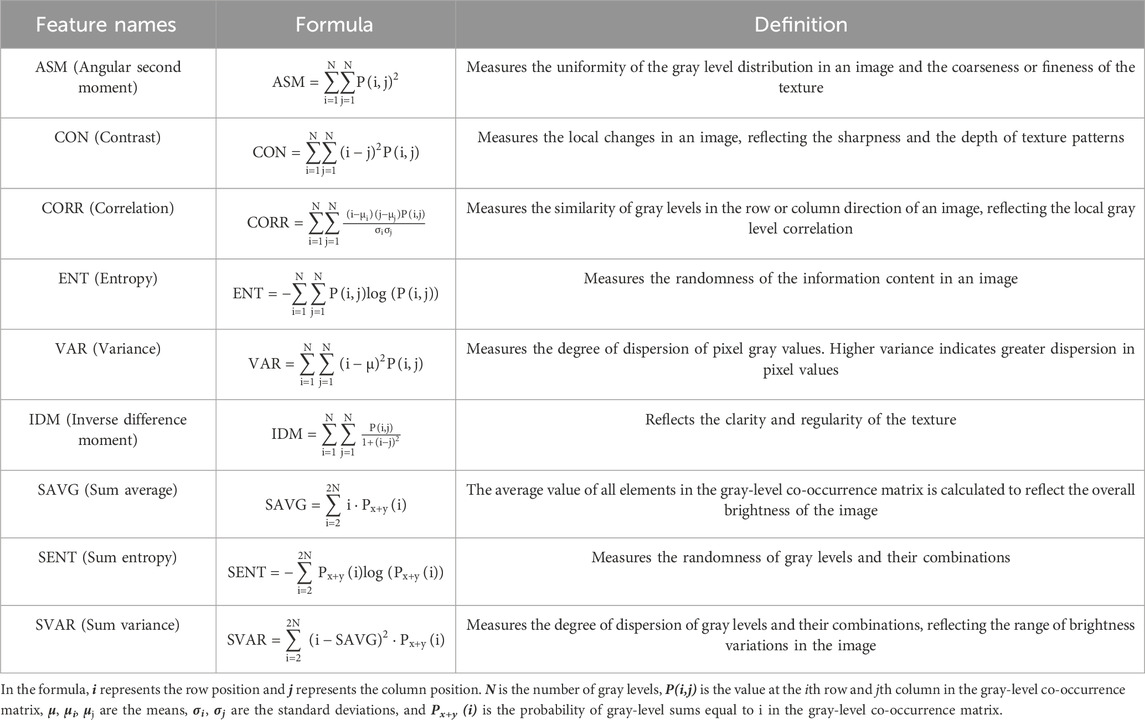
Table 4. Types and definitions of texture features based on GLCM.
2.3.3 Topographic features
Slope reflects the steepness of the terrain, directly influencing water runoff rates and soil retention capacity, and plays a significant role in determining crop suitability (DaMatta, 2004; Wang et al., 2023). Field surveys indicate that Pu’er coffee is primarily grown on steep mountainous slopes, while flatlands are mainly used for cultivating crops such as corn, tobacco, and sugarcane. Aspect indicates the orientation of a plot of land and influences the duration and intensity of sunlight exposure. Coffee plants are sensitive to light conditions, and an optimal aspect can provide sufficient sunlight, thereby promoting photosynthesis and overall plant vigor (Bernardes et al., 2012; Tridawati et al., 2020). Slope and aspect were incorporated as topographic features due to their direct influence on microclimatic conditions and coffee growth suitability. This study employs NASADEM elevation data to extract slope and aspect information for classification feature construction. Slope represents the rate of vertical height change at any point on the terrain surface, typically expressed in degrees (0°–90°). It is estimated by analyzing the elevation differences between neighboring pixels (Equation 5). Aspect is calculated as shown in Equation 6.
where Δh represents the elevation change between adjacent pixels and d represents the horizontal distance between them.
Where
To facilitate subsequent analysis, slope aspect values ranging from 0° to 360° are normalized to a range between −1 and 1 using the following Equation 7:
Where Aspect represents the result calculated from Equation 6.
2.3.4 Administrative division feature
Coffee cultivation typically follows a distinct regional clustering pattern (Zhang et al., 2017; Thao et al., 2022). To capture these spatially structured variations, a unique identifier (ID) was assigned to each of the 145 townships in the region and incorporated as an administrative division feature in the model. Including township-level information helps the model account for regional differences that may not be fully represented by spectral, texture, or topographic features alone. This feature enables the classification model to better reflect localized environmental and socio-economic influences on coffee cultivation, improving the precision and robustness of coffee plantation mapping.
2.4 Random forest classification
The RF algorithm, a typical Bagging ensemble learning technique, is based on decision tree models. Its design aims to improve the model’s performance and generalization ability by constructing multiple decision trees (each trained and predicted independently) and combining their results through voting or averaging, using the “wisdom of the crowd” to handle classification and regression tasks (Hao et al., 2015; Hadavand et al., 2017). The algorithm uses random sampling to generate multiple decision trees from the original dataset, with each tree trained and predicted independently. The final classification result is determined through a voting mechanism. The core advantage of this method lies in reducing the risk of overfitting that may result from a single model. By integrating decisions from multiple models, it improves classification accuracy and robustness (Bourgoin et al., 2020; Fu et al., 2023).
In coffee planting information extraction research, the RF classifier has been shown to effectively handle high-dimensional feature data, including spectral, terrain, and texture features (Chemura et al., 2017). By inputting relevant features into the RF model, it accurately identifies coffee planting areas. The number of trees was set to 30, while all other parameters were kept as the default settings of Google Earth Engine.
2.5 Accuracy assessment
The validation samples were used to generate the confusion matrix, and multiple performance evaluation metrics were calculated, including overall accuracy (OA), user’s accuracy (UA), producer’s accuracy (PA), F1 score, and Kappa coefficient (Kawakubo and Pérez Machado, 2016; Jia et al., 2023; Zhang et al., 2026). These metrics provide complementary insights into classification performance: OA measures the overall proportion of correctly classified samples (Equation 8), UA indicates the reliability of a class from the user’s perspective (Equation 9), PA reflects the completeness of correctly identifying each class (Equation 10), F1 score balances precision and recall for a robust assessment (Equation 11), and Kappa coefficient accounts for chance agreement, providing a more stringent evaluation of classification accuracy (Equation 12). The formulas for these calculations are as follows:
Where, N is the total number of samples, TP is true positive, representing the number of samples correctly classified as positive; TN is true negative, representing the number of samples correctly classified as negative; FP is false positive, representing the number of samples incorrectly classified as positive; FN is false negative, representing the number of samples incorrectly classified as negative; p0 is overall accuracy; pe is the expected accuracy under random classification. The calculation formula is as follows Equation 13:
Where A is the number of samples predicted as category i, B is the number of samples actually belonging to category i, and N is the total number of samples.
3 Results
3.1 Accuracy analysis
To comprehensively evaluate the contribution of different input features and phenological divisions to classification performance, a series of comparative analyses were designed following the concept of ablation experiments. Table 5 presents the evaluation metrics of the classification model, which uses spectral index temporal features divided into seven time periods. The model considers different texture feature window sizes (5 × 5 and 3 × 3) and whether administrative division features are incorporated. The analysis reveals that when administrative division features are incorporated, the classification results improve regardless of whether the window size is 3 × 3 or 5 × 5. The OA reaches the highest value of 93.92%, and the Kappa coefficient is 0.8783. When the texture window size increases from 3 × 3 to 5 × 5, other than a decrease in UA, the remaining indicators show a slight improvement, regardless of whether administrative division features are included. In summary, using a larger window (5 × 5) in combination with administrative division features enhances both the overall accuracy and consistency of the model.
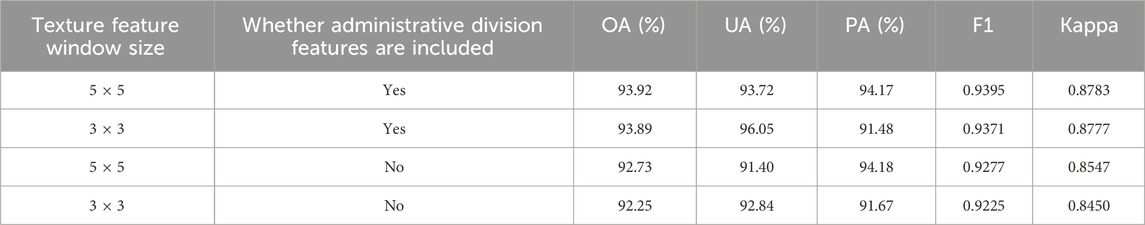
Table 5. Classification evaluation metrics under different sliding window sizes and whether administrative division features are included.
The analysis results indicate that the OA of the classification models varies across different synthetic months (Table 6). The highest OA is obtained when the spectral features are divided into four periods, achieving an accuracy of 94.80%. This is followed by the October-December period, which achieves an OA of 92.26%. UA and PA also vary across different periods. The highest UA is achieved when the spectral features are divided into four periods, reaching an accuracy of 89.86%. The highest PA is achieved in the October-December period, reaching an accuracy of 93.35%. The F1 score and Kappa coefficient show similar trends, with the highest values achieved when the spectral features are divided into four periods. The annual composite model achieves an OA of 91.46%, which is lower than the OA obtained when the spectral features are divided into four periods. Overall, the results suggest that dividing the spectral features into four periods enhances the classification model’s accuracy, with the October-December period being the most critical for classification.
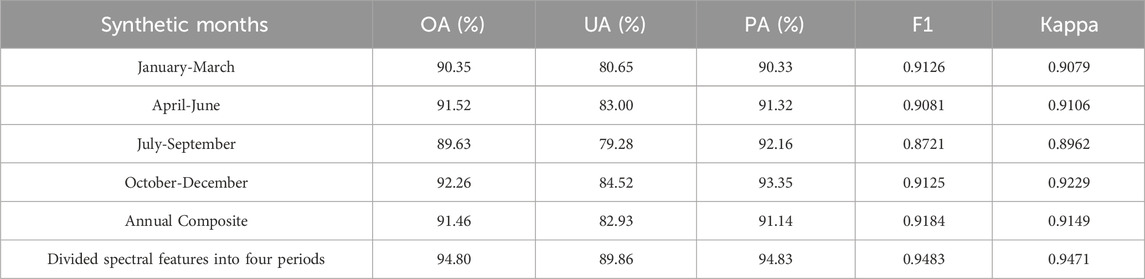
Table 6. Comparison of model accuracy with input divided into four periods versus annual composite input.
Comparing Table 6 with Table 5, it is evident that dividing the spectral features into four periods yields better classification performance than dividing them into seven periods. This is likely due to the four-period division’s better alignment with seasonal patterns, which leads to more consistent and accurate classification. In contrast, the seven-period division may introduce unnecessary noise and complexity without providing a significant improvement in the results.
3.2 Feature importance analysis
Based on the provided data, we analyzed the importance scores of various features across different time periods and the annual composite (Figure 4). The DVI shows peak importance during January-March (Score = 82.61) and July-September (Score = 82.86), with an annual composite score of around 75.84. NDVI exhibits the highest importance during the April-June period (Score = 87.05), with an annual composite score of 79.78, highlighting its critical role in the vegetative growth phase. RVI, in contrast, exhibits notably lower scores across all periods, indicating lower significance compared to other indices. SLOPE and ASPECT both demonstrate considerable importance. SLOPE achieving the highest score in July-September (Score = 98.10) and a relatively high score in January-March (Score = 90.72), with an annual composite score of 90.36. ASPECT maintains consistently high importance throughout the year, with an annual composite score of 77.22, underscoring its importance in landscape analysis. ASM, CONT, CORR, ENT, VAR, IDM, SAVG, SENT, SVAR, and ID each exhibit varying levels of importance across different periods, with some, such as SAVG and ID, demonstrating particularly high annual composite scores. For example, SAVG achieves the highest score during January-March (Score = 95.72) and has an annual composite score of 91.84, which suggests its usefulness in early-season analysis and overall trend assessment.
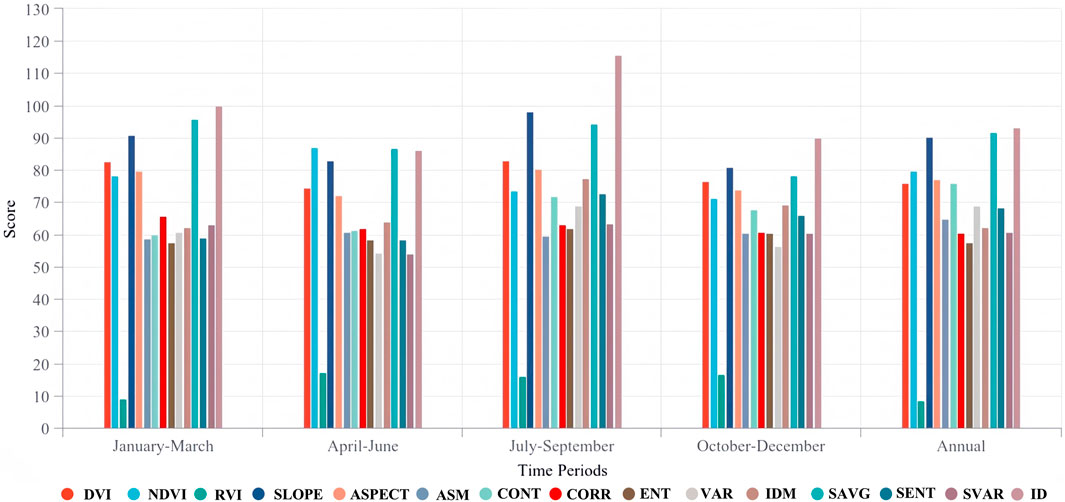
Figure 4. Feature importance scores for individual four periods and annual composite inputs.
In summary, certain features, such as DVI, NDVI, ASPECT, SLOPE, SAVG and ID, consistently exhibit high importance across various periods, while others, such as RVI and ENT, maintain relatively low importance. Among terrain features, SLOPE shows particularly high importance, reflecting its influence on soil moisture retention and light conditions, which are critical for mountain coffee cultivation. Among texture features, statistical measures such as SAVG also achieve relatively high scores, indicating that these second-order texture features can effectively complement spectral information and play a key role in distinguishing land cover types with similar spectral characteristics.
The analysis of feature importance scores, divided into four periods, reveals several key findings (Figure 5). Based on the criterion that importance scores exceed 35, 13 of the most important variables can be identified, including SLOPE, ID, SAVG, and others. SLOPE and ID consistently rank highly, with SLOPE having an importance score of 60.84 and ID at 58.63. This suggests that topographical features play a significant role in the analysis. Among the vegetation indices, NDVI demonstrates varied importance across periods, with the highest score in the April-June period (Score = 42.72) and the lowest in the January-March period (Score = 36.66). DVI follows a similar pattern, with the highest score in the July-September period (Score = 43.67) and the lowest in the October-December period (Score = 36.94). RVI, on the other hand, consistently exhibits low importance scores across all periods, suggesting it may not be a critical feature for this analysis. Texture features, such as ASM, CONT, and CORR, have relatively low importance scores, ranging from approximately 27–29, suggesting that they may not contribute significantly to the overall analysis. However, SAVG stands out among the texture features, with a higher importance score of 50.44, suggesting that it could be a valuable addition to the analysis.
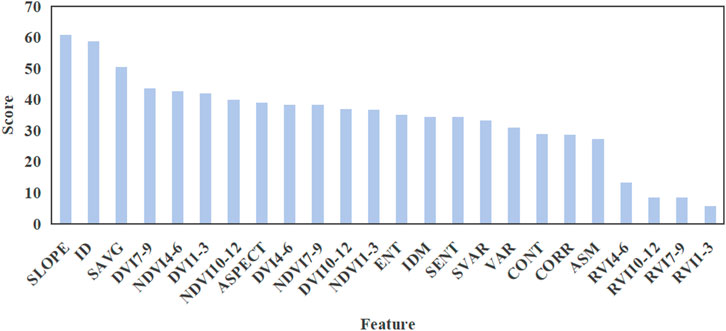
Figure 5. Feature importance scores for inputs divided into four time periods.
In summary, topographical features such as SLOPE and ID, along with vegetation indices like NDVI and DVI, appear to be the most crucial features. With the exception of SAVG, texture features generally have lower importance. These insights can inform feature selection and prioritization for more effective monitoring and management strategies.
3.3 Classification results and local analysis
By inputting spectral features, texture features (with a sliding window size of 5 × 5), terrain features, and administrative division features into the RF model, the coffee planting situation in Pu’er, Yunnan, is obtained, as shown in Figure 6. The total coffee plantation area extracted in this study is approximately 795,527 mu, slightly higher than the officially reported figure of 679,000 mu, which may result from minor misclassifications of spectrally or structurally similar vegetation such as tea trees and shrubs. Among the counties, extracted coffee areas are highest in Lancang, Jinggu, Menglian, and Simao, while Mojiang and Jingdong show relatively smaller areas, which is generally consistent with the results obtained from our field and online surveys. These comparisons support the overall reliability of our extraction results.
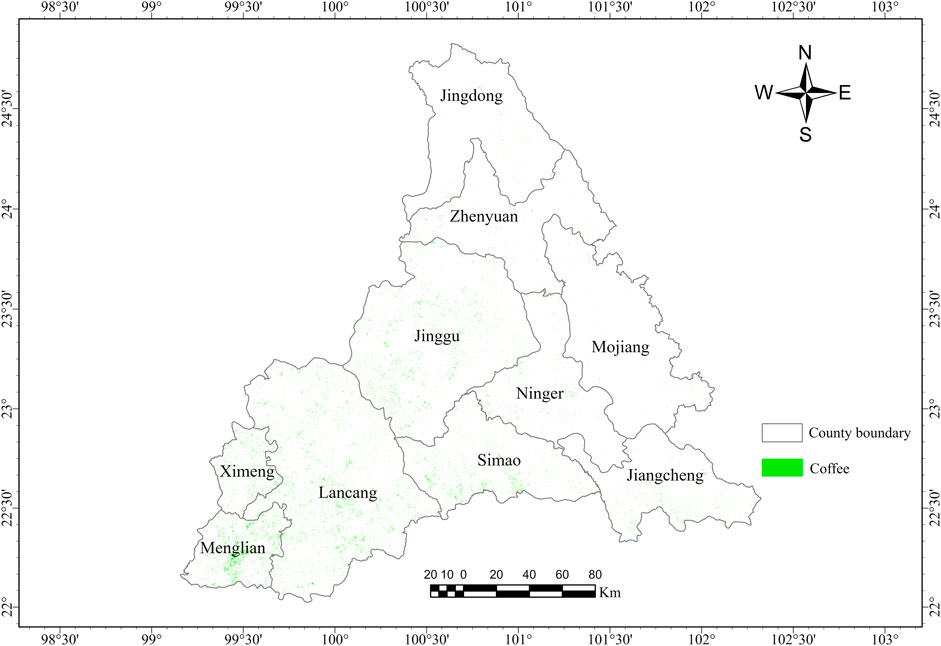
Figure 6. Classification result map.
A local magnification analysis was conducted on select areas and compared with Google Earth images, as shown in Figure 7. Figures 7A,B represent coffee-intensive planting areas, while Figure 7C represents a tea tree-intensive planting area. The comparison of Figures 7A,B reveals that in coffee-intensive planting areas, coffee plants are well distinguished from surrounding shrubs, forests, cropland, and other land cover types. However, in Figure 7C, tea tree features are similar to coffee, leading to many tea trees being misclassified as coffee.
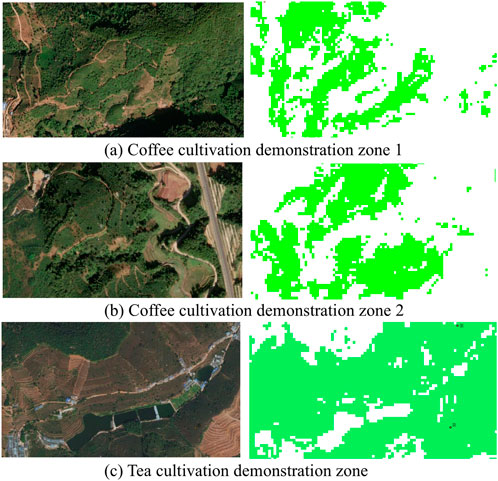
Figure 7. Comparison of Google Earth imagery (left) with classification results (right). (a) Coffee cultivation demonstration zone 1, (b) Coffee cultivation demonstration zone 2, (c) Tea cultivation demonstration zone.
3.4 Error analysis
Figure 8 illustrates coffee plantations under different planting patterns and densities: (a) low-density, (b) medium-density I, (c) medium-density II, and (d) high-density. Each pattern exhibits distinct spatial and textural characteristics in remote sensing images, reflecting variations in canopy coverage and planting arrangement, which complicates accurate extraction. The distinction between medium-density I and medium-density II arises from the presence of more shrubs in the former and fewer shrubs in the latter, representing two typical configurations observed in medium-density coffee-growing areas. In addition, coffee and evergreen shrubs share similar spectral and textural features, making it difficult to distinguish coffee plantations from surrounding shrub vegetation.
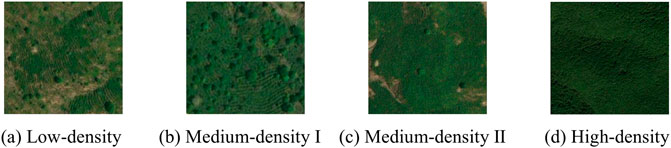
Figure 8. Patterns of coffee plantations with different densities in remote sensing images. (a) Low-density (b) Medium-density I (c) Medium-density II (d) High-density.
4 Discussion
4.1 Drivers of coffee classification performance
The classification results highlight several key factors influencing model performance. Topographic and administrative division features consistently demonstrate high importance scores, reflecting their direct influence on coffee cultivation patterns (Tridawati et al., 2020; Sovann et al., 2025). Steeper slopes in mountainous regions affect soil moisture, drainage, and sunlight exposure, which are critical for coffee growth (Pereira et al., 2021). Administrative boundaries often correspond to human management practices, land tenure, and plantation layouts, providing spatial context that improves discrimination between coffee and surrounding vegetation.
The highest overall accuracy and Kappa coefficient obtained when spectral indices are divided into four seasonal periods indicate a pronounced seasonality in coffee growth. Analysis of each seasonal period separately reveals that the October-December period achieves the highest classification accuracy, suggesting that coffee plants are most spectrally and structurally distinguishable during this phase. This pattern is likely attributable to the fruit maturation stage, when canopy structure, leaf density, and spectral reflectance exhibit greater contrast with surrounding vegetation, such as shrubs and other crops, thereby facilitating more accurate discrimination (Parreiras et al., 2025). Conversely, periods corresponding to vegetative growth or early fruit development show lower discriminability due to more subtle spectral contrasts. These findings underscore the value of incorporating seasonally segmented spectral features to capture coffee phenology and enhance the performance of remote sensing-based classification (Hunt et al., 2020).
4.2 Future perspectives
As remote sensing technology continues to advance, the use of remote sensing imagery for extracting and monitoring coffee crops has emerged as a research area with substantial practical value (Kawakubo and Pérez Machado, 2016). While the integration of multi-source features and temporal segmentation significantly enhances classification, challenges remain. Acquiring high-quality remote sensing data, obtaining representative training and validation samples, and managing computational demands of advanced models remain key constraints (Hunt et al., 2020; Nogueira Martins et al., 2023; Escobar-López et al., 2024). Future research should explore high-resolution and multi-sensor imagery, semi-supervised or transfer learning approaches, and collaborative sample-sharing networks to further improve accuracy, generalization, and applicability. These strategies will support more effective monitoring and sustainable management of coffee plantations under complex environmental and socio-economic conditions (Sott et al., 2020; Maskell et al., 2021; Zhang et al., 2023).
5 Conclusion
This study employs 472 scenes of 2023 Sentinel-2 2A remote sensing imagery as the primary data source, supplemented by NASADEM, vector boundary data, and published land use datasets. On the Google Earth Engine platform, three spectral time series features (NDVI, RVI, DVI), were extracted, alongside nine texture features (e.g., ASM, CON, and ENT), two terrain features (slope and aspect), and administrative division features (ID). Furthermore, 1,617 field-measured sampling points in Pu’er City, Yunnan, were integrated with high-resolution Google Earth imagery for visual interpretation, creating a spatial dataset of coffee and non-coffee sample points. A refined coffee crop extraction model for Pu’er City was developed using the RF algorithm.
The results demonstrate that incorporating administrative division features and adopting a larger texture window size (5 × 5) significantly enhances the accuracy and consistency of the coffee classification model. Moreover, segmenting spectral features into four distinct periods optimally captures phenological variations in coffee plantations, addressing the limitations of annual composite approaches that may obscure temporal differences while avoiding excessive fragmentation and noise introduced by a finer seven-period division. The highest OA achieved was 94.80%, with a Kappa coefficient of 0.9471, underscoring the robustness and reliability of the classification model.
This study highlights the potential of remote sensing technology in accurately mapping and monitoring coffee cultivation in complex agricultural landscapes. The proposed approach provides valuable insights for enhancing precision agriculture and regional land management strategies while supporting the sustainable development of coffee farming. Moreover, the method is lightweight and easy to implement, requiring only simple input and output parameters. It can be readily transferred and applied to other regions with similar agro-ecological conditions by adjusting a few key parameters, demonstrating strong scalability and practical value.
Data availability statement
The raw data supporting the conclusions of this article will be made available by the authors, without undue reservation.
Author contributions
QH: Methodology, Writing – original draft. XC: Writing – original draft, Data curation, Validation. YC: Funding acquisition, Methodology, Visualization, Writing – original draft. XD: Writing – review and editing, Methodology, Writing – original draft. HJ: Writing – review and editing, Conceptualization, Funding acquisition.
Funding
The author(s) declare that financial support was received for the research and/or publication of this article. The research was supported by the Provincial Special Funding for the Construction of Chenzhou National Sustain able Development Agenda Innovation Demonstration Zone (No. 2023sfq69), scientific and technological innovation project of Study on ecogeochemical evaluation system in Plateau specialty coffee producing area of Yunnan Province, science and technology innovation team fund project of Yunnan Land and Resources Vocational College (Ecological Environment Geological Science and Technology Innovation Team2021KJT004), and Engineering Center of Yunnan Education Department for Health Geological Survey & Evaluation.
Conflict of interest
The authors declare that the research was conducted in the absence of any commercial or financial relationships that could be construed as a potential conflict of interest.
Generative AI statement
The author(s) declare that no Generative AI was used in the creation of this manuscript.
Any alternative text (alt text) provided alongside figures in this article has been generated by Frontiers with the support of artificial intelligence and reasonable efforts have been made to ensure accuracy, including review by the authors wherever possible. If you identify any issues, please contact us.
Publisher’s note
All claims expressed in this article are solely those of the authors and do not necessarily represent those of their affiliated organizations, or those of the publisher, the editors and the reviewers. Any product that may be evaluated in this article, or claim that may be made by its manufacturer, is not guaranteed or endorsed by the publisher.
References
Arteaga-López, N., Delgado-Calvache, C., Casanova, J.-F., Figueroa, C., Arteaga-López, N., Delgado-Calvache, C., et al. (2022). Coffee crops analysis using UAVs equipped with multispectral cameras. Rev. Fac. Ing. 31, e14870. doi:10.19053/01211129.v31.n62.2022.14870
Bernardes, T., Moreira, M. A., Adami, M., Giarolla, A., and Rudorff, B. F. T. (2012). Monitoring biennial bearing effect on coffee yield using MODIS remote sensing imagery. Remote Sens. 4, 2492–2509. doi:10.3390/rs4092492
Bourgoin, C., Oszwald, J., Bourgoin, J., Gond, V., Blanc, L., Dessard, H., et al. (2020). Assessing the ecological vulnerability of forest landscape to agricultural frontier expansion in the central highlands of Vietnam. Int. J. Appl. Earth Obs. Geoinformation 84, 101958. doi:10.1016/j.jag.2019.101958
Chemura, A., Mutanga, O., and Dube, T. (2017). Remote sensing leaf water stress in coffee (coffea arabica) using secondary effects of water absorption and random forests. Phys. Chem. Earth Parts ABC 100, 317–324. doi:10.1016/j.pce.2017.02.011
Chen, Y., Lu, D., Moran, E., Batistella, M., Dutra, L. V., Sanches, I. D., et al. (2018). Mapping croplands, cropping patterns, and crop types using MODIS time-series data. Int. J. Appl. Earth Obs. Geoinformation 69, 133–147. doi:10.1016/j.jag.2018.03.005
Chen, J.-J., Zhen, S., and Sun, Y. (2021). Estimating leaf chlorophyll content of buffaloberry using normalized difference vegetation index sensors. HortTechnology 31, 297–303. doi:10.21273/HORTTECH04808-21
Claverie, M., Ju, J., Masek, J. G., Dungan, J. L., Vermote, E. F., Roger, J.-C., et al. (2018). The harmonized landsat and Sentinel-2 surface reflectance data set. Remote Sens. Environ. 219, 145–161. doi:10.1016/j.rse.2018.09.002
DaMatta, F. M. (2004). Ecophysiological constraints on the production of shaded and unshaded coffee: a review. Field Crops Res. 86, 99–114. doi:10.1016/j.fcr.2003.09.001
DaMatta, F. M., Ronchi, C. P., Maestri, M., and Barros, R. S. (2007). Ecophysiology of coffee growth and production. Braz. J. Plant Physiol. 19, 485–510. doi:10.1590/S1677-04202007000400014
de Carvalho Alves, M., Sanches, L., Pozza, E. A., Pozza, A. A. A., and da Silva, F. M. (2022). The role of machine learning on arabica coffee crop yield based on remote sensing and mineral nutrition monitoring. Biosyst. Eng. 221, 81–104. doi:10.1016/j.biosystemseng.2022.06.014
Escobar-López, A., Castillo-Santiago, M. Á., Mas, J. F., Hernández-Stefanoni, J. L., and López-Martínez, J. O. (2024). Identification of coffee agroforestry systems using remote sensing data: a review of methods and sensor data. Geocarto Int. 39, 2297555. doi:10.1080/10106049.2023.2297555
Fu, X., Chen, Y., Yan, J., Chen, Y., and Xu, F. (2023). BGRF: a broad granular random forest algorithm. J. Intell. Fuzzy Syst. 44, 8103–8117. doi:10.3233/JIFS-223960
Gaertner, J., Genovese, V. B., Potter, C., Sewake, K., and Manoukis, N. C. (2017). Vegetation classification of coffea on Hawaii island using WorldView-2 satellite imagery. J. Appl. Remote Sens. 11, 046005. doi:10.1117/1.JRS.11.046005
Gomez, C., Mangeas, M., Petit, M., Corbane, C., Hamon, P., Hamon, S., et al. (2010). Use of high-resolution satellite imagery in an integrated model to predict the distribution of shade coffee tree hybrid zones. Remote Sens. Environ. 114, 2731–2744. doi:10.1016/j.rse.2010.06.007
Hadavand, A., Saadatseresht, M., and Homayouni, S. (2017). Segmentation parameter selection for object-based land-cover mapping from ultra high resolution spectral and elevation data. Int. J. Remote Sens. 38, 3586–3607. doi:10.1080/01431161.2017.1302107
Hailu, B. T., Maeda, E. E., Pellikka, P., and Pfeifer, M. (2015). Identifying potential areas of understorey coffee in Ethiopia’s highlands using predictive modelling. Int. J. Remote Sens. 36, 2898–2919. doi:10.1080/01431161.2015.1051631
Hao, P., Zhan, Y., Wang, L., Niu, Z., and Shakir, M. (2015). Feature selection of time series MODIS data for early crop classification using random forest: a case study in Kansas, USA. Remote Sens. 7, 5347–5369. doi:10.3390/rs70505347
Haralick, R. M., Shanmugam, K., and Dinstein, I. (1973). Textural features for image classification. IEEE Trans. Syst. Man. Cybern. SMC-3, 610–621. doi:10.1109/TSMC.1973.4309314
He, Y., Wang, Z., Sun, S., Zhu, L., Li, Y., Wang, X., et al. (2023). Using crop intercepted solar radiation and vegetation index to estimate dry matter yield of choy sum. Front. Plant Sci. 14, 1208404. doi:10.3389/fpls.2023.1208404
Hunt, D. A., Tabor, K., Hewson, J. H., Wood, M. A., Reymondin, L., Koenig, K., et al. (2020). Review of remote sensing methods to map coffee production systems. Remote Sens. 12, 2041. doi:10.3390/rs12122041
Jia, H., Chen, F., Du, E., and Wang, L. (2023). Drought vulnerability curves based on remote sensing and historical disaster dataset. Remote Sens. 15, 858. doi:10.3390/rs15030858
Karra, K., Kontgis, C., Statman-Weil, Z., Mazzariello, J. C., Mathis, M., and Brumby, S. P. (2021). “Global land use/land cover with sentinel 2 and deep learning,” in 2021 IEEE international geoscience and remote sensing symposium IGARSS, 4704–4707. doi:10.1109/IGARSS47720.2021.9553499
Kawakubo, F. S., and Pérez Machado, R. P. (2016). Mapping coffee crops in southeastern Brazil using spectral mixture analysis and data mining classification. Int. J. Remote Sens. 37, 3414–3436. doi:10.1080/01431161.2016.1201226
Kouadio, L., Byrareddy, V. M., Sawadogo, A., and Newlands, N. K. (2021). Probabilistic yield forecasting of robusta coffee at the farm scale using agroclimatic and remote sensing derived indices. Agric. For. Meteorol. 306, 108449. doi:10.1016/j.agrformet.2021.108449
Krishnan, S. (2017). “Sustainable coffee production,” in Oxford research encyclopedia of environmental science. doi:10.1093/acrefore/9780199389414.013.224
Lamquin, N., Bruniquel, V., and Gascon, F. (2018). Sentinel-2 L1C radiometric validation using deep convective clouds observations. Eur. J. Remote Sens. 51, 11–27. doi:10.1080/22797254.2017.1395713
Li, J., and Roy, D. P. (2017). A global analysis of Sentinel-2A, Sentinel-2B and Landsat-8 data revisit intervals and implications for terrestrial monitoring. Remote Sens. 9, 902. doi:10.3390/rs9090902
Li, X., Zhang, J., Yang, T., and Chen, W. (2002). Investigation on the growth and development of coffea arabica at different altitudes in Yunnan province. Yunnan Trop. Crops Sci. Technol., 8–16. doi:10.3969/j.issn.1672-450X.2002.04.002
Liu, Y., Gong, W., Hu, X., and Gong, J. (2018). Forest type identification with random forest using Sentinel-1A, Sentinel-2A, multi-temporal Landsat-8 and DEM data. Remote Sens. 10, 946. doi:10.3390/rs10060946
Lv, Y., Meng, S., Zhou, X., Hou, M., and Huang, Q. (2025). Soil and leaf nutrient contents and ecochemical stoichiometric characteristics of three main coffee-producing regions in Yunnan, China. J. Trop. Crops 46, 2436–2446. doi:10.3969/j.issn.1000-2561.2025.10.014
Martins, G. D., Galo, M., de, L. B. T., and Vieira, B. S. (2017). Detecting and mapping root-knot nematode infection in coffee crop using remote sensing measurements. IEEE J. Sel. Top. Appl. Earth Obs. Remote Sens. 10, 5395–5403. doi:10.1109/JSTARS.2017.2737618
Maskell, G., Chemura, A., Nguyen, H., Gornott, C., and Mondal, P. (2021). Integration of sentinel optical and radar data for mapping smallholder coffee production systems in Vietnam. Remote Sens. Environ. 266, 112709. doi:10.1016/j.rse.2021.112709
Maurya, K., Mahajan, S., and Chaube, N. (2021). Remote sensing techniques: mapping and monitoring of mangrove Ecosystem—a review. Complex Intell. Syst. 7, 2797–2818. doi:10.1007/s40747-021-00457-z
Melichar, M., Didan, K., Barreto-Muñoz, A., Duberstein, J. N., Jiménez Hernández, E., Crimmins, T., et al. (2023). Random forest classification of multitemporal landsat 8 spectral data and phenology metrics for land cover mapping in the sonoran and mojave deserts. Remote Sens. 15, 1266. doi:10.3390/rs15051266
Moguel, P., and Toledo, V. M. (1999). Biodiversity conservation in traditional coffee systems of Mexico. Conserv. Biol. 13, 11–21. doi:10.1046/j.1523-1739.1999.97153.x
Nogueira Martins, R., de Assis de Carvalho Pinto, F., Marçal de Queiroz, D., Sárvio Magalhães Valente, D., Tadeu Fim Rosas, J., Fagundes Portes, M., et al. (2023). Digital mapping of coffee ripeness using UAV-Based multispectral imagery. Comput. Electron. Agric. 204, 107499. doi:10.1016/j.compag.2022.107499
Olofsson, P., Foody, G. M., Herold, M., Stehman, S. V., Woodcock, C. E., and Wulder, M. A. (2014). Good practices for estimating area and assessing accuracy of land change. Remote Sens. Environ. 148, 42–57. doi:10.1016/j.rse.2014.02.015
Ortega-Huerta, M. A., Komar, O., Price, K. P., and Ventura, H. J. (2012). Mapping coffee plantations with landsat imagery: an example from El Salvador. Int. J. Remote Sens. 33, 220–242. doi:10.1080/01431161.2011.591442
Parreiras, T. C., Santos, C. de O., Bolfe, É. L., Sano, E. E., Leandro, V. B. S., Bayma, G., et al. (2025). Dense time series of harmonized landsat Sentinel-2 and ensemble machine learning to map coffee production stages. Remote Sens. 17, 3168. doi:10.3390/rs17183168
Pereira, P. V., Silveira, D. L. da, Schwan, R. F., Silva, S. de A., Coelho, J. M., and Bernardes, P. C. (2021). Effect of altitude and terrain aspect on the chemical composition of coffea canephora cherries and sensory characteristics of the beverage. J. Sci. Food Agric. 101, 2570–2575. doi:10.1002/jsfa.10885
Rizvi, R. H., Dhyani, S. K., Newaj, R., Saxena, A., and Karmakar, P. S. (2013). Mapping extent of agroforestry area through remote sensing: issues, estimates and methodology. Indian J. Agrofor. 15. Available online at: https://epubs.icar.org.in/index.php/IJA/article/view/103651 (Accessed August 31, 2025).
Schulthess, U., Rodrigues, F., Taymans, M., Bellemans, N., Bontemps, S., Ortiz-Monasterio, I., et al. (2023). Optimal sample size and composition for crop classification with Sen2-Agri’s random forest classifier. Remote Sens. 15, 608. doi:10.3390/rs15030608
Sott, M. K., Furstenau, L. B., Kipper, L. M., Giraldo, F. D., López-Robles, J. R., Cobo, M. J., et al. (2020). Precision techniques and agriculture 4.0 technologies to promote sustainability in the coffee sector: state of the art, challenges and future trends. IEEE Access 8, 149854–149867. doi:10.1109/ACCESS.2020.3016325
Sovann, C., Olin, S., Mansourian, A., Sakhoeun, S., Prey, S., Kok, S., et al. (2025). Importance of spectral information, seasonality, and topography on land cover classification of tropical land cover mapping. Remote Sens. 17, 1551. doi:10.3390/rs17091551
Thao, N. T. T., Khoi, D. N., Denis, A., Viet, L. V., Wellens, J., and Tychon, B. (2022). Early prediction of coffee yield in the central highlands of Vietnam using a statistical approach and satellite remote sensing vegetation biophysical variables. Remote Sens. 14, 2975. doi:10.3390/rs14132975
Tian, Y., Shuai, Y., Shao, C., Wu, H., Fan, L., Li, Y., et al. (2023). Extraction of cotton information with optimized phenology-based features from Sentinel-2 images. Remote Sens. 15, 1988. doi:10.3390/rs15081988
Tridawati, A., Wikantika, K., Susantoro, T. M., Harto, A. B., Darmawan, S., Yayusman, L. F., et al. (2020). Mapping the distribution of coffee plantations from multi-resolution, Multi-Temporal, and multi-sensor data using a random forest algorithm. Remote Sens. 12, 3933. doi:10.3390/rs12233933
Van Viet, L., and Thuy, T. T. T. (2023). Improving the quality of coffee yield forecasting in dak Lak province, Vietnam, through the utilization of remote sensing data. Environ. Res. Commun. 5, 095011. doi:10.1088/2515-7620/acf6fd
Velásquez, D., Sánchez, A., Sarmiento, S., Velásquez, C., Toro, M., Montoya, E., et al. (2021). A cyber-physical data collection system integrating remote sensing and wireless sensor networks for coffee leaf rust diagnosis. Sensors 21, 5474. doi:10.3390/s21165474
Wang, Y., Xiong, L., Wang, H., Ji, X., and Zheng, G. (2023). Study on the influence of slope shape with numerical calculation models on slope safety during slope excavation. PLOS ONE 18, e0292461. doi:10.1371/journal.pone.0292461
Xiong, J., Thenkabail, P. S., Tilton, J. C., Gumma, M. K., Teluguntla, P., Oliphant, A., et al. (2017). Nominal 30-m cropland extent map of Continental Africa by integrating pixel-based and object-based algorithms using Sentinel-2 and Landsat-8 data on google Earth engine. Remote Sens. 9, 1065. doi:10.3390/rs9101065
Zeng, Y., Hao, D., Badgley, G., Damm, A., Rascher, U., Ryu, Y., et al. (2021). Estimating near-infrared reflectance of vegetation from hyperspectral data. Remote Sens. Environ. 267, 112723. doi:10.1016/j.rse.2021.112723
Zhang, Z., Wang, H., Cai, C., and Liu, G. (2015). Effects of fertilization on photosynthetic characteristics and growth of young coffea arabica under drought stress. Chin. J. Eco-Agriculture 23, 832–840. doi:10.13930/j.cnki.cjea.150102
Zhang, Z. X., Cai, Z. Q., Liu, G. Z., Wang, H., Huang, L., and Cai, C. T. (2017). Effects of fertilization on the growth, photosynthesis, and biomass accumulation in juvenile plants of three coffee (coffea arabica L.) cultivars. Photosynthetica 55, 134–143. doi:10.1007/s11099-016-0237-3
Zhang, M., Wang, R., Li, Y., Hu, X., Li, M., Zhang, M., et al. (2020). Ecological suitability zoning of coffea arabica L. in Yunnan province, China. Chin. J. Eco-Agriculture 28, 168–178. doi:10.13930/j.cnki.cjea.190509
Zhang, D., Ma, Y., Wu, L., Wang, Q., and Wang, X. (2023). Bibliometric analysis of remote sensing-based crop planting structure extraction development trends. J. Jiangsu Agric. 39, 1026–1035. doi:10.3969/j.issn.1000-4440.2023.04.012
Zhang, S., Yang, J., Leng, P., Ma, Y., Wang, H., and Song, Q. (2024). Crop type mapping with temporal sample migration. Int. J. Remote Sens. 45, 7014–7032. doi:10.1080/01431161.2023.2192881
Keywords: coffee, vegetation index, random forest, multi temporal analysis, yunnan
Citation: Huang Q, Cheng X, Chen Y, Ding X and Jia H (2025) Coffee extraction from remote sensing imagery based on multiple features: a case study of Pu’er City, China. Front. Remote Sens. 6:1696570. doi: 10.3389/frsen.2025.1696570
Received: 04 September 2025; Accepted: 22 October 2025;
Published: 11 November 2025.
Edited by:
Rui Li, University of Warwick, United KingdomReviewed by:
Marco Antonio Zanella, Universidade Federal Rural de Pernambuco, BrazilYuhang Tian, Sun Yat-sen University, China
Copyright © 2025 Huang, Cheng, Chen, Ding and Jia. This is an open-access article distributed under the terms of the Creative Commons Attribution License (CC BY). The use, distribution or reproduction in other forums is permitted, provided the original author(s) and the copyright owner(s) are credited and that the original publication in this journal is cited, in accordance with accepted academic practice. No use, distribution or reproduction is permitted which does not comply with these terms.
*Correspondence: Huicong Jia, amlhaGNAcmFkaS5hYy5jbg==; Xinyi Ding, MTYwOTExNTIxMEBxcS5jb20=