 Siva Satya Sri Ganesh Seeram
 Luca Feltrin
 Mustafa Ozger
 Shuai Zhang1
 Cicek Cavdar
- 1School of Electrical Engineering and Computer Science, KTH Royal Institute of Technology, Stockholm, Sweden
- 2Ericsson Research, Stockholm, Sweden
- 3Aalborg University, Copenhagen, Denmark
Given the advancements in next-generation low Earth orbit (LEO) satellites, there is an expected shift from transparent architectures (acting as radio repeaters) to regenerative architectures (hosting a part or all of the gNodeB (gNB) onboard). Such regenerative architectures enable disaggregation and distribution of radio access network (RAN) functions between the ground and space. Open RAN is a promising approach for non-terrestrial networks and offers flexible function placement through open interfaces. The present study examines three open RAN-based regenerative architectures, namely, Split 7.2× (low-layer physical functions onboard), Split 2 (Layers 1 and 2 onboard), and a gNB onboard the satellite. Handover (HO) management becomes increasingly complex in this disaggregated RAN, particularly for LEO satellites, where the part of the gNB is constantly in motion. The choice of regenerative architecture and its dynamic topology influence the additional HO control signals required between the satellite and ground stations. Using a realistic dynamic LEO constellation model, we analyze the interplay among conditional handover (CHO) delay, computational complexity, and control signaling overhead under different network architectures. Our findings reveal that transitioning from a transparent architecture to Split 7.2× does not reduce CHO delay despite the introduction of additional onboard processing. The gNB onboard the satellite minimizes cumulative CHO delay but demands 55%–70% more computational resources than the Split 7.2× architecture. Conversely, although Split 7.2× is computationally more efficient, it increases the cumulative CHO delay by 25%–30%. Additionally, we observed that under limited onboard processing conditions, only the transparent and Split 7.2× architectures supported delay-sensitive services up to 100 ms. In contrast, under ample processing conditions, gNB was suitable for stringent 50 ms requirements, while Split 2 best supported delay-tolerant services with 200 ms requirements.
1 Introduction
The advent of next-generation low Earth orbit (LEO) satellites with regenerative architectures has enabled onboard baseband processing by offering flexible distribution of radio access network (RAN) functions between the ground stations (GSs) and satellites. Regenerative architectures enable autonomous signal processing and formation of inter-satellite links (ISLs), thereby enhancing the network flexibility and reducing dependency on terrestrial infrastructure. In contrast, transparent architectures act as mere signal repeaters, and the gNodeB (gNB) is situated entirely in the GS. Given the limited processing power and energy constraints of satellites, a disaggregated RAN is a cost-efficient solution for LEO-based non-terrestrial networks (NTNs). The open RAN architecture is a suitable candidate for NTNs to accommodate such flexibility in functional split (FS) with open interfaces (O-RAN Alliance, 2021). These satellites are particularly advantageous owing to their lower communication latencies, support for higher data rates, and reduced transmission power requirements compared to traditional geostationary Earth orbit (GEO) satellites (Voicu et al., 2024; Yue et al., 2023). However, the dynamic nature of LEOs introduces significant challenges in handover (HO) management within a disaggregated RAN framework. To enable efficient regenerative architectures, it is imperative to evaluate the FSs that balance the onboard processing capabilities with network performance. In our previous work (Seeram et al., 2024), we analyzed various FSs in NTNs to provide insights into their feasibility and performance tradeoffs.
Unlike terrestrial networks (TNs), where the network infrastructure remains static and movement of only the user equipment (UE) triggers HOs, LEO satellites continuously traverse their orbits and lead to HOs in a dynamic topology. These satellites often experience frequent GS HOs that can result in management problems. Simultaneously, UE experiences frequent HOs as they switch between satellites, where the complexity of the HO procedure depends on whether the serving and target satellites are connected to the same or different GSs as well as the placement of core network (CN) functions. Based on the satellite network architecture and topology, the different HO procedures (3GPP, 2024b) with additional control signaling requirements across multiple interfaces include UE to satellite [service link (SL)], satellite to GS [feeder link (FL)], ISL, and inter-GS links (IGSLs). The resulting increases in signaling overheads not only add to the HO delays but also complicate the maintenance of seamless connectivity. Hence, end-to-end mobility management considering GS connectivity and disaggregated RAN is crucial for ensuring uninterrupted and high-quality communication services. For instance, enhanced mobile broadband (eMBB) delay-sensitive applications, such as online gaming, require delays below 50 and 100 ms, whereas delay-tolerant services like video streaming and web browsing can accommodate higher delays up to 500 ms based on the application (Masoudi et al., 2022; Dazhi et al., 2024; Houle et al., 2007). To support diverse service requirements, a thorough evaluation of the HO procedures, onboard processing capabilities, and network design strategies tailored to dynamic NTN environments are essential.
The conditional handover (CHO) scheme was introduced in the third-generation partnership project (3GPP) Rel-16 to enhance the robustness of mobility and reduce connectivity failures in dynamic environments. Unlike conventional HO, which is network-controlled (where the gNB sends a HO command), CHO allows the network to preconfigure multiple target cells but the HO is triggered by the UE. The UE continuously monitors the prepared target cells and initiates HO when the conditions are met (Wang et al., 2022). In general, measurement-based HO techniques rely on received signal strength metrics such as reference signal received power (RSRP), reference signal received quality (RSRQ), or received signal strength indicator (RSSI) to trigger a HO. Among the various triggering events, we limit our focus to the widely popular event A3 (where a neighboring cell becomes offset-better than the serving cell). Beyond measurement-based triggers, 3GPP has also introduced NTN-specific HO trigger mechanisms to account for satellite mobility and predictable trajectories. The distance-based HO trigger associates the UE with the nearest satellite by assuming precise knowledge of both the UE and satellite positions. A hysteresis margin is applied to prevent unnecessary HOs owing to small positional variations. Similarly, the elevation-angle-based approach selects the satellite with the highest elevation angle. The timer-based HO trigger leverages the satellite trajectory and speed to estimate the instance at which a satellite will exit the UE coverage area, thereby initiating a HO in advance based on a preconfigured time window (Demir et al., 2022). Although these geometry-aware methods are predictable, they do not inherently account for the radio link quality; this can lead to suboptimal HO decisions, such as switching to a satellite with poor link conditions. To address this, we consider two CHO schemes, namely the service-capacity-based (SCB) and SL-rate-based (SLRB) methods (Wang et al., 2022). The SCB scheme considers both link quality and remaining service duration in the HO decision to optimize connection stability and reduce unnecessary HOs. In contrast, the SLRB scheme relies solely on the instantaneous link rate, potentially leading to more frequent HOs while guaranteeing high data rates.
Several satellite HO approaches have been proposed in literature using diverse decision criteria, such as elevation angle (Dai et al., 2019), maximum service time (Hu et al., 2018; Leng et al., 2021; Seeram et al., 2025), satellite availability (Papapetrou et al., 2004; Li et al., 2020a), delay (Duan et al., 2018; Yang et al., 2016), HO failure reduction (Li et al., 2020b), and network load balancing (He et al., 2020; Eydian et al., 2025). The existing studies primarily focus on minimizing the number of HOs by improving the CHO schemes (Wang et al., 2022) or reducing HO delays by eliminating specific control signaling steps (Lee et al., 2024). For instance, Rehman et al. (2017) employed the maximum service time as a criterion for satellite selection, while Juan et al. (2022) introduced a trajectory-aware HO procedure to minimize unnecessary HOs and failures. Other works have proposed velocity-aware HO prediction (Hu et al., 2018) and caching-aware intelligent HO (Leng et al., 2021) strategies based on deep reinforcement learning (DRL). Additionally, Liu et al. (2021) presented a load-balanced HO strategy by optimizing the HO frequency and system capacity, while Wang et al. (2021) proposed a DRL-based HO scheme wherein each UE determines its HO decisions independently.
Despite recent advances in satellite HO management, a unified framework that captures the complex interplay among dynamic LEO satellite topologies, CHO delays, satellite architectures, and processing constraints is lacking. The extant solutions tend to optimize isolated aspects, such as HO frequency, signaling, or link quality, without accounting for the manner in which the choice of satellite architecture, CHO scheme, and dynamic topologies influence the CHO delays and applicability of each architecture, especially when various service requirements remain underexplored. Unlike prior studies, the present work adopts a novel and holistic approach to address the HO challenge in NTNs by integrating multiple layers of analysis. Thus, we first examine the control signaling overheads across various dynamic HO topologies by considering end-to-end (UE-satellite-GS) connectivity, which enables us to model the corresponding CHO delays under different configurations. Next, we extend the analysis using a dynamic satellite network simulator to quantify the occurrence probability of each HO topology and evaluate the CHO scheme performance, including the HO metrics and CHO delay distributions across different architectures. Finally, we integrate these findings to assess the practical applicability of each architecture for delay-sensitive and delay-tolerant use cases under the conditions of both limited and ample onboard processing capabilities. This layered analysis provides a novel and cohesive understanding of HO challenges and their implications to NTN RAN design.
In the present work, we evaluate three regenerative architectures by employing different open RAN FSs, namely Split 7.2×, Split 2, and gNB onboard the satellite, before comparing them with a transparent architecture as the benchmark. In Split 7.2×, only Layer 1 (L1) functions like beamforming, precoding, inverse fast Fourier transform (IFFT), and radio frequency (RF) processing are implemented onboard the satellite, while all higher-layer functions remain at the GS. In contrast, the Split 2 configuration places both L1 and Layer 2 (L2) functions on the satellite, while Layer 3 (L3) functions are executed at the GS. The key contributions of this work can be summarized as follows:
The remainder of this manuscript is structured as follows: Section 2 presents an overview of the RAN architectures in TNs and NTNs. Section 3 entails evaluations of FSs in NTNs. Section 4 presents various NTN HO scenarios under different dynamic topologies, CHO procedures, and CHO delay models. Section 5 describes the dynamic LEO constellation model and CHO algorithms. Section 6 elaborates on the results and analyses of different system setups. Finally, Section 7 presents the conclusions of this work along with the key findings and future research directions.
2 Background
2.1 RAN architectures in TNs
In a TN, the conventional base station (BS) typically consists of two primary components, namely the baseband unit (BBU) and remote radio head (RRH) or radio unit (RU). In traditional distributed RAN (D-RAN) architectures, these components are colocated at the same cell site, where each BS is connected to the CN through a backhaul link. This setup minimizes latency but lacks scalability; as the number of cell sites increases, the power consumption and capital expenditure associated with the D-RAN increase proportionally (Wang et al., 2017b; Masoudi et al., 2020; China Mobile, 2011). To address these limitations, the centralized RAN (C-RAN) architecture was developed, in which the BBU processing functions are separated from those of the RU and moved to a centralized resource pool. This configuration improves energy efficiency through centralized cooling (Wang et al., 2017a; Alabbasi et al., 2018). However, each RU still requires a dedicated baseband processing unit, leading to underutilization of processing resources during peak hours when the traffic is unbalanced between the cells. To improve resource utilization, BBUs were subsequently virtualized and implemented on general purpose processors (GPPs), allowing multiple RUs to share the baseband resources. This approach resulted in cloud RAN (CRAN) or virtualized CRAN (V-CRAN) architectures, in which the processing resources are dynamically allocated based on cell load, thereby enhancing the network efficiency while reducing both energy consumption and BS payloads (Larsen et al., 2018; Demir et al., 2024). Recent industry efforts have aimed to further open and standardize RAN architectures and interfaces, resulting in the development of open RAN initiatives (O-RAN Alliance, 2021). Despite advancements in FSs and virtualization, many interfaces between the RAN components remain proprietary, leading to vendor lock-in, except for the open F1 interface. The open RAN standards developed by the O-RAN Alliance represent a major effort at creating interoperable interfaces between network elements from different vendors, thus enabling a more flexible and vendor-neutral RAN ecosystem. The introduction of a RAN intelligent controller (RIC) within the open RAN framework further enhances network operations by enabling automated and optimized RAN functions, advancing the field toward intelligent V-CRAN (Pérez-Romero et al., 2023).
2.2 Disaggregated RAN and FSs
The centralization of all baseband processing functions in C-RAN presents significant challenges owing to the stringent latency and high bandwidth demands placed on the fronthaul transport network. To mitigate these constraints, FSs were introduced to disaggregate the RAN functions and distribute processing across different network nodes. Various standardization bodies, including the 3GPP (3GPP, 2017), Small Cell Forum (SCF) (Small Cell Forum, 2016), Next-Generation Mobile Networks (NGMN) Alliance (Alliance, 2015), Common Public Radio Interface (CPRI) (Common Public Radio Interface CPRI, 2018), and O-RAN Alliance (O-RAN Alliance, 2021), have proposed FSs at different points within the RAN, as illustrated in Figure 1. In this work, we interchangeably use the FS terminologies from the 3GPP, SCF, and O-RAN Alliance standardizations. Regardless of the RAN architecture, each data packet or request must traverse a stack of protocol layers, namely, the radio resource control (RRC), packet data convergence protocol (PDCP), radio link control (RLC), medium access control (MAC), and physical (PHY) layers, which is collectively referred to as the baseband functions. The PHY layer encompasses several key operations, including forward error correction (FEC), quadrature amplitude modulation (QAM), layer mapping, precoding, resource mapping, beamforming, IFFT, and cyclic prefix addition. The 3GPP standard introduced the next-generation RAN (NG-RAN) architecture, which defines the FSs for the gNB by partitioning the baseband functions such that the higher protocol layers are managed by the central unit (CU), while the lower protocol layers are handled by the distributed unit (DU). Additionally, the RU is responsible for RF operations and signal processing. In the proposed architecture, all entities below a selected FS are deployed on a remote node (e.g., a satellite), while the remaining functions reside on a central node (e.g., a GS), as depicted in Figure 2A. In open RAN, these functional entities are prefixed with “O-” to indicate open interfaces, resulting in open CU (O-CU), open DU (O-DU), and open RU (O-RU). Moreover, these components are 3GPP-based functionalities adapted to the open RAN architecture (O-RAN Alliance, 2021; Wani et al., 2024).
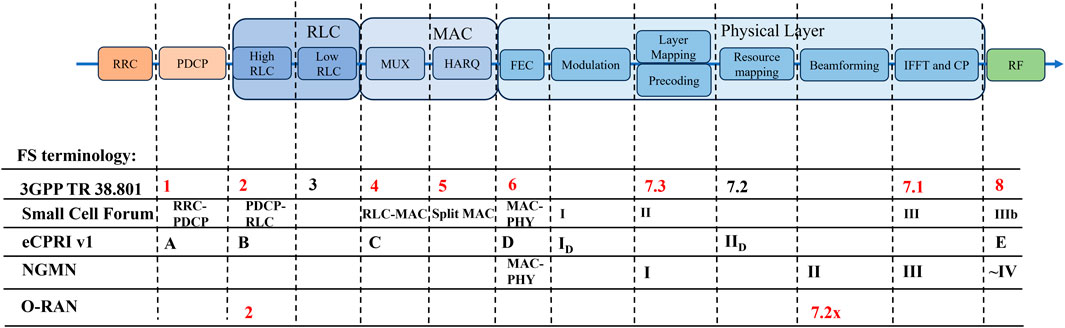
Figure 1. Functional splits proposed by different standardization organizations.
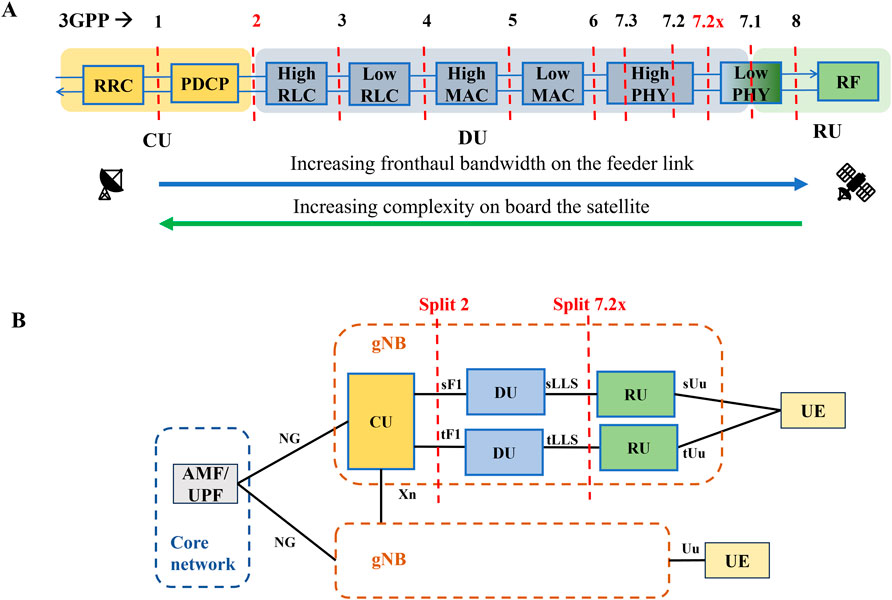
Figure 2. (A) Baseband functional splits and (B) overview of the radio access network (RAN) architecture.
2.3 RAN architectures in NTNs
NTNs are wireless communication systems designed to extend connectivity beyond the TNs by utilizing space-borne and airborne platforms (Giordani and Zorzi, 2021). The space-borne platforms include satellites classified into GEO, medium Earth orbit (MEO), and LEO based on their orbital altitudes, whereas the airborne platforms consist of high-altitude platforms (HAPs) and unmanned aerial vehicles (UAVs). The present study primarily focuses on LEO satellites, which play crucial roles in NTNs owing to their lower altitudes that enable lower delays and higher throughput than GEO and MEO satellites. The NTN architecture comprises multiple components, including NTN payloads hosting RAN functions onboard satellites, UE, and GSs. The UE establish connectivity with satellites via SLs, whereas the GSs maintain connectivity with satellites through FLs. NTN coverage is facilitated using either fixed or moving cells (Campana et al., 2023). Fixed cells provide consistent coverage over designated ground areas using steerable antennas, whereas moving cells dynamically shift the coverage areas by following the satellite orbital trajectory. Additionally, satellites may employ single-beam or multibeam systems, where the latter improves coverage and capacity by segmenting the service area into more focused regions. The satellite architecture significantly influences the operational efficiency and performance of an NTN, and these architectures are broadly classified into transparent and regenerative categories (Rihan et al., 2023).
2.3.1 Transparent architecture
In the transparent satellite architecture, the gNB is situated in the GS, such that the satellite functions primarily as a signal repeater. The onboard processing capabilities are limited to RF operations, such as frequency conversion, amplification, and beam management. Consequently, the satellite retransmits the received waveforms without modifications, maintaining direct links between the UE and TN infrastructure.
2.3.2 Regenerative architecture
In contrast, the regenerative architecture integrates baseband processing capabilities onboard the satellite to enable autonomous operations and inter-satellite connectivity. This architecture reduces reliance on terrestrial infrastructure while allowing dynamic implementation of ISLs for enhanced network flexibility. By supporting multihop topologies, regenerative satellites extend coverage to remote and underserved areas to complement TNs. Additionally, this architecture improves network resilience as the traffic routing and HOs can be managed directly between satellites with minimal dependency on the CN located on the ground. The three fundamental baseband components are interconnected through standardized interfaces, as illustrated in Figure 2B. The F1 interface establishes communication between the CU and its associated DUs, ensuring efficient coordination of the higher-layer and lower-layer functionalities. The DU is connected to the RU through the low layer split interface. Furthermore, the gNB connects to the UE through the Uu interface that provides service to the end user. The next-generation interface provides connectivity between the entire gNB or specifically its CU and the CN through the access and mobility function (AMF) and user plane function (UPF). The AMF plays crucial roles in authentication, authorization, and mobility management of the UE to ensure secure and seamless network access. Conversely, the UPF is responsible for managing data traffic by facilitating interconnections between the data network and overall network architecture. Finally, the Xn interface enables inter-gNB communication within the RAN, thus supporting HOs and coordination between the different gNBs to enhance mobility and network efficiency (3GPP, 2024a).
3 Functional splits in NTNs
As discussed in the previous section, different FSs offer varying levels of flexibility and efficiency, particularly in terms of latency, processing capability, and resource management. In the traditional TN, the fronthaul and backhaul links are fixed installations that do not change once deployed. However, when examining RAN over NTNs, such as LEO satellites, several unique challenges emerge owing to the dynamic movements of the satellites. These challenges cause frequent disruptions in the fronthaul links owing to satellite movements, increased propagation delays, intermittent connectivity, and the inherent mobility of satellites. Despite these challenges, NTNs present significant opportunities for expanding coverage, especially in remote areas where terrestrial infrastructure deployment may be impractical or cost-prohibitive. By leveraging satellite technology, NTNs can deliver ubiquitous coverage, allowing service providers to reach underserved or unserved populations, thereby bridging the digital divide. We study the applicability of various FS options for NTNs, which have traditionally been used in terrestrial RAN models. We assess the constraints and requirements posed by the unique characteristics of NTN environments by focusing on latency, bandwidth, processing power, and separation distance challenges as well as exploring potential solutions.
3.1 FS requirements for NTNs
Here, we consider a typical NTN setup in which the satellite serves a ground UE via a SL fed by a GS through an FL. The separation distances are determined by the elevation angles between the satellite and both the UE and GS, which are denoted as θ and β, respectively. The separation distance d between the ground entity and satellite at a specified elevation angle θ or β is calculated using Equation 1:
where
where c is the speed of light, and
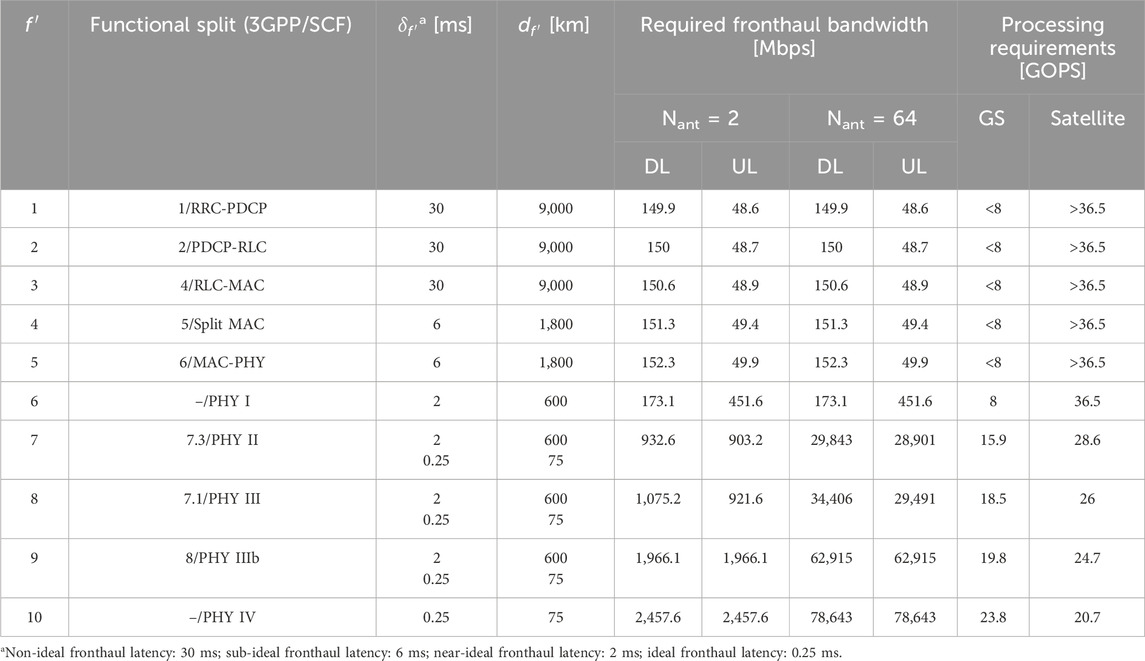
Table 1. Functional splits, fronthaul parameters, and processing requirements (Seeram et al., 2024).
Our objective is to evaluate different FS configurations between the GS and satellite, as illustrated in Figure 2A. In this analysis, we assume various FS options (Table 1), where each FS is characterized by distinct fronthaul latency
3.2 FS evaluation
We evaluate each FS option for the NTN by examining three main factors: separation distance and latency, bandwidth requirements, and processing demands.
3.2.1 Distance and latency constraints
The feasibility of FS options in an NTN depends heavily on the achievable maximum fronthaul distance
The gNB onboard the satellite includes the next-generation interface in the FL, for which the backhaul latency and bandwidth requirements are generally less stringent than those for the fronthaul case. However, there are some latency and capacity considerations that must be managed effectively.
3.2.2 Bandwidth requirements
The fronthaul bandwidth requirements of both the uplink and downlink increase as the FS moves toward the lower layers. Table 1 indicates that for the minimal antenna setup (
3.2.3 Processing requirements
The processing resource requirement is influenced by the FS and is divided between the GS and satellite as shown in Table 1. The processing load on the satellite decreases as the FS shifts to the lower layers, offloading the complexity to the GS, as seen in Table 1. For multiuser scenarios, the processing requirements for user-processing functions increase as the number of users increase, while the complexity of the cell processing functions remains relatively constant (Small Cell Forum, 2016). Moreover, the onboard gNB is suitable for NTNs, in which the satellite has sufficient processing power to manage gNB functions, including the user and cell processing functions.
3.2.4 Challenges and potential solutions
Given the distinct challenges posed by NTNs, especially with respect to the lower-layer FSs, certain adjustments and optimizations are proposed by 3GPP. The latency requirements shown in Table 1 are based on long-term evolution (LTE) with TN features. For NTNs, these requirements can be relaxed by leveraging new radio (NR) NTN specifications that allow asynchronous hybrid automatic repeat request (HARQ) instead of LTE synchronous HARQ, thereby relaxing the fronthaul latency. In NTN Rel-17 (3GPP, 2023), complete disabling of the HARQ feedback is permitted owing to the significantly longer round-trip delays in the NTN. Furthermore, disabling features such as channel state information (CSI) reporting, which impose high latency requirements, could enable feasibility. CSI is typically used to enhance throughput under good terrestrial coverage conditions and may not be essential in NTNs with high-latency links.
4 Network topology and architecture-aware CHO delay analysis
To accurately model CHO delay, it is crucial to identify the topology involved in HO and the satellite architecture. This enables selection of the appropriate CHO procedure to determine the signaling loads across various links, thereby allowing estimation of the CHO delay. Hence, we analyze different topologies and CHO procedures to facilitate comprehensive CHO delay modeling. Given the dynamic nature of NTN environments, where satellites are in constant motion and the UE can be mobile, it is essential to evaluate how the selected FS options perform in terms of delay when performing a HO. This delay analysis help us understand the implications of mobility on the network performance by focusing on aspects such as HO delays, processing times at the GS and satellite, and impacts of varying separation distances during user mobility. By assessing these delays, we can identify the most suitable FS configurations that meet the latency requirements while enhancing the overall system efficiency in mobile NTN scenarios. This understanding will be critical for optimizing network performance and ensuring seamless connectivity for the end users, especially in applications that demand low latencies.
4.1 Handover scenarios under dynamic topologies in NTNs
4.1.1 Disaggregated RAN between the ground and space
To comprehensively evaluate the impacts of delay, we consider three distinct dynamic topologies during CHO, namely A, B, and C, where each case represents a distinct network topology involving different configurations of the satellite, UE, and GS. In each scenario, we consider a mobility context with two cells: a source cell (denoted in blue in Figure 3) in which the user resides initially and a target cell (denoted in yellow) that the user moves into during CHO. The key components include at least one satellite with a network architecture, one GS connected to the CN, and several types of links, such as the SL between the satellite and UE, FL between the satellite and GS, ISL connecting multiple satellites, and IGSL connecting different GSs. The traffic flows are labeled with prefixes “s” and “t” to denote “source” and “target” links, respectively, to indicate the direction of traffic flow before and after CHO.
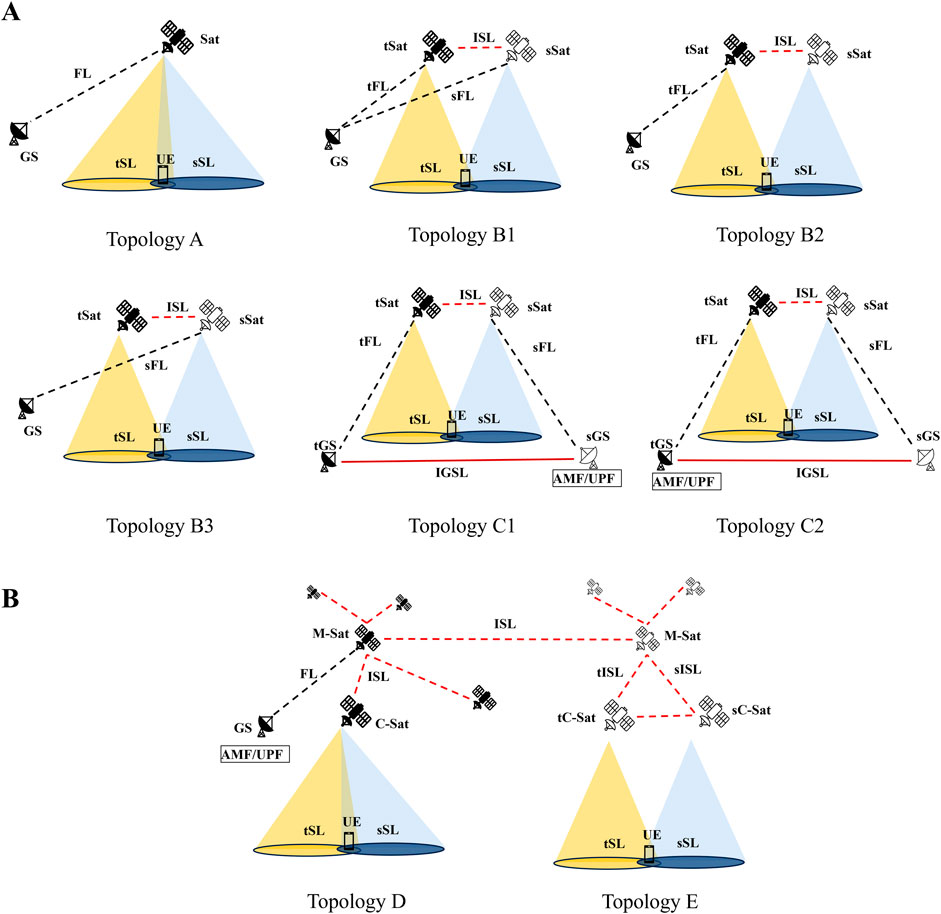
Figure 3. (A) Disaggregated RAN between the ground and space. A: one satellite connected to one ground station (GS); B: two satellites connected to the same GS; C: two satellites and two different GSs. (B) Disaggregated RAN in space. D: one child satellite connected to a master satellite; E: two child satellites connected to the same master satellite.
4.1.1.1 Topology A: Single satellite with multiple cells/beams
Topology A shown in Figure 3A involves a single satellite connected to a GS serving as both the source and target cells. This scenario is also known as intra-satellite HO, and each beam simply represents a cell. Given a large constellation of satellites, this is the most likely topology encountered by the UE since each satellite handles a large number of cells. As the CHO occurs within the same satellite, the impact on CHO delay varies with the satellite architecture used.
4.1.1.2 Topology B: Two satellites connected to the same GS
Topology B (Figure 3A) involves two satellites to manage the source and target cells separately but connected to the same GS. This scenario is typical at the boundaries of coverage areas managed by different satellites and reflects the HOs between adjacent satellites (also known as inter-satellite HOs). The shared GS simplifies CHO coordination but requires ISLs to form subtopologies B1, B2, and B3, as depicted in Figure 3.
4.1.1.3 Topology C: Two satellites connected to different GSs
Topology C (Figure 3A) involves two GSs that are each associated with a different satellite. However, a single AMF/UPF is colocated with one of the GSs to produce subscenarios C1 and C2. This topology is also a part of inter-satellite HO and is less common but may arise at regional boundaries, such as borders between countries. In the CHO scenario C, two complete gNB chains are involved between the GS and satellite, unlike scenarios A and B that have some common function processing at the GS. It is important to note that in realistic cross-border deployments, the presence of two AMFs, each in a different country, is also plausible. This would involve inter-gNB and inter-AMF CHO procedures. However, such cases are not analyzed in this study.
4.1.2 Disaggregated RAN in space
Disaggregated RAN in space enables realization of satellite swarms that can form clusters of smaller satellites operating in coordination. In this topology, all of the RAN functions are performed in space and are split among the satellites. Each cluster comprises one cluster head, which is designated as the mother satellite or master satellite (M-SAT) (Ibrahim et al., 2024), while the remaining satellites are designated as children satellites (C-SATs). However, this topology is vulnerable to a single point of failure: if the M-SAT in a cluster fails, all satellites in the cluster are affected. Figure 3B depicts the satellite swarm network consisting of M-SATs and C-SATs, wherein the RAN functions are pooled in an M-SAT instead of the GS. However, the AMF and UPF remain at the GS and are connected to the M-SAT by an FL. This design enables efficient resource sharing and centralized processing within the satellite network and managed by the M-SAT while still relying on the GS for CN functions, such as user authentication and mobility management.
4.1.2.1 Topology D: C-SATs with multiple cells connected to the M-SAT
Topology D illustrated in Figure 3B shows the scenario where the serving satellite operates under the control of an M-SAT. Here, the UE transition from the source SL to the target SL as they move across cells similar to HO scenario A.
4.1.2.2 Topology E: C-SATs with a shared M-SAT
Topology E depicted in Figure 3B involves a UE moving from the source SL of one satellite to the target SL of another satellite, where both satellites are connected to the same M-SAT node similar to HO scenario B1. Although this scenario resembles B1, there is a key difference in that the resource pooling and higher-layer RAN functions are always executed in space and are split in different ways between the satellites.
4.2 Control and signaling procedures in CHO
To analyze CHO procedures in an NTN architecture, we consider a network setup comprising two chains of gNB functions, one for the source cell and another for the target cell, with the AMF and UPF serving in the CN, as illustrated in Figure 2B. Depending on the satellite network architecture and topology, the RAN functions in the source and target chains are either shared or separated. This setup defines different CHO procedures based on the split option and architecture, which are categorized as intra-DU CHO, inter-DU CHO, and inter-gNB intra-AMF CHO. Each CHO procedure follows a standardized sequence, with signaling over the Uu interface involving the RRC connection (3GPP, 2024b). The procedure can be divided into three phases as setup, buffer, and execution phases, as detailed below.
4.2.1 Intra-DU CHO procedure
In scenarios where the source and target cells share a common DU or RU (e.g., when both RU and DU are deployed on the same satellite), the UE can perform intra-DU CHO. Here, the HO is managed within the same gNB DU, simplifying the process as shown in Figure 4A.
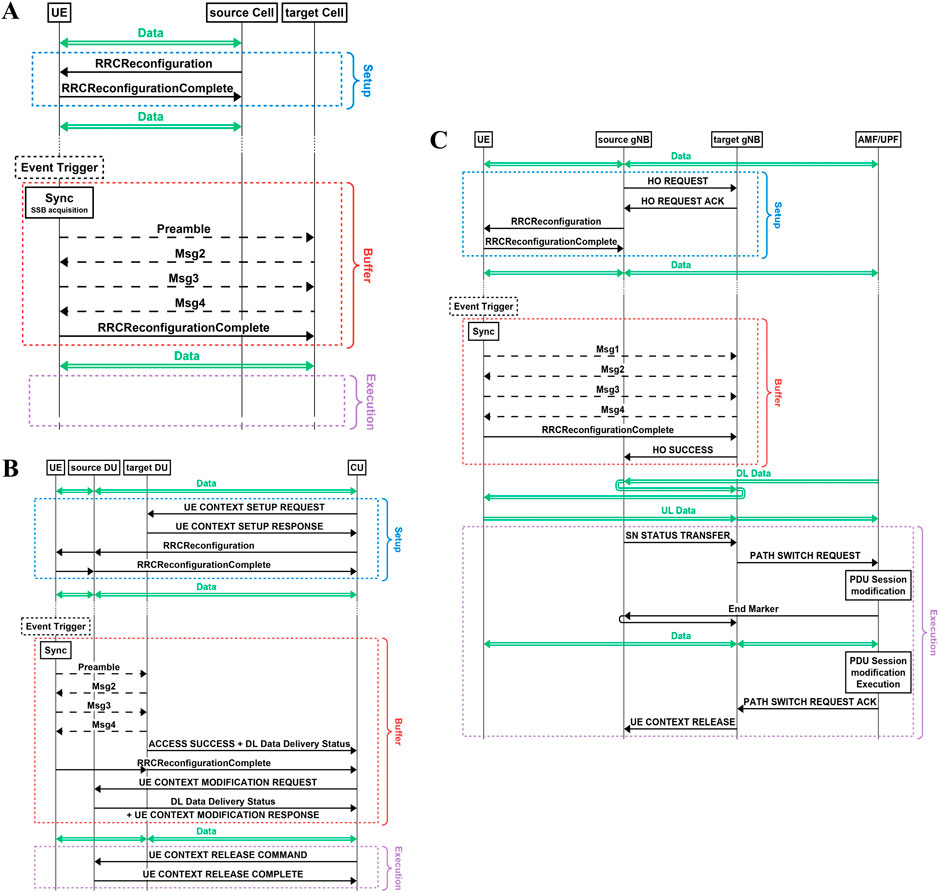
Figure 4. (A) Intra-distributed-unit (DU) conditional handover (CHO) procedure. (B) Inter-DU CHO procedure. (C) Inter-gNB intra-AMF CHO procedure.
4.2.1.1 Setup phase
The source cell (i.e., source beam) of the satellite configures the UE with a trigger condition based on specific metrics (e.g., time, distance, or signal strength between the target and source cells). The UE then starts monitoring the configured metric to prepare for HO.
4.2.1.2 Buffer phase
When the trigger condition is met, the UE synchronizes with the target cell of the satellite by acquiring its synchronization signal block (SSB) to complete the random access channel (RACH) procedure. This process consists of four messages: Msg1 that involves transmission of the random access (RA) preamble; Msg2 or the RA response from the network; Msg3 that may carry RRC signaling messages; and Msg4 that primarily contains an RRC reply to establish a connection other than the contention resolution message. The contention resolution message includes the identity of the UE to confirm that the gNB has successfully identified the UE and resolved any contention. During this phase, data transmission is temporarily paused until the connection is fully reestablished upon receiving the RRC reconfiguration complete message from the UE.
4.2.1.3 Execution phase
The UE resumes data transfer in this phase, and no additional signaling is required, making this CHO efficient in terms of latency and resource utilization.
4.2.2 Inter-DU CHO procedure
When the source and target chains share a CU but have distinct DUs, an inter-DU CHO procedure is performed as shown in Figure 4B. The CU coordinates HO between the two DUs.
4.2.2.1 Setup phase
The CU initiates the setup by querying potential target DUs through the F1 interface to reserve the CHO resources for accommodating the UE. Once the responses are received, the CU configures the UE through the source DU, thus setting the conditions for HO.
4.2.2.2 Buffer phase
When the condition is triggered, data delivery is paused, and the UE starts the synchronization and RACH procedures with the target DU. Once the target DU confirms the Access Success message to the CU, the CU acquires the data delivery status, effectively switching the data connection to the target DU chain and thereby resuming data delivery to the UE.
4.2.2.3 Execution phase
The CU informs the source DU to release the UE context upon completing HO. Furthermore, the CU informs the other target DUs to release the CHO resources that are reserved for the UE.
4.2.3 Inter-gNB intra-AMF CHO procedure
For mobility scenarios involving two complete gNBs and a single AMF (i.e., when the source and target chains are hosted by separate gNBs across different satellites), the inter-gNB intra-AMF CHO procedure is executed as shown in Figure 4C. This process involves more complex signaling over the Xn or next-generation interface. For simplicity, we assume here that signaling will be performed over the Xn interface.
4.2.3.1 Setup phase
The source gNB (sgNB) queries potential target gNBs (tgNBs) over the Xn interface to check for CHO resources and reserve them for the UE. Once the acknowledgments are received, the sgNB configures the UE, thus setting the trigger conditions.
4.2.3.2 Buffer phase
Once the UE meets the trigger condition and completes the synchronization RACH procedure with the tgNB, the tgNB notifies the sgNB of the successful connection. Although the UE can resume data transfer, the CN’s UPF is still unaware of the HO. Therefore, the DL traffic is initially routed through the sgNB, which then forwards it to the tgNB after adding a temporary delay. However, the UL traffic is unaffected as the tgNB directly routes it to the UPF.
4.2.3.3 Execution phase
To finalize HO, the tgNB initiates a path switch request to update the CN functions and UPF. Once the path switch is acknowledged, the tgNB informs the sgNB, which then releases the UE context. This phase fully shifts the DL traffic to the tgNB, thus optimizing data flow by eliminating the forwarding delay through the sgNB.
4.2.4 RACH procedures and impacts on CHO delay
The contention-based RACH is the default procedure used for initial access or when the network does not have prior context about the UE. It involves the exchange of four messages (Msg1–4), during which the network resolves the identity and timing advance (TA). Owing to potential collisions, this method may introduce additional delays, especially under heavy loads or in long-propagation NTN links. In contrast, the contention-free RACH is used when the network already has context about the UE, such as during HO or beam switching. The network assigns a dedicated preamble to the UE, thereby preventing collisions, but still uses the same four-message procedure as the contention-based method. The main benefit here lies in avoiding retransmissions caused by collisions rather than reducing the message count (Saarnisaari et al., 2019; Saarnisaari and de Lima, 2019).
The two-step RACH procedure is designed to reduce access delays by merging Msg1 and Msg3 into a single transmission (MsgA) as well as Msg2 and Msg4 into MsgB. This reduces the number of sequential exchanges and speeds up the access process. However, this approach is only feasible under good coverage conditions as it sacrifices some efficiency for timing alignment. Finally, RACH-less access is an emerging approach applicable when the TA can be assumed to be the same as that of the previous cell. In such cases, the UE may directly transmit Msg3 since the purpose of Msg1 and Msg2 is to determine the TA (Dao et al., 2024). In this work, we focus on contention-based RACH to evaluate its impact on CHO delays in NTNs. However, future studies may explore the two-step RACH and RACH-less methods as suitable, especially for improving support to delay-sensitive applications.
4.3 CHO delay model
To analyze the CHO delay, we define
where
where
where
5 Handover management in dynamic LEO satellite constellation
Here, we investigate the management of HO within a dynamic LEO satellite constellation. First, we introduce a GS-satellite association method by employing the maximum elevation angle as a criterion to associate LEO satellites with GSs and allocate FLs based on their availability at the GS. Next, we explore CHO schemes for optimizing the HO process using service-specific criteria. Specifically, we implement SCB and SLRB CHO schemes to facilitate HO decisions across various NTN scenarios. These schemes are further analyzed to assess their impacts on CHO delays under different satellite network architectures in the dynamic LEO constellation setup.
5.1 LEO satellite constellation model
As shown in Figure 5, we consider a ground-based UE served by LEO satellites with network architecture. Each satellite is equipped with highly directional circular aperture antennas (3GPP, 2019) that serve the ground UEs using Earth-moving cells (non-steerable beams). The visibility conditions of the UE and GS to the satellite are determined by their respective elevation angles. The elevation angle is defined as the angle between the horizontal plane at the UE (or GS) and line connecting it to the satellite. A specific UE is considered visible to the satellite if its elevation angle exceeds a predefined minimum threshold
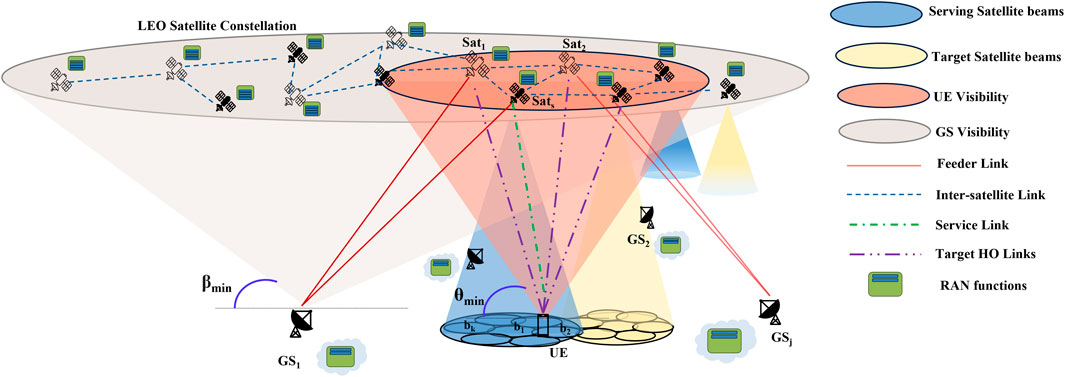
Figure 5. Visibility of user equipment (UE) and GSs by satellites with corresponding links and satellite architectures.
5.1.1 Path loss model
The overall path loss (in decibels) is defined by Equation 7 (Guidotti et al., 2020; Liu et al., 2022):
where
where FSPL represents the free space path loss, SF denotes the shadow fading loss, and CL is the clutter loss. Since the UE is assumed to be outdoors under the LOS condition,
where
5.1.2 Downlink rate calculation
The downlink carrier-to-noise ratio (CNR) for satellite s and beam i at the UE is as given by Equation 10 below (3GPP, 2023):
where
where
where
The antenna gain-to-noise temperature ratio of the receiver is determined by Equation 13:
where
In this study, we assumed an interference-free environment, which effectively represents the best-case scenario for SL capacity estimation in Equation 14. However, real-world NTNs experience co-channel interference from adjacent beams and inter-satellite interference, which could significantly degrade the link performances. The assumption of an interference-free model leads to an upper-bound capacity estimate, meaning that the actual capacity would be lower depending on the interference level.
5.2 Multibeam satellite model
To implement a multibeam satellite architecture, it is essential to understand the projection of the satellite beams onto a defined plane. As proposed by the 3GPP (Guidotti et al., 2020), the UV plane is introduced to map the beam boresight projections of the satellite beams. The beam geometry can be analyzed effectively using the UV plane and requires knowledge of the 3dB beamwidth to determine the beam diameter and its layout.
5.2.1 Satellite beam layout
To define and project a multibeam layout from the satellite onto the Earth’s surface, the system geometry depicted in Figure 6A is considered. For a given 3dB beamwidth and number of beams, the projections are first mapped onto the satellite’s UV plane using Equation 15 (Guidotti et al., 2020):
where
while ensuring that
For instance, a 3dB beamwidth angle
where
where
and
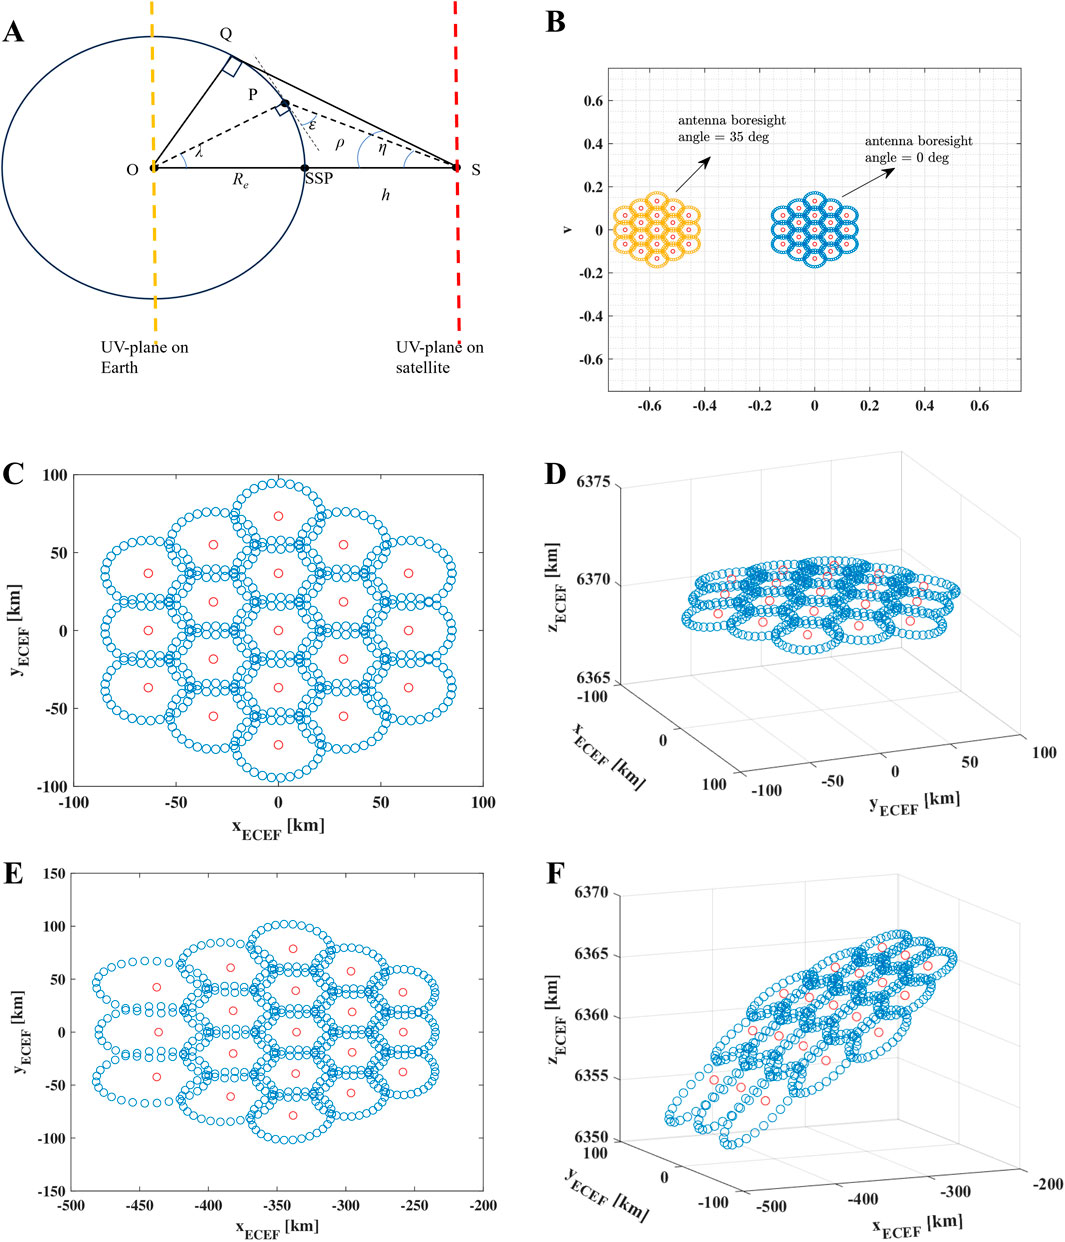
Figure 6. (A) Illustration of UV-plane mapping to the ECEF coordinate system. (B) Projection of 19 beams from the satellite onto the UV plane. (C) Earth-moving cells viewed from the satellite. (D) Earth-moving cells projected in 3D view. (E) Earth-fixed cells viewed from the satellite. (F) Earth-fixed cells projected in 3D view.
In Technical Report 38.811 (3GPP, 2019), the Earth-centered Earth-fixed (ECEF) coordinate system is used to represent the three-dimensional position of any point on the Earth. In this system, the Earth is modeled as a perfect sphere with a radius of 6,371 km, and the origin
5.2.2 Earth-moving vs. Earth-fixed cells
Using the above transformations, we can derive the projections of the satellite beams onto the Earth based on the 3dB beamwidth angle and satellite altitude. Satellite beams can be categorized as either Earth-moving or Earth-fixed cells depending on the type of antenna used on the satellite. Figure 6B illustrates the 19-beam projections on the satellite’s UV plane for the Earth-moving (blue cluster) and Earth-fixed (yellow cluster) cells for a LEO satellite operating in the Ka-band with a 3dB beamwidth of 4.4127°. For the Earth-fixed cells, the antenna boresight angle is continuously adjusted to ensure that the beam remains fixed relative to a specific point on the Earth’s surface. In contrast, for the Earth-moving cells, the boresight angle remains fixed at zero. Figure 6C shows the ECEF coordinates of the Earth-moving 19-beam projection as viewed on the ground from the satellite at an altitude of 550 km. Additionally, Figure 6D highlights the effect of the Earth’s curvature on the beam footprint, demonstrating that the size of each beam footprint remains relatively uniform. Figure 6E depicts the ECEF coordinates of the Earth-fixed 19-beam projection as seen on the ground from the satellite at an altitude of 550 km. In Figure 6F, the impact of the Earth’s curvature is more pronounced on the Earth-fixed cells, resulting in significant variations in beam footprint size. Understanding the modeling and usage of Earth-moving and Earth-fixed cells is crucial for satellite system design as it concerns aspects like power allocation, beam coverage, and antenna steering mechanisms.
5.2.3 Connection time modeling
The high relative speeds of LEO satellites result in frequent and unavoidable HOs in both intra-satellite and inter-satellite scenarios. The maximum duration that a UE remains connected to a beam depends on the satellite altitude (which influences its speed), beam size, and UE velocity. This connection time is given by Equation 24 (3GPP, 2023):
where D is the footprint diameter (in km),
It is important to note that this expression assumes non-overlapping beam footprints and hence represents a conservative estimate of the connection duration. In practical systems, satellite beams often overlap to support seamless mobility, allowing the UE to remain connected beyond the nominal footprint boundary. Moreover, this expression assumes that the UE traverses the full beam diameter along a path aligned with the satellite’s movement, which results in the longest possible connection time. In practice, the UE may cross the beam at an oblique angle or closer to the edge, covering a shorter distance than the full diameter. Moreover, the relative motion between the satellite and UE is not always purely additive as the direction of movement can vary significantly, leading to a lower effective speed.
Although the maximum connection time can be estimated using the footprint diameter, a more precise approach entails replacing the satellite speed with the beam speed, which represents the velocity at which the beam footprint moves across the Earth’s surface. Since the satellite and its footprint share the same orbital period but cover different distances, using the beam speed instead of the satellite speed improves the accuracy of connection time estimation. The beam speed is given by Equation 25:
where
Table 2 provides a comparison of the connection times for single-beam and multibeam scenarios by considering varying 3dB beamwidths for the Ka-band and S-band configurations. This comparison assumes a stationary UE
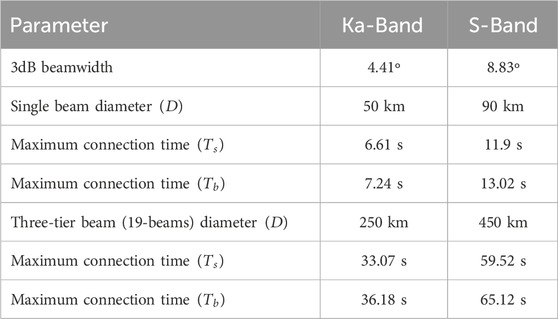
Table 2. Comparison of connection times for varying beam sizes.
5.3 GS–satellite association
To model dynamic topologies, we consider a network of GSs and LEO satellites that dynamically enter and exit the UE visibility region (Figure 5). The GS-satellite association is determined based on the maximum elevation angle criterion, ensuring that a satellite connects to the GS with the highest elevation when entering the visibility region. Each GS can support a limited number of FLs between 8 and 16 typically (Del Portillo et al., 2019). A predefined threshold
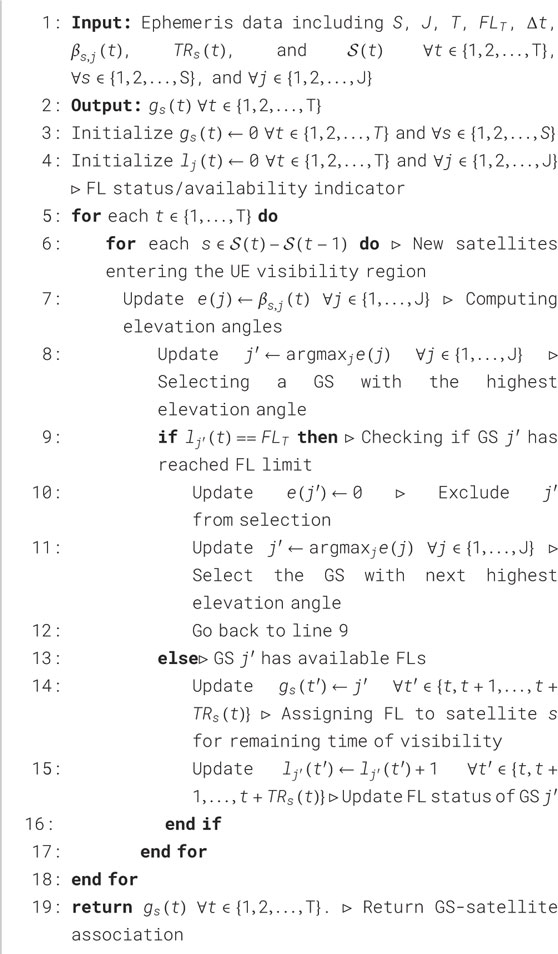
Algorithm 1. GS-satellite association using the maximum elevation angle criterion.
Algorithm 1 establishes a GS–satellite association based on the highest elevation angle
5.4 CHO schemes
We described CHO procedures and signaling involved between the UE, satellites, and GSs in Section 4.2. In this context, we assume that the UE has knowledge of its own location and can access satellite-specific information, such as the satellite ID and ephemeris data. Using this information, the UE continuously monitors the radio link quality of the candidate satellites and executes HO to the target satellite when the necessary conditions are triggered. We evaluate two CHO schemes (Wang et al., 2022) under dynamic LEO constellation scenarios and provide insights into their impacts on system performance. We analyze the system performance based on simple algorithms and note that sophisticated algorithms tailored to the needs must be built.
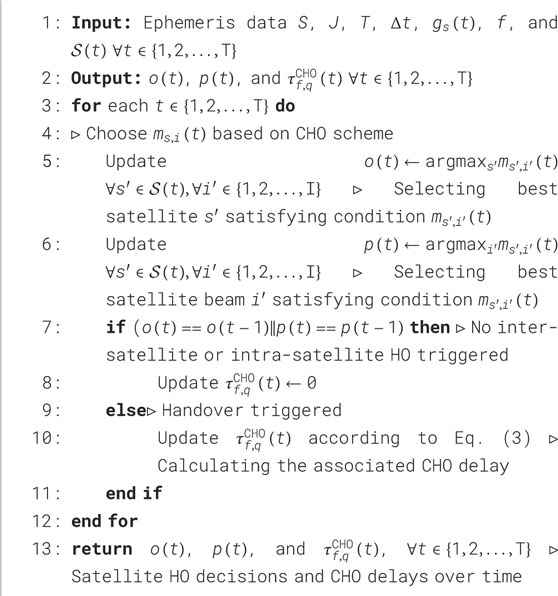
Algorithm 2. General CHO scheme.
Algorithm 2 outlines the general CHO scheme based on the triggering condition
6 Results and analysis
In this section, we analyze the results of two distinct system setups:
6.1 CHO scenarios under dynamic topologies
CHO delays are calculated under different CHO scenarios associated with the various network topologies detailed in Section 4 by considering different network architectures with various FSs. The signaling load is calculated for each topology on different links by considering the CHO procedures presented in Figure 4. A satellite altitude of 600 km is selected here, with the elevation angle to the UE considered as 30°. The elevation angle to the FL varies between 10° and 90°. Moreover, we assume 20 satellites per orbital plane, which results in an inter-satellite distance of 2,184 km. Assuming a specific altitude and elevation angle, the propagation delays for both the SL and FL can be estimated using trigonometric principles. The two GSs are positioned at the edges of the satellite footprints, which are defined by the FL elevation angles. On average, these GSs are separated by the same angle relative to the Earth’s center as the two satellites to facilitate computation of the geodesic distance. For this system setup, the GSs are assumed to be separated by approximately 2,000 km (Satellite Map, 2024). To account for factors such as non-vacuum propagation and indirect routing, this distance is augmented by 20% before being divided by the speed of light to determine the propagation delay (Seeram et al., 2024). The delay parameters used in this setup are listed in Table 3.
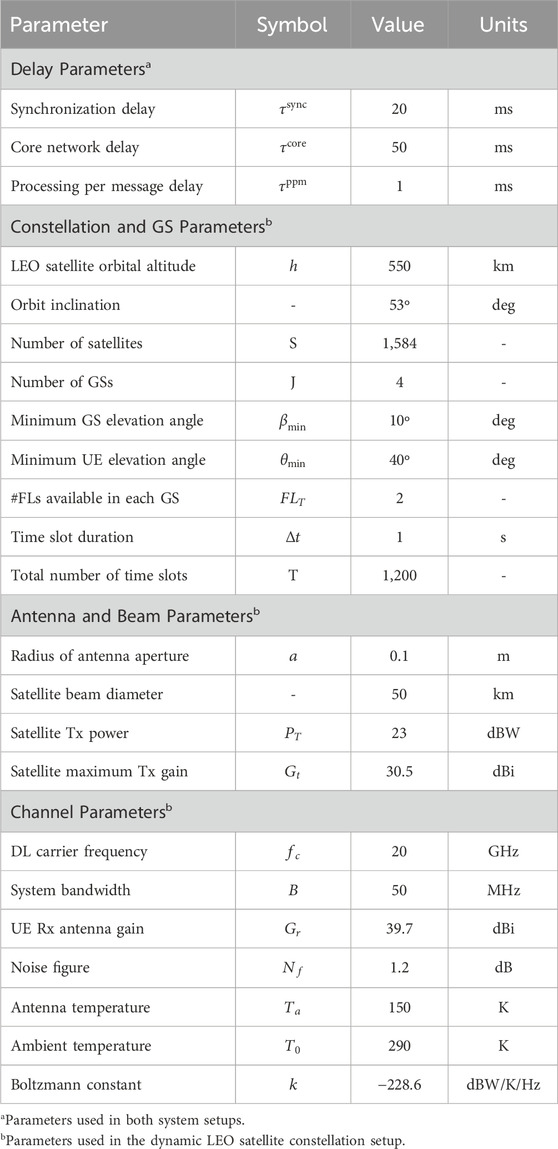
Table 3. Simulation parameters for the LEO satellite constellation modeling.
6.1.1 CHO signaling load
Figure 7A presents the signaling load distribution across various links for different HO scenarios under the transparent architecture. In this architecture, HO scenarios are not feasible under dynamic topologies like B2, B3, D, and E owing to the absence of ISLs. Consequently, all HO signaling messages must traverse both the SL and FL to reach the gNB at the GS. In scenarios A and B1, the gNBs are located at the same GS (Figure 3A), resulting in zero IGSL messages. Conversely, in scenarios C1 and C2, where the gNBs are positioned at different GSs (Figure 3A), IGSL signaling is required during HO.
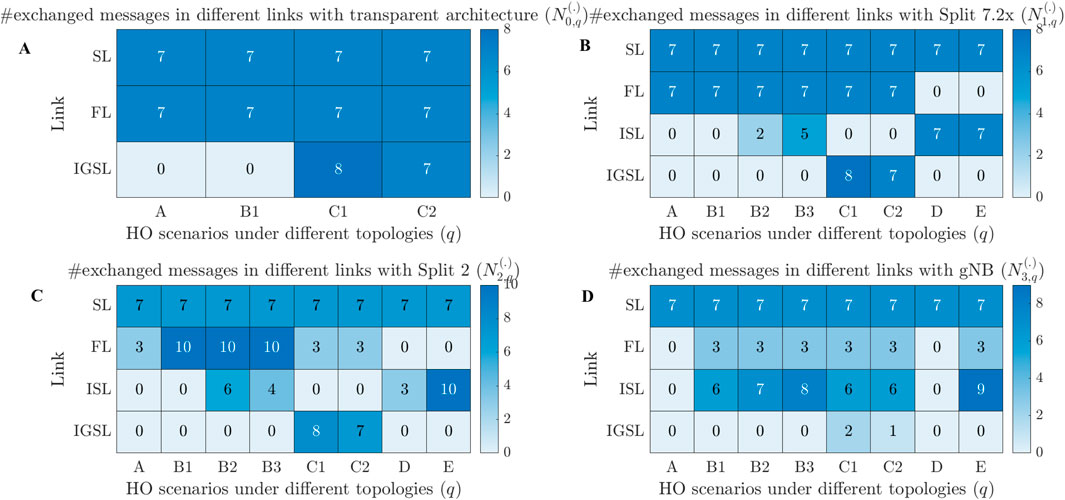
Figure 7. CHO signaling messages under different handover (HO) scenarios with dynamic topology and links for the (A) transparent, (B) Split 7.2×, (C) Split 2, and (D) gNB onboard satellite architectures.
Figure 7B depicts the signaling load distribution for different HO scenarios when implementing Split 7.2×. This FS enables the satellite to decode and route packets, thereby allowing the establishment of ISLs and supporting additional HO scenarios under dynamic topologies such as B2, B3, D, and E. As shown in Figure 4, even RACH-related messages must be processed at the GS (or at the M-SAT for scenarios D and E) owing to the absence of the MAC layer functions at the serving satellite. Consequently, Figure 7B shows that the signaling load across different links remains similar to that of the transparent case, except for the newly introduced scenarios (B2, B3, D, and E). The key advantage of Split 7.2× is that it extends GS coverage to satellites through ISLs (scenarios B2 and B3), which results in control signaling exchange within the ISL for these scenarios. In scenarios C1 and C2, IGSL signaling load is observed owing to the geographic separation of the GSs. Additionally, for satellite swarm HO scenarios (D and E), the signaling load patterns resemble those of scenarios A and B1, with the distinction that the load is exchanged through ISL instead of FL owing to complete relocation of the gNB functions across satellites.
Figure 7C illustrates the signaling load distribution when implementing Split 2. Here, the RACH-related messages can be processed at the serving satellite, but the RRC-related messages are forwarded to the GS over the F1 interface (or to the M-SAT for scenarios D and E). The increased onboard processing capabilities of the satellites help reduce FL signaling in scenarios A and C compared to Split 7.2×. However, for scenario B, both FL and ISL signaling increase despite the enhanced onboard processing capabilities. This suggests that Split 7.2× is the most suitable for scenario B. However, this choice comes at the cost of significantly higher fronthaul bandwidth requirements, as shown in Table 1, which range from 1 to 34 Gbps depending on the antenna size while the current FL bandwidth is approximately 20 Gbps (Del Portillo et al., 2018). In the satellite swarm HO scenario D, the Split 2 architecture reduces ISL signaling compared to that in Split 7.2×, whereas ISL signaling increases for scenario E.
Figure 7D shows the signaling load distribution when a fully onboard gNB is deployed. Moving the entire gNB to the satellite significantly reduces the FL message exchanges compared to Split 2 with topologies A and B. However, this increases ISL signaling (for all scenarios except A and D) and decreases IGSL signaling (only for scenario C). Overall, deploying the gNB onboard the satellite reduces control signaling to seven message exchanges over the SL in HO scenarios A and D, where only intra-satellite HO occurs. For other scenarios, control signaling in the FL and IGSL decrease, albeit with a slight increase in ISL signaling. However, this approach incurs a computational cost as onboard gNB implementation requires 55%–70% higher computational cost (and hence higher power consumption) than Split 7.2×, as detailed in Table 1.
The reduction of control signaling overhead is significant in an NTN where mobility events predominantly occur for changes in the serving satellites for specific cells or cell movements in the case of Earth-moving cells. These events typically occur every few minutes (or every few seconds in case of intra-satellite HO), prompting all users within the cell to simultaneously execute mobility procedures. Although strategies like aggregating the control signaling load or distributing the HOs over time can help mitigate this issue, a significant amount of signaling load is still expected.
6.1.2 CHO delay
Herein, we analyze the CHO delay considering varying FL elevation angles while maintaining a minimum SL elevation angle of 30°. We capture HO trigger instances across different satellite network architectures in various HO scenarios associated with different topologies to investigate the CHO delay dynamics by analyzing how changing topology impacts CHO delay. Note that we focus on scenarios supported by the transparent architecture (A, B1, C1, and C2) for comparative analysis with other regenerative architectures. However, the transparent architecture results are omitted from further plots as they overlap with the Split 7.2× results, meaning that all observations for Split 7.2× also apply to the transparent architecture.
From Figure 8, it is evident that scenario A (intra-satellite HO) has lower CHO delays for any network architecture as the gNB onboard the satellite offers the minimum CHO delay; however, in scenario B1 (inter-satellite HO with common GS), both transparent architecture and Split 7.2× offer minimum CHO delays. For scenarios C1 and C2 (inter-satellite HO with different GSs), the gNBs onboard the satellites minimize CHO delays effectively. For HO scenarios involving topologies A, C1, and C2, gNB offers the lowest CHO delay followed by the Split 2 and Split 7.2× architectures; however, for B1, Split 7.2× offers the lowest CHO delay followed by Split 2 and gNB. It is notable that the characteristics of the CHO delays for Split 7.2× with topology A overlap with those of topology B1; this indicates that for inter-satellite HO scenarios, it is better for the HO to occur to a target satellite connected to the same GS as the serving satellite. This is because of the unique benefit of having lower CHO delays when switching from intra-satellite to inter-satellite HO, which is critical for delay-sensitive services. However, the CHO delays are very high in the C1 and C2 scenarios, making them suitable for delay-tolerant services. Similarly, for the Split 2 architecture, topology B1 has the least CHO delays among inter-satellite HO scenarios, which would be the best option for delay-sensitive services. For gNB onboard, inter-satellite HO scenarios typically have higher CHO delays and are not suitable for delay-sensitive services. However, if the service time of the UE can be met before triggering an inter-satellite HO, then gNB onboard is the best architecture that offers minimum CHO delays. A critical consideration here is the frequency at which each scenario occurs, which influences the overall evaluation of the best architecture. For instance, a HO scenario with a higher CHO delay may occur less frequently, potentially altering the assessment of the best configuration. This aspect is further explored in the following section, where we analyze the dynamic LEO constellation setup for different CHO schemes.
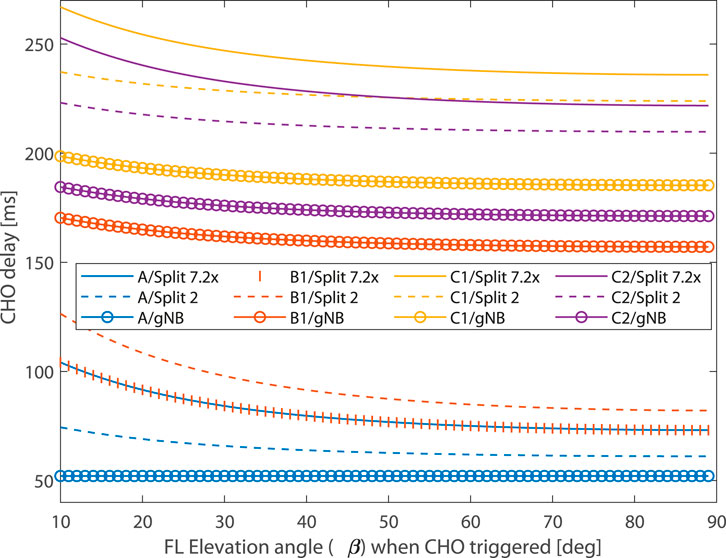
Figure 8. CHO delays under different HO scenarios and satellite architectures for varying feeder link (FL) elevation angles. A: CHO within the same satellite; B1: CHO between satellites connected to the same GS; C1: CHO between satellites connected to different GSs with AMF/UPF at the source GS; C2: CHO between satellites connected to different GSs with AMF/UPF at the target GS.
6.2 Conditional handover in dynamic LEO constellation
The system-level simulation setup illustrated in Figure 5 is implemented based on recommendations (3GPP, 2023, 2024a, 2019). The main parameters for this simulation setup are outlined in Table 3. For constellation dynamics, the Starlink LEO configuration is used, which comprises 1,584 satellites in 72 orbital planes, with 22 satellites per plane at an altitude of 550 km and inclination of 53° (FCC, 2018). Each satellite is equipped with highly directional circular aperture antennas to serve the UE using Earth-moving cells to enable 19 NR cells through 19 satellite beams, which are distributed on the ground in three concentric tiers, as shown in Figure 6C. The satellite specifications are set based on the assumptions in 3GPP (2023). Starlink GS locations are incorporated (Satellite Map, 2024) with the number of GSs set to four. The GS positions are [38.33458°N, 0.4909°E; 50.9871°N, 2.1255°E; 45.3207°N, 9.1886°E; 50.3353°N, 8.5320°E]. The UE is positioned with coordinates [45.78°N, 1.75°E] to encompass the selected GSs. The LEO constellation dynamics (ephemeris data) are sampled at 1-s intervals over a total duration of 20 min, supplying data for the CHO delay performance analysis across different CHO algorithms and satellite architectures. The occurrence of HO scenarios under different topologies is analyzed for the dynamically changing network topology. In this study, GS1 and GS4 are selected for the AMF/UPF based on the IGSL distance. Both SCB and SLRB CHO algorithms are implemented and tested across this dynamic LEO constellation setup with different satellite network architectures.
6.2.1 GS–satellite association
Algorithm 1 is implemented to dynamically associate the GSs with satellites entering the visibility of the UE, with each GS limited to a maximum of two dedicated FLs. The UE is served by a satellite that is in turn connected to one of the four GSs through an FL. Analyzing the percentage of time that each GS serves the UE through a satellite provides valuable insights into the dynamic nature of GS selection. This association varies based on the CHO scheme used to trigger HO events. Figure 9 presents the percentage of time that each GS is involved in serving the UE through a satellite and demonstrates that the GS–satellite association algorithm effectively assigns FLs to satellites as they enter visibility. Specifically, Figure 9A shows that GS3 predominantly serves the UE under the SCB scheme, while the other GSs also contribute significantly. Similarly, Figure 9B illustrates that GS2 plays the most prominent role in serving the UE under the SLRB scheme. This analysis is instrumental in identifying the optimal GS for content caching and guiding the development of efficient content placement algorithms.
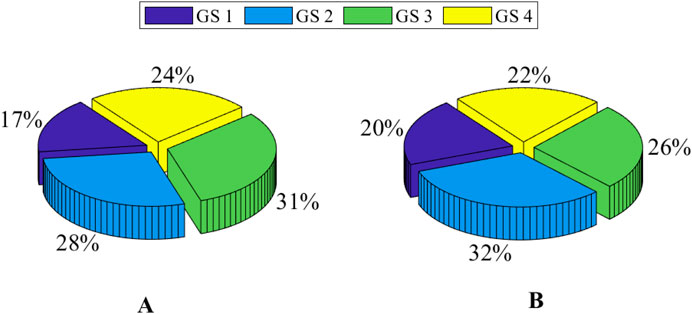
Figure 9. Percentage of time that the UE is served by a particular GS through the satellite when using the (A) service-capacity-based (SCB) and (B) service-link-rate-based (SLRB) schemes.
6.2.2 Performance comparison of the CHO schemes
The SCB and SLRB CHO schemes were implemented to allow the UE to make HO decisions under dynamic system-level simulations. The rate of HOs per minute is a valuable metric for evaluating the performances of the different CHO schemes. Table 4 summarizes the number of intra-satellite and inter-satellite HOs occurring with each scheme over a 20-min duration along with the corresponding HO rates. It is noted that intra-satellite HOs occur due to HOs between beams of the same satellite, which typically corresponds to topology A; however, inter-satellite HOs encompass a combination of topologies B1, C1, and C2. The intra-satellite HO rates are 18.1 and 19 HOs/min/UE for the SCB and SLRB CHO schemes, respectively, implying that the UE performs a HO approximately once every 3 s. For inter-satellite HOs, the rates are 2.85 and 3.7 HOs/min/UE for SCB and SLRB, respectively, corresponding to one HO every 15–20 s. Notably, the SCB scheme outperforms SLRB by reducing unnecessary HOs as it selects the target satellite based on its remaining service time, thereby improving HO efficiency.
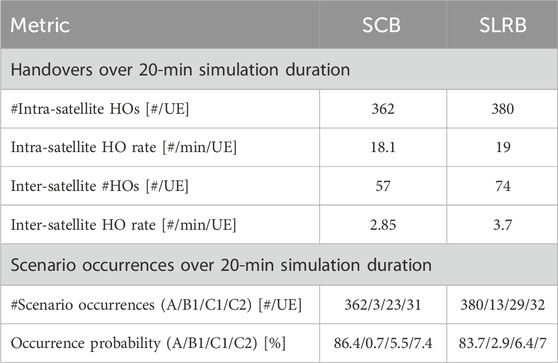
Table 4. Comparison of CHO schemes in terms of HO and occurrence metrics.
Table 4 also provides a quantitative summary of the number and occurrence probability of HO scenarios with topologies A, B1, C1, and C2 over 20 min for each CHO scheme. From the table, it is evident that scenario A has high occurrence probabilities of 86.4% and 83.7% for the SCB and SLRB schemes, respectively. Conversely, scenario B1 has the least occurrence probabilities of 0.7% and 2.9% for SCB and SLRB, respectively. Similar trends are noted for scenarios C1 and C2 in alignment with our initial observations. Given these occurrence probabilities of different scenarios, we can assess whether the performances of the HO scenarios identified in Figure 8 remain the same under the dynamic setup. Accordingly, the hierarchy of CHO delay performance shows that scenario C1 is the least efficient followed by scenarios C2 and B1, with scenario A being the most efficient. We observed that scenarios C1 and C2 occurred with probabilities of 6% and 7%, respectively, while scenario B1 occurred with a probability of 1%–3%. However, scenario A occurred approximately 84%–86% of the time, making it the most frequent contributor to CHO delays despite its efficiency. This high frequency of scenario A is primarily attributed to the intra-satellite HOs, which are generally unavoidable given the system design.
To reduce the overall CHO delay, it may be beneficial to focus on avoiding less-efficient scenarios, particularly scenarios C1 and C2, which contribute more to the total CHO delay than scenario B1. Therefore, there is potential to design network-architecture-aware and topology-aware HO algorithms that prioritize avoidance of scenarios C1 and C2 where feasible as this could lead to lower CHO delays overall. However, given that scenarios C1 and C2 only occur with low probabilities, the overall impact of such optimizations on CHO delay may be limited. Further evaluations are therefore needed to determine whether reducing less-frequent scenarios could significantly decrease the total CHO delay in practice.
6.2.3 CHO delay
Figure 10A illustrates the CHO delays incurred during a HO in time slot t across different network architectures when the SCB scheme is used within a dynamic LEO satellite environment. The bottom region wherein the CHO delay is less than 100 ms represents the intra-satellite HO delays. We can see that the gNB has the lowest intra-satellite CHO delay since all RAN functions are processed onboard the satellite, followed by the Split 2 architecture; the highest CHO delay is observed in Split 7.2×.
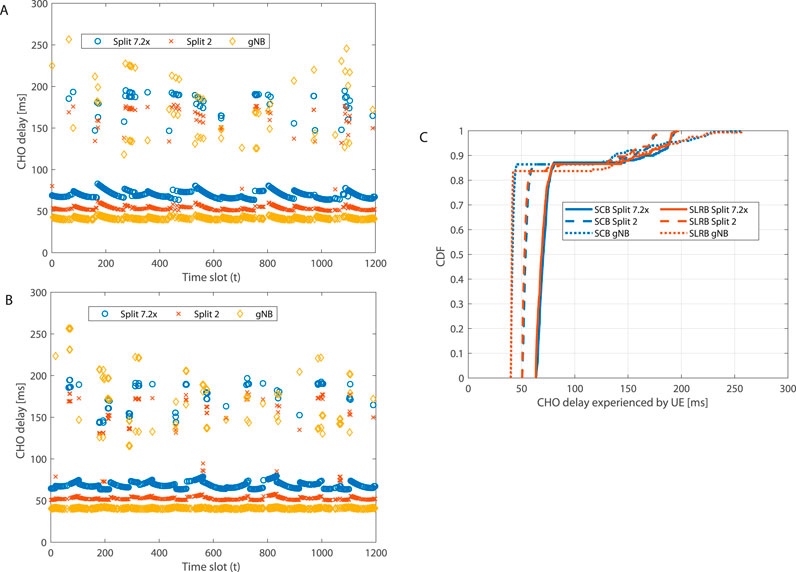
Figure 10. Illustration of CHO delays associated with HO triggering over 1,200 time slots under the (A) SCB and (B) SLRB CHO schemes. (C) Cumulative distribution functions of the CHO delays experienced by the UE under different schemes and satellite architectures.
In Figure 10A, the region where the CHO delay exceeds 100 ms represents the inter-satellite HOs, and we can also see some inter-satellite HOs for Split 7.2× and Split 2 in the region less than 100 ms owing to the characteristics observed in Figure 8. We observe that gNB sometimes exhibits higher CHO delays than Split 2 and Split 7.2× according to Figure 10A. However, from Figure 8, we observe that gNB always has lower CHO delays compared to other architectures, except for the B1 HO scenario. However, in Figure 10A, there are instances where the CHO delay in gNB is higher owing to the dynamicity consideration in the inter-satellite distances and service link distances. Similarly, Figure 10B can be analyzed for the SLRB CHO scheme. However, Figure 10 does not clearly show the contributions of each CHO scheme and architecture to the overall CHO delay. Hence, Table 5 presents the cumulative CHO delay for each satellite architecture and CHO scheme over the 1,200 time slots whenever a HO is triggered. This table reveals that the SCB CHO scheme results in a lower cumulative CHO delay than the SLRB scheme for any satellite architecture. However, despite the instances of higher CHO delays for gNB in inter-satellite HOs, the cumulative CHO delay is lowest for gNB, with values of 24.9 s for the SCB and 28.3 s for the SLRB schemes. The SCB scheme achieves the lowest CHO delay owing to the lower frequencies of both intra-satellite and inter-satellite HOs, as shown in Table 4, where gNB performs the best. Thus, in the long term, gNB is advantageous for minimizing the cumulative CHO delay. However, the gNB onboard decreases the CHO delay by 25%–30% compared to Split 7.2×. There is no gain in terms of the CHO delay between the transparent architecture and Split 7.2×.
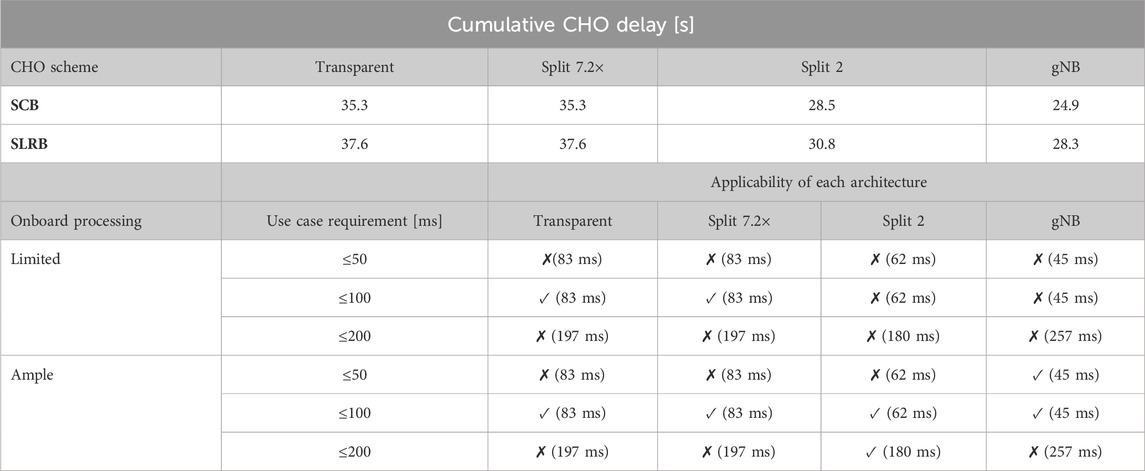
Table 5. Cumulative CHO delay and applicability of each architecture.
Figure10C shows the cumulative distribution functions (CDFs) of the CHO delays for different satellite architectures and CHO schemes. The region below 100 ms mostly represents intra-satellite HO distribution, whereas the region beyond 100 ms represents inter-satellite HO distribution. It is observed that the average CHO delays during intra-satellite HO, irrespective of the CHO scheme, are 70 ms, 53 ms, and 41 ms for Split 7.2×, Split 2, and gNB, respectively. Similarly, the maximum intra-satellite CHO delays are 83 ms, 62 ms, and 45 ms for Split 7.2×, Split 2, and gNB, respectively. However, there are inter-satellite HO delays less than 100 ms for Split 7.2× and Split 2 when the HO scenario is B1. Consequently, the average CHO delays for inter-satellite HOs span a broader range, with averages of 164 ms, 151 ms, and 173 ms for Split 7.2×, Split 2, and gNB, respectively. According to Figure 10C, the maximum inter-satellite CHO delays are 197 ms, 180 ms, and 257 ms for Split 7.2×, Split 2, and gNB, respectively.
Table 5 summarizes the applicability of various satellite architectures (transparent, Split 7.2×, Split 2, and gNB) in NTN scenarios across different use cases (delay-sensitive: 50 ms and 100 ms; delay-tolerant: 200 ms) and onboard processing capabilities (limited vs. ample). For delay-sensitive requirements (50 ms and 100 ms), the maximum intra-satellite CHO delays are considered, while the maximum inter-satellite CHO delays are used for delay-tolerant applications (200 ms), as indicated in the parentheses in Table 5. In scenarios with limited onboard processing, the satellite cannot support computationally intensive RAN functions. Thus, architectures requiring minimal processing on the satellite, namely transparent and Split 7.2×, are more applicable. Under the 100 ms delay requirement, both transparent and Split 7.2× architectures remain viable owing to their maximum intra-satellite CHO delays of 83 ms, leaving sufficient budget for transmission and propagation. However, these architectures do not meet the more stringent 50 ms requirement or the delay-tolerant 200 ms case, where inter-satellite CHO delays exceed the limit for most options.
When ample onboard processing is available, all architectures are feasible in terms of the computational requirements. In this case, the determining factor is the residual delay budget after accounting for maximum CHO delays. Under the stringent requirement of 50 ms, only the gNB onboard architecture is applicable with its maximum CHO delay of 45 ms, which leaves a narrow 5 ms budget for packet transmission and propagation. For the 100 ms case, all architectures meet the requirement owing to their intra-satellite CHO delays that range from 45 ms to 83 ms. For the 200 ms delay-tolerant case, only Split 2 is considered truly applicable despite all architectures having inter-satellite CHO delays near the limit; here, Split 2 achieves a maximum CHO delay of 180 ms, leaving a reasonable 20 ms budget, whereas the transparent and Split 7.2× architectures have CHO delays of 197 ms, leaving only 3 ms for propagation and transmission. Given that the propagation delay alone may consume approximately 2 ms, the remaining 1 ms for transmission imposes very tight constraints, particularly under large packet sizes or low link rates. Therefore, Split 2 offers the most practical margin for reliable operation under this use case.
7 Discussion
This study investigates the interplay among CHO delay, computational complexity, and control signaling overheads under different FSs using a realistic dynamic Starlink LEO constellation model with GS connectivity. Through extensive simulations, we evaluate three open-RAN-based regenerative architectures (gNB onboard, Split 2, and Split 7.2×) and compare them with a transparent architecture to assess the impacts on control signaling overheads and CHO delays. Our findings reveal distinct tradeoffs among the different FSs in NTNs. For any HO scenario except inter-satellite HO for satellites connected to the same GS, the gNB onboard satellite minimizes CHO delay compared to the Split 2 and Split 7.2× satellite architectures (since there is no signaling in the ISLs). Furthermore, transitioning from a transparent architecture to Split 7.2× does not reduce the CHO delay. However, Split 7.2× has greater onboard processing capabilities that facilitate packet decoding and forwarding through ISLs, enabling extended GS coverage through a multihop topology.
In terms of computational cost, the gNB onboard architecture demands approximately 55%–70% more resources than Split 7.2×. Although Split 7.2× is more efficient computationally, it introduces 25%–30% higher cumulative CHO delay. These observations underscore the need to identify the applicability of each architecture based on the service requirements. With limited onboard processing, only the transparent and Split 7.2× architectures support delay-sensitive services up to 100 ms. When ample processing is available, gNB is the only viable option for stringent 50 ms delay requirements, while Split 2 is best suited for delay-tolerant services with 200 ms requirements.
Further performance improvements can be achieved by optimizing the CHO algorithm to reduce inter-satellite HOs, thereby decreasing the cumulative CHO delay. However, the HO rate itself cannot be significantly improved through CHO optimization owing to the physical limitations imposed by fast Earth-moving cells. Future research efforts could therefore investigate Earth-fixed cell configurations to provide more stable coverage while significantly reducing HO frequency. Some additional research directions would include leveraging RACH-less or two-step RACH procedures wherever applicable to reduce HO control signaling, thereby reducing CHO delays. Additionally, employing CHO schemes tailored to specific service requirements could help optimize HO frequency. Content caching at strategically selected GSs could further reduce delays in content retrieval to enhance user experience. Another promising research direction involves investigating mixed satellite architectures within a constellation instead of uniform satellite architecture distribution. Analyzing NTN performances under such hybrid architectures could offer new optimization opportunities. Network-topology-aware CHO algorithms that proactively avoid HOs to satellites with high CHO delays could further enhance user experience and improve the overall system performance.
Author contributions
SS: conceptualization, formal analysis, investigation, methodology, visualization, writing – original draft, writing – review and editing, data curation, software, and validation. LF: conceptualization, investigation, writing – original draft, and writing – review and editing. MO: formal analysis, supervision, validation, and writing – review and editing. SZ: investigation, supervision, and writing – review and editing. CC: conceptualization, formal analysis, funding acquisition, investigation, methodology, project administration, supervision, validation, writing – original draft, and writing – review and editing.
Funding
The author(s) declare that financial support was received for the research and/or publication of this article. This work was supported by the CELTIC-NEXT Project “6G for Connected Sky (6G-SKY)” through funding received from the Swedish Innovation Agency Vinnova.
Acknowledgments
The authors would like to thank Dominic Schupke from Airbus, Germany.
Conflict of interest
The authors declare that the research was conducted in the absence of any commercial or financial relationships that could be construed as a potential conflict of interest.
Generative AI statement
The authors declare that no Generative AI was used in the creation of this manuscript.
Publisher’s note
All claims expressed in this article are solely those of the authors and do not necessarily represent those of their affiliated organizations, or those of the publisher, the editors and the reviewers. Any product that may be evaluated in this article, or claim that may be made by its manufacturer, is not guaranteed or endorsed by the publisher.
References
Alabbasi, A., and Cavdar, C. (2017). “Delay-aware green hybrid CRAN,” in 2017 15th international symposium on modeling and optimization in mobile, ad hoc, and wireless networks (WiOpt), Paris, France, May 15–19, 2017 (Piscataway, NJ: IEEE), 1–7.
Alabbasi, A., Wang, X., and Cavdar, C. (2018). Optimal processing allocation to minimize energy and bandwidth consumption in hybrid CRAN. IEEE Trans. Green Commun. Netw. 2, 545–555. doi:10.1109/tgcn.2018.2802419
Alliance, N. (2015). Further study on critical C-RAN technologies. Next Gener. Mob. Netw. 64. Available online at: https://www.ngmn.org/wp-content/uploads/NGMN_RANEV_D2_Further_Study_on_Critical_C-RAN_Technologes_v1.0.pdf
Campana, R., Amatetti, C., and Vanelli-Coralli, A. (2023). “O-RAN based non-terrestrial networks: trends and challenges,” in Joint European conference on networks and communications and 6G summit (EuCNC/6G Summit), Gothenburg, Sweden, June 06–09, 2023 (Piscataway, NJ: IEEE), 264–269.
China Mobile (2011). C-RAN: the road towards green RAN. Beijing, China: China Mobile Research Institute. White paper. Available online at: https://www.cpri.info/downloads/eCPRI_v_1_1_2018_01_10.pdf
Common Public Radio Interface (CPRI) (2018). eCPRI specification V1.1: interface specification. Common Public Radio Interface CPRI, Tech. Rep. Available online at: https://www.cpri.info/downloads/eCPRI_v_1_1_2018_01_10.pdf
Dai, C.-Q., Liu, Y., Fu, S., Wu, J., and Chen, Q. (2019). “Dynamic handover in satellite-terrestrial integrated networks,” in 2019 IEEE Globecom Workshops (GC Wkshps), Waikoloa, HI, December 09–13, 2019 (Piscataway, NJ: IEEE), 1–6.
Dao, N.-N., Tu, N. H., Hoang, T.-D., Nguyen, T.-H., Nguyen, L. V., Lee, K., et al. (2024). A review on new technologies in 3GPP standards for 5G access and beyond. Comput. Netw. 245, 110370. doi:10.1016/j.comnet.2024.110370
Dazhi, M. N., Al-Hraishawi, H., Shankar, B., Chatzinotas, S., and Grotz, J. (2024). Joint NTN slicing and admission control for infrastructure-as-a-service: a deep learning aided multi-objective optimization. IEEE Trans. Cognitive Commun. Netw. 11, 1. doi:10.1109/TCCN.2024.3461673
Del Portillo, I., Cameron, B., and Crawley, E. (2018). “Ground segment architectures for large LEO constellations with feeder links in EHF-bands,” in 2018 IEEE aerospace conference, Big Sky, MT, March 03–10, 2018 (Piscataway, NJ: IEEE), 1–14.
Del Portillo, I., Cameron, B. G., and Crawley, E. F. (2019). A technical comparison of three low earth orbit satellite constellation systems to provide global broadband. Acta Astronaut. 159, 123–135. doi:10.1016/j.actaastro.2019.03.040
Demir, O. T., Masoudi, M., Björnson, E., and Cavdar, C. (2024). Cell-free massive MIMO in O-RAN: energy-aware joint orchestration of cloud, fronthaul, and radio resources. IEEE J. Sel. Areas Commun. 42, 356–372. doi:10.1109/jsac.2023.3336187
Demir, Y. I., Solaija, M. S. J., and Arslan, H. (2022). “On the performance of handover mechanisms for non-terrestrial networks,” in 2022 IEEE 95th vehicular technology conference: (VTC2022-Spring), Helsinki, Finland, June 19–22, 2022 (Piscataway, NJ: IEEE), 1–5.
Duan, C., Feng, J., Chang, H., Song, B., and Xu, Z. (2018). “A novel handover control strategy combined with multi-hop routing in LEO satellite networks,” in 2018 IEEE international parallel and distributed processing symposium workshops (IPDPSW), Vancouver, BC, May 21–25, 2018 (Piscataway, NJ: IEEE), 845–851.
Eydian, S., Hosseini, M., and Kurt, G. K. (2025). Handover strategy for leo satellite networks using bipartite graph and hysteresis margin. IEEE Open J. Commun. Soc. 6, 1. doi:10.1109/OJCOMS.2025.3541962
FCC (2018). SpaceX non-geostationary satellite system. Available online at: https://fcc.report/IBFS/SAT-MOD-20181108-00083/1569860 (Accessed February 14, 2025).
Giordani, M., and Zorzi, M. (2021). Non-terrestrial networks in the 6G era: challenges and opportunities. IEEE Netw. 35, 244–251. doi:10.1109/mnet.011.2000493
3GPP (2017). Study on new radio access technology: radio access architecture and interfaces (Release 14). 3rd Generation Partnership Project 3GPP, Technical Report TR 38.801.
3GPP (2019). Study on New Radio (NR) to support non-terrestrial networks (Release 14). 3rd Generation Partnership Project 3GPP, Tech. Rep. TR 38.811 v15.2.0.
3GPP (2023). Solutions for NR to support non-terrestrial networks (NTN). 3rd Generation Partnership Project 3GPP. Tech. Rep. TR 38.821 V16.2.0,
3GPP (2024a). NG-RAN; Architecture description. 3rd Generation Partnership Project 3GPP, Tech. Rep. TS 38.401 v18.0.0.
3GPP (2024b). NR; radio resource control (RRC); protocol specification. 3rd generation partnership project 3GPP, Tech. Rep. TS 38.331 v18.0.0.
Guidotti, A., Vanelli-Coralli, A., Mengali, A., and Cioni, S. (2020). “Non-terrestrial networks: link budget analysis,” in ICC 2020-2020 IEEE international conference on communications (ICC), Dublin, Ireland, June 07–11, 2020 (Piscataway, NJ: IEEE), 1–7.
He, S., Wang, T., and Wang, S. (2020). “Load-aware satellite handover strategy based on multi-agent reinforcement learning,” in Globecom 2020–2020 IEEE global communications conference, 1–6. doi:10.1109/GLOBECOM42002.2020.9322449
Houle, J., Ramakrishnan, K., Sadhvani, R., Yuksel, M., and Kalyanaraman, S. (2007). The evolving internet-traffic, engineering, and roles (TPRC). Arlington, United States: SSRN. Available online at: https://ssrn.com/abstract=2117594
Hu, X., Song, H., Liu, S., and Wang, W. (2018). Velocity-aware handover prediction in LEO satellite communication networks. Int. J. Satell. Commun. Netw. 36, 451–459. doi:10.1002/sat.1250
Ibrahim, H. A., Shouman, M. A., El-Fishawy, N. A., and Ahmed, A. (2024). Improving the reliability of nanosatellite swarms by adopting blockchain technology. Complex & Intelligent Syst. 10, 7163–7182. doi:10.1007/s40747-024-01510-3
Juan, E., Lauridsen, M., Wigard, J., and Mogensen, P. (2022). Handover solutions for 5G low-earth orbit satellite networks. IEEE Access 10, 93309–93325. doi:10.1109/access.2022.3203189
Larsen, L. M., Checko, A., and Christiansen, H. L. (2018). A survey of the functional splits proposed for 5G mobile crosshaul networks. IEEE Commun. Surv. Tutorials 21, 146–172. doi:10.1109/comst.2018.2868805
Lee, J.-H., Park, C., Park, S., and Molisch, A. F. (2024). Handover protocol learning for LEO satellite networks: access delay and collision minimization. IEEE Trans. Wirel. Commun. 23, 7624–7637. doi:10.1109/twc.2023.3342975
Leng, T., Xu, Y., Cui, G., and Wang, W. (2021). Caching-aware intelligent handover strategy for LEO satellite networks. Remote Sens. 13, 2230. doi:10.3390/rs13112230
Li, J., Xue, K., Liu, J., and Zhang, Y. (2020a). A user-centric handover scheme for ultra-dense LEO satellite networks. IEEE Wirel. Commun. Lett. 9, 1904–1908. doi:10.1109/lwc.2020.3007818
Li, Y., Zhou, W., and Zhou, S. (2020b). Forecast based handover in an extensible multi-layer LEO mobile satellite system. IEEE Access 8, 42768–42783. doi:10.1109/access.2020.2977831
Liu, S.-H., Liu, C.-T., Chou, W.-H., and Pan, J. (2022). “Evaluation of voice service in LEO communication with 3GPP PUSCH repetition enhancement,” in 2022 asia-pacific signal and information processing association annual summit and conference (APSIPA ASC), Chiang Mai, Thailand, November 07–10, 2022 (Piscataway, NJ: IEEE), 1750–1755.
Liu, Y., Feng, L., Wu, L., Zhang, Z., Dang, J., Zhu, B., et al. (2021). Joint optimization based satellite handover strategy for low earth orbit satellite networks. IET Commun. 15, 1576–1585. doi:10.1049/cmu2.12170
Masoudi, M., Demir, O. T., Zander, J., and Cavdar, C. (2022). Energy-optimal end-to-end network slicing in cloud-based architecture. IEEE Open J. Commun. Soc. 3, 574–592. doi:10.1109/ojcoms.2022.3162116
Masoudi, M., Lisi, S. S., and Cavdar, C. (2020). Cost-effective migration toward virtualized C-RAN with scalable fronthaul design. IEEE Syst. J. 14, 5100–5110. doi:10.1109/jsyst.2020.2982428
O-RAN Alliance (2021). Control, user and synchronization plane specification. O-RAN Alliance, Technical Specification TS O-RAN.WG4.CUS.0-v07.00.
Papapetrou, E., Karapantazis, S., Dimitriadis, G., and Pavlidou, F.-N. (2004). Satellite handover techniques for LEO networks. Int. J. Satell. Commun. Netw. 22, 231–245. doi:10.1002/sat.783
Pérez-Romero, J., Sallent, O., Gelonch, A., Gelabert, X., Klaiqi, B., Kahn, M., et al. (2023). A tutorial on the characterisation and modelling of low layer functional splits for flexible radio access networks in 5G and beyond. IEEE Commun. Surv. Tutorials. doi:10.1109/COMST.2023.3296821
Rehman, T., Khan, F., Khan, S., and Ali, A. (2017). Optimizing satellite handover rate using particle swarm optimization (PSO) algorithm. J. Appl. Emerg. Sci. 7, pp53–63.doi:10.36785/jaes.71216
Rihan, M., Düe, T., Vakilifard, M., Wübben, D., and Dekorsy, A. (2023). “RAN functional split options for integrated terrestrial and non-terrestrial 6G networks,” in International Japan-africa conference on electronics, communications, and computations, 152–158.
Saarnisaari, H., and de Lima, C. M. (2019). “5G NR over satellite links: evaluation of synchronization and random access processes,” in 2019 21st international conference on transparent optical networks (ICTON), Angers, France, July 09–13, 2019 (Piscataway, NJ: IEEE), 1–4.
Saarnisaari, H., Laiyemo, A. O., and de Lima, C. H. M. (2019). “Random access process analysis of 5G new radio based satellite links,” in 2019 IEEE 2nd 5G world Forum (5GWF), Dresden, Germany, September 30–October 02, 2019 (Piscataway, NJ: IEEE), 654–658.
Satellite Map (2024). Simulation of Starlink constellation and ground Stations deployment. Available online at: https://satellitemap.space/ (Accessed February 14, 2025).
Seeram, S. S. S. G., Feltrin, L., Ozger, M., Zhang, S., and Cavdar, C. (2024). “Feasibility study of function splits in RAN architectures with LEO satellites,” in 2024 Joint European Conference on Networks and Communications & 6G Summit (EuCNC/6G Summit), Antwerp, Belgium, June 03–06 2024 (Piscataway, NJ: IEEE), 1–6.
Seeram, S. S. S. G., Feltrin, L., Ozger, M., Zhang, S., and Cavdar, C. (2025). Handover delay minimization in non-terrestrial networks: impact of Open RAN functional splits 1–8. doi:10.1109/asms/spsc64465.2025.10946034
Small Cell Forum (2016). Small cell virtualization functional splits and use cases, Release 7.0. Dursley, United Kingdom: Small cell Forum. Tech. Rep.
Voicu, A. M., Bhattacharya, A., and Petrova, M. (2024). Handover strategies for emerging LEO, MEO, and HEO satellite networks. IEEE Access 12, 31523–31537. doi:10.1109/access.2024.3368503
Wang, F., Jiang, D., Wang, Z., Chen, J., and Quek, T. Q. (2022). Seamless handover in LEO based non-terrestrial networks: service continuity and optimization. IEEE Trans. Commun. 71, 1008–1023. doi:10.1109/tcomm.2022.3229014
Wang, J., Mu, W., Liu, Y., Guo, L., Zhang, S., and Gui, G. (2021). “Deep reinforcement learning-based satellite handover scheme for satellite communications,” in 2021 13th international conference on wireless communications and signal processing (WCSP), 1–6.
Wang, X., Alabbasi, A., and Cavdar, C. (2017a). “Interplay of energy and bandwidth consumption in CRAN with optimal function split,” in 2017 IEEE international conference on communications (ICC) (Piscataway, NJ: IEEE), 1–6.
Wang, X., Wang, L., Elayoubi, S. E., Conte, A., Mukherjee, B., and Cavdar, C. (2017b). “Centralize or distribute? A techno-economic study to design a low-cost cloud radio access network,” in 2017 IEEE international conference on communications (ICC), Paris, France, May 21–25, 2017 (Piscataway, NJ: IEEE), 1–7.
Wani, M. S., Kretschmer, M., Schröder, B., Grebe, A., and Rademacher, M. (2024). Open RAN: a concise overview. IEEE Open J. Commun. Soc., 1. doi:10.1109/OJCOMS.2024.3430823
Yang, B., Wu, Y., Chu, X., and Song, G. (2016). Seamless handover in software-defined satellite networking. IEEE Commun. Lett. 20, 1768–1771. doi:10.1109/lcomm.2016.2585482
Keywords: open radio access network, non-terrestrial network, functional split, conditional handover, low Earth orbit satellite, regenerative architecture
Citation: Seeram SSSG, Feltrin L, Ozger M, Zhang S and Cavdar C (2025) Handover challenges in disaggregated open RAN for LEO Satellites: tradeoff between handover delay and onboard processing. Front. Space Technol. 6:1580005. doi: 10.3389/frspt.2025.1580005
Received: 19 February 2025; Accepted: 24 April 2025;
Published: 20 June 2025.
Edited by:
Lexi Xu, China United Network Communications Group, ChinaCopyright © 2025 Seeram, Feltrin, Ozger, Zhang and Cavdar. This is an open-access article distributed under the terms of the Creative Commons Attribution License (CC BY). The use, distribution or reproduction in other forums is permitted, provided the original author(s) and the copyright owner(s) are credited and that the original publication in this journal is cited, in accordance with accepted academic practice. No use, distribution or reproduction is permitted which does not comply with these terms.
*Correspondence: Siva Satya Sri Ganesh Seeram, c3NzZ3NlQGt0aC5zZQ==