 Linlin Li
 Xu Wang1,2
 Junyi Chai
 Xiaoqian Wang
 Adrian Buganza-Tepole
 David M. Umulis
- 1Weldon School of Biomedical Engineering, Purdue University, West Lafayette, IN, United States
- 2Guangzhou Lab, Guangzhou, China
- 3Department of Electrical and Computer Engineering, Purdue University, West Lafayette, IN, United States
- 4Department of Mechanical Engineering, Purdue University, West Lafayette, IN, United States
- 5Department of Agricultural and Biological Engineering, Purdue University, West Lafayette, IN, United States
Embryonic development is a complex phenomenon that integrates genetic regulation and biomechanical cellular behaviors. However, the relative influence of these factors on spatiotemporal morphogen distributions is not well understood. Bone Morphogenetic Proteins (BMPs) are the primary morphogens guiding the dorsal-ventral (DV) patterning of the early zebrafish embryo, and BMP signaling is regulated by a network of extracellular and intracellular factors that impact the range and signaling of BMP ligands. Recent advances in understanding the mechanism of pattern formation support a source-sink mechanism, however, it is not clear how the source-sink mechanism shapes the morphogen patterns in three-dimensional (3D) space, nor how sensitive the pattern is to biophysical rates and boundary conditions along both the anteroposterior (AP) and DV axes of the embryo, nor how the patterns are controlled over time. Throughout blastulation and gastrulation, major cell movement, known as epiboly, happens along with the BMP-mediated DV patterning. The layer of epithelial cells begins to thin as they spread toward the vegetal pole of the embryo until it has completely engulfed the yolk cell. This dynamic domain may influence the distributions of BMP network members through advection. We developed a Finite Element Model (FEM) that incorporates all stages of zebrafish embryonic development data and solves the advection-diffusion-reaction Partial Differential Equations (PDE) in a growing domain. We use the model to investigate mechanisms in underlying BMP-driven DV patterning during epiboly. Solving the PDE is computationally expensive for parameter exploration. To overcome this obstacle, we developed a Neural Network (NN) metamodel of the 3D embryo that is accurate and fast and provided a nonlinear map between high-dimensional input and output that replaces the direct numerical simulation of the PDEs. From the modeling and acceleration by the NN metamodels, we identified the impact of advection on patterning and the influence of the dynamic expression level of regulators on the BMP signaling network.
Introduction
Morphogens are signaling molecules that form a spatial pattern over a field of cells or tissue, often as the result of the interplay of reaction and transport processes (Lander et al., 2002) (Umulis and Othmer, 2015). In zebrafish, patterns of gene expression along the dorsal-ventral (DV) body axis are regulated by Bone Morphogenetic Proteins (BMPs), a member of the TGF-β super-family of signaling molecules (Tucker et al., 2008). In early embryonic development, BMP signaling patterns DV axis formation in both invertebrates and vertebrates (De Robertis and Sasai, 1996; Holley and Ferguson, 1997). Different molecules regulate the BMP signaling network by enhancing, lessening, or refining the level of BMP signaling at multiple levels (Wang et al., 2014). Most BMP signaling inhibitors act by directly binding BMP ligands to prevent them from binding their receptors, including Chordin (Chd), Noggin (Nog), Crossveinless2, Follistatin, Sizzled, and Twisted gastrulation. (Dal-Pra et al., 2006; Dutko and Mullins, 2011; Khokha et al., 2005; Umulis et al., 2009; Wagner et al., 2010; Little and Mullins, 2006; Tuazon and Mullins, 2015; Umulis et al., 2009; Madamanchi et al., 2021). On the other hand, Chordin can be cleaved by the metalloproteases Tolloid and BMP1a, releasing Chordin-bound BMP ligand and allowing it to bind receptors and signals (Blader et al., 1997; Piccolo et al., 1997). On the cell membrane, BMP signaling is propagated by the binding of BMP dimers to Type I and II (serine/threonine kinase) receptors form higher order tetrameric complexes and phosphorylate intracellular Smads (Smad5 in zebrafish) (Karim et al., 2021). Phosphorylated -Smad (P-Smad) accumulates in the nucleus and regulates differential gene expression. (von Bubnoff and Cho, 2001).
In our previous work, we developed data-based 1D and 3D finite-difference models to investigate the mechanisms of BMP-mediated DV patterning in blastula embryos to early gastrula embryos at 5.7 h post-fertilization (hpf) before the initiation of BMP-mediated feedback (Zinski et al., 2017; Li et al., 2020). However, the BMP signaling plays a crucial role in patterning the ventral cell fate through gastrulation, where the regions of the embryo over which BMP is patterning are rapidly changing as the cells stream and converge (Figure 1A). Throughout blastulation and gastrulation, major cell movement, known as epiboly, happens along with the BMP-mediated DV patterning (Figure 1A). This dynamic domain may influence the distributions of BMP network members. During epiboly, the regions of the embryo where BMP is patterning are rapidly changing as the cells stream and converge during gastrulation. Cell flow may contribute to morphogen dispersion through active transport, where we consider the influence of advection on reaction-diffusion dynamics. One of the core questions we want to answer through this study is how the cell movement during epiboly affects the BMP gradient formation. This project aims to investigate the multiscale regulatory network of the BMP signaling dynamics along with the biophysical deformation of the embryo tissue during epiboly. Recent advances in understanding the mechanism of pattern formation support a source-sink mechanism (Tuazon et al., 2020; Zinski et al., 2017), however, it is not clear how the source-sink mechanism shapes patterns in 3D, nor how sensitive the pattern is to biophysical rates and boundary conditions along both the anteroposterior (AP) and DV axes of the embryo.
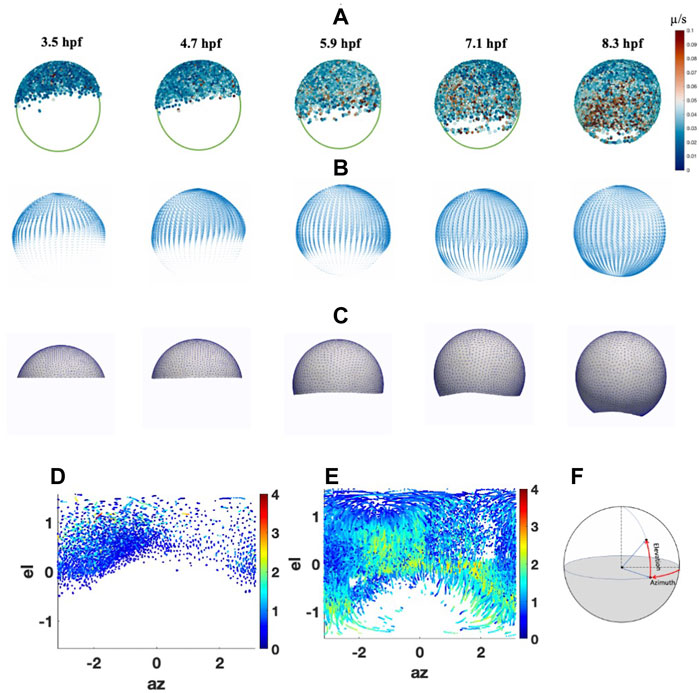
FIGURE 1. Cell migrations and Peclet Number during epiboly. (A) Cell movement on animal-vegetal direction. Color scale indicates the instantaneous velocity at corresponding stage. (B) Smoothed velocity map during epiboly, (C) FEM mesh growth during epiboly (D) Cell distribution and traces with Péclet number (color bar) at 5.3 hpf on spherical coordinate. (E) Cell distribution and traces with Péclet number (color bar) at 9 hpf on spherical coordinate. (F) Spherical coordinate used in the system el: Elevation angle, az: Azimuth angle.
In this study, we present a 3D growing domain PDE-based modeling framework to simulate the BMP patterning and epiboly process during the blastula to gastrula stages of zebrafish development. These models provide a framework to elucidate how different mechanisms and components work together in 3D to create and maintain the BMP gradient in the zebrafish embryo. We are interested in how the cellular movements impact the formation of gradients by contributing an advective term whereby the morphogens are swept with the moving cells as they move vegetally. To model the complex process of the BMP patterning process during epiboly, we combined a variety of data and technology into our modeling system. Dynamic cell imaging data are used to quantify the cell movement during epiboly (Keller et al., 2008). We evaluated the accuracy of the mesh updating compared to the advection caused by cell movement and its role in embryonic patterning. Quantitative whole-mount RNA scope data of bmp2b, chordin, noggin, sizzled, and phosphorylated-SMAD data are collected and analyzed precisely to test the hypotheses of the gradient formation mechanism in our model.
Mechanism-based PDEs of biological signaling networks involve many coupled variables through nonlinear relations and many parameters. The type of nonlinear PDEs appearing in morphogenesis and pattern formation have to be solved numerically with methods such as the finite difference method or the finite element method. Because of the high dimensionality of the input parameters specifying the PDEs, parameter calibration through random search involves running millions of PDE simulations (Zinski et al., 2017). Even with the unrealistic assumption that a single PDE evaluation takes on the order of seconds, the computational cost for the calibration task quickly adds up to weeks or longer. Model calibration often requires the screening of a massive parameter space due to the complexity of the system and the limitations of experimental evidence, thus solving PDE models can be a computationally intensive task. We present a novel approach to using NN surrogate models to accelerate the computationally intensive PDE simulations. Our goal is to develop a complete advection-diffusion-reaction model that incorporates all stages of zebrafish embryonic development data. By combining the biophysics of epiboly with the regulatory dynamics of the BMP network, we can test complex models to investigate the consistent spatiotemporal DV patterning in the early zebrafish embryo.
Method and results
Cell movement during epiboly
To estimate the potential role of advection in shaping the BMP gradient in early development, we analyzed the cell movement trend and the significance of advective transport during epiboly through cell migration trace data from 3.5 to 9.6hpf has been collected by Keller et al. (2008) (Figure 1A). To ignore the individual differences in embryo shape, we consider the embryo as a spherical shape. Individual cell traces have been mapped to the standard sphere and fitted to a smooth parametric function to extract the overall trend of the cell movement during epiboly. We then calculated the cell movement along with the azimuth and elevation directions through spherical coordinates and found that the average velocity in the elevation direction is much higher than the velocity in the azimuth direction. This indicates that the majority of cells move directly from the animal pole toward the vegetal with some dorsal stream only after 50% epiboly. We also found that before 30% epiboly the cells close to the animal pole are more likely to move randomly. After 40% epiboly and with the start of gastrulation, the cell velocity has a dramatic increase, and most of the cells are moving straight toward the vegetal pole. Also, after 50% epiboly, the cell movement polarized while DV patterning is ongoing. In particular, the cells in the dorsal region move relatively faster than the cells located in the ventral region, leading to a closed point of epiboly that does not locate exactly 180° from the animal pole.
To decide whether the advective transport caused by the cell movement or diffusive transport dominates the BMP concentration profile during blastula stages, we estimated the average Péclet number which is a nondimensional measure of how dominant advection is over diffusion and is obtained through Eq. 1, based on the cell tracing data from 3.5 to 9 hpf (Supplementary Material). The diffusion rate of BMP in extracellular space is set to 4.4
The velocity map was calculated based on the average instantaneous cell velocities from the cell traces and created a general cell velocity map (Figure 1B). The map can be read by the FEM mesh and directly guide the mesh movement and drive the movement of the growing domain to closely match the experimental observations and also generate the advective transport of the proteins through our advection-diffusion and reaction model (Figure 1C) (Supplementary Material).
Whole mount embryo expression map
Quantified confocal fluorescent image data of bmp2b mRNA expression can provide the input profile to the BMP source term in the model. To determine the values for the source terms in the model, we imaged the spatial domains for expression of bmp2b, chd, nog, and sizzled mRNA at embryonic stage 4.7 h through the RNAscope method. Figure 2E, illustrates the whole-mount RNAscope image of bmp2b, chordin, and sizzled mRNA at 5.7 hpf. Multiple individual mRNAs can be simultaneously detected by the RNAscope method at the cellular level in whole-mount embryos. bmp2b mRNA started to express since the zygotic stage, showing an obvious gradient pattern higher in the ventral, whereas chd mRNA expressed in the dorsal at 5.7 hpf. We developed an image process framework to quantitively analyze the mRNA expression of different genes in different stages, the averaged expression map (Figures 2A–D) was obtained from 45 individual embryos data from different stages (4.7, 5.7, 6.3 hpf). The expression map was generated based on the relative intensity of individual mRNA levels and the data was normalized between 0 and 1.2 to represent the relative expression level over the embryo. The details of the experimental imaging processes of the RNAscope method can be found in Supplementary Material. We used the range of mRNA expression to represent the protein secretion of different species in the model and the readout of secretion level in the FEM mesh were shown in Figure 2F. The expression level was interpolated between the individual maps of different timepoints, the expression for all the mRNA was set to start at 3hpf. To control the relative level of different mRNA expressions, the expression level was scaled by the individual production rate in the PDEs which was screened in the range of 10–2 to 102 nM/s.
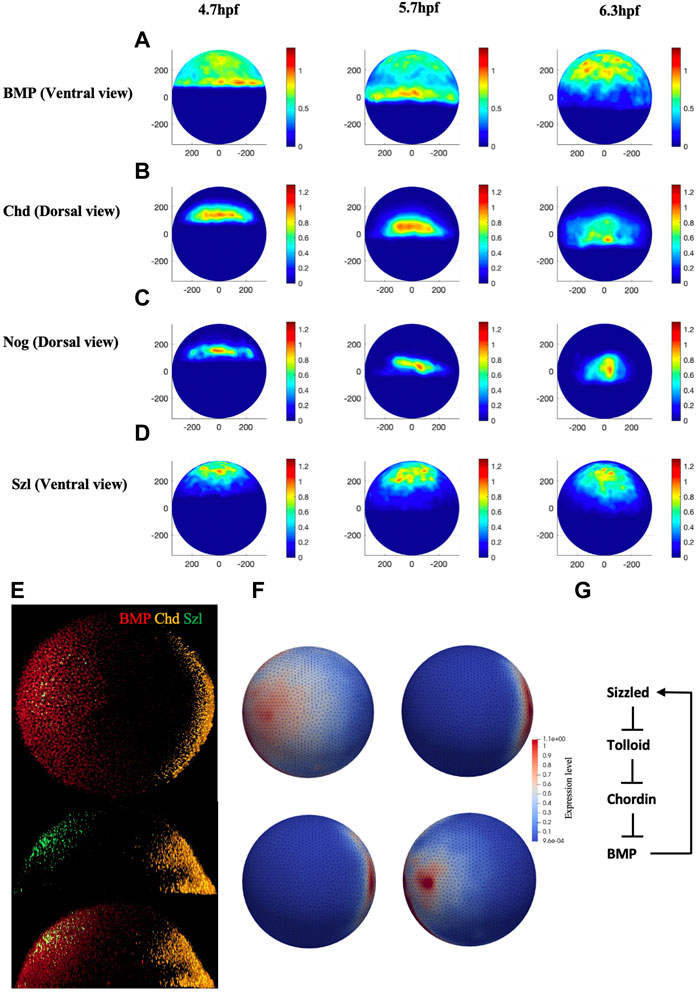
FIGURE 2. (A–D), Normalized mRNA distribution map for BMP, Chd, Nog, and Szl at 4.7, 5.7 and 6.3 hpf. (E) Original whole mount embryo RNAscope image for bmp2b, chordin, and sizzled at 5.7 hpf. (F) Expression map for FEM model for BMP, Chd, Nog and Sizzled at 3 hpf. (G) The extracellular BMP regulators explored in this paper, adapted from (Tuazon et al., 2020).
Growing domain FEM model
Compare to our previous finite difference approach, the coupled PDE system is solved with a mass-conservative growing mesh finite element scheme. To keep the solution of the diffusion-reaction part robust in the presence of extreme deformation, we adopt a library for automatic remeshing of triangular surfaces embedded in 3D space (Brochu and Bridson, 2009). Triangles with small areas or poor aspect ratios can adversely affect collision detection, topological operations, and any boundary-integral-based simulation. To improve the quality of the surface discretization, Brochu, et al. use a few common operations like edge flip, edge split, edge collapse, etc.
Arbitrary Lagrangian-Eulerian (ALE) is a method that allows the mesh to move arbitrarily, with the two limiting cases reducing to the Lagrangian and Eulerian formulations. In the Eulerian-based finite element formulation the computational system is fixed in space, on the other hand, in Lagrangian-based finite element formulation the computational system is attached to the material in a so-called reference configuration such that the geometry can always be tracked to that reference geometry. An ALE mesh is such that the mesh can be moved arbitrarily, relative to either the solid or fluid domains under consideration (Benson, 2013; Iber et al., 2014). Here we discuss the FEM solution for the diffusion-reaction system problem on the fixed mesh at each single time interval. In the case of the advection-diffusion-reaction system problem we consider an ALE formulation
Where.
ϕ is a scalar field denoting the concentration of certain species.
u is the velocity of the fluid.
k is the diffusion coefficient.
f is the source term (include all the expression term and reactions term).
In particular, we consider that the advection term, which is driven by the fluid velocity relative to the mesh, can be removed from Eq. 1 by moving the mesh together with the fluid. Furthermore, the assumption is that the fluid velocity is given by the cell velocity map. Thus, by moving the mesh according to the cell velocity map we can ignore the advection term in Eq. 1.
Then, for time t we have the general form of reaction-diffusion system with,
After solving Eq. 2, the mesh movement driven by the cell velocity map takes care of the advection. This algorithm can be thought of as a staggered solution scheme in which we solve the diffusion and advection sequentially. Coupled continuous partial differential equations (PDEs), in the form of Eq. 2, include diffusion and chemical reactions between secreted components and cellular feedback for cooperative repression activation of feedback targets.
The production of BMP, Chordin, and Noggin was determined by the whole mount embryo expression map from the previous section (Figure 2). Sizzled is a metalloprotease inhibitor that binds the active site of Tolloid to prevent them from cleaving the Chordin and Chordin-BMP complex (Martyn and Schulte-Merker, 2003; Muraoka et al., 2006). To simulate the feedback mechanism for Sizzled at the gastrula stage, we updated the model to explicitly simulate the enzyme saturation kinetics to model Chordin proteolysis by Tolloid and the distinct competitive inhibition of Tolloid by Sizzled (Figure 2G). The governing equation solved through blastula to gastrula stage are listed below:
BMP ligand, Chordin, Noggin, and Sizzled are denoted by B, C, N, and S, and the complexes of BMP-Chordin and BMP-Noggin are denoted by BC and BN, respectively. DX represents the diffusion rate for individual species, we use 4.4
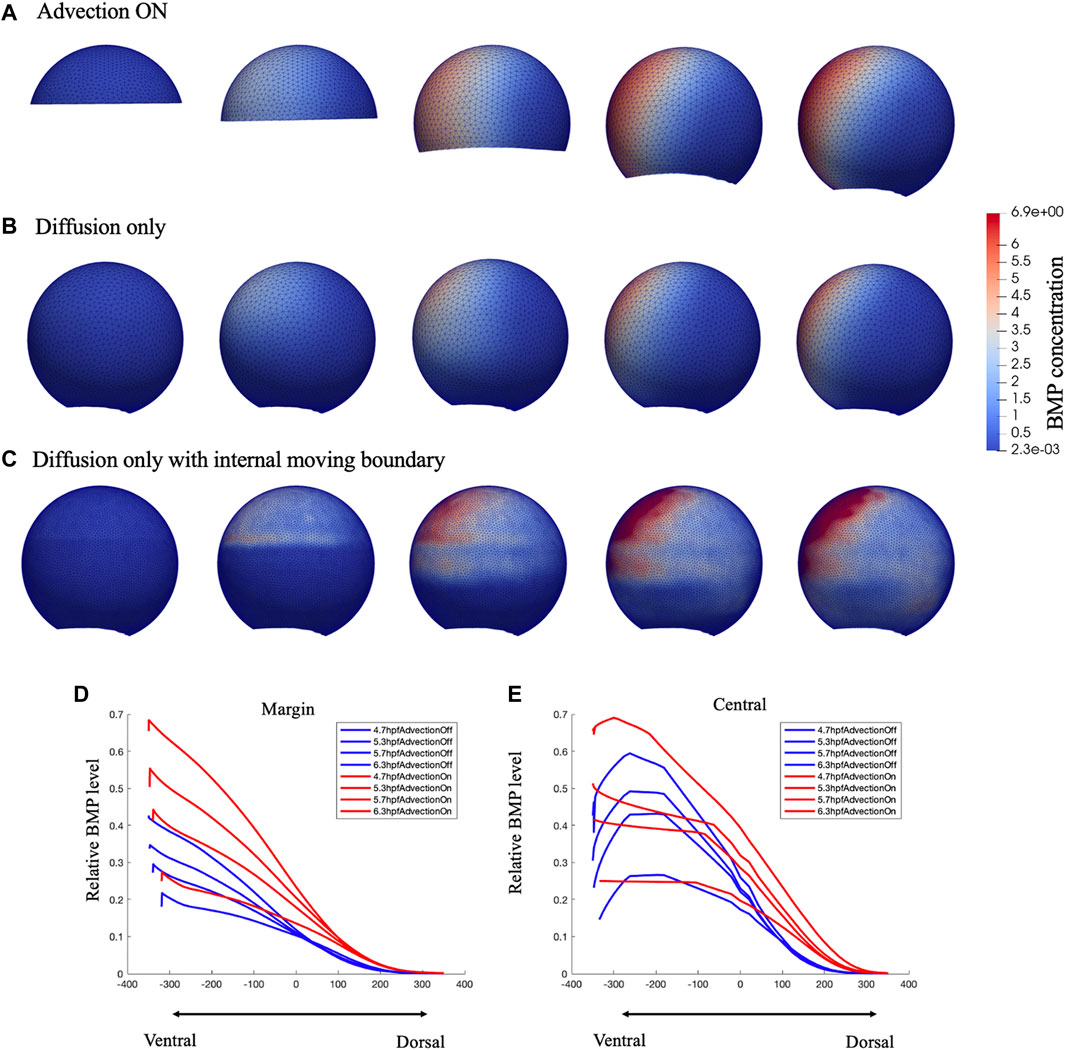
FIGURE 3. Comparison of growing domain advection model (A), fixed domain diffusion only model (B) and Diffusion only with internal moving boundary (C) of BMP concentration profile in 3D lateral view. Figure (C) was plot in a dense mesh since it has difficult to converge under a loose mesh. Comparison of the relative BMP profile on Marginal region (D) and Central (E) region red lines represent the gowning domain simulation result of BMP concentration on marginal region and central region, blue lines represent the fixed domain diffusion only simulation result of BMP concentration on marginal region and central region, for 4.7,5.3,5.7,6.3 hpf.
Firstly, we used a small range parameter screening for the wild-type, Chd LOF (lost of function) and Chd + Sizzled LOF embryo model with 2000 different parameter sets. The parameter ranges keep consistent with the ranges listed in Supplemetary Table S1. We have a total of 21 unknown parameters with a large dimensional parameter space. On the other hand, the 3D models are computationally intensive, thus, we applied Latin Hypercube Sampling (LHS) scheme to sample the parametric space. LHS samples the parametric space with a given number of samplers in an arbitrary number of dimensions, whereby each sample is the only one in each axis-aligned hyperplane containing it. This can ensure that relatively smaller sampling parameter sets can represent the real variability of the parametric space. 8,000+ (including mutants’ case) parameter sets have been tested with the power of the supercomputer cluster at Purdue University. These results are prepared as the training set to the neural network (NN) surrogate model that is introduced later.
Domain change and advection play a role in BMP gradient formation
For testing the contribution of advective transport during epiboly, we examine our model over two types of mesh schemes under the same simulation setting, the growing domain mesh with mesh movement based on cell velocity map as “advection on” model (Figure 3A), the fixed domain mesh (no velocity field applied) (8 hpf) without advection as the “advection off” model (Figure 3B), and the fixed domain without advection but with an internal moving boundary match with the epiboly as the “advection off with internal boundary” model (Figure 3C). As shown in Figure 3, as the input expression profiles and the parameters in the governing equations remain the same, both the growing-domain advection model and the fixed-domain diffusion only model, reaches the similar max level of BMP concentration by the end of the simulation at 8hpf, the total mass is conserved in the system. However, the BMP gradient over the domain has an obvious different profile between these two scenarios. Compare to Figures 3A, B has a clear wider range of BMP concentration; this occurs due to both the domain growth and the active transport in the horizontal direction. For the case where the advection was turned off, we add an internal boundary by turning off the diffusion at the yolk region of the embryo (Figure 3C), without the advection, the BMP will remain high where it is expressed even with the diffusion is still on at the cell region. Figures 3E,F shows that the BMP level on the margin is much lower for the fixed-domain case than the growing domain case while the central profile remains slightly lower but not as low as the margin profile. This is caused by the relatively larger domain for the fixed-domain case at the beginning of the simulation. The same amount of the BMP ligand could diffuse further with a larger domain. Thus, the domain change and the advection that matches the epiboly and cell flow in early development contributed to the formation of the BMP concentration gradient.
Neural network model
Solving PDE models can be a computationally intensive task. In our cases, the PDE models accounting for realistic geometries, more proteins, other physical phenomena, and geometric and constitutive nonlinearities, the brute-force approach is simply infeasible. The individual simulation takes around 5–15 min CPU time, limited computational power restricted the ability to optimize the model in the large parameter space. As mentioned, there are 21 unknown parameters in this specific model, and to optimize the model effectively it may need to run millions of cases to cover the hyperdimensional parameter space. This is impossible even with the supercomputer cluster. Our approach is to approximate the numerical simulation of a PDE system by another, simpler model - a metamodel. Machine learning and data analytics have yielded transformative results across multiple scientific fields due to the explosive growth of available data and computing resources. Here, we apply machine learning methods to accelerate the parametric screening of the advection diffusion model. Training a deep learning algorithm enables us to accurately identify a nonlinear map between high-dimensional input and output data pairs that replaces the direct numerical simulation of the PDEs. Here, we use neural network (NN) proxies to build these metamodels.
To build the neural network (NN) model, we use the 27 parameters (21 unknown parameters with extra parameters indicates of WT and mutant type) as the input and predict the PDE simulated BMP at four stages: 4.7.5.3.5.7.6.3 hpf with the output dimension in total of 2,664. Among the total of 8,471 samples, including WT, Chd LOF (Lost of function) and, Chd + Sizzled LOF, we did a random split of data into 90% for training and 10% for testing, which results in 7,623 samples for training and 848 samples for testing. We repeat the process 3 times and report the average results and standard deviation in the following table. We include a linear regression model as the baseline, and evaluate our model with varying #nodes. The evaluation metric is mean squared error (MSE).
The results in Table 1 show a significant improvement in prediction performance using our NN model. We further conduct a t-test between linear regression and NN (#nodes = 512) and get a p-value of 1.2*10–4, which verifies the improvement of our NN model in the prediction of the 3D sequence of PDE simulated BMP. Furthermore, we report the number of parameters and CPU latency of the comparing models. For NN models, the training/testing error shows a decreasing trend as the size of the model grows, which means a larger NN model has a high capacity to fit the 3D sequence data. Moreover, we observe that the CPU latency increases linearly w.r.t. the number of parameters. All NN models can be trained efficiently in a very short time. It takes 5–15 min in CPU time for a single PDE simulation with our FEM solver, on the other hand, it only takes 1.82 s (CPU) to run 100,000 predictions with our trained NN model which is 10 M times faster compared with PDE simulations. The fast and accurate performance of NN further validates that it is promising to use NN as a metamodel of the 3D embryo to replace the direct numerical simulation of the PDEs. We also include the plot of 3D sequences at four stages from our NN model in the following figure and show that the NN model can very well approximate the PDE simulated BMP (Figure 4B).

TABLE 1. Comparison of 3D sequence prediction between our NN model (with varying #nodes) and the baseline Linear Regression model. Number of parameters shows the size of model (larger number means larger model). Training/testing error are the average ±standard deviation among 3 repetitions with random data split. Lower training/testing error means better performance.
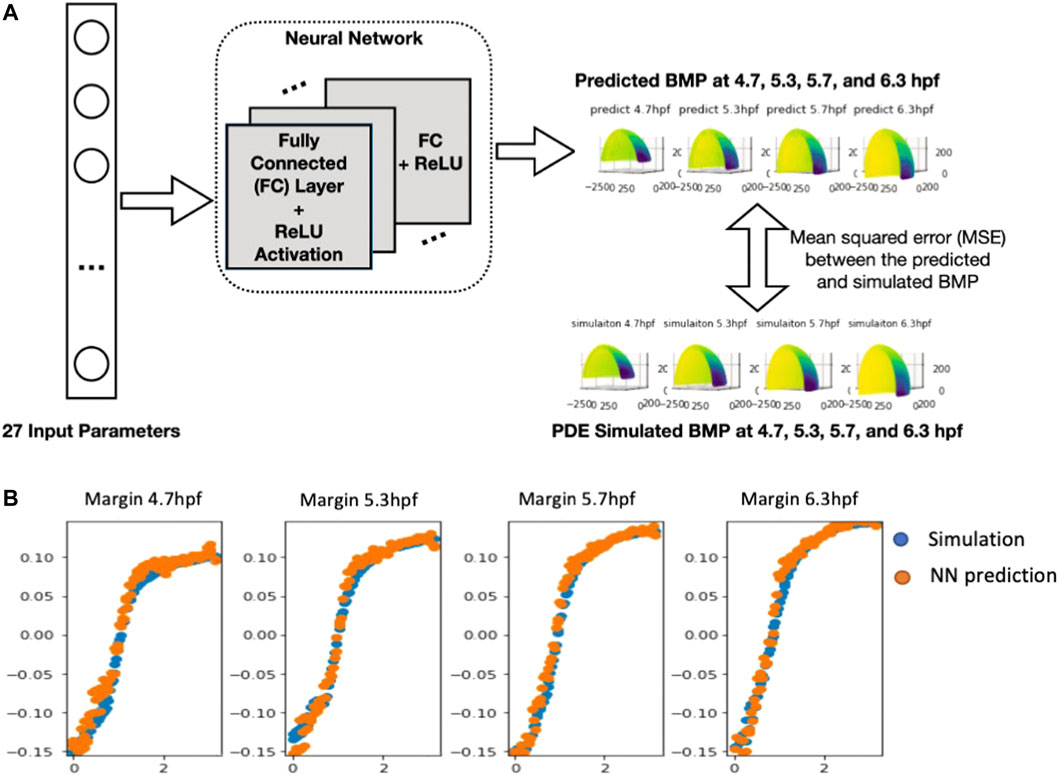
FIGURE 4. (A), Neural network structure of 3D embryo prediction at four stages. The neural network consists of several fully connected layers and is optimized based on the mean squared error between the predicted the simulated BMP value (B), Plot of the NN-predicted BMP and PDE-simulated BMP at Marginal region four stages comparison between simulation results (normalized) and NN prediction results.
Wild type parameter screening
Parameter screening was performed with a trained surrogate model. Latin-hypercube sampling was applied over the 21 unknown parameters with 1,000,000 different parameters set, we only screened the cases with the WT scenario and the BMP distribution results were compared with the P-Smad profile for 4.7, 5.3, 5.7, and, 6.3 hpf, as same as the PDE simulation results analyzing process. This approach accelerates our optimization process over 1 M times.
P-Smad image data that contains specific information on BMP signaling in space and time were quantitatively analyzed with our nuclei segmentation method (Wu et al., 2021; Zinski et al., 2017). The P-Smad data was applied as a scalar for the data-model comparisons against the wild-type signaling profiles. We compared the gradient profile with the normalized P-Smad profile on 4.7, 5.3, 5.7 and, 6.3 hpf for model validation. For direct comparison, BMP simulation results were interpolated on evenly distributed points consisting of experimental P-Smad results. We identified the simulations generating BMP profiles that fit the P-Smad5 gradient at 4.7, 5.3, 5.7, and 6.3 hpf as measured by a low normalized root mean squared deviation (NRMSD) for the WT scenario. The simulated BMP concentration level and measured P-Smad5 profiles are normalized between 0 and 1 to calculate the relative error between each profile for the entire domain (Figure 5C).
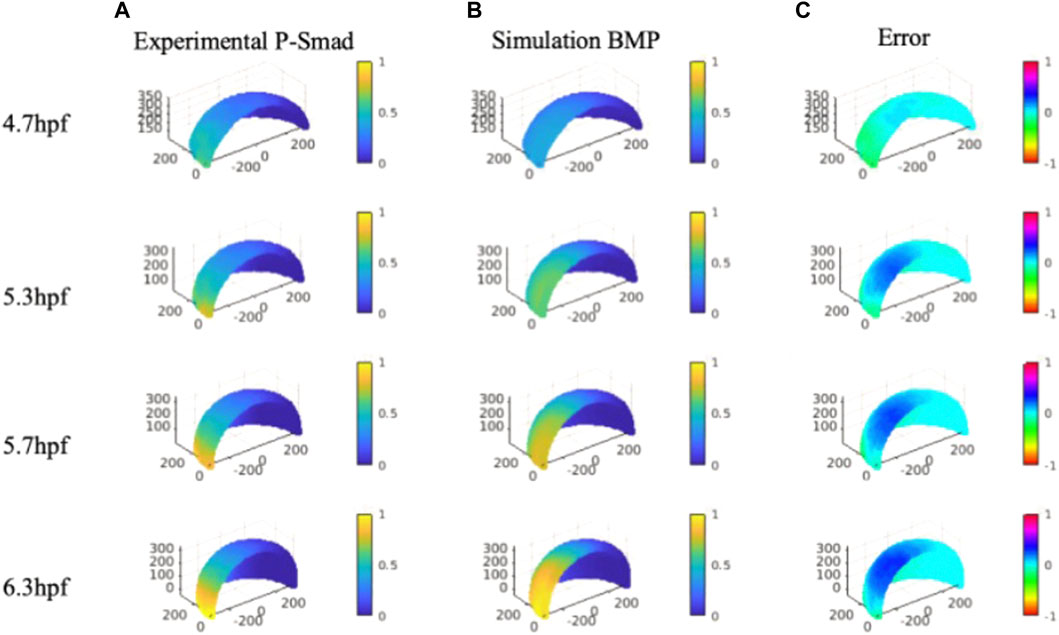
FIGURE 5. Column (A), Averaged and normalized P-Smad5 profile at 4.7, 5.3, and 5.7 hpf and 6.3 hpf. Column (B), Normalized simulation result of a wild type case 4.7, 5.3, and 5.7 hpf and 6.3 hpf. Column (C), Relative differences between simulation results and P-Smad5 level. Positive error indicates the experimental data are higher than simulation results, negative error indicates the experimental data are lower than simulation results.
We verified the NN predicted results with the original FEM simulation with the best fitted parameter set. Contrary to expectations, we were not able to find a best-fitted parameter along with all the sample points over the 3D simulation domain for all the specific stages we are testing. As shown in Figure 5, we found that many cases of the simulation results show good fits with P-Smad distribution on the marginal region and have a consistent relative maximum BMP level overlapped with the P-Smad5 profile at all four stages. However, the larger errors happen in the ventral-animal region for all the relatively better fitting results. We examined the reason that caused the high BMP level in the ventral-animal region in our model, and we found that the input expression map of BMP in 6.3 hpf has a relatively higher expression level in the ventral-animal region than the margin region. This is different from 5.7 hpf which has higher BMP in marginal region. This could be caused by the experimental limitations with our confocal imaging and the limits of imaging due to the geometry and size of the embryo. We image the whole mount embryo with the animal to vegetal position, the laser power drop-off as the laser scans deeper in the z-stack, also, with the spherical shape of the embryo, the thickness of the tissue that the laser needs to get through is much thicker at the marginal region. We then collected a lateral view in the bmp2b expression at the margin only, it shows that the margin has strong bmp expression. So, it is possible that our incorrect bmp2b expression map led to a high BMP in the ventral animal region. In this case, we tested a possible expression map that might reveal the real expression level, we found that with a higher margin expression level of BMP, we can find a parameter set that fits better than our current best-fitting model (Supplementary Material).
Discussion
We introduced our newly developed framework with a 3D growing domain finite element model combined with an NN surrogate model to simulate the BMP regulation network in the early zebrafish embryo. Compared to our earlier approach (Zinski et al., 2017; Li et al., 2020; Tuazon et al., 2020), this model included cell advective transport due to the large cell migration during epiboly in addition to the diffusion-reaction system. We are interested in how the cellular movements impact the formation of gradients by contributing an advective term whereby the morphogens are swept with the moving cells as they move vegetally. To test the contribution of advection, we first gathered dynamic cell imaging data from (Keller et al., 2008) and post-processed the data to quantify the cell movement during epiboly. Additionally, we performed quantitative whole-mount RNAscope imaging to get data of bmp2b, chordin, noggin, sizzled, and P-Smad. We tested how the cell movement driven advection contributes to the BMP gradient formation during epiboly. The results show strong evidence that advection contributes to the formation of the BMP gradient, and it should not be ignored when modeling this system. This is in contrast with earlier work in the field which has largely ignored advection and focused on reaction-diffusion systems on fixed domains. Indeed, our non-dimensional analysis in Figure 1 already showed that based on the Péclet number, calculations based on the cell speeds and known diffusion rates for BMP, diffusion might be dominant prior to 50% epiboly, but advection becomes significant after 50% epiboly. Our moving domain FE framework can be further improved to include more realistic shapes and individual cell movement, yet, even with the simplifying assumptions, it constitutes a necessary step in the modeling of zebrafish embryo patterning due to its ability to account for the competing roles of advection and diffusion.
We also present a novel approach to the Neural Network model to accelerate the computationally intensive 3D PDE simulations. This surrogate model can obtain high accuracy resulting in a condensed time that is 1 M times faster than our FEM PDE solver. This framework works requires a certain amount of simulation results to perform the training for NN. Machine learning and in particular neural networks have emerged as powerful tools in biophysics to discover patterns from data, perform optimization, and accelerate computationally expensive physics solvers (Peng et al., 2020). Our previous work in this regard already showed the ability of long short-term memory (LSTM) a special type of neural network model specifically designed to work with sequential data which allowed it to capture accurately the dynamics of 1D reaction-diffusion systems (Burzawa et al., 2020). In this work we leverage the multilayer perceptron (MLP) type of neural network due to the output data was on a spherical domain that does not maintain the sequential feature.
With the help of the NN surrogate model, we screened the unknown parameter space for WT embryos in processible parameter sets by using LHS sampling and the NN surrogate model. The current WT screening result matches the P-Smad data on the animal region and is highly correlated to the mRNA expression map obtained through whole-mount RNA scope data through confocal microscopy. As the collection of late-stage embryo data through confocal imaging data was limited as epiboly proceeds, we could find the best fitting parameter set in our model reflected the spatiotemporal P-Smad level changes. However, the fit was not perfect. We showed that laser drop-off might be contributing to inaccuracies in the expression map, and with this hypothesis we showed that a possible expression map with a stronger activation at the margin, supported by our observations, can lead to better fits of the P-Smad profile over the entire embryo (see Supplementary Material). Thus, by combining the biophysics of epiboly with the regulatory dynamics of the BMP network, our current 3D growing domain model provides a framework for testing multiscale data-driven questions during zebrafish epiboly that have been out of reach with previous modeling efforts (Warga and Kimmel, 1990; Campinho et al., 2013; Hernández-Vega et al., 2016).
There has been an emerging effort to combine mathematical multiscale modeling with machine learning models. Our study in applying the NN model to accelerate the parameter identification in PDE based model can improve the ability in massive search with high dimensional parameter space. This approach can further help us answer more remaining questions in the field, for instance, how the morphogen gradients scale within individual embryos as the size of the tissues and organisms are growing, and furthermore to improve multi-objective optimization approaches which can aid in evaluating competing mechanistic models of BMP gradient formation and deciphering the common principles between different species. In addition, this method can be widely applied in different fields of that require that require a highly dimensional parameter optimization.
Data availability statement
The original contributions presented in the study are publicly available by the authors, FEM model and NN model code are available on GitHub: https://github.com/linlinli12/FEM_NN_3D_zebrafish.
Ethics statement
The animal protocol was reviewed and approved by Purdue Animal Care and Use Commitee, Protocal# 1501001180.
Author contributions
LL and DU planned the study. XuW performed the RNAscope experiments. LL and AB-T designed the FEM model. JC and XiW performed the NN model validation. LL analyzed the result.
Funding
This work is based upon efforts supported by the EMBRIO Institute, contract #2120200, a National Science Foundation (NSF) Biology Integration Institute. This research was also supported in part by the NIH grants R01GM132501 awarded to DU.
Conflict of interest
The authors declare that the research was conducted in the absence of any commercial or financial relationships that could be construed as a potential conflict of interest.
Publisher’s note
All claims expressed in this article are solely those of the authors and do not necessarily represent those of their affiliated organizations, or those of the publisher, the editors and the reviewers. Any product that may be evaluated in this article, or claim that may be made by its manufacturer, is not guaranteed or endorsed by the publisher.
Supplementary material
The Supplementary Material for this article can be found online at: https://www.frontiersin.org/articles/10.3389/fsysb.2022.983372/full#supplementary-material
References
Benson, D. J. (2013). Introduction to arbitrary Lagrangian-eulerian in finite element methods. Arbitrary Lagrangian-Eulerian Fluid-Structure Interact. 57, 1–50. doi:10.1002/9781118557884.ch1
Blader, P., Rastegar, S., Fischer, N., and Strähle, U. (1997). Cleavage of the BMP-4 antagonist chordin by zebrafish tolloid. Science 278 (5345), 1937–1940. doi:10.1126/science.278.5345.1937
Brochu, T., and Bridson, R. (2009). Robust topological operations for dynamic explicit surfaces. SIAM J. Sci. Comput. 31 (4), 2472–2493. doi:10.1137/080737617
Burzawa, L., Li, L., Wang, X., Buganza-Tepole, A., and Umulis, D. M. (2020). Acceleration of PDE-based biological simulation through the development of neural network metamodels. Curr. Pathobiol. Rep. 8 (4), 121–131. doi:10.1007/s40139-020-00216-8
Campinho, P., Behrndt, M., Ranft, J., Risler, T., Minc, N., and Heisenberg, C.-P. (2013). Tension-oriented cell divisions limit anisotropic tissue tension in epithelial spreading during zebrafish epiboly. Nat. Cell Biol. 15 (12), 1405–1414. doi:10.1038/ncb2869
Dal-Pra, S., Fürthauer, M., Van-Celst, J., Thisse, B., and Thisse, C. (2006). Noggin1 and Follistatin-like2 function redundantly to Chordin to antagonize BMP activity. Dev. Biol. 298 (2), 514–526. doi:10.1016/j.ydbio.2006.07.002
De Robertis, E. M., and Sasai, Y. (1996). A common plan for dorsoventral patterning in Bilateria. Nature 380 (6569), 37–40. doi:10.1038/380037a0
Dutko, J. A., and Mullins, M. C. (2011). SnapShot: BMP signaling in development. Cell 145 (4), 636, 636.e1-2–636. doi:10.1016/j.cell.2011.05.001
Hernández-Vega, A., Marsal, M., Pouille, P., Tosi, S., Colombelli, J., Luque, T., et al. (2016). Polarized cortical tension drives zebrafish epiboly movements. EMBO J. 36, 25–41. doi:10.15252/embj.201694264
Holley, S. A., and Ferguson, E. L. (1997). Fish are like flies are like frogs: Conservation of dorsal-ventral patterning mechanisms. Bioessays. 19 (4), 281–284. doi:10.1002/bies.950190404
Iber, D., Tanaka, S., Fried, P., Germann, P., and Menshykau, D. (2014). Simulating tissue morphogenesis and signaling. Methods Mol. Biol. 1, 323–338. doi:10.1007/978-1-4939-1164-6_21
Inomata, H., Shibata, T., Haraguchi, T., and Sasai, Y. (2013). Scaling of dorsal-ventral patterning by embryo size-dependent degradation of spemann’s organizer signals. Cell 153 (6), 1296–1311. doi:10.1016/j.cell.2013.05.004
Karim, M. S., Madamanchi, A., Dutko, J. A., Mullins, M. C., and Umulis, D. M. (2021). Heterodimer-heterotetramer formation mediates enhanced sensor activity in a biophysical model for BMP signaling. PLoS Comput. Biol. 17 (9), e1009422.
Keller, P. J., Schmidt, A. D., Wittbrodt, J., and Stelzer, E. H. K. (2008). Reconstruction of zebrafish early embryonic development by scanned light sheet microscopy. Sci. (New York, N.Y.) 322 (5904), 1065–1069. doi:10.1126/science.1162493
Khokha, M. K., Yeh, J., Grammer, T. C., and Harland, R. M. (2005). Depletion of three BMP antagonists from spemann’s organizer leads to a catastrophic loss of dorsal structures. Dev. Cell 8 (3), 401–411. doi:10.1016/j.devcel.2005.01.013
Lander, A. D., Nie, Q., and Wan, F. Y. M. (2002). Do morphogen gradients arise by diffusion? Dev. Cell 2 (6), 785–796. doi:10.1016/S1534-5807(02)00179-X
Li, L., Wang, X., Mullins, M. C., and Umulis, D. M. (2020). Evaluation of BMP-mediated patterning in a 3D mathematical model of the zebrafish blastula embryo. J. Math. Biol. 80 (1–2), 505–520. doi:10.1007/s00285-019-01449-x
Little, S., and Mullins, M. (2006). Extracellular modulation of BMP activity in patterning the dorsoventral axis. Birth Defects Res. C Embryo Today. 78 (3), 224–242. doi:10.1002/bdrc.20079
Madamanchi, A., Mullins, M. C., and Umulis, D. M. (2021). Diversity and robustness of bone morphogenetic protein pattern formation. Development 148 (7), dev192344.
Martyn, U., and Schulte-Merker, S. (2003). The ventralized ogon mutant phenotype is caused by a mutation in the zebrafish homologue of Sizzled, a secreted Frizzled-related protein. Dev. Biol. 260 (1), 58–67. doi:10.1016/S0012-1606(03)00221-5
Muraoka, O., Shimizu, T., Yabe, T., Nojima, H., Bae, Y.-K., Hashimoto, H., et al. (2006). Sizzled controls dorso-ventral polarity by repressing cleavage of the Chordin protein. Nat. Cell Biol. 8 (4), 329–338. doi:10.1038/ncb1379
Peng, G. C. Y., Alber, M., Buganza Tepole, A., Cannon, W. R., De, S., Dura-Bernal, S., et al. (2020). Multiscale modeling meets machine learning: What can we learn? Arch. Comput. Methods Eng. 28, 1017–1037. doi:10.1007/s11831-020-09405-5
Piccolo, S., Agius, E., Lu, B., Goodman, S., Dale, L., and De Robertis, E. M. (1997). Cleavage of chordin by xolloid metalloprotease suggests a role for proteolytic processing in the regulation of spemann organizer activity. Cell 91 (3), 407–416. doi:10.1016/S0092-8674(00)80424-9
Pomreinke, A. P., Soh, G. H., Rogers, K. W., Bergmann, J. K., Bläßle, A. J., and Müller, P. (2017). Dynamics of BMP signaling and distribution during zebrafish dorsal-ventral patterning. ELife 6, e25861. doi:10.7554/eLife.25861
Tuazon, F., and Mullins, M. (2015). Temporally coordinated signals progressively pattern the anteroposterior and dorsoventral body axes. Semin. Cell Dev. Biol. 42, 118–133. doi:10.1016/j.semcdb.2015.06.003
Tuazon, F. B., Wang, X., Andrade, J. L., Umulis, D., and Mullins, M. C. (2020). Proteolytic restriction of chordin range underlies BMP gradient formation. Cell Rep. 32 (7), 108039. doi:10.1016/j.celrep.2020.108039
Tucker, J. A., Mintzer, K. A., and Mullins, M. C. (2008). The BMP signaling gradient patterns dorsoventral tissues in a temporally progressive manner along the anteroposterior Axis. Dev. Cell 14 (1), 108–119. doi:10.1016/j.devcel.2007.11.004
Umulis, D. M., and Othmer, H. G. (2015). The role of mathematical models in understanding pattern formation in developmental biology. Bull. Math. Biol. 77 (5), 817–845. doi:10.1007/s11538-014-0019-7
Umulis, D., O’Connor, M. B., and Blair, S. S. (2009). The extracellular regulation of bone morphogenetic protein signaling. Dev. Camb. Engl. 136 (22), 3715–3728. doi:10.1242/dev.031534
von Bubnoff, A., and Cho, K. W. Y. (2001). Intracellular BMP signaling regulation in vertebrates: Pathway or network? Dev. Biol. 239 (1), 1–14. doi:10.1006/dbio.2001.0388
Wagner, D. O., Sieber, C., Bhushan, R., Börgermann, J. H., Graf, D., Knaus, P., et al. (2010). BMPs: From bone to body morphogenetic proteins. Sci. Signal. 3 (107), mr1. doi:10.1126/scisignal.3107mr1
Wang, R. N., Green, J., Wang, Z., Deng, Y., Qiao, M., Peabody, M., et al. (2014). Bone Morphogenetic Protein (BMP) signaling in development and human diseases. Genes Dis. 1 (1), 87–105. doi:10.1016/j.gendis.2014.07.005
Warga, R. M., and Kimmel, C. B. (1990). Cell movements during epiboly and gastrulation in zebrafish. Development 108, 569–580. doi:10.1242/dev.108.4.569
Wu, T. C., Wang, X., Li, L., Bu, Y., and Umulis, D. M. (2021). Automatic wavelet-based 3D nuclei segmentation and analysis for multicellular embryo quantification. Sci. Rep. 11 (1), 1–13. doi:10.1038/s41598-021-88966-2
Keywords: bone morphogenetic proteins (BMP), zebrafish, finite element method, FEM, growing domain model, neural network model
Citation: Li L, Wang X, Chai J, Wang X, Buganza-Tepole A and Umulis DM (2022) Determining the role of advection in patterning by bone morphogenetic proteins through neural network model-based acceleration of a 3D finite element model of the zebrafish embryo. Front. Syst. Biol. 2:983372. doi: 10.3389/fsysb.2022.983372
Received: 30 June 2022; Accepted: 09 August 2022;
Published: 03 October 2022.
Edited by:
Yoram Vodovotz, University of Pittsburgh, United StatesReviewed by:
Nathan Weinstein, National Autonomous University of Mexico, MexicoLuis Diambra, National University of La Plata, Argentina
Copyright © 2022 Li, Wang, Chai, Wang, Buganza-Tepole and Umulis. This is an open-access article distributed under the terms of the Creative Commons Attribution License (CC BY). The use, distribution or reproduction in other forums is permitted, provided the original author(s) and the copyright owner(s) are credited and that the original publication in this journal is cited, in accordance with accepted academic practice. No use, distribution or reproduction is permitted which does not comply with these terms.
*Correspondence: David M. Umulis, ZHVtdWxpc0BwdXJkdWUuZWR1